

Abstract
Background
Sensory perception is profoundly shaped by attention. Attending to an odor strongly regulates if and how it is perceived – yet the brain systems involved in this process are unknown. Here we report integration of the medial prefrontal cortex (mPFC), a collection of brain regions integral to attention, with the olfactory system in the context of selective attention to odors.
Methods
First, we used tracing methods to establish the tubular striatum (TuS, also known as the olfactory tubercle) as the primary olfactory region to receive direct mPFC input in rats. Next, we recorded (i) local field potentials from the olfactory bulb (OB), mPFC, and TuS, or (ii) sniffing, while rats completed an olfactory selective attention task.
Results
Gamma power and coupling of gamma oscillations with theta phase were consistently high as rats flexibly switched their attention to odors. Beta and theta synchrony between mPFC and olfactory regions were elevated as rats switched their attention to odors. Finally, we found that sniffing was consistent despite shifting attentional demands, suggesting that the mPFC-OB theta coherence is independent of changes in active sampling.
Conclusions
Together, these findings begin to define an olfactory attention network wherein mPFC activity, as well as that within olfactory regions, are coordinated based upon attentional states.
Keywords: sniffing, olfactory cortex, prefrontal cortex, neural oscillations, active sampling, neural circuits
Introduction
Sensory processing and thus perception are both profoundly shaped by our ever-changing cognitive states. In most cases, the thalamus appears to be a major driver of state-dependent modulation of sensory information (McCormick and Feeser 1990; O’Connor et al. 2002; Wimmer et al. 2015; Halassa and Kastner 2017). For instance, the visual thalamus modulates primary visual cortex in manners that enhance the signal to noise of an attended visual cue (McAlonan et al. 2008). Similarly, the gustatory thalamus regulates taste-evoked responsivity of gustatory cortex neurons (Samuelsen et al. 2013). Among all sensory systems, the olfactory system presents a unique challenge for understanding the influence of cognitive state upon sensory processing. This is because, while humans (Spence et al. 2000; Zelano et al. 2005; Plailly et al. 2008) and rodents (Carlson et al. 2018) alike can selectively attend to odors, the organization of the olfactory system lacks obligatory thalamic processing (Kay and Sherman 2006; Gottfried 2010; Courtiol and Wilson 2016). Thus, other brain systems must engage with olfactory processing in order to afford one the ability to attend to odors. This is a significant issue since odors are most often encountered in highly multisensory environments, for instance during eating, wherein potentially distracting or conflicting cues must be ignored at the expense of selectively attending to odor.
Truly very little is known regarding the neural mechanisms underlying olfactory attention. One brain region that seems likely to confer this ability, at least in part, is the tubular striatum (TuS, also known as the olfactory tubercle; Wesson 2020). This is true in both humans and rodents. For instance, early work using functional magnetic resonance imaging uncovered the first evidence that the human TuS is more activated in response to attended versus unattended odors while human subjects engaged in an olfactory selective attention task (Zelano et al. 2005). Importantly, attention-dependent amplification of odor-evoked activity in the TuS exceeded that of even the primary “piriform” olfactory cortex (PCX) (Zelano et al. 2005). Our group subsequently found that odor-evoked signal to noise among TuS neurons was enhanced as rats engaged in olfactory selective attention. (Carlson et al. 2018). While the TuS is engaged by attention in manners which may subserve the ability to attend to odors, the way that the TuS integrates into a wider brain network in the context of odor-directed attention is unknown. This includes major voids in our understanding of descending inputs from brain regions known to be integral for attention, and how TuS activity is structured relative to that of these regions.
The rodent prefrontal cortex (PFC), depending upon how one chooses to define it (Laubach et al. 2018; Le Merre et al. 2021), comprises several key subregions including but not limited to the medial PFC (mPFC) and the orbitofrontal cortex (OFC), each of which can be divided into more specific subregions. The mPFC is crucial for many executive processes including attention (Birrell and Brown 2000; Miller and Cohen 2001; Wimmer et al. 2015; Kim et al. 2016) and is highly interconnected with the rest of the brain (Le Merre et al. 2021), with particularly dense inputs to sensory and thalamic areas. mPFC neurons are modulated as animals attentively await a stimulus (Rodgers and DeWeese 2014; Kim et al. 2016), and disruptions to the mPFC impair attentional set-shifting (Birrell and Brown 2000; Ragozzino et al. 2003), sustained attention (Kim et al. 2016), and selective attention (Wimmer et al. 2015). mPFC subdivisions include the prelimbic (PrL) and infralimbic (IL) cortices, which seem to possess dissociable behavioral functions (Marquis et al. 2007; Luchicchi et al. 2016; Hardung et al. 2017; de Kloet et al. 2021). Specifically, the PrL appears important for set-shifting and selective attention (Marquis et al. 2007; Rodgers and DeWeese 2014; Kim et al. 2016; Schmitt et al. 2017), while the IL is implicated in behavioral flexibility and extinction (Barker et al. 2014). Therefore, the PrL and IL cortices within the mPFC are putative candidates for influencing olfactory processing via top–down modulation during attentional states.
Local field potential (LFP) oscillations in the gamma band (40–100 Hz) in sensory and prefrontal cortices have been associated with attention (Fries et al. 2001; Borgers et al. 2005; Schroeder and Lakatos 2009a; Vinck et al. 2013). In the olfactory system, increased power of gamma oscillations in the olfactory bulb (OB) is observed during successful discriminations between perceptually demanding odor pairs (Beshel et al. 2007) and learning (Losacco et al. 2020), suggesting that they in some manner aid in cognitively demanding processes. In addition to high frequency oscillations, theta oscillations (2–12 Hz) are profoundly shaped by respiration, including fast investigatory sniffing, in olfactory regions and beyond (Adrian 1942; Macrides et al. 1982; Vanderwolf 1992; Kay and Laurent 1999; Buonviso et al. 2003; Fontanini and Bower 2006; Miura et al. 2012; Colgin 2013; Tort, Ponsel, et al. 2018b; Zhang et al. 2021). Interestingly, theta band coherence is elevated between the OB and mPFC in emotionally salient contexts (Zhong et al. 2017; Moberly et al. 2018; Bagur et al. 2021), indicating functional connectivity between these networks that can be influenced by behavioral state. Examining neural oscillations within individual structures, and their synchrony between structures, can yield valuable insights into the ways that brain regions form functional networks (Buzsaki 2006; Fries 2015). Whether the mPFC and olfactory system networks (either independently or together) are engaged by selective attention to odors has not been explored.
Here, we sought to investigate the anatomical and functional integration of the mPFC with olfactory regions (including the OB and TuS) in the context of selective attention to odors. First, we used cell type-specific tracing methods to reveal that excitatory mPFC neurons preferentially target the TuS compared with other olfactory regions. Next, we used multi-site LFP recordings to demonstrate that the OB, mPFC, and TuS modify their activity in intra- and inter-areal manners during a behavioral task that requires selective attention to odors and intermodal attentional switches. Interestingly, through measuring sniffing as rats engaged in selective attention, we observed that rats covertly display odor-directed attention, maintaining highly stereotyped sniffing structured to the task despite shifting attentional demands. Together, this work adds to our understanding of the organization and activities of brain systems, which are engaged during olfactory attention.
Materials and methods
Animals
Adult, male Long–Evans rats were obtained from Charles River (Wilmington, MA) and Envigo (Indianapolis, IN) and maintained in the University of Florida vivarium on a 12:12 light:dark cycle, with food and water provided ad libitum until water restriction for behavioral shaping began. All experiments were conducted in accordance with NIH guidelines and were approved by the University of Florida Institutional Animal Care and Use Committee.
Surgical procedures
For all surgical procedures, rats were maintained on 1%–4% isoflurane in 1.5 L/min O2 and placed in a stereotaxic frame. The scalp was shaved and cleaned with betadine and 70% ethanol. Analgesia in the form of meloxicam was administered (5 mg/kg s.c.) and the local anesthetic marcaine (5 mg/kg s.c.) was given prior to the cranial incision. A cranial incision was made and the skin was retracted using hemostats.
For viral injections, a craniotomy was then drilled over the region of interest, and a glass micropipette containing adeno-associated virus (AAV) was slowly lowered into region of interest. For anterograde mPFC injections (Fig. 1), 100 nL of a 50/50 mixture of Cre-dependent synaptophysin virus (Ef1α-DIO-Synaptophysin-mRuby in IL; Ef1α-FLEX_Synaptophysin-GFP in PrL; both generous gifts from Dr Marc Fuccillo, University of Pennsylvania) (Herman et al. 2016) and CaMKII-Cre virus (pENN-AAV9-CaMKII-Cre-SV40; Addgene, Watertown, MA; 105558-AAV9, titer 1 × 10¹³ vg/mL) were injected into the IL, then the PrL, at a rate of 2 nL/s. For retrograde mPFC injections (Supplementary Fig. S1), 200 nL total of AAVrg-hSyn-GFP (Addgene 50465-AAVrg; titer 7 × 10¹² vg/mL) was unilaterally injected at a rate or 2 nL/s into the mPFC (100 nL in IL, followed by 100 nL in PrL). For TuS injections, 200 nL of AAVrg-hSyn-GFP (Addgene 50465-AAVrg; titer 7 × 10¹² vg/mL) was injected unilaterally at a rate of 2 nL/s. In all cases, after waiting 5 min, the pipette was slowly withdrawn from the brain, the craniotomy was sealed with dental wax, and the incision was sutured.
Fig. 1.

The prelimbic mPFC and infralimbic mPFC preferentially target the tubular striatum compared to other major olfactory structures. A) The PrL and IL cortices were selectively targeted with 50/50 mixtures of Ef1a-DIO-synaptophysin-GFP/pENN-AAV9-CamKII-Cre-SV40 and Ef1a-FLEX-synaptophysin-mRuby/pENN-AAV9-CamKII-Cre-SV40, respectively. B) Representative mPFC image showing region-specific viral transduction within the same rat. Scale bar 250 μm. C) Representative image of the AON, showing few fluorescent puncta. Cell layers 1–2 and the lateral olfactory tract (lot) are indicated. Scale bar 250 μm. D) Representative image of the PCX and TuS. Note high fluorescence in the medial TuS and low fluorescence in the lateral TuS and PCX. Boxed region is shown in panel E. Scale bar 250 μm. E) Magnified view of boxed region shown in panel (D), showing high levels of fluorescent puncta, indicating synaptic terminals from TuS-projecting mPFC neurons. Scale bar 100 μm. F) Representative image of the OB absent of fluorescent puncta. Dashed lines indicate layers: (i) olfactory nerve layer; (ii) glomerular layer; (iii) external plexiform layer; (iv) mitral cell layer; (v) granule cell layer. Scale bar 250 μm. G) Quantification of fluorescent puncta across olfactory regions, normalized by area of quantified region. PrL: One-way analysis of variance (ANOVA), main effect of regions, F(3,21) = 7.82, P = 0.001. IL: One-way ANOVA, main effect of regions, F(3,12) = 37.08, P < 0.0001. Asterisks indicate results from Tukey’s multiple comparisons test, **P < 0.01, ****P < 0.0001. PrL mTuS versus IL mTuS, unpaired t-test, P = 0.02. H) Quantification of fluorescent puncta across layers in the mTuS. PrL: One-way ANOVA, main effect of layers, F(2,14) = 12.62, P = 0.0007. IL: One-way ANOVA, main effect of layers, F(2,8) = 43.04, P < 0.0001. Asterisks indicate results from Tukey’s multiple comparisons test, *P < 0.05, **P < 0.01, ***P < 0.001, ****P < 0.0001. PrL, prelimbic cortex; IL, infralimbic cortex; Cg1, cingulate area 1; DP, dorsal peduncular cortex; mTuS/lTuS, medial/lateral tubular striatum; PCX, piriform cortex; AON, anterior olfactory nucleus; OB, olfactory bulb; D, dorsal; M medial; L1–L3, layers 1–3. PrL injection, n = 8 rats; IL injection, n = 5 rats. All error bars represent SEM.
For electrode implants, the skull was scrubbed with 3% H2O2 and covered with a thin layer of cyanoacrylate (Vetbond, 3 M). Craniotomies were drilled over each brain area of interest, plus 3 craniotomies for 0–80 stainless steel screws to aid in anchoring the dental cement. After drilling craniotomies over each brain area of interest, the bipolar stainless steel electrodes (0.005-inch outer diameter, Teflon coated to 0.007 inch outer diameter) were lowered into the brain and secured with a small amount of dental cement before moving on to the next electrode. Once all wires were placed and secured, an electrical interface board (EIB) (Open Ephys, Cambridge, MA) fitted with a 32-channel connector (Omnetics, Minneapolis, MN) was lowered over the skull, and the electrode wires were secured to the desired channels using gold pins. After the stainless steel ground wire was secured to a skull screw with conductive silver paint, the whole assembly was secured with dental cement.
For thermocouple implants (Uchida and Mainen 2003; Wesson 2013), following skull preparation as above, a craniotomy was made in the nasal bone (0.9 mm lateral from midline) and a thermocouple wire was lowered 3 mm into the nasal cavity and secured with dental cement. Then, as for the electrode implants, an EIB with a 32-channel Omnetics connector was lowered over the skull, the thermocouple leads secured with gold pins, and a ground wire secured to a skull screw (located at the posterolateral edge of the parietal bone) before the whole assembly was secured with dental cement.
Following surgery, rats were returned to their home cages to recover on a heating blanket. The rats received postoperative analgesia for at least 3 days mixed with a palatable gel (5 mg/kg meloxicam in Medigel, ClearH2O, Westbrook, ME). Electrode-implanted rats were implanted prior to the beginning of behavioral shaping. Thermocouple-implanted rats were shaped prior to surgery and were allowed full water access for at least 24 h prior to surgery. All rats were allowed to recover for at least 5 days before beginning or restarting water restriction.
Perfusion and histology
For anterograde mPFC viral injections (Fig. 1), rats were perfused 2–4 weeks following injection. For retrograde mPFC (Supplementary Fig. S1) and TuS viral injections (Fig. 2), rats were perfused 2 weeks following injection. All rats were overdosed with Fatal-Plus and perfused with cold 0.9% NaCl followed by cold 4% formalin. Brains were dissected and stored in 10% formalin in 30% sucrose prior to sectioning. Alternate 40 μm sections were collected with a sliding microtome and stored in Tris-buffered saline with 0.03% sodium azide. For electrode implanted rats, sections were mounted on gelatin subbed slides and stained with 0.1% cresyl violet to confirm electrode locations.
Fig. 2.
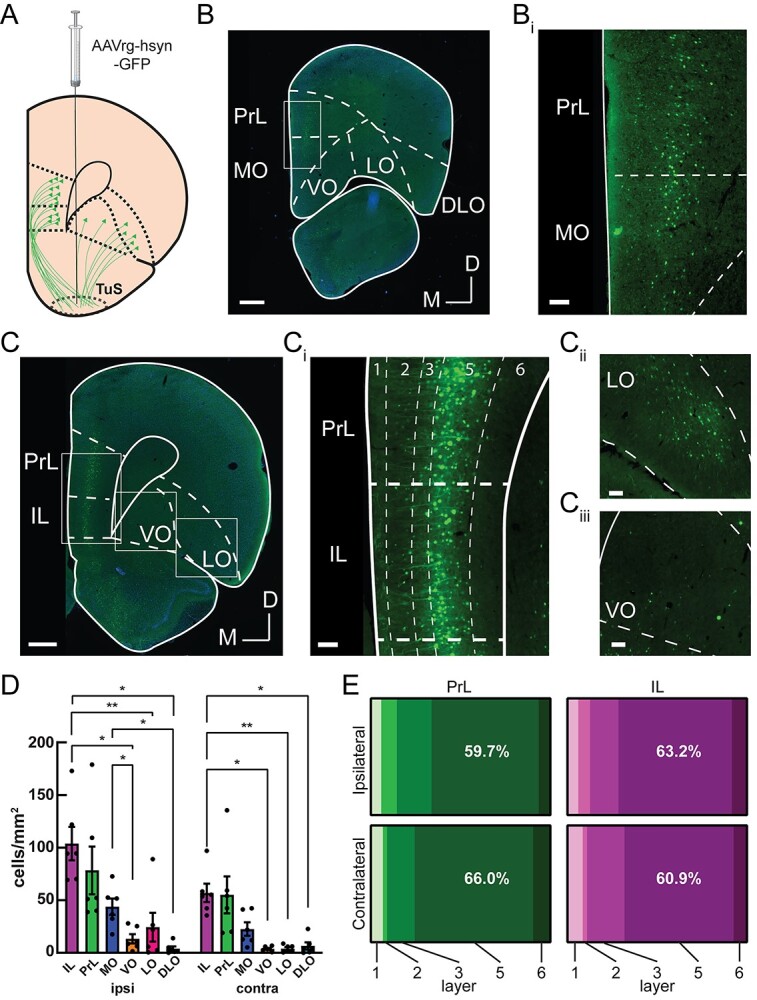
Among prefrontal cortex subregions, layer 5 prelimbic and infralimbic neurons provide the densest input to the tubular striatum. A) The TuS was injected with AAVrg-hsyn-GFP to identify TuS-projecting neurons throughout the prefrontal cortex. B) Representative mPFC image at Bregma +4.2 mm, showing GFP-labeled TuS-projecting neurons. Boxed region is indicated in panel Bi. Scale bar 500 μm. Bi). Magnified view of the boxed region in panel Bi. Scale bar 100 μm. C) Representative PFC image at Bregma +3.2 mm, showing GFP-labeled TuS-projecting neurons. Scale bar 500 μm. Ci) Magnified view of boxed region in panel C showing the PrL and IL cortices. Dotted lines indicate layers. Scale bar 100 μm. Cii) Magnified view of boxed region showing LO cortex. Scale bar 100 μm. Ciii) Magnified view of boxed region showing VO cortex. Scale bar 100 μm. n = 6 rats. D) Quantification of cell numbers across prefrontal cortex regions ipsilateral and contralateral to the injection site. Two-way ANOVA, main effect of hemisphere, F(1, 5) = 18.23, P = 0.0079, main effect of region, F(1.364, 6.818) = 15.74, P = 0.0041. Asterisks indicate results of Tukey’s multiple comparisons test, *P < 0.05, **P < 0.01. Error bars represent SEM. E) Distribution of cell bodies across PrL and IL layers, in both the contralateral and ipsilateral hemispheres, showing the majority of cell bodies are found in layer 5. PrL: Two-way ANOVA, main effect of layer F(1.15, 5.76) = 11.48, P = 0.014. IL: Two-way ANOVA, main effect of layer F(1.32, 6.61) = 42.55, P = 0.0003; main effect of hemisphere F(1,5) = 34.39, P = 0.002. n = 6 rats.
Image acquisition and quantification
Brain areas of interest were identified using the rat brain atlas (Paxinos and Watson 1997). Images were acquired with a Nikon Eclipse Ti2e fluorescent microscope at 20× magnification using a Nikon 16 MP DS-Qi2 monochrome CMOS camera. For all tracing experiments, successful targeting of the desired subregion was confirmed, and injections with spillover into surrounding regions were excluded. For anterograde mPFC injections (Fig. 1), if 1 of the 2 injections was on target, we analyzed only that region and disregarded the other. Overall, we analyzed 8 rats with on-target PrL injections and 5 rats with on-target IL injections, with 3 rats having both PrL and IL quantified. From these rats, images for quantification were acquired as follows: for the TuS, 11 images per rat, evenly spanning 2.7 mm anterior–0.8 mm posterior Bregma. For the PCX, 17 images per rat were quantified, evenly spanning 3.7 mm anterior–4.8 mm posterior Bregma. For the anterior olfactory nucleus (AON), 6 images per rat were quantified, evenly spanning 5.7 mm–2.7 mm anterior Bregma. For retrograde TuS injections (Fig. 2), 3–10 (6.46 ± 2.48) PrL/IL-containing sections and 1–6 (3.9 ± 1.46) OFC-containing sections were imaged (n = 6 rats).
After acquiring images, regions of interest (ROIs) were drawn around each area of interest and fluorescent puncta or cell bodies were detected using semiautomated counting algorithms created within NIS elements software (Nikon) based on their fluorescence intensity and size. Cell or puncta counts were then normalized to the ROI area for comparison across regions. For layer-specific quantification (Fig. 2E), custom MATLAB code was used to determine the layer in which each counted cell resided. The medial and lateral TuS were defined as the medial and lateral third of the TuS, to ensure clear separation between the regions. In puncta quantification, we initially differentiated between the anterior and posterior PCX, which was divided based on the presence or absence, respectively, of the lateral olfactory tract. Because we observed no differences in puncta between the anterior and posterior PCX for PrL (paired, two-tailed t-test, P = 0.32) or IL (paired, two-tailed t-test, P = 0.12), we combined them for the data and analyses shown in Fig. 1.
Olfactory and auditory stimuli
The odors used for all experiments were isopentyl acetate and limonene(−), obtained at their highest available purity (Sigma, St. Louis, MO), and diluted in mineral oil (Sigma) to 0.5 Torr so that they possessed equal vapor pressures. Odors were delivered through independent lines via an air-dilution olfactometer at 2 L/min via a custom 3D printed nose poke port. The auditory stimulus was a 2.5 kHz tone (~70 dB) generated with a piezo speaker (RadioShack, Boston, MA).
Carlson Attention Task
The Carlson Attention Task (CAT; Carlson et al. 2018) is a modified 2-alternative choice task in which rats are simultaneously presented with 1 of 2 olfactory cues (odor A/odor B) and 1 of 2 auditory cues (tone on/tone off). Each behavioral session begins with tone attention, where the tone cues signal the reward location and the odor cues are distractors (Fig. 3A–C, blue shading). Once criterion is reached on the tone attention portion of the task (6 blocks of 20 trials at ≥80% correct), an uncued rule change to odor attention occurs, where the odor cues now signal the reward location and the tone cues are distractors (Fig. 3A–C, orange shading). In the development of the CAT, a tone versus no tone design was chosen in order to avoid the confound of multisensory responses, which have been observed in the TuS, specifically with auditory cues (Wesson and Wilson 2010; Varga and Wesson 2013; Martiros et al. 2021).
Fig. 3.
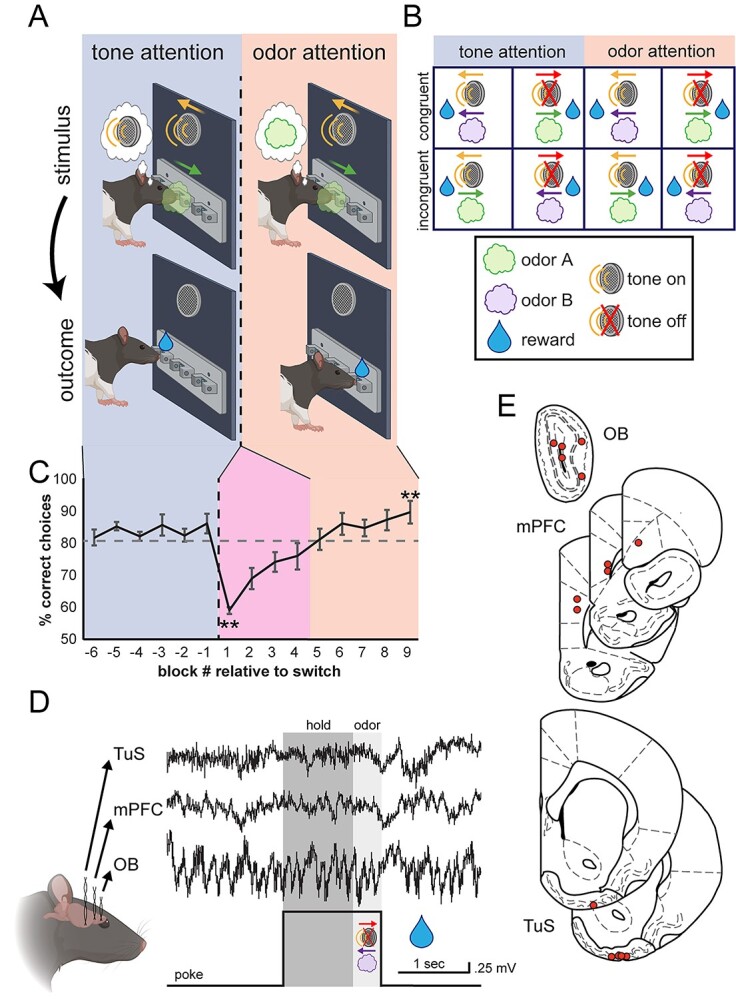
Investigating mPFC and olfactory network activity during odor-directed selective attention. A) Freely moving rats initiate a trial by nose poking in a center port, which triggers simultaneous delivery of 1 of 2 auditory cues and 1 of 2 odors (stimulus). These cues direct the rat to retrieve a fluid reward at either the left or the right port (outcome). Behavioral sessions begin with tone attention (auditory cues predict reward; blue shading) and switch to odor attention (odors predict reward; orange shading). B) All possible trial combinations in the CAT. Half of these are congruent (odor and tone indicate same reward port) and half are incongruent (odor and tone indicate opposite reward ports). C) Behavioral performance of all rats across behavioral sessions. After completing 6 blocks of tone attention at criterion (≥80% correct; blue shading), the task was switched to odor attention (orange shading). Rats then switched their attention to odors and completed 6 blocks at criterion. Block −1 versus 1 paired, two-tailed t-test, **P = 0.001. Block 1 versus 9 paired, two-tailed t-test, **P = 0.003. n = 5 rats, 4.6 ± 0.5 sessions per rat. Error bars represent SEM. D) All rats were implanted with bipolar recording electrodes in the OB, TuS, and mPFC, and LFPs were acquired during behavior. A sample trace is shown from a single trial, in which the rat pokes, holds in the center port for 1 s awaiting stimuli (dark gray shading), and remains for 400 ms to sample the stimuli (light gray shading). E) Electrode location summary. Red dots indicate tips of bipolar LFP electrodes.
Rats were water restricted to no less than 85% of their initial body weight and were shaped on the CAT. Briefly, rats were first shaped on single-modality 2-alternative choice (2-AC) tasks in blocks of 20 trials, starting with tone-on/tone-off 2-AC, then odor A/odor B, before learning the multimodal attention task. In the final task, rats initiated a trial by nose poking in a center port. They were required to hold for 1 s (for LFP rats; Fig. 3D) or 600 ms (for sniffing rats; Fig. 8A) before stimulus delivery and were then required to remain for at least 400 ms for stimulus delivery (the prolonged hold period for the rats contributing LFP data was implemented to provide a sufficient window for subsequent analyses). After leaving the center port, the rats had 4 s to make a choice at either the left or right port. Correct choices were rewarded with 15 μL of 2 mM saccharin in water, and incorrect choices were unrewarded. If no choices were made in the 4-s window, the trial was recorded as an omission. After the 4-s window, an additional 1-s inter-trial interval was implemented, which was reset by a nose poke during that second. Thus, across all trials, the rats were out of the center port for one full second prior to their trial-initiating poke. Sessions began with 3 blocks of odor only, in which there were no competing tone cues. After completing 3 blocks at ≥80% correct, the rats began receiving simultaneous olfactory and auditory cues and were required to complete 6 blocks of tone attention (attending tones, and ignoring odors) at ≥80% correct. We found that rats required 10.8 ± 0.8 blocks to reach criterion on tone attention. After this, an uncued rule change occurred, requiring the rats to now attend odors and ignore tones for at least 6 blocks at ≥80% correct on odor attention. The rats required 10.6 ± 1.2 blocks to reach this criterion. The rats then completed 3 more blocks of odor only at the end of the session, bringing a full session to 27.8 ± 1.2 blocks. Odor-only blocks were included at the beginning and end of the session to neutralize any potential effects of motivation. For all task types, trial combinations were pseudorandomly presented, such that equal numbers of each trial type were given in each block of 20 trials.
Fig. 8.

Rats maintain highly stereotyped sniffing strategies despite increased attentional demands. A) Sample trace of thermocouple signal from rat nasal cavity on a single trial. 600 ms hold and 400 ms odor epochs are indicated by dark and light gray shading, respectively. B) Behavioral performance. Block −1 versus 1 paired, two-tailed t-test, P = 0.049. Block 1 versus 9 paired, two-tailed t-test, P = 0.026. C) Instantaneous sniff frequency for one session, from one example rat (rat 137). Colored bars on the left-hand side indicate the current task type. Dotted lines and light and dark gray shading represent hold and odor epochs, respectively. Mean sniffing frequency ± SEM for each task type is plotted below, with the black circle indicating the mean time of reward acquisition (±SEM). D) Sniffing frequency means within each trial epoch. Two-way ANOVA with Greenhouse-Geisser correction, main effect of trial epoch F(1,2) = 29.47, P = 0.032. No main effect of task type, F(1.04, 2.09) = 3.2, P = 0.21. Error bars represent SEM. E) Time to the first sniff following odor onset. One-way ANOVA with Greenhouse-Geisser correction, F(1.19,2.38) = 1.91, P = 0.29. Error bars represent SEM. Similar results were seen when calculating time to second and third sniffs, as well as intervals between them (data not shown). F) Correlations between block # of the session and sniffing frequency. Rat 137 (circles) hold: R2 = 0.33, F(1,111) = 54.46, P < 0.0001, odor: R2 = 0.009, F(1,111) = 1.03, P = 0.31. Rat 138 (squares) hold: R2 = 0.61, F(1,18) = 28.61, P < 0.0001, odor: R2 = 0.32, F(1,18) = 8.406, P = 0.009. Rat 139 (triangles) hold: R2 = 0.3, F(1,168) = 73.14, P < 0.0001, odor: R2 = 0.0004, F(1,168) = 0.07, P = 0.79. G) Sniffing frequency for correct and incorrect trials in switch blocks only. Two-way ANOVA with Greenhouse-Geisser correction, main effect of trial epoch, F(1,2) = 57.65, P = 0.017. No main effect of trial outcome. n = 3 rats, 3.5 ± 2.5 sessions per rat. H) Relationship between switch sniff frequency variance during the hold period and number of blocks to first odor attention block at ≥80% correct. Each point represents one session. R2 = 0.068, F(1,7) = 0.51, P = 0.51. I) Relationship between switch sniff frequency variance during the odor period and number of blocks to first odor attention block at ≥80% correct. R2 = 0.11, F(1,7) = 0.84, P = 0.39.
For LFP recordings, this shaping process occurred over the course of 33–46 (40.8 ± 2.3) sessions, resulting in expert rats that had switched their attention from tones to odors 8–11 (9.8 ± 0.6) times prior to the final recorded sessions included in our data analysis. Each rat contributed 3–6 (4.6 ± 0.5) sessions of expert performance to the analysis. For experiments where sniffing was recorded, shaping occurred over 63–72 (67.3 ± 2.4) sessions, rats switched their attention 11–17 (13.6 ± 1.8) times before recorded sessions, and contributed 1–6 (3.5 ± 2.5) sessions of expert performance to the analysis. Shaping with the rats used for sniffing took more sessions for them to reach expert performance since they were delayed in learning/performance due to surgical implantation of thermocouple mid task acquisition.
Data acquisition
LFPs from all electrodes were digitized using an RHD 2132 headstage (Intan Technologies, Los Angeles, CA), amplified using a PZ5 amplifier (Tucker-Davis Technologies, Alachua, FL), and acquired at 3 kHz using OpenEx and an RZ2 BioAmp processor (Tucker-Davis Technologies). Tethering of the rats to the PZ5 occurred via a flexible ultralight tether with a commutator in-line to allow free movement. Entrances to the left, right, and center ports were detected by infrared beam breaks and acquired at 380 Hz. Behavioral and stimulus delivery events were simultaneously recorded in OpenEx using the RZ2 BioAmp processor, allowing for synchrony between the behavioral and neural events. The thermocouple signals were acquired similarly along with behavior, but using Synapse software with a sampling rate of 610 Hz.
LFP analysis
To minimize potential multisensory influences (Gnaedinger et al. 2019), all trials analyzed were tone-off trials (Fig. 3B) (Carlson et al. 2018) and came from blocks where behavioral performance was ≥80% correct. Limiting our analysis strictly to tone-off trials allowed for stimulus presentation across all 3 different task types (odor only, tone attention, and odor attention) to be exactly the same (i.e. there was no confounding tone cue), and the only difference is the cognitive state of the animal. For odor only, tone attention, and odor attention, only correct trials were included in all analyses (unless otherwise specified; Fig. 5D). For switch blocks, where the rat is by definition performing poorly and responding to negative reward feedback, we included correct and incorrect trials. Because only tone-off trials were analyzed, odor-only blocks (which again are all tone-off trials) contributed twice as many trials as tone attention and odor attention blocks of which half are tone-off trials. Therefore, we randomly discarded half of the odor only trials, preserving the proportion that were from the beginning/end of the session as well as the proportion of trial types. The data were imported into MATLAB and traces spanning −10 to 8.4 s from odor onset from each trial were downsampled to 1 kHz, filtered 0.5–100 Hz using a second-order bandpass filter and 59–61 Hz using a second-order band-stop filter. These large segments of data were further filtered to avoid edge artifacts from filtering, but smaller segments were used for later analysis. Power and coherence were computed using the Chronux toolbox (Mitra and Bokil 2009) (http://chronux.org). We chose to then normalize raw values to odor-only trials to identify possible effects specifically related to attentional demand, rather than normalizing to the pre-poke period, which we found often obscured or flattened the differences across cognitive states. Specifically, multi-taper power spectra were computed using the mtspectrumc function with 5 tapers, and coherence was computed using the coherencyc function with 5 tapers. Mean power and coherence were then determined by averaging within the given frequency range. For power and phase–amplitude coupling (PAC) analyses, a single LFP trace from the bipolar electrode was used. For coherence analyses, a subtracted trace was first created from the bipolar electrode. For power and coherence analyses, theta was defined as 2–12 Hz, beta as 15–35 Hz, low gamma as 40–60 Hz, and high gamma as 60–80 Hz. We separated gamma into low and high bands based on (i) possible emergence of powers in these bands and (ii) previous work on these distinct oscillations in the OB (Kay 2003), and applied consistent definitions across regions for direct unbiased comparisons.
Fig. 5.
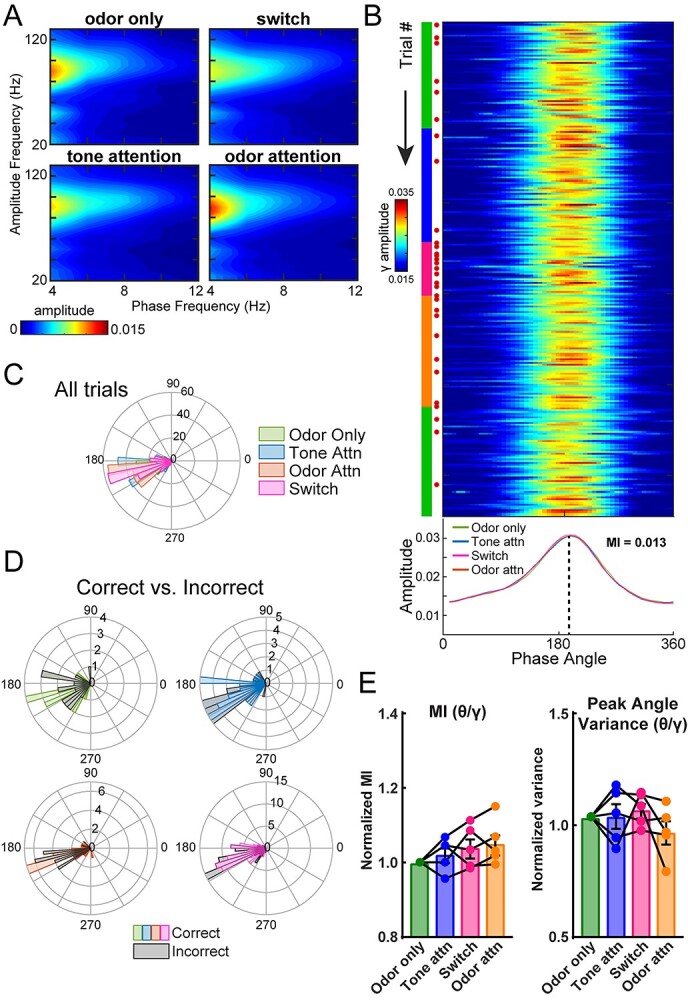
OB gamma oscillations couple with theta phase across attentional states. A) Mean comodulograms across rats showing strong coupling between high gamma and respiratory theta frequencies. n = 5 rats, 4.6 ± 0.5 sessions per rat. B) Trial-by-trial theta-gamma for one example session. Green, blue, pink, and orange markings on left side indicate current task type (odor only, tone attention, switch, and odor attention, respectively). Red dots indicate incorrect trials, which expectedly increase in frequency upon switch. The mean amplitude for the session, by task type, is plotted below. MI for the entire session = 0.013. C) Polar histogram of peak phase angles by task type for all trials across all sessions for an example rat (n = 4 sessions). All task types indicated significant periodicity (Rayleigh test, odor only P < 1e−18, tone attn P < 1e−24, switch P < 1e−27, odor attn P < 1e−31) and similar distributions (Kolmogorov–Smirnov tests, all comparisons P > 0.05). D) Polar histograms of correct and incorrect trials for each task type. For this example rat, incorrect trials were pooled across sessions and compared to a randomly selected equal number of correct trials. Peak phase angle distributions were statistically similar between correct and incorrect trials. (Kolmogorov–Smirnov tests, all comparisons P > 0.05). E) Left, theta-gamma MI across rats, normalized to MI for odor only trials. One-way ANOVA, F(2.37, 9.48) = 1.96, P = 0.019. Right, theta-gamma peak angle variance across rats, normalized to peak angle variance for odor-only trials. One-way ANOVA, F(2.03, 8.10) = 1.07, P = 0.387. n = 5 rats, 4.6 ± 0.5 sessions per rat. Error bars represent SEM.
Following the initial downsampling, bandpass filtering 0.5–100 Hz, and band-stop filtering 59–61 Hz described above, PAC analysis was completed using MATLAB routines from Tort et al. 2010, wherein the Hilbert transform method was used to determine the phase of the carrier oscillation (theta) and, separately, the envelope of the high frequency oscillation (beta or high gamma). The amplitude of the beta/high gamma fast oscillation across 51 bins of the theta phase was plotted to demonstrate PAC strength (Fig. 5B). For these analyses, theta was defined as 2–10 Hz, beta defined as 15–35 Hz, and high gamma defined as 65–100 Hz, as defined in Losacco et al. (2020). The comodulograms were computed using the same function as the modulation index (MI), by systematically calculating MI for all possible combinations of phase frequency and amplitude frequency in the given range for each (Fig. 5A), allowing for the identification of relationships between phase and amplitude in an unbiased manner. Phase frequencies from 2 to 14 Hz with a step size of 2 Hz and a bandwidth of 4 Hz were examined, with amplitude frequencies from 10 to 120 Hz with a step size of 5 Hz and a bandwidth of 20 Hz. Thus, traces used to determine phase of the carrier oscillation were filtered 2–6 Hz (centered on 4 Hz), 4–8 Hz (centered on 6 Hz), and so on, while carrier oscillation traces were filtered 10–30 Hz (centered on 20 Hz) and so on. For each trial, a single OB LFP trace spanning from −3 to +1.5 s from odor onset was used. A larger segment of time was used for these analyses because more samples were required to examine coupling with theta frequencies down to 2 Hz. Still, this time segment allows for the analysis to be contained to an individual trial without any overlap with neighboring trials.
Sniffing analysis
As with the LFP analyses, all analyses on the sniffing data were restricted to trials where the tone was off. Additionally, only correct trials were examined for odor-only, tone attention, and odor attention blocks, while correct and incorrect trials were examined for switch blocks. The data were imported to MATLAB and traces spanning −10 to 8.4 s from odor onset from each trial were filtered using a second-order band-pass filter from 0.5 to 10 Hz. After extracting trials as described above for the LFP analyses, these filtered traces were convolved with an 8 Hz Morlet wavelet and peaks detected. Detected peaks were visually inspected and false positives were manually rejected using a custom MATLAB GUI. The resultant peaks were used to calculate the instantaneous sniffing frequency throughout the trial. Then, instantaneous frequencies were averaged within each trial epoch (i.e. hold, odor) and normalized to odor only.
General statistical methods
Semiautomated routines were used to ensure rigorous data extraction and analyses. Details regarding specific statistical tests can be found in their respective results sections and/or figure legends. Unless otherwise stated, all values are mean ± SEM.
Results
The PrL and IL preferentially target the TuS compared to other major olfactory structures
The rodent PFC projects throughout the brain with notably strong and well-characterized inputs to the ventral striatum and thalamus (Vertes 2004; Le Merre et al. 2021). Yet the connectivity of the PFC with primary (OB) and secondary olfactory structures (the AON, PCX, and TuS) is not well defined. To address this, we injected Cre-dependent anterogradely transported AAVs encoding synaptophysin tagged with either GFP or mRuby into the PrL or IL, in combination with an AAV encoding Cre under control of the CaMKII promoter (Fig. 1A and B) (Herman et al. 2016). This approach allowed us to observe fluorescent puncta (which can more confidently be attributed to synaptic terminals, rather than fibers of passage) in olfactory regions receiving input from either the PrL or IL cortex. Importantly, because Cre expression was driven by the CaMKII promotor, we can specifically assess excitatory projections which make up >80% of mPFC neurons (Erö et al. 2018) and are major regulators of the PFC’s effects (de Kloet et al. 2021). We quantified fluorescent puncta in 3 structures recipient of dense OB input: the AON, PCX, and TuS (Fig. 1B–G). We also inspected the OB for puncta but did not quantify this since none were detectable (Fig. 1F). Other than the OB, we observed fluorescent puncta in all regions examined, with a striking density in the TuS. Specifically, the medial division of the TuS (mTuS), which may play a particularly prominent role in olfaction and motivated behaviors (Ikemoto 2003; Murata et al. 2015; Zhang et al. 2017), receives the most input from the mPFC, even more so than all other regions combined (Fig. 1G). Within the mTuS, we observed synapses throughout all 3 layers, with significantly more in layers 2 and 3 (Fig. 1H). Importantly, this is where the vast majority of medium spiny neurons, the principal neuron of the TuS, reside. Further, we found that the IL projections to the mTuS are denser than those of the PrL (Fig. 1G and H). Notably, in 2 separate rats, we unilaterally injected a retrograde AAV encoding GFP into the PrL and IL and observed no GFP+ cells in the TuS (or anterior PCX), indicating that there is no direct reciprocal feedback from the TuS (or anterior PCX) to the PrL or IL (Supplementary Fig. S1). Together, these findings indicate that the PrL and IL project to multiple olfactory regions, with the TuS being a major recipient of this input.
Among PFC subregions, layer 5 PrL and IL neurons provide the densest input to the TuS
While the PrL and IL are strongly implicated in attention, the PFC also includes the OFC. The OFC is involved in polysensory processing (Small et al. 2001; de Araujo et al. 2003; Rolls 2004), and cognition and decision-making (for review see Schoenbaum et al. 2009; Izquierdo 2017), making it another strong candidate circuit to instruct state-dependent odor processing. To directly compare the OFC→TuS and mPFC→TuS pathways, we unilaterally injected a retrograde AAV encoding GFP into the TuS and quantified cell bodies throughout the PFC, including the PrL, IL, medial (MO), ventral (VO), lateral (LO), and dorsolateral (DLO) OFC subdivisions (Fig. 2A–D). Both ipsilateral and contralateral to the injection, we found the greatest numbers of cells in the IL, PrL, and MO, which together make up the ventromedial PFC (vmPFC) by virtue of their similar connectivity patterns (Le Merre et al. 2021). On the ipsilateral side, we observed significantly more cells in the IL than the VO, LO, and DLO and significantly more cells in the MO than the VO and DLO (Fig. 2D). While the contralateral side contained fewer cells overall, a similar pattern was present, with significantly more cells in the IL than the VO, LO, and DLO (Fig. 2D). Thus, the PrL, IL, and MO provide the densest inputs to the TuS and are well positioned to influence odor processing.
Within the PrL and IL, we quantified cell body locations throughout the cortical layers for both the ipsilateral and contralateral hemispheres. We observed that in both of these regions, the majority of cell bodies were found in layer 5 (Fig. 2E), which is consistent with other glutamatergic (de Kloet et al. 2021) corticostriatal mPFC projections (Ding et al. 2001; Gabbott et al. 2005; Nakayama et al. 2018). The fact that the TuS receives its densest PFC inputs from the PrL and IL cortices, together with the fact that these regions preferentially target the TuS over other olfactory regions, indicates that the mPFC→TuS pathway is likely the primary route whereby the olfactory system might receive information regarding states or tasks requiring high executive function, including attention.
Investigating mPFC and olfactory network activity during odor-directed selective attention
We next sought to functionally test whether the mPFC and the olfactory system, specifically the OB and the TuS, integrate into a network during olfactory attention. To accomplish this, we combined multisite LFP recordings along with the CAT (Carlson et al. 2018) to manipulate selective attention to odors (Fig. 3). Briefly, the CAT is a modified 2-alternative choice task in which rats are simultaneously presented with 1 of 2 olfactory cues (odor A/odor B) and 1 of 2 auditory cues (tone on/tone off). A single behavioral session begins with tone attention: that is, the tone cues signal the reward port location whereas the odor cues are distractors (Fig. 3A–C, blue shading). Once criterion on the tone attention phase of the task has been reached (6 blocks of 20 trials at ≥80% correct), an uncued intermodal rule change occurs, and the rats must now direct their attention to odors, and ignore tones, to accurately locate their rewards (Fig. 3A–C, orange shading). This rule change is accompanied by a temporary drop in performance as the rats adjust their behavior to the new rule (Fig. 3C, pink shading) before they eventually perform well on odor attention (6 blocks at ≥80% correct, orange shading). We will refer to the blocks following the rule change before performance reaches ≥80% correct on odor attention as “switch” blocks, in which the rat is by definition performing poorly. Importantly, each session began and ended with 3 blocks of odor-only trials, in which there were no competing tone cues, to use as a control for odor discrimination without any additional cognitive demand.
In the CAT, there are 4 possible combinations of trials (Fig. 3B). Two of these are “congruent,” meaning that the olfactory and auditory cues signal approach to the same reward port, and 2 are “incongruent,” meaning that the cues signal opposite ports. Thus, the correct reward port on incongruent trials depends on the current task rule: tone attention (blue shading) or odor attention (orange shading). Importantly, all analyses of physiological signals were limited to trials on which the tone was off to avoid multisensory influences and focus on the effects of cognitive state on odor processing specifically (Carlson et al. 2018). On a single trial of the CAT, the rat will nose poke to initiate a trial, then must hold in the center port for 1 s before the stimuli come on (Fig. 3D, dark gray shading). Then, the odor and tone stimuli come on simultaneously, and the rat must remain in the center port for at least 400 ms to sample the stimuli (Fig. 3D, light gray shading). After 400 ms, the rat is free to make a choice at the left or right port and receive a water reward if correct.
We simultaneously recorded LFPs from the TuS, mPFC, and OB from 5 highly proficient expert rats (see Methods) while they performed the CAT (Fig. 3D and E). This allowed us to explore network dynamics locally within each structure, as well as coherent activity between these structures. Because electrodes were implanted and these extensive behavioral studies completed before the tracing studies presented above were quantified, we did not match recording sites with specific subregions (e.g. mTuS vs. lTus, or PrL vs. IL). Specifically, our TuS electrodes were mostly localized to the middle to lateral regions of the TuS, and the mPFC electrodes were mostly in the PrL. Given that LFP signals are influenced by neural dynamics up to 250 μm away (Buzsáki et al. 2012) and that we observed evidence of connectivity between both TuS subregions and multiple mPFC subregions, we consider these data to be sufficient to detect attention-related activity within and between these regions.
Elevations in gamma power upon intermodal switching and selective attention to odors
Gamma oscillations are widely observed throughout the brain and are tied to a diverse array of functions including perception, memory, and attention (Fries et al. 2001; Cardin et al. 2009; Buzsáki and Wang 2012; Siegle et al. 2014; Kim et al. 2016; Mably and Colgin 2018). Specifically, elevated gamma power in sensory neocortex is related to attentional selection (Fries et al. 2001). In the OB, elevated gamma is linked to perceptually demanding discriminations between perceptually similar odors (Beshel et al. 2007) and has historically been conceptualized as integral to behavioral states (Eeckman and Freeman 1990; Martin and Ravel 2014). We examined gamma oscillations in the low (40–60 Hz) and high (60–80 Hz) gamma range within each brain structure as rats completed the CAT (Fig. 4). To do this, we measured the power of gamma oscillations within the hold and odor trial epochs across each task type (odor only, tone attention, switch, and odor attention) and normalized these values to those for odor-only trials to highlight the specific contributions of sensory-directed attention as compared to “basic” olfactory discrimination (Supplementary Fig. S2).
Fig. 4.

Elevations in gamma power upon intermodal switching and selective attention to odors. A) Full band and gamma band filtered (40–80 Hz) traces from the TuS (top), the mPFC (middle), and the OB (bottom) on a single trial of the CAT. Analysis windows for 1-s hold and 400-ms odor periods are indicated in dark and light gray, respectively. B) Quantification of power in the low and high gamma ranges across all task types, normalized to odor only. For each region/frequency band, a 2-way ANOVA with Greenhouse-Geisser correction was completed. TuS, low gamma: main effect of task type, F(1.62, 6.5) = 6.04, P = 0.037. mPFC, high gamma: main effect of trial epoch, F(1.85, 7.38) = 13.66, P = 0.004. Interaction between trial epoch × task type, F(2.36, 9.44) = 5.91, P = 0.019. OB, high gamma: main effect of trial epoch, F(1.38, 5.52) = 9.47, P = 0.02. Main effect of task type, F(2.22, 8.88) = 7.60, P = 0.011. n = 5 rats, 4.6 ± 0.5 sessions per rat. On all graphs, asterisks indicate results from Tukey’s multiple comparisons *P < 0.05, **P < 0.01. All error bars represent SEM.
In the TuS, we observed a slight enhancement in low gamma oscillations with increased attentional demand, but this did not reach statistical significance across rats (Fig. 4B). Interestingly, we observed that high gamma oscillations in the mPFC were elevated during odor attention compared to tone attention (Fig. 4B). We were surprised to observe this enhancement specifically for odor-directed attention in the mPFC, since one might anticipate increased gamma power with increased cognitive demand regardless of sensory modality. In the OB, we observed increased power of low gamma oscillations during odor attention as compared to odor only, indicating that increased attentional demand alone is enough to modify odor information at the earliest stage of processing in the brain (Fig. 4B). Finally, OB oscillations in the high gamma range were elevated in power during the attentional switch relative to odor only and tone attention, suggesting network activity related to cognitive flexibility. While we did uncover some changes in beta band power (Supplementary Fig. S3), these were not as dramatic across attentional states as was the case with gamma. Overall, these findings indicate changes in local network dynamics in the OB and the mPFC during selective attention to odors, suggesting that attention may modulate odor processing at its most early processing stage (the OB).
OB gamma oscillations couple with theta phase across attentional states
In some brain regions, the amplitude of high-frequency oscillations is structured by the phase of low-frequency oscillations, a phenomenon known as PAC (Bragin et al. 1995; Canolty et al. 2006; Jensen and Colgin 2007; Lakatos et al. 2008; Tort et al. 2010), which is considered a mechanism for attentional selection (Schroeder and Lakatos 2009b). In the OB, PAC between high gamma and respiratory theta becomes stabilized as mice become proficient at discriminating between odors (Losacco et al. 2020), indicating that learning and experience modulate OB PAC. This plus our finding of elevated high gamma in the OB during odor-directed attention led us to investigate whether the OB network may engage in PAC during olfactory attention.
To address this, we first computed comodulograms to identify high-frequency oscillations coupled to theta phase within the rat OB during the CAT, which revealed strong coupling between theta and high gamma (Fig. 5A) and much weaker coupling between theta and beta (Supplementary Fig. S4). To investigate the significance of theta–high gamma PAC, we examined the trial-by-trial amplitude of high gamma power as a function of theta phase, which indicated high coupling throughout individual sessions and across cognitive states (Fig. 5B and C). Peak phase angle was consistent even comparing correct versus incorrect trials (Fig. 5D). For each task type, we computed the MI of the PAC, which is a measure of the extent to which a given high-frequency oscillation is structured to a low-frequency carrier oscillation. MI values can range from 0.005 to 0.03 from the hippocampus (Tort et al. 2010) and OB (Losacco et al. 2020), and we observed a similar range herein. The distribution in Fig. 5B shows the MI theta–high gamma for an example session and indicates strong PAC. While some individual rats showed modulation of the MI with cognitive state, across the population, there were no systematic changes in theta–high gamma PAC with different attentional states (Fig. 5E). Because decreased variance in the peak phase angle (i.e. more consistent coupling) in the OB is associated with olfactory learning in a Go/No-go task (Losacco et al. 2020), we quantified this as well. We normalized peak phase angle variance to that observed on odor-only trials (Fig. 5E). Thus, a value of one indicates that the peak angle variance observed was the same as that for odor-only trials, while higher values indicate greater peak angle variance (less consistent coupling) and lower values indicate less variance (more consistent coupling). We did not observe any differences across cognitive states, indicating that the consistency of coupling is maintained across cognitive states (Fig. 5E). Thus, while the tightly structured theta–high gamma PAC in the OB does not change in magnitude across attentional states, its stability suggests that it possibly supports expert, flexible cognitive function.
Beta oscillations are more coherent between the mPFC and olfactory regions during an intermodal attentional shift
We next tested whether spectral activity between the mPFC and olfactory system might become more coherent during attention. We observed enhanced coherence in the beta range (15–35 Hz) between the mPFC and the TuS specifically during the switch blocks—when the rule has been changed from tone to odor attention, but the rats have not yet successfully switched their attention (Fig. 6A). For the mPFC-TuS, this elevation was specific to the 1-s hold period prior to odor onset (Fig. 6B), which corresponds to anticipation. Between the mPFC and the OB, we similarly observed increased coherence in the beta band, but during both the hold and odor epochs (Fig. 6C and D). In contrast, no changes in beta coherence between the OB and TuS were uncovered (data not shown), nor were there any differences in gamma coherence between any of the structures recorded (Supplementary Fig. S5). Overall, these data indicate that mPFC engagement with olfactory structures is upregulated during a cognitively demanding switch from auditory to olfactory selective attention, suggesting a role for the mPFC in attention-dependent odor processing.
Fig. 6.

Beta oscillations are more coherent between the mPFC and olfactory regions during intermodal attentional shifts. A) Coherogram showing coherence between the mPFC and TuS in the beta range (15–35 Hz) for one example rat across task types (n = 3 sessions). Nose poke begins at −1 s, dotted line indicates odor onset. B) Means for TuS-mPFC beta coherence across all rats, normalized to odor only. n = 5 rats, 4.6 ± 0.5 sessions per rat. Two-way ANOVA with Greenhouse-Geisser correction, main effect of task type, F(1.38, 5.41) = 6.54, P = 0.041. Error bars represent SEM. C) Coherogram showing coherence between the mPFC and the OB in the beta range (15–35 Hz) for one example rat across task types. Nose poke begins at −1 s, dotted line indicates odor onset. D) Means for OB-mPFC beta coherence across all rats, normalized to odor only. n = 5 rats, 4.6 ± 0.5 sessions per rat. Two-way ANOVA with Greenhouse-Geisser correction, main effect of task type, F(1.79, 7.15) = 13.06, P = 0.005. On all graphs, asterisks indicate results from Tukey’s multiple comparisons *P < 0.05, **P < 0.01. Error bars represent SEM.
OB-mPFC coherence in the theta range is strongly upregulated during an intermodal attentional shift to odor attention
Respiration, including fast investigatory sniffing, may structure theta oscillations in not only olfactory regions such as the OB (e.g. Adrian 1942; Kay and Laurent 1999; Buonviso et al. 2003) and TuS (Carlson et al. 2014) but also the PFC (Biskamp et al. 2017; Zhong et al. 2017; Moberly et al. 2018; Tort, Ponsel, et al. 2018b; Bagur et al. 2021). Slow wave respiratory theta may serve as a carrier for synchronizing brain regions (Fontanini and Bower 2006; Colgin 2013). This is particularly relevant in an odor-guided task, where correct performance depends upon sampling of the odors via sniffing. We observed that during the attentional switch, there was a striking increase in coherence in the theta range (2–12 Hz) compared to the odor attention state (Fig. 7A and B). While a slight increase was observed during the hold epoch (Fig. 7A and B), this increase was much more pronounced and statistically significant during the odor sampling period (Fig. 7A and B). While our prior analyses had been restricted solely to correct trials for odor only, tone attention, and odor attention, we included correct and incorrect trials for all switch blocks, since this switch state is defined by poor performance and behavioral flexibility, and also because this allowed for the inclusion of comparable numbers of trials in the analysis (see Methods). Thus, we separated trials for switch blocks only into correct and incorrect trials, discarding a random selection of correct trials to match the number of incorrect trials available. This revealed, counterintuitively, a greater coherence on incorrect compared to correct trials (Fig. 7C), suggesting that OB-mPFC theta band coherence is upregulated in contexts where behavioral flexibility is required.
Fig. 7.
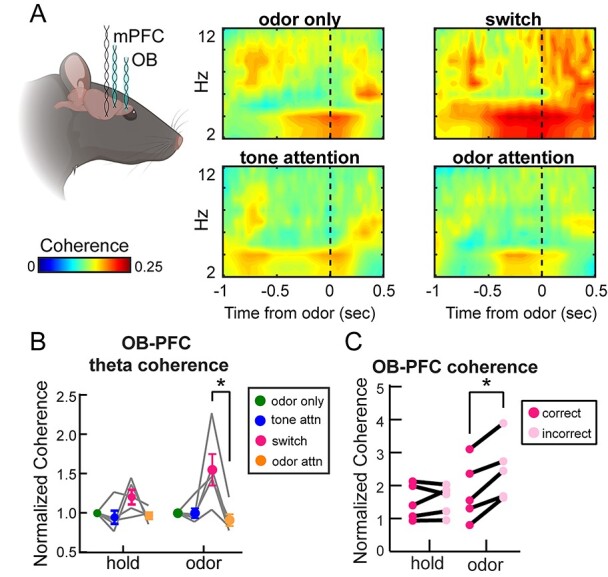
OB and mPFC coherence in the respiratory theta range are strongly upregulated during an intermodal attentional shift to odor attention. A) Mean coherogram across rats showing coherence in the theta range (2–12 Hz) across task types. B) Mean theta coherence across rats for each trial epoch and each task type. Odor only, tone attention, and odor attention trials include only correct trials from criterion performance blocks. Switch quantification includes all trials from blocks below criterion performance. Two-way ANOVA with Greenhouse-Geisser correction, main effect of task type F(1.3, 5.2) = 7.07, P = 0.039. Asterisk on graph indicates results from Tukey’s multiple comparisons test, *P < 0.05. Error bars represent SEM. C) Theta coherence for correct and incorrect trials during the switch. While there were more correct than incorrect trials, randomly selected correct trials were excluded from this analysis to match the number of incorrect trials. n = 5 rats, 4.6 ± 0.5 sessions per rat. Two-way ANOVA with Greenhouse-Geisser correction, main effect of outcome F(1,4) = 76.81, P = 0.0009. Interaction between outcome and trial epoch F(1.56, 6.24) = 5.39, P = 0.048. Asterisk on graph indicates results from Sidak’s multiple comparisons test, *P < 0.05.
Increased coherence between the OB and mPFC in the theta range during the intermodal switch raises the interesting possibility that this could aid in information transfer from the OB to the mPFC (perhaps via the AON) during a time when it is important for the rats to update their understanding of the current task rules. To investigate this, we quantified interregional PAC, by referencing mPFC gamma power to the phase of OB theta. While we did not find direct evidence for this by examining OB-mPFC interregional PAC (with mPFC gamma referenced to OB theta; Supplementary Fig. S6), future studies could investigate how information transfer from the OB to mPFC is shaped by cognitive demand.
Rats maintain highly stereotyped sniffing strategies despite increased attentional demands
Sniffing behavior in rodents is influenced by many factors including wakefulness, the stimulus being sampled, and motivational state (Clarke and Trowill 1971; Ikemoto and Panksepp 1994; Kepecs et al. 2007; Wesson et al. 2008; Rojas-Líbano and Kay 2012; Lefèvre et al. 2016). As discussed above, whether passive (respiration) or active (sniffing), this behavior subsequently shapes neural activity throughout the brain (Adrian 1942; Macrides et al. 1982; Vanderwolf 1992; Sobel and Tank 1993; Buonviso et al. 2003; Fontanini and Bower 2006; Spors et al. 2006; Verhagen et al. 2007; Carey et al. 2009; Shusterman et al. 2011; Colgin 2013; Jordan et al. 2018). We reasoned that if rats adjusted their sniffing when faced with the demand to selectively attend to odors, this could potentially account for the changes in OB-mPFC theta coherence. No prior work has assessed sniffing strategies of rodents during olfactory selective attention. To test this, we trained a separate cohort of rats to perform the CAT before implanting thermocouples in their nasal cavities, allowing us to monitor sniffing behavior by measuring temperature changes (airflow) within the nasal cavity (Fig. 8A and B). Unlike humans, who respond to changing attentional demands by modifying both the depth and timing of respiration (Plailly et al. 2008; Arabkheradmand et al. 2020), rodents most dramatically employ changes in sniffing frequency during odor active sampling (Kepecs et al. 2007; Wesson et al. 2009; Cenier et al. 2013). Therefore, we quantified sniffing frequency specifically during the hold and odor periods. As illustrated by the example session from one rat in Fig. 8C, we observed no clear changes in sniffing behavior across task types (Fig. 8C and D). Instead, the rats displayed a highly stereotyped pattern of sniffing behavior, suggesting that highly proficient rats implement a stereotyped sensorimotor program while completing each trial of the CAT, regardless of current attentional demand (Fig. 8C, bottom). This was the case across all rats. Although we observed a slight decrease in sniffing frequency specifically during the hold period throughout a session on average (Fig. 8D and F), this was confined to the hold period as the rats anticipated odor arrival and sniffing frequency during the odor sampling period remained remarkably constant throughout the sessions for 2/3 rats (Fig. 8D and F). Given the lack of changes in sniffing frequency by task type, we investigated whether the timing of sniffs during the odor period were more intentional in relation to odor onset when animals were faced with attending to odor. We examined the time to the first sniff across task types and found no difference, suggesting that sniff timing relative to odor onset is independent of attentional demands (Fig. 8E). We also examined sniffing frequency on correct versus incorrect trials during the switch blocks (Fig. 8G) yet did not identify differences in sniffing frequency, providing further evidence that changes in sniffing behavior do not likely account for modulations in OB-mPFC coherence that we uncovered, which were correlated with trial outcome. Additionally, we investigated the relationship between the variance in sniffing frequency during the switch, and how quickly the rats were able to switch to odor attention, hypothesizing that rats with more stable sniffing patterns (i.e. less frequency variance from trial to trial) might be more proficient (i.e. reach odor attention criterion more quickly). However, we did not uncover any significant relationship between sniff frequency variance and performance on the CAT (Fig. 8H and I). Together, these data indicate that, at least in the context of this selective attention task, sniffing strategies in rats are resilient to enhanced attentional demand, providing evidence for covert (rather than overt) olfactory attention in rodents.
Discussion
Here we used anatomical, behavioral, and physiological approaches to demonstrate integration of the mPFC with the olfactory system in the context of selective attention to odors (Fig. 9). We show that mPFC neurons in the PrL and IL subregions directly and preferentially target the mTuS compared to other olfactory regions, suggesting that they are well positioned to exert influence on olfactory processing via the mTuS. We then used a physiological and behavioral approach to demonstrate local and interregional effects of attention on network activity within and between the mPFC and olfactory regions, including the OB and TuS. Finally, we found that olfactory sampling behavior is resilient to attentional demand, indicating that olfactory attention may be a “covert” rather than “overt” process. Together, this work adds to a growing body of literature on the possible mechanisms underlying cognitive modulation of olfactory processing and thus perception.
Fig. 9.
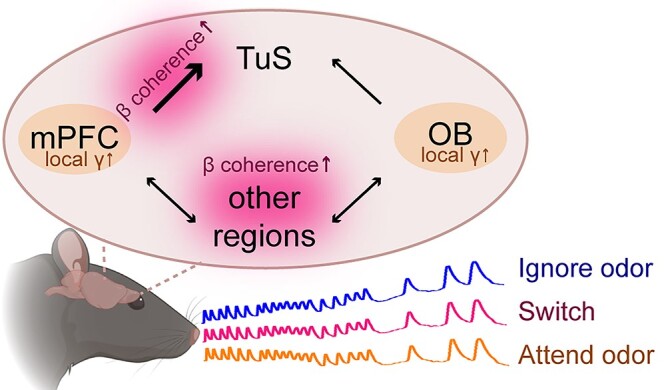
Integrated model of odor-directed attention. In this model of odor-directed attention, the mPFC integrates with the olfactory system at early (OB) and late (TuS) stages of processing to form an olfactory attention network. Despite no state-dependent changes in sniffing behavior, odor-directed attention is accompanied by enhanced gamma oscillations in the OB and mPFC (orange labels). Similarly, while sniffing remains unchanged during a cognitively demanding switch to odor attention, beta band coherence is enhanced between the mPFC-OB and the mPFC-Tus (pink labels), suggesting it may aid attention-dependent odor processing.
Insights into mPFC connectivity with the olfactory system
Our tracing experiments uncovered previously unappreciated aspects of mPFC connectivity with the olfactory system. We found that the PrL and IL most densely innervate the mTuS compared with other olfactory regions. By using a combinatorial AAV approach, where Cre expression driven by the CaMKII promotor permits expression of synaptophysin-eGFP/-mRuby, we were able to identify this pathway as excitatory while confidently attributing fluorescence in the TuS (and PCX) to synaptic terminals (primarily in layers 2 and 3) rather than fibers of passage (Fig. 1). We further demonstrated that among PFC subregions, the PrL and IL provide the most projections to the TuS, with the MO coming in third, and these projection neurons mostly reside in layer 5 (Fig. 2). Our data are in agreement with earlier tracing work which established that rat mPFC neurons project throughout the brain, including in the TuS (Vertes 2004), and a recent review proposing that the PrL, IL, and MO be grouped together as the vmPFC, based upon their connectivity (Le Merre et al. 2021). Our results expand upon previous literature, which used anterograde Phaseolus vulgaris-leucoagglutinin tracing (Vertes 2004), by contributing (i) specificity and certainty regarding the specific layers of mPFC→TuS synapses and (ii) clarity about at least one mPFC cell type. mPFC glutamatergic neurons modulate their firing during sustained attention (Kim et al. 2016) and encode task rules during an intermodal attention task (Rikhye et al. 2018), suggesting that TuS-projecting glutamatergic mPFC neurons are positioned to influence olfactory processing during attentionally relevant behavioral events. Future work illuminating the more specific identities of these TuS projecting mPFC neurons (e.g. via transcriptomics) will be important for disambiguating their specific circuitry and possible contribution to olfactory attention.
Prefrontal-olfactory network engagement during selective attention
Our multisite LFP recordings during attentional performance uncovered many changes in network activity, which expand our appreciation for how the olfactory system is shaped by cognitive state. Several particularly notable outcomes are discussed here.
First, while we know that the mPFC is crucial for attention, no studies have monitored mPFC network activity during olfactory attention, leaving a major void in our understanding of how the mPFC engages with the olfactory system, and even more simply, its network activity during odor-directed attention. Because the mPFC is integral for some forms of attention, we predicted it may be recruited during olfactory attention. In support of this, we observed elevated gamma power in the mPFC during odor-directed attention relative to tone attention (Fig. 4). The mPFC is certainly not an olfaction-specific structure, though it is engaged by odor-guided tasks requiring learning (Wang et al. 2020) and high working memory capacity (De Falco et al. 2019). This elevation in gamma power does not likely reflect increased reward confidence, as behavioral performance was comparable across task types (Fig. 3C). It is interesting to consider whether the mPFC of rodents is predisposed to favor and prioritize olfactory information more so than other sensory stimuli. Nevertheless, these findings exhibit engagement of the mPFC during odor-directed attention, providing support for its inclusion in an olfactory attention network.
Olfactory attention enhances power of OB gamma oscillations
Our work is the first to monitor OB activity during selective attention. We found that attention shapes OB activity, which implies that odor information received by structures downstream from the OB, including the TuS, is subject to attention-dependent modulation. Specifically, we observed increased power of low gamma oscillations (40–60 Hz) in the OB during odor-directed attention as compared to odor only discriminations (Fig. 4). Additionally, we observed elevated power of high gamma oscillations (60–80 Hz) while rats attempted to switch their attention from tones to odors (Fig. 4). While increased gamma power in the OB has been associated with successful discrimination of perceptually similar versus dissimilar odors (Beshel et al. 2007), our findings indicate that similar effects can be observed when the odor discrimination is simple/coarse, but the attentional demand is high. Interestingly, elevated low gamma power during odor attention was evident during both the hold and odor epochs, while elevated high gamma power during switch blocks was isolated to the odor sampling period (Fig. 4B). High and low gamma oscillations are considered distinct phenomena in the OB and are believed to have mechanistically unique origins (Kay 2003), so it is perhaps not surprising to observe modulation of these frequency bands during different attentional demands. Low gamma oscillations are believed to arise from inhibition between local interneurons, are unstructured relative to the sniff cycle, and are functionally mysterious, though they have been observed in states of engaged quiescence (Kay 2003). Our data thus support a potential role for low gamma oscillations in attentionally demanding odor discriminations, though future work is needed to fully appreciate the mechanisms of this.
In contrast, high gamma is structured to the sniff cycle and is generated by local excitatory–inhibitory interactions (Halabisky and Strowbridge 2003; Neville and Haberly 2003; Schoppa 2006; Lepousez and Lledo 2013). Disruption of high gamma oscillations in the OB impairs odor discrimination, suggesting their importance for basic aspects of odor perception (Lepousez and Lledo 2013). While the mechanisms by which they may be modulated are unclear, one compelling proposition is that neuromodulators, including acetylcholine and noradrenaline, influence excitatory–inhibitory interactions in the OB (Kay et al. 2009). This is of particular interest given the role of these neuromodulators in states of attention and arousal (Yu and Dayan 2005; Sara 2009). Our observation that high gamma power elevations during the switch are confined to the odor sampling period is consistent with these mechanistic underpinnings and suggests specific changes in the nature of odor processing as one undergoes a cognitively demanding switch to odor attention.
As mentioned, high-frequency gamma in the OB is consistently aligned with the theta cycle, which was evident in our PAC analysis (Fig. 5). Recent work demonstrated that OB theta–high gamma PAC is strengthened as mice learn to discriminate odors in a go–no go task, specifically for the go stimulus, suggesting that PAC may support olfactory behavior (Losacco et al. 2020) and leading us to test whether attention employs (or perhaps just simply influences) OB PAC. Our results uncovered highly consistent theta–gamma PAC in the OB across attentional demands, and much weaker coupling between theta and beta oscillations, leading us to focus on theta–gamma PAC. However, we did not observe a decrease in PAC when expert rats completed trials incorrectly (Fig. 5D), suggesting that perhaps PAC is not necessary to successfully discriminate coarse odor pairs, like the ones we used herein. One possible explanation for this difference is that in 2-alternative choice tasks, like the CAT, both stimuli are assigned positive valence, while in Go/No-go tasks, one stimulus loses positive valence upon learning. Throughout a single session of the CAT, odors temporarily lose their reward-predictive value during tone attention, but it is quickly regained (e.g. Fig. 3C). Our data indicate that OB PAC, in rats who have been shaped to expert level on the same odor discrimination over many weeks, is resilient to a temporary lapse in positive odor valence, and perhaps supports flexible behavior supporting attentional switches.
Beta synchrony integrates mPFC activity within the olfactory network
Our data are the first to show functional coupling between the mPFC and olfactory regions during attentional demands—specifically during an intermodal attentional shift to odors (Fig. 6). Beta oscillations are considered an important mechanism by which long-range communication can occur between brain regions (Kopell et al. 2000; Spitzer and Haegens 2017) and, further, are implicated in top–down control of attention (Sacchet et al. 2015; Richter et al. 2017). We observed elevated beta coherence between the mPFC and the TuS as rats attempted to switch their attention from tones to odors (Fig. 6A and B). In the context of our finding that the mPFC and the TuS are connected via a unidirectional monosynaptic pathway (Figs. 1 and 2), these data suggest that communication between the mPFC and TuS is strengthened during attentional shifts. Indeed, ventral striatum-projecting mPFC neurons are implicated in cognitive flexibility by integrating feedback from trial outcomes (Spellman et al. 2021), suggesting that the mPFC→TuS pathway could engage in the same processes. Our findings provide further support for the hypothesis that inter-areal beta oscillations may be a mechanism by which information about behavioral context is conveyed from higher-level cortex to lower-level sensory areas (Kay and Freeman 1998; Wang 2010; Bressler and Richter 2015) and are original in demonstrating that this concept is applicable to the olfactory system, which possesses unique anatomical organization.
In addition to enhanced mPFC-TuS coherence, we also observed enhanced beta band coherence between the mPFC and the OB (Fig. 6C and D), raising the intriguing possibility that prefrontal influence on olfactory processing could begin as early as the OB. While the OB and mPFC are not connected monosynaptically (Fig. 1), they are intermediately connected via other brain regions (Hoover and Vertes 2007; Denardo et al. 2015; Ährlund-Richter et al. 2019), including bidirectional connectivity with the AON, a pathway known to drive coherence between these structures (Moberly et al. 2018). While we did observe some synaptic puncta in the AON following anterograde mPFC injections (Fig. 1), some tracing studies indicate denser innervation of the AON and PCX than we observed (Sesack et al. 1989; Vertes 2004). This can likely be attributed to (i) our use of a synaptophysin fusion protein, which enabled us to distinguish true synaptic terminals from potential fibers of passage, and (ii) a CaMKII-specific viral tracing strategy that revealed only a small fraction of excitatory mPFC projections. While connectivity between these 2 regions may be somewhat sparse, they both also receive inputs from key neuromodulatory nuclei (Zaborszky et al. 1986; McLean et al. 1989; Passetti et al. 2000; Devoto et al. 2005; Devore and Linster 2012; Rothermel et al. 2014; Santana and Artigas 2017), which may influence the power of beta oscillations in the OB, perhaps by modifying granule cell excitability (Osinski et al. 2018). This raises the possibility that neuromodulators may enable mPFC-OB coherence via simultaneous phasic input to both the mPFC and OB. Cholinergic input increases (Himmelheber et al. 2000; Passetti et al. 2000) and modulates mPFC firing in the context of attention (Gill et al. 2000), and powerfully alters the encoding of odors in the OB (Chaudhury et al. 2009; Devore and Linster 2012; D’Souza and Vijayaraghavan 2014; Ogg et al. 2018). Indeed, lesioning of cholinergic nuclei results in reduced beta synchrony and increased attentional errors in rats (Ljubojevic et al. 2018), indicating a role for cholinergic modulation in attention-related interregional synchrony. Whether cholinergic mechanisms contribute to attention-driven beta synchrony between the mPFC and OB as we observed is an important future question.
Olfactory sampling is resilient to attentional demand
Odor perception requires the inhalation of an odor, and in rodents, this occurs by means of rhythmic inhalation and exhalation of air through the nose in the theta rhythm (Welker 1964; Youngentob et al. 1987; Kepecs et al. 2007; Wesson et al. 2008). The work herein is the first to investigate the influence of olfactory selective attention on sniffing behavior in a rodent. This question is of great interest and importance, since theta oscillations in both olfactory regions and beyond are profoundly shaped by respiration (Adrian 1942; Macrides 1975; Vanderwolf 1992; Kay and Laurent 1999; Buonviso et al. 2003; Fontanini and Bower 2006; Miura et al. 2012; Colgin 2013; Tort, Brankačk, et al. 2018a; Zhang et al. 2021). Especially relevant to our work, low frequency respiration during freezing behavior can drive strong coherence between OB and mPFC activity, further supporting functional connectivity between these networks (Moberly et al. 2018; Bagur et al. 2021).
Rodents structure their sniffing in manners influenced by motivation, behavioral task structure, and the sensory stimulus itself (Clarke and Trowill 1971; Ikemoto and Panksepp 1994; Kepecs et al. 2007; Wesson et al. 2008; Rojas-Líbano and Kay 2012; Lefèvre et al. 2016). While some findings suggest that sniffing strategies do not change in the face of increased perceptual difficulty (Uchida and Mainen 2003; Wesson et al. 2009), we hypothesized, based on our finding of increased theta synchrony between the OB and mPFC (Fig. 7), that enhanced attentional demand may influence sampling strategy. For instance, a rat might increase sniffing frequency during odor sampling when attending to odors versus attending to tones. We found that rats’ sniffing strategies were remarkably resilient to shifting attentional demands, remaining stereotyped as rats flexibly switched their attention from the auditory to olfactory modality (Fig. 8). This is in contrast to some findings in humans, indicating that humans alter the timing and depth of their inhalations during odor anticipation and/or attention (Plailly et al. 2008; Arabkheradmand et al. 2020). Notably, Plailly et al. used a 2-AC task similar to the CAT, but with a tone on/off + odor on/off design, and found that inspiration was specifically altered on odor attention trials where the odor was off (Plailly et al. 2008). This finding raises the interesting possibility that similar results might emerge in rodents if a similar odor on/off design was used, or perhaps if a finer odor discrimination was required. Interestingly, humans also structure their inhalations relative to task structure even when the task is not olfactory in nature, pointing to a role for respiration in structuring and supporting behavioral performance overall (Perl et al. 2019). This idea, along with our findings, together raise the intriguing possibility that rhythmic sniffing may even enhance perception of other stimulus modalities (e.g. auditory), perhaps via cross-modal entrainment (Lakatos et al. 2019; Bauer et al. 2021).
It is interesting to consider sensory sampling via sniffing as analogous to saccadic eye movements (Uchida et al. 2006), which contribute to rhythmic attentional sampling in the visual system (VanRullen 2016; Fiebelkorn and Kastner 2019). In the visual system, attention is regarded as overt when it is accompanied by saccadic eye movements to a target and covert when the eyes remain fixated on a central point (Posner et al. 1980). The investigation of these different modes of attention and their underlying networks has spanned decades (Posner 2016). While these 2 processes engage similar brain networks (Rizzolatti et al. 1987; Corbetta 1998), suggesting that they may not actually be separate, other work suggests that different populations of neurons within these networks may support each type of attention (Thompson et al. 2005). Analogously, our observation of covert olfactory attention (i.e. olfactory attention that occurs in the absence of attention-specific changes in sniffing behavior; Fig. 8) does not necessitate that olfactory attention is always covert (i.e. sniffing is unaffected), and perhaps different behavioral contexts (e.g. attentional learning) or stimulus conditions (e.g. highly turbulent plumes, low intensity odors, presence/absence of odor) might engage different olfactory attentional frameworks.
Limitations
There are several specific limitations in this study we wish to highlight. First, although the tracing data indicated some subregions of interest with greater connectivity between the TuS and mPFC (e.g. mTuS vs. lTuS or IL vs. PrL), our LFP recording electrodes did not always monitor these specific subregions. Indeed, our study was not designed to specifically monitor local subregion neural activity, which would require more precise recording methods (e.g. tetrodes, Ca2+ imaging). Instead, we chose to record LFPs with fairly large diameter bipolar steel wires to afford a simple measure of regional activity, which we could explore both within and between the regions we monitored. We predict that future studies using single-unit or Ca2+ imaging methods to monitor activity within the subregions with most dense interconnectivity will reveal even greater effects than what we have reported herein.
Second, we were not able to monitor sniffing of the rats during permutations to task difficulty or during different stages of task mastery. Indwelling intranasal thermocouples, while providing a direct measure of flow in the nose, are notorious for loosing reliable signal after weeks of implantation. The CAT test for selective attention requires rats to be shaped for nearly 2 months, daily. Thus, for a test of our hypotheses, we selected to simply monitor sniffing following acquisition of expert performance. By doing so, we uncovered that rats apparently engage in odor-directed selective attention covertly. Not surprisingly, this was also the case for non-olfactory attention (in the case of auditory attention). In order to fully appreciate the interplay between odor sampling and selective attention to odors, future studies will be needed wherein both cognitive state (e.g. learning) and stimulus features (e.g. plume turbulence, odor intensity, odor structural similarity) are manipulated.
Finally, our analyses largely focused on the trials where the outcome was correct (with the exception of the switch, where correct and incorrect trials were combined). This was due to the fact that expert animals do not make enough incorrect decisions to complete any meaningful analysis. For example, during high performance blocks, rats may commit 0–4 errors per block, which, over the course of 6 blocks (with tone-on trials excluded), yields <10 trials per task type, as compared to around 10 times as many correct trials. Future experiments examining incorrect decisions during the learning process may shed light on the role of these local and interregional circuit dynamics on learning and decision-making.
Conclusion
Taken together, our data support a model of olfactory attention in which the mPFC integrates with olfactory regions at early (OB) and later (TuS) stages of odor processing to form an olfactory attention network (Fig. 9). This network encompasses local attention-dependent changes in activity within the OB and mPFC, as well as strengthening of interregional coupling between the mPFC-OB and mPFC-TuS. Of course, we predict that other brain regions with demonstrated importance for state-dependent odor processing may be incorporated as well. Interestingly, our results indicate that changes in sniffing do not drive these effects, highlighting that odor-directed attention, at least in this context, is likely orchestrated by top–down mechanisms, as opposed to “bottom-up” influences (from odor sampling). Overall, these findings begin to reveal an olfactory attention network and bring us closer to understanding how the brain affords the ability to selectively attend to odors.
Supplementary Material
Acknowledgments
We thank Dr Mark Fuccillo for generously sharing reagents.
Contributor Information
Hillary L Cansler, Department of Pharmacology and Therapeutics, Center for Smell and Taste, Center for Addiction Research and Education, Norman Fixel Institute for Neurological Diseases, University of Florida, 1200 Newell Dr., Gainesville, FL 32610, United States.
Estelle E in ’t Zandt, Department of Pharmacology and Therapeutics, Center for Smell and Taste, Center for Addiction Research and Education, Norman Fixel Institute for Neurological Diseases, University of Florida, 1200 Newell Dr., Gainesville, FL 32610, United States.
Kaitlin S Carlson, Department of Pharmacology and Therapeutics, Center for Smell and Taste, Center for Addiction Research and Education, Norman Fixel Institute for Neurological Diseases, University of Florida, 1200 Newell Dr., Gainesville, FL 32610, United States.
Waseh T Khan, Department of Pharmacology and Therapeutics, Center for Smell and Taste, Center for Addiction Research and Education, Norman Fixel Institute for Neurological Diseases, University of Florida, 1200 Newell Dr., Gainesville, FL 32610, United States.
Minghong Ma, Department of Neuroscience, University of Pennsylvania Perelman School of Medicine, 110 Johnson Pavilion, 3610 Hamilton Walk, Philadelphia, PA 19104, United States.
Daniel W Wesson, Department of Pharmacology and Therapeutics, Center for Smell and Taste, Center for Addiction Research and Education, Norman Fixel Institute for Neurological Diseases, University of Florida, 1200 Newell Dr., Gainesville, FL 32610, United States.
Funding
This work was supported by National Institutes of Health (grants R01DC016519 and R01DC014443 to DWW, R01DA049545, R01DA049449, and R01NS117061 to MM and DWW, R01DC006213 to MM, and F32DC018232 to HLC).
Conflict of interest statement: None declared.
References
- Adrian ED. Olfactory reactions in the brain of the hedgehog. J Physiol. 1942:100:459–473. [DOI] [PMC free article] [PubMed] [Google Scholar]
- Ährlund-Richter S, Xuan Y, van Lunteren JA, Kim H, Ortiz C, Pollak Dorocic I, Meletis K, Carlén M. A whole-brain atlas of monosynaptic input targeting four different cell types in the medial prefrontal cortex of the mouse. Nat Neurosci. 2019:22:657–668. [DOI] [PubMed] [Google Scholar]
- Arabkheradmand G, Zhou G, Noto T, Yang Q, Schuele SU, Parvizi J, Gottfried JA, Wu S, Rosenow JM, Koubeissi MZ, et al. Anticipation-induced delta phase reset improves human olfactory perception. PLoS Biol. 2020:18:e3000724. [DOI] [PMC free article] [PubMed] [Google Scholar]
- de Araujo IE, Rolls ET, Kringelbach ML, McGlone F, Phillips N. Taste-olfactory convergence, and the representation of the pleasantness of flavour, in the human brain. Eur J Neurosci. 2003:18:2059–2068. [DOI] [PubMed] [Google Scholar]
- Bagur S, Lefort JM, Lacroix MM, de Lavilléon G, Herry C, Chouvaeff M, Billand C, Geoffroy H, Benchenane K. Breathing-driven prefrontal oscillations regulate maintenance of conditioned-fear evoked freezing independently of initiation. Nat Commun. 2021:12:2605. [DOI] [PMC free article] [PubMed] [Google Scholar]
- Barker JM, Taylor JR, Chandler LJ. A unifying model of the role of the infralimbic cortex in extinction and habits. Learn Mem. 2014:21:441–448. [DOI] [PMC free article] [PubMed] [Google Scholar]
- Bauer A-KR, van Ede F, Quinn AJ, Nobre AC. Rhythmic modulation of visual perception by continuous rhythmic auditory stimulation. J Neurosci. 2021:41:7065–7075. [DOI] [PMC free article] [PubMed] [Google Scholar]
- Beshel J, Kopell N, Kay LM. Olfactory bulb gamma oscillations are enhanced with task demands. J Neurosci. 2007:27:8358–8365. [DOI] [PMC free article] [PubMed] [Google Scholar]
- Birrell JM, Brown VJ. Medial frontal cortex mediates perceptual attentional set shifting in the rat. J Neurosci. 2000:20:4320–4324. [DOI] [PMC free article] [PubMed] [Google Scholar]
- Biskamp J, Bartos M, Sauer JF. Organization of prefrontal network activity by respiration-related oscillations. Sci Rep. 2017:7:45508. [DOI] [PMC free article] [PubMed] [Google Scholar]
- Borgers C, Epstein S, Kopell NJ. Background gamma rhythmicity and attention in cortical local circuits: a computational study. Proc Natl Acad Sci U S A. 2005:102:7002–7007. [DOI] [PMC free article] [PubMed] [Google Scholar]
- Bragin A, Jandó G, Nádasdy Z, Hetke J, Wise K, Buzsáki G. Gamma (40-100 Hz) oscillation in the hippocampus of the behaving rat. J Neurosci. 1995:15:47–60. [DOI] [PMC free article] [PubMed] [Google Scholar]
- Bressler SL, Richter CG. Interareal oscillatory synchronization in top-down neocortical processing. Curr Opin Neurobiol. 2015:31:62–66. [DOI] [PubMed] [Google Scholar]
- Buonviso N, Amat C, Litaudon P, Roux S, Royet JP, Farget V, Sicard G. Rhythm sequence through the olfactory bulb layers during the time window of a respiratory cycle. Eur J Neurosci. 2003:17:1811–1819. [DOI] [PubMed] [Google Scholar]
- Buzsaki G. Rhythms of the brain. New York: Oxford University Press; 2006 [Google Scholar]
- Buzsáki G, Wang X-J. Mechanisms of gamma oscillations. Annu Rev Neurosci. 2012:35:203–225. [DOI] [PMC free article] [PubMed] [Google Scholar]
- Buzsáki G, Anastassiou CA, Koch C. The origin of extracellular fields and currents — EEG, ECoG, LFP and spikes. Nat Rev Neurosci. 2012:13:407–420. [DOI] [PMC free article] [PubMed] [Google Scholar]
- Canolty RT, Edwards E, Dalal SS, Soltani M, Nagarajan SS, Kirsch HE, Berger MS, Barbare NM, Knight RT. High gamma power is phase-locked to theta oscillations in human neocortex. Science (80-). 2006:313:1626–1628. [DOI] [PMC free article] [PubMed] [Google Scholar]
- Cardin JA, Carlen M, Meletis K, Knoblich U, Zhang F, Deisseroth K, Tsai L-H, Moore CI. Driving fast-spiking cells induces gamma rhythm and controls sensory responses. Nature. 2009:459:663–667. [DOI] [PMC free article] [PubMed] [Google Scholar]
- Carey RM, Verhagen JV, Wesson DW, Pirez N, Wachowiak M. Temporal structure of receptor neuron input to the olfactory bulb imaged in behaving rats. J Neurophysiol. 2009:101:1073–1088. [DOI] [PMC free article] [PubMed] [Google Scholar]
- Carlson KS, Dillione M, Wesson DW. Odor- and state-dependent olfactory tubercle local field potential dynamics in awake rats. J Neurophysiol. 2014:111:2109–2123. [DOI] [PubMed] [Google Scholar]
- Carlson KS, Gadziola MA, Dauster ES, Wesson DW. Selective attention controls olfactory decisions and the neural encoding of odors. Curr Biol. 2018:28:2195–2205.e4. [DOI] [PMC free article] [PubMed] [Google Scholar]
- Cenier T, McGann JP, Tsuno Y, Verhagen JV, Wachowiak M. Testing the sorption hypothesis in olfaction: a limited role for sniff strength in shaping primary odor representations during behavior. J Neurosci. 2013:33:79–92. [DOI] [PMC free article] [PubMed] [Google Scholar]
- Chaudhury D, Escanilla O, Linster C. Bulbar acetylcholine enhances neural and perceptual odor discrimination. J Neurosci. 2009:29:52–60. [DOI] [PMC free article] [PubMed] [Google Scholar]
- Clarke S, Trowill JA. Sniffing and motivated behavior in the rat. Physiol Behav. 1971:6:49–52. [DOI] [PubMed] [Google Scholar]
- Colgin LL. Mechanisms and functions of theta rhythms. Annu Rev Neurosci. 2013:36:295–312. [DOI] [PubMed] [Google Scholar]
- Corbetta M. Frontoparietal cortical networks for directing attention and the eye to visual locations: identical, independent, or overlapping neural systems? Proc Natl Acad Sci U S A. 1998:95:831–838. [DOI] [PMC free article] [PubMed] [Google Scholar]
- Courtiol E, Wilson DA. Neural representation of odor-guided behavior in the rat olfactory thalamus. J Neurosci. 2016:36:5946–5960. [DOI] [PMC free article] [PubMed] [Google Scholar]
- D’Souza RD, Vijayaraghavan S. Paying attention to smell: cholinergic signaling in the olfactory bulb. Front Synaptic Neurosci. 2014:6:21. [DOI] [PMC free article] [PubMed] [Google Scholar]
- De Falco E, An L, Sun N, Roebuck A, Greba Q, Lapish C, Howland J. The rat medial prefrontal cortex exhibits flexible neural activity states during the performance of an odor span task. eNeuro. 2019:6(2):ENEURO.0424-18.2019. [DOI] [PMC free article] [PubMed] [Google Scholar]
- Denardo LA, Berns DS, Deloach K, Luo L. Connectivity of mouse somatosensory and prefrontal cortex examined with trans-synaptic tracing. Nat Neurosci. 2015:18:1687–1697. [DOI] [PMC free article] [PubMed] [Google Scholar]
- Devore S, Linster C. Noradrenergic and cholinergic modulation of olfactory bulb sensory processing. Front. Behav Neurosci. 2012:6:52. [DOI] [PMC free article] [PubMed] [Google Scholar]
- Devoto P, Flore G, Saba P, Fà M, Gessa GL. Stimulation of the locus coeruleus elicits noradrenaline and dopamine release in the medial prefrontal and parietal cortex. J Neurochem. 2005:92:368–374. [DOI] [PubMed] [Google Scholar]
- Ding DCD, Gabbott PLA, Totterdell S. Differences in the laminar origin of projections from the medial prefrontal cortex to the nucleus accumbens shell and core regions in the rat. Brain Res. 2001:917:81–89. [DOI] [PubMed] [Google Scholar]
- Eeckman FH, Freeman WJ. Correlations between unit firing and EEG in the rat olfactory system. Brain Res. 1990:528:238–244. [DOI] [PubMed] [Google Scholar]
- Erö C, Gewaltig MO, Keller D, Markram H. A cell atlas for the mouse brain. Front Neuroinform. 2018:12:84. [DOI] [PMC free article] [PubMed] [Google Scholar]
- Fiebelkorn IC, Kastner S. A rhythmic theory of attention. Trends Cogn Sci. 2019:23:87. [DOI] [PMC free article] [PubMed] [Google Scholar]
- Fontanini A, Bower JM. Slow-waves in the olfactory system: an olfactory perspective on cortical rhythms. Trends Neurosci. 2006:29:429–437. [DOI] [PubMed] [Google Scholar]
- Fries P. Rhythms for cognition: communication through coherence. Neuron. 2015:88:220–235. [DOI] [PMC free article] [PubMed] [Google Scholar]
- Fries P, Reynolds JH, Rorie AE, Desimone R. Modulation of oscillatory neuronal synchronization by selective visual attention. Science (80-). 2001:291:1560–1563. [DOI] [PubMed] [Google Scholar]
- Gabbott PLA, Warner TA, Jays PRL, Salway P, Busby SJ. Prefrontal cortex in the rat: projections to subcortical autonomic, motor, and limbic centers. J Comp Neurol. 2005:492:145–177. [DOI] [PubMed] [Google Scholar]
- Gill TM, Sarter M, Givens B. Sustained visual attention performance-associated prefrontal neuronal activity: evidence for cholinergic modulation. J Neurosci. 2000:20(12):4745–57. [DOI] [PMC free article] [PubMed] [Google Scholar]
- Gnaedinger A, Gurden H, Gourévitch B, Martin C. Multisensory learning between odor and sound enhances beta oscillations. Sci Rep. 2019:9:11236. [DOI] [PMC free article] [PubMed] [Google Scholar]
- Gottfried JA. Central mechanisms of odour object perception. Nat Rev Neurosci. 2010:11:628–641. [DOI] [PMC free article] [PubMed] [Google Scholar]
- Halabisky B, Strowbridge BW. Gamma-frequency excitatory input to granule cells facilitates dendrodendritic inhibition in the rat olfactory bulb. J Neurophysiol. 2003:90:644–654. [DOI] [PubMed] [Google Scholar]
- Halassa MM, Kastner S. Thalamic functions in distributed cognitive control. Nat Neurosci. 2017:20:1669–1679. [DOI] [PubMed] [Google Scholar]
- Hardung S, Epple R, Jäckel Z, Eriksson D, Uran C, Senn V, Gibor L, Yizhar O, Diester I. A functional gradient in the rodent prefrontal cortex supports behavioral inhibition. Curr Biol. 2017:27(4):549–555. [DOI] [PubMed] [Google Scholar]
- Herman AM, Ortiz-Guzman J, Kochukov M, Herman I, Quast KB, Patel JM, Tepe B, Carlson JC, Ung K, Selever J, et al. A cholinergic basal forebrain feeding circuit modulates appetite suppression. Nature. 2016:538:253–256. [DOI] [PMC free article] [PubMed] [Google Scholar]
- Himmelheber AM, Sarter M, Bruno JP. Increases in cortical acetylcholine release during sustained attention performance in rats. Cogn Brain Res. 2000:9:313–325. [DOI] [PubMed] [Google Scholar]
- Hoover WB, Vertes RP. Anatomical analysis of afferent projections to the medial prefrontal cortex in the rat. Brain Struct Funct. 2007:212:149–179. [DOI] [PubMed] [Google Scholar]
- Ikemoto S. Involvement of the olfactory tubercle in cocaine reward: intracranial self-administration studies. J Neurosci. 2003:23:9305–9311. [DOI] [PMC free article] [PubMed] [Google Scholar]
- Ikemoto S, Panksepp J. The relationship between self-stimulation and sniffing in rats: does a common brain system mediate these behaviors? Behav Brain Res. 1994:61:143–162. [DOI] [PubMed] [Google Scholar]
- Izquierdo A. Functional heterogeneity within rat orbitofrontal cortex in reward learning and decision making. J Neurosci. 2017:37:10529–10540. [DOI] [PMC free article] [PubMed] [Google Scholar]
- Jensen O, Colgin LL. Cross-frequency coupling between neuronal oscillations. Trends Cogn Sci. 2007:11:267–269. [DOI] [PubMed] [Google Scholar]
- Jordan R, Fukunaga I, Kollo M, Schaefer AT. Active sampling state dynamically enhances olfactory bulb odor representation. Neuron. 2018:98(6):1214–1228.e5. [DOI] [PMC free article] [PubMed] [Google Scholar]
- Kay LM. Two species of gamma oscillations in the olfactory bulb: dependence on behavioral state and synaptic interactions. J Integr Neurosci. 2003:2:31–44. [DOI] [PubMed] [Google Scholar]
- Kay L, Freeman W. Bidirectional processing in the olfactory-limbic axis during olfactory behavior. Behav Neurosci. 1998:112:541–553. [DOI] [PubMed] [Google Scholar]
- Kay LM, Laurent G. Odor- and context-dependent modulation of mitral cell activity in behaving rats. Nat Neurosci. 1999:2:1003–1009. [DOI] [PubMed] [Google Scholar]
- Kay LM, Sherman SM. An argument for an olfactory thalamus. Trends Neurosci. 2006:30:47–53. [DOI] [PubMed] [Google Scholar]
- Kay LM, Beshel J, Brea J, Martin C, Rojas-Líbano D, Kopell N. Olfactory oscillations: the what, how and what for. Trends Neurosci. 2009:32:207–214. [DOI] [PMC free article] [PubMed] [Google Scholar]
- Kepecs A, Uchida N, Mainen ZF. Rapid and precise control of sniffing during olfactory discrimination in rats. J Neurophysiol. 2007:98:205–213. [DOI] [PubMed] [Google Scholar]
- Kim H, Ährlund-Richter S, Wang X, Deisseroth K, Carlén M. Prefrontal parvalbumin neurons in control of attention. Cell. 2016:164:208–218. [DOI] [PMC free article] [PubMed] [Google Scholar]
- de Kloet SF, Bruinsma B, Terra H, Heistek TS, Passchier EMJ, van den Berg AR, Luchicchi A, Min R, Pattij T, Mansvelder HD. Bi-directional regulation of cognitive control by distinct prefrontal cortical output neurons to thalamus and striatum. Nat Commun. 2021:12:1994. [DOI] [PMC free article] [PubMed] [Google Scholar]
- Kopell N, Ermentrout GB, Whittington MA, Traub RD. Gamma rhythms and beta rhythms have different synchronization properties. Proc Natl Acad Sci U S A. 2000:97:1867–1872. [DOI] [PMC free article] [PubMed] [Google Scholar]
- Lakatos P, Karmos G, Mehta AD, Ulbert I, Schroeder CE. Entrainment of neuronal oscillations as a mechanism of attentional selection. Science (80-). 2008:320:110–113. [DOI] [PubMed] [Google Scholar]
- Lakatos P, Gross J, Thut G. A new unifying account of the roles of neuronal entrainment. Curr Biol. 2019:29:R890–R905. [DOI] [PMC free article] [PubMed] [Google Scholar]
- Laubach M, Amarante LM, Swanson TK, White SR. What, if anything, is rodent prefrontal cortex? eNeuro. 2018:5(5):ENEURO.0315-18.2018. [DOI] [PMC free article] [PubMed] [Google Scholar]
- Le Merre P, Ährlund-Richter S, Carlén M. The mouse prefrontal cortex: Unity in diversity. Neuron. 2021:109:1925–1944. [DOI] [PubMed] [Google Scholar]
- Lefèvre L, Courtiol E, Garcia S, Thévenet M, Messaoudi B, Buonviso N. Significance of sniffing pattern during the acquisition of an olfactory discrimination task. Behav Brain Res. 2016:312:341–354. [DOI] [PubMed] [Google Scholar]
- Lepousez G, Lledo P-M. Odor discrimination requires proper olfactory fast oscillations in awake mice. Neuron. 2013:80:1010–1024. [DOI] [PubMed] [Google Scholar]
- Ljubojevic V, Luu P, Gill PR, Beckett L-A, Takehara-Nishiuchi K, De Rosa E. Cholinergic modulation of Frontoparietal cortical network dynamics supporting supramodal attention. J Neurosci. 2018:38:3988–4005. [DOI] [PMC free article] [PubMed] [Google Scholar]
- Losacco J, Ramirez-Gordillo D, Gilmer J, Restrepo D. Learning improves decoding of odor identity with phase-referenced oscillations in the olfactory bulb. elife. 2020:9:e52583. [DOI] [PMC free article] [PubMed] [Google Scholar]
- Luchicchi A, Mnie-Filali O, Terra H, Bruinsma B, de Kloet SF, Obermayer J, Heistek TS, de Haan R, de Kock CPJ, Deisseroth K, et al. Sustained attentional states require distinct temporal involvement of the dorsal and ventral medial prefrontal cortex. Front Neural Circuits. 2016:10:70. [DOI] [PMC free article] [PubMed] [Google Scholar]
- Mably AJ, Colgin LL. Gamma oscillations in cognitive disorders. Curr Opin Neurobiol. 2018:52:182–187. [DOI] [PMC free article] [PubMed] [Google Scholar]
- Macrides F. Temporal relationships between hippocampal slow waves and exploratory sniffing in hamsters. Behav Biol. 1975:14:295–308. [DOI] [PubMed] [Google Scholar]
- Macrides F, Eichenbaum HB, Forbes WB. Temporal relationship between sniffing and the limbic theta rhythm during odor discrimination reversal learning. J Neurosci. 1982:2:1705–1711. [DOI] [PMC free article] [PubMed] [Google Scholar]
- Marquis J-P, Killcross S, Haddon JE. Inactivation of the prelimbic, but not infralimbic, prefrontal cortex impairs the contextual control of response conflict in rats. Eur J Neurosci. 2007:25:559–566. [DOI] [PubMed] [Google Scholar]
- Martin C, Ravel N. Beta and gamma oscillatory activities associated with olfactory memory tasks: different rhythms for different functional networks? Front Behav Neurosci. 2014:8:218. [DOI] [PMC free article] [PubMed] [Google Scholar]
- Martiros N, Kim SE, Kapoor V, Murthy VN. Distinct representation of cue-outcome association by D1 and D2 neurons in the olfactory striatum. bioRxiv. 2021. 10.1101/2021.11.01.466363. [DOI] [PMC free article] [PubMed] [Google Scholar]
- McAlonan K, Cavanaugh J, Wurtz RH. Guarding the gateway to cortex with attention in visual thalamus. Nature. 2008:456:391–394. [DOI] [PMC free article] [PubMed] [Google Scholar]
- McCormick DA, Feeser HR. Functional implications of burst firing and single spike activity in lateral geniculate relay neurons. Neuroscience. 1990:39:103–113. [DOI] [PubMed] [Google Scholar]
- McLean JH, Shipley MT, Nickell WT, Aston-Jones G, Reyher CK. Chemoanatomical organization of the noradrenergic input from locus coeruleus to the olfactory bulb of the adult rat. J Comp Neurol. 1989:285:339–349. [DOI] [PubMed] [Google Scholar]
- Miller EK, Cohen JD. An integrative theory of prefrontal cortex function. Annu Rev Neurosci. 2001:24:167–202. [DOI] [PubMed] [Google Scholar]
- Mitra P, Bokil H. Observed brain dynamics. New York: Oxford University Press. 2008. [Google Scholar]
- Miura K, Mainen ZF, Uchida N. Odor representations in olfactory cortex: distributed rate coding and decorrelated population activity. Neuron. 2012:74:1087–1098. [DOI] [PMC free article] [PubMed] [Google Scholar]
- Moberly AH, Schreck M, Bhattarai JP, Zweifel LS, Luo W, Ma M. Olfactory inputs modulate respiration-related rhythmic activity in the prefrontal cortex and freezing behavior. Nat Commun. 2018:9:1528. [DOI] [PMC free article] [PubMed] [Google Scholar]
- Murata K, Kanno M, Ieki N, Mori K, Yamaguchi M. Mapping of learned odor-induced motivated behaviors in the mouse olfactory tubercle. J Neurosci. 2015:35:10581–10599. [DOI] [PMC free article] [PubMed] [Google Scholar]
- Nakayama H, Ibañez-Tallon I, Heintz N. Cell-type-specific contributions of medial prefrontal neurons to flexible behaviors. J Neurosci. 2018:38:4490–4504. [DOI] [PMC free article] [PubMed] [Google Scholar]
- Neville KR, Haberly LB. Beta and gamma oscillations in the olfactory system of the urethane-anesthetized rat. J Neurophysiol. 2003:90:3921–3930. [DOI] [PubMed] [Google Scholar]
- O’Connor D, Fukui M, Pinsk M, Kastner S. Attention modulates responses in the human lateral geniculate nucleus. Nat Neurosci. 2002:5:1203–1209. [DOI] [PubMed] [Google Scholar]
- Ogg MC, Ross JM, Bendahmane M, Fletcher ML. Olfactory bulb acetylcholine release dishabituates odor responses and reinstates odor investigation. Nat Commun. 2018:9:1868. [DOI] [PMC free article] [PubMed] [Google Scholar]
- Osinski BL, Kim A, Xiao W, Mehta NM, Kay LM. Pharmacological manipulation of the olfactory bulb modulates beta oscillations: testing model predictions. J Neurophysiol. 2018:120(3):1090–1106. [DOI] [PMC free article] [PubMed] [Google Scholar]
- Passetti F, Dalley JW, O’connell MT, Everitt BJ, Robbins TW. Increased acetylcholine release in the rat medial prefrontal cortex during performance of a visual attentional task. Eur J Neurosci. 2000:12(8):3051–8. [DOI] [PubMed] [Google Scholar]
- Paxinos G, Watson C. The rat brain in stereotaxic coordinates. 3rd ed. San Diego: Academic Press; 1997. [Google Scholar]
- Perl O, Ravia A, Rubinson M, Eisen A, Soroka T, Mor N, Secundo L, Sobel N. Human non-olfactory cognition phase-locked with inhalation. Nat Hum Behav. 2019:353:501–512. [DOI] [PubMed] [Google Scholar]
- Plailly J, Howard JD, Gitelman DR, Gottfried JA. Attention to odor modulates thalamocortical connectivity in the human brain. J Neurosci. 2008:28:5257–5267. [DOI] [PMC free article] [PubMed] [Google Scholar]
- Posner MI. Orienting of attention: then and now. Q J Exp Psychol (Hove). 2016:69:1864. [DOI] [PMC free article] [PubMed] [Google Scholar]
- Posner MI, Snyder CR, Davidson BJ. Attention and the detection of signals. J Exp Psychol Gen. 1980:32(1):3–25. [PubMed] [Google Scholar]
- Ragozzino ME, Kim J, Hassert D, Minniti N, Kiang C. The contribution of the rat prelimbic-infralimbic areas to different forms of task switching. Behav Neurosci. 2003:117(5):1054–1065. [DOI] [PubMed] [Google Scholar]
- Richter CG, Thompson WH, Bosman CA, Fries P. Top-down beta enhances bottom-up gamma. J Neurosci. 2017:37(28):6698–6711. [DOI] [PMC free article] [PubMed] [Google Scholar]
- Rikhye RV, Gilra A, Halassa MM. Thalamic regulation of switching between cortical representations enables cognitive flexibility. Nat Neurosci. 2018:21(12):1753–1763. [DOI] [PMC free article] [PubMed] [Google Scholar]
- Rizzolatti G, Riggio L, Dascola I, Umiltá C. Reorienting attention across the horizontal and vertical meridians: evidence in favor of a premotor theory of attention. Neuropsychologia. 1987:25(1):31–40. [DOI] [PubMed] [Google Scholar]
- Rodgers CC, DeWeese MR. Neural correlates of task switching in prefrontal cortex and primary auditory cortex in a novel stimulus selection task for rodents. Neuron. 2014:82:1157–1170. [DOI] [PubMed] [Google Scholar]
- Rojas-Líbano D, Kay LM. Interplay between sniffing and odorant sorptive properties in the rat. J Neurosci. 2012:32:15577–15589. [DOI] [PMC free article] [PubMed] [Google Scholar]
- Rolls ET. The functions of the orbitofrontal cortex. Brain Cogn. 2004:55:11–29. [DOI] [PubMed] [Google Scholar]
- Rothermel M, Carey RM, Puche A, Shipley MT, Wachowiak M. Cholinergic inputs from basal forebrain add an excitatory bias to odor coding in the olfactory bulb. J Neurosci. 2014:34:4654–4664. [DOI] [PMC free article] [PubMed] [Google Scholar]
- Sacchet MD, LaPlante RA, Wan Q, Pritchett DL, Lee AKC, Hämäläinen M, Moore CI, Kerr CE, Jones SR. Attention drives synchronization of alpha and beta rhythms between right inferior frontal and primary sensory neocortex. J Neurosci. 2015:35(5):2074–82. [DOI] [PMC free article] [PubMed] [Google Scholar]
- Samuelsen CL, Gardner MPH, Fontanini A. Thalamic contribution to cortical processing of taste and expectation. J Neurosci. 2013:33:1815–1827. [DOI] [PMC free article] [PubMed] [Google Scholar]
- Santana N, Artigas F. Laminar and cellular distribution of monoamine receptors in rat medial prefrontal cortex. Front Neuroanat. 2017:11:87. [DOI] [PMC free article] [PubMed] [Google Scholar]
- Sara SJ. The locus coeruleus and noradrenergic modulation of cognition. Nat Rev Neurosci. 2009:10(3):211–223. [DOI] [PubMed] [Google Scholar]
- Schmitt LI, Wimmer RD, Nakajima M, Happ M, Mofakham S, Halassa MM. Thalamic amplification of cortical connectivity sustains attentional control. Nature. 2017:545:219–223. [DOI] [PMC free article] [PubMed] [Google Scholar]
- Schoenbaum G, Roesch MR, Stalnaker TA, Takahashi YK. A new perspective on the role of the orbitofrontal cortex in adaptive behaviour. Nat Rev Neurosci. 2009:10:885–892. [DOI] [PMC free article] [PubMed] [Google Scholar]
- Schoppa NE. Synchronization of olfactory bulb mitral cells by precisely timed inhibitory inputs. Neuron. 2006:49:271–283. [DOI] [PubMed] [Google Scholar]
- Schroeder CE, Lakatos P. The gamma oscillation: master or slave? Brain Topogr. 2009a:22:24–26. [DOI] [PMC free article] [PubMed] [Google Scholar]
- Schroeder CE, Lakatos P. Low-frequency neuronal oscillations as instruments of sensory selection. Trends Neurosci. 2009b:32:9–18. [DOI] [PMC free article] [PubMed] [Google Scholar]
- Sesack SR, Deutch AY, Roth RH, Bunney BS. Topographical organization of the efferent projections of the medial prefrontal cortex in the rat: an anterograde tract-tracing study with Phaseolus vulgaris leucoagglutinin. J Comp Neurol. 1989:290:213–242. [DOI] [PubMed] [Google Scholar]
- Shusterman R, Smear MC, Koulakov AA, Rinberg D. Precise olfactory responses tile the sniff cycle. Nat Neurosci. 2011:14:1039–1044. [DOI] [PubMed] [Google Scholar]
- Siegle JH, Pritchett DL, Moore CI. Gamma-range synchronization of fast-spiking interneurons can enhance detection of tactile stimuli. Nat Neurosci. 2014:17(10):1371–9. [DOI] [PMC free article] [PubMed] [Google Scholar]
- Small DM, Zatorre RJ, Dagher A, Evans AC, Jones-Gotman M. Changes in brain activity related to eating chocolate: from pleasure to aversion. Brain. 2001:124:1720–1733. [DOI] [PubMed] [Google Scholar]
- Sobel EC, Tank DW. Timing of odor stimulation does not alter patterning of olfactory bulb unit activity in freely breathing rats. J Neurophysiol. 1993:69:1331–1337. [DOI] [PubMed] [Google Scholar]
- Spellman T, Svei M, Kaminsky J, Manzano-Nieves G, Liston C. Prefrontal deep projection neurons enable cognitive flexibility via persistent feedback monitoring. Cell. 2021:184:2750–2766.e17. [DOI] [PMC free article] [PubMed] [Google Scholar]
- Spence C, Kettenmann B, Kobal G, McGlone FP. Selective attention to the chemosensory modality. Percept Psychophys. 2000:62:1265–1271. [DOI] [PubMed] [Google Scholar]
- Spitzer B, Haegens S. Beyond the status quo: a role for beta oscillations in endogenous content (re)activation. eNeuro. 2017:4:ENEURO.0170-17.2017. [DOI] [PMC free article] [PubMed] [Google Scholar]
- Spors H, Wachowiak M, Cohen LB, Friedrich RW. Temporal dynamics and latency patterns of receptor neuron input to the olfactory bulb. J Neurosci. 2006:26:1247–1259. [DOI] [PMC free article] [PubMed] [Google Scholar]
- Thompson KG, Biscoe KL, Sato TR. Neuronal basis of covert spatial attention in the frontal eye field. J Neurosci. 2005:25(41):9479–87. [DOI] [PMC free article] [PubMed] [Google Scholar]
- Tort A, Komorowski R, Eichenbaum H, Kopell N. Measuring phase-amplitude coupling between neuronal oscillations of different frequencies. J Neurophysiol. 2010:104:1195–1210. [DOI] [PMC free article] [PubMed] [Google Scholar]
- Tort ABL, Brankačk J, Draguhn A. Respiration-entrained brain rhythms are global but often overlooked. Trends Neurosci. 2018a:41(4):186–197. [DOI] [PubMed] [Google Scholar]
- Tort ABL, Ponsel S, Jessberger J, Yanovsky Y, Brankačk J, Draguhn A. Parallel detection of theta and respiration-coupled oscillations throughout the mouse brain. Sci Rep. 2018b:8(1):6432. [DOI] [PMC free article] [PubMed] [Google Scholar]
- Uchida N, Mainen ZF. Speed and accuracy of olfactory discrimination in the rat. Nat Neurosci. 2003:6:1224–1229. [DOI] [PubMed] [Google Scholar]
- Uchida N, Kepecs A, Mainen ZF. Seeing at a glance, smelling in a whiff: rapid forms of perceptual decision making. Nat Rev Neurosci. 2006:7:485–491. [DOI] [PubMed] [Google Scholar]
- Vanderwolf CH. Hippocampal activity, olfaction, and sniffing: an olfactory input to the dentate gyrus. Brain Res. 1992:593:197–208. [DOI] [PubMed] [Google Scholar]
- VanRullen R. Perceptual cycles. Trends Cogn Sci. 2016:20:723–735. [DOI] [PubMed] [Google Scholar]
- Varga AG, Wesson DW. Distributed auditory sensory input within the mouse olfactory cortex. Eur J Neurosci. 2013:37:564–571. [DOI] [PubMed] [Google Scholar]
- Verhagen JV, Wesson DW, Netoff TI, White JA, Wachowiak M. Sniffing controls an adaptive filter of sensory input to the olfactory bulb. Nat Neurosci. 2007:10:631–639. [DOI] [PubMed] [Google Scholar]
- Vertes RP. Differential projections of the infralimbic and prelimbic cortex in the rat. Synapse. 2004:51:32–58. [DOI] [PubMed] [Google Scholar]
- Vinck M, Womelsdorf T, Buffalo EA, Desimone R, Fries P. Attentional modulation of cell-class-specific gamma-band synchronization in awake monkey area V4. Neuron. 2013:80:1077–1089. [DOI] [PMC free article] [PubMed] [Google Scholar]
- Wang XJ. Neurophysiological and computational principles of cortical rhythms in cognition. Physiol Rev. 2010:90(3):1195–1268. [DOI] [PMC free article] [PubMed] [Google Scholar]
- Wang P, Boboila C, Chin M, Higashi-Howard A, Shamash P, Wu Z, Stein N, Abbott L, Axel R. Transient and persistent representations of odor value in prefrontal cortex. Neuron. 2020:108:209–224.e6. [DOI] [PMC free article] [PubMed] [Google Scholar]
- Welker WI. Analysis of sniffing in the albino rat. Behav Ther. 1964:22:223–244. [Google Scholar]
- Wesson DW. Sniffing behavior communicates social hierarchy. Curr Biol. 2013:23:575–580. [DOI] [PubMed] [Google Scholar]
- Wesson DW. The tubular striatum. J Neurosci. 2020:40:7379–7386. [DOI] [PMC free article] [PubMed] [Google Scholar]
- Wesson DW, Wilson DA. Smelling sounds: olfactory-auditory sensory convergence in the olfactory tubercle. J Neurosci. 2010:30:3013–3021. [DOI] [PMC free article] [PubMed] [Google Scholar]
- Wesson DW, Donahou TN, Johnson MO, Wachowiak M. Sniffing behavior of mice during performance in odor-guided tasks. Chem Senses. 2008:33:581–596. [DOI] [PMC free article] [PubMed] [Google Scholar]
- Wesson DW, Verhagen JV, Wachowiak M. Why sniff fast? The relationship between sniff frequency, odor discrimination, and receptor neuron activation in the rat. J Neurophysiol. 2009:101:1089–1102. [DOI] [PMC free article] [PubMed] [Google Scholar]
- Wimmer RD, Schmitt LI, Davidson TJ, Nakajima M, Deisseroth K, Halassa MM. Thalamic control of sensory selection in divided attention. Nature. 2015:526:705–709. [DOI] [PMC free article] [PubMed] [Google Scholar]
- Youngentob SL, Mozell MM, Sheehe PR, Hornung DE. A quantitative analysis of sniffing strategies in rats performing odor discrimination tasks. Physiol Behav. 1987:41:59–69. [DOI] [PubMed] [Google Scholar]
- Yu AJ, Dayan P. Uncertainty, neuromodulation, and attention. Neuron. 2005:46:681–692. [DOI] [PubMed] [Google Scholar]
- Zaborszky L, Carlsen J, Brashear HR, Heimer L. Cholinergic and GABAergic afferents to the olfactory bulb in the rat with special emphasis on the projection neurons in the nucleus of the horizontal limb of the diagonal band. J Comp Neurol. 1986:243:488–509. [DOI] [PubMed] [Google Scholar]
- Zelano C, Bensafi M, Porter J, Mainland J, Johnson B, Bremner E, Telles C, Khan R, Sobel N. Attentional modulation in human primary olfactory cortex. Nat Neurosci. 2005:8:114–120. [DOI] [PubMed] [Google Scholar]
- Zhang Z, Liu Q, Wen P, Zhang J, Rao X, Zhou Z, Zhang H, He X, Li J, Zhou Z, et al. Activation of the dopaminergic pathway from VTA to the medial olfactory tubercle generates odor-preference and reward. elife. 2017:6:e25423. [DOI] [PMC free article] [PubMed] [Google Scholar]
- Zhang Z, Collins DC, Maier JX. Network dynamics in the developing piriform cortex of unanesthetized rats. Cereb Cortex. 2021:31(2):1334–1346. [DOI] [PMC free article] [PubMed] [Google Scholar]
- Zhong W, Ciatipis M, Wolfenstetter T, Jessberger J, Müller C, Ponsel S, Yanovsky Y, Brankačk J, Tort ABL, Draguhn A. Selective entrainment of gamma subbands by different slow network oscillations. Proc Natl Acad Sci U S A. 2017:114(17):4519–4524. [DOI] [PMC free article] [PubMed] [Google Scholar]
Associated Data
This section collects any data citations, data availability statements, or supplementary materials included in this article.