

Summary
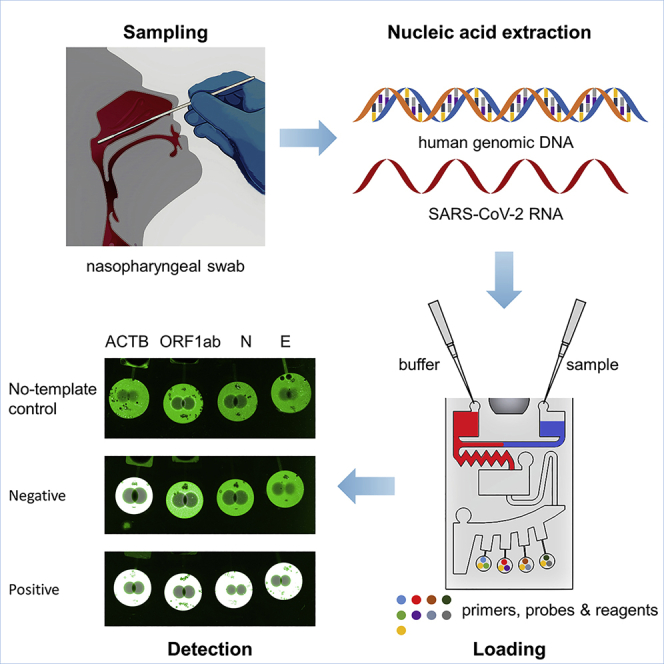
The COVID-19 pandemic has spread worldwide, and rapid detection of the SARS-CoV-2 virus is crucial for infection surveillance and epidemic control. This study developed a centrifugal microfluidics-based multiplex reverse transcription recombinase polymerase amplification (RT-RPA) assay for endpoint fluorescence detection of the E, N, and ORF1ab genes of SARS-CoV-2. The microscope slide-shaped microfluidic chip could simultaneously accomplish three target genes and one reference human gene (i.e., ACTB) RT-RPA reactions in 30 min, and the sensitivity was 40 RNA copies/reaction for the E gene, 20 RNA copies/reaction for the N gene, and 10 RNA copies/reaction for the ORF1ab gene. The chip demonstrated high specificity, reproducibility, and repeatability. Chip performance was also evaluated using real clinical samples. Thus, this rapid, accurate, on-site, and multiplexed nucleic acid test microfluidic chip would significantly contribute to detecting patients with COVID-19 in low-resource settings and point-of-care testing (POCT) and, in the future, could be used to detect emerging new variants of SARS-CoV-2.
Subject areas: Biological sciences, Biotechnology, Fluidics, Nucleic acids
Graphical abstract
Highlights
-
•
Equations for the capillary valve burst frequency were calculated and verified
-
•
Spin-coated HPMC films were used for hydrophilic modification of the chip surface
-
•
The microscope slide-shaped microfluidic chip could accomplish reactions in 30 min
-
•
The chip could detect three SARS-CoV-2 target genes and one reference gene at once
Biological sciences; Biotechnology; Fluidics; Nucleic acids
Introduction
Severe acute respiratory syndrome coronavirus 2 (SARS-CoV-2) is a highly contagious virus that causes a respiratory disease called COVID-19.1,2,3 As of September 13, 2022, more than 606 million cases were confirmed as COVID-19 worldwide, including 6.4 million deaths.4 Constantly discovered new variants, such as omicron, have stronger infectivity and immune evasion capabilities, posing a considerable challenge to global anti-epidemic efforts.5,6,7 Rapid identification and isolation of infected cases are key to controlling the epidemic.
The real-time RT-PCR assay is currently the most commonly used nucleic acid amplification method for identifying SARS-CoV-2 and has been recommended by the World Health Organization (WHO) as the gold standard for diagnosis.8,9 PCR is highly specific and sensitive but is time-consuming and requires highly specialized equipment and skilled technicians. To address detection requirements in settings with scarce resources or point-of-care testing (POCT), isothermal nucleic acid amplification methods have been developed as PCR alternatives.10 Among the existing isothermal amplification technologies, recombinase polymerase amplification (RPA) has attracted much attention due to its simplicity, high sensitivity as PCR, breakneck amplification speed, no need to use multiple primers, and low amplification temperature.11,12 RPA can be monitored in real-time (during amplification) or by endpoint detection (post-amplification), the latter of which does not require sophisticated detection equipment and can interpret the results even with the naked eye.13,14 Moreover, multi-gene testing is crucial for detecting SARS-CoV-2 because of the increasing number of widespread variants. However, mutations presented in some variants might lead to false amplification in some molecular assays.15,16 The probability of detecting false negatives can be minimized by multi-gene testing and targeting the most highly conserved regions of the viral genome.17 However, conventional RPA reactions risk aerosol contamination, detect only one gene target at a time, and require multiple manual steps, hindering its widespread application in POCT.18,19
Microfluidics can overcome these limitations by integrating multiple programs into a miniaturized enclosed chip, enabling high-throughput analysis while avoiding cross-contamination and leakage.20,21 Various microfluidic RPA platforms have been developed to detect viruses and bacteria. Xu et al. demonstrated an ultraportable and versatile POCT platform termed POCKET (point-of-care kit for the entire test) to analyze multiple types of DNA in different fields based on injection pump driving force.22 Liu et al. developed a microfluidic-integrated lateral flow RPA assay to detect SARS-CoV-2. This easy-to-use microfluidic chip can detect COVID-19 quickly and accurately without expensive equipment or specialized personnel training, but only one gene target at a time.23 Compared with the previously mentioned platform, centrifugal microfluidic platforms can simply utilize the centrifugal force to mix, meter, split, and aliquot the liquid24 without sophisticated pump systems for fluidic control. It has been widely used in developing POCT devices to provide rapid, accurate, and multiple detections of pathogens.25,26,27,28,29,30 For example, Choi et al. developed a centrifugal direct RPA microdevice for multiplex and real-time detection of food poisoning bacteria. It can perform twelve reactions simultaneously due to its symmetrical functional units.31 Chen et al. built a centrifugal chip merged with a custom-made instrument to detect multiple bacteria directly from urine samples. The entire process is carried out on a fully sealed chip with a high degree of automation, which increases the reaction speed and reduces the risk of contamination.32
Polymethyl methacrylate (PMMA) is a common organic material for making microchips due to its significant advantages, such as cheapness, robustness, low background fluorescence, transparency, and biocompatibility.23,26,32,33,34 However, because of the relatively high contact angle of the native PMMA substrate, it is virtually impossible to use the capillary force-driven siphons on microfluidic chips.35 Therefore, surface modification of chip substrates seems particularly necessary. Different from the main surface modification methods such as plasma,36 UV,37 corona,38 wet chemistry,39 etc., spin coating of hydrophilic polymer films is a better option, with the advantages of short time-consuming, low cost, high biocompatibility, and long duration of modification.40 Hydroxypropyl methylcellulose (HPMC) is a commonly used polymer material in the spin coating because of its good biocompatibility and reduced contact angle compared to native PMMA.41,42
In this work, a centrifugal microfluidics-based multiplex reverse transcription recombinase polymerase amplification (RT-RPA) assay was developed for rapid and accurate detection of SARS-CoV-2 in POCT. We first spin coated and deposited an HPMC film coating on the surface of PMMA substrates and characterized the hydrophilic surface modification results. Capillary valves are critical fluid control structures in centrifugal microfluidics, and predicting valve burst frequency is also crucial for centrifugal parameter design. Here, we presented three numerical equations and validated them with experiments. Second, based on our prior work43 and the study findings of Lillis et al.,44 we developed and assessed three off-chip RT-RPA assays targeting the E, N, and ORF1ab genes of SARS-CoV-2 in volumes of only 10 μL for chip usage. Finally, we created a microscope slide-shaped microfluidic chip to monitor three SARS-CoV-2 gene targets simultaneously. Most of the assay’s processes take place on the chip, eliminating aerosol contamination and human error, resulting in more reproducible and repeatable detections. It also includes symmetrical detection zones that can detect two samples at once. Therefore, it is no hyperbole to suggest that based on the RT-RPA method with endpoint fluorescence detection, this chip has much promise in dealing with COVID-19.
Results and discussion
Characterization of the hydrophilic surface modification
The HPMC film coating deposited on the surface of PMMA substrates was characterized. The contact angle was reduced from 72.3 ± 0.8° on the native plain PMMA wafer to 37.3 ± 0.9° after surface modification, which was suitable for capillary force-driven siphons on microfluidic chips. Hydrophobic recovery, which reflects a gradual increase in contact angle over time on modified polymer surfaces, is a well-known phenomenon.45 To investigate the stability of the modification, the contact angle of the modified PMMA surface was measured over time. The samples were stored in ambient clean room air at a temperature of 20°C and an average humidity of 60%. As indicated in Figure 1A, there was no substantial contact angle growth for more than six months. This durable contact angle stability implies that the current surface modification methods are excellent for microfluidic chips that require long-term storage for POCT applications. Compared with previous research reports,41 the modification method used in this study does not require UV irradiation or HNO3 acid rinse of the PMMA surface before coating HPMC, which significantly reduces the complexity of the operation and obtains similar hydrophilic effects. To ensure the long-term stability of the HPMC coatings, the coatings must be crosslinked.46 However, this process requires a lot of time and effort. The modification method described in this study avoids the crosslinking procedure, making the coating stable for up to 6 months.
Figure 1.

Characterization of the HPMC coatings
(A) Time-dependent variation of contact angles of HPMC-coated PMMA wafers at room temperature. Means (n = 5), and standard deviations.
(B) Dispersive, polar, and total surface free energy of plain PMMA and HPMC-coated PMMA wafers. Means (n = 3), and standard deviations.
(C) C and O elemental ratios of plain PMMA and HPMC-coated PMMA wafers. Means (n = 2), and standard deviations.
(D) 3D AFM images of plain PMMA (left) (roughness Rq = 1.6 nm) and HPMC-coated PMMA (right) (roughness Rq = 13.3 nm) wafers.
The effectiveness of surface modification is also shown by the significant increases in surface free energy and surface roughness that follow modification, leading to increased hydrophilicity.47,48,49 The OWRK (Owens, Wendt, Rable, and Kaelbe) method was used to calculate the surface free energy using the probe liquids' reported surface tensions and measured contact angles.50 The surface free energy of the modified surface was observed to be higher than that of the PMMA substrate, particularly in its polar component (Figure 1B). This result is due to the polymer being subjected to the HPMC coating deposition process that retunes the surface energy by adding hydroxyl (-OH) functional groups to the surface of the material.41 According to atomic force microscopy analysis, the modified PMMA wafers' surface roughness (Rq) increased from 1.6 ± 0.1 to 13.3 ± 2.7 nm. Figure 1D shows the surface topography evolution of PMMA before (left) and after (right) surface modification. The HPMC coating introduces nanoscale roughness on the polymer surface, which enables the modulation of hydrophilic properties.51
The elemental composition percentages of O and C for the two samples are presented in Figure 1C, and the X-ray photoelectron spectroscopy data reveal considerable variances in their chemical compositions. The greater elemental oxygen concentration on the HPMC film coating surface was due to the presence of hydroxyl groups in the chemical structure of HPMC.41 The thickness of the HPMC coating was 72.2 ± 7.5 nm, taken from five random areas on the wafer surface, indicating that spin coating produced a homogeneous layer. More importantly, the coating thickness barely influences the channel size because the designed chip channel height is less than 0.1 mm.
Calculation of capillary valve burst frequency
Valves are the most crucial components of any kind of fluid platform since they are critical structures in fluid control.52 The capillary valve is used in microfluidic platforms with hydrophilic surfaces. The surface tension force, which is developed when the cross-section of the channel suddenly expands, causes the capillary valve to stop the fluid flow. When the microfluidic platform begins to spin, the centrifugal force is applied to the fluid front opposite the barrier pressure. The centrifugal pressure is described by:
| (Equation 1) |
where ρ is the density of the liquid, ω is the angular velocity, is the average distance of the liquid from the center of rotation, Δr is the radial length of the liquid, and R1 and R2 represent the radial distance from the center of rotation to the liquid in the reservoir and the channel, respectively. As long as the centrifugal pressure (Pcent) is less than the capillary barrier pressure (Pcb), the liquid will not pass through the capillary valve. A critical point indicating the critical burst conditions reached when these two pressures balance each other53:
| (Equation 2) |
At this rotational speed, called the burst frequency, the centrifugal force will overcome the surface tension, causing the liquid to burst into the valve.
For capillary valves with axisymmetric cross-sections, the maximum capillary barrier pressure at the liquid front is given by53:
| (Equation 3) |
where γ is the liquid-air surface tension, θ is the contact angle, and Dh is the hydraulic diameter of the channel. Taking the above formulas together, the burst frequency can be solved from Equations 1, 2, and 3 as:
| (Equation 4) |
According to additional studies, the impact of channels with various cross-sections on the burst frequency is not negligible under the same hydraulic diameter. To account for this variance, the maximum capillary barrier pressure equation was modified as follows53:
| (Equation 5) |
where n = 1.08 for an equilateral triangular cross-section and n = 1.14 for a rectangular cross-section. Since we are using rectangular channels, Equations 1, 2, and 5 can be used to determine the burst frequency as:
| (Equation 6) |
The top wall of the channel has a different contact angle with the liquid than the bottom and side walls because the chip is sealed by pressure-sensitive adhesives. When there is a significant gap between the two angles, their effect on the maximum capillary barrier pressure cannot be ignored. Equation 3 can therefore be defined as follows:
| (Equation 7) |
where θt, θb, and θs are the contact angles of the liquid on the top, bottom, and side walls of the channel, H1 and W1 are the height and width of the channel, respectively, and H2 and W2 are the height and width of the capillary valve, respectively. Here, Equations 1, 2, and 7 can be used to solve for the burst frequency as follows:
| (Equation 8) |
To verify the calculation formula for burst frequency, we designed six capillary valves with different parameters in parallel and measured the burst frequency of each valve. The correlation between the measured and theoretical values calculated by Equations 4, 6, and 8 was compared, respectively. The results for each valve were plotted, as seen in Figure 2D, and the curve-fitting equations are also shown. The correlation coefficients (R2) values for Equations 4, 6, and 8 were 0.969, 0.957, and 0.959, respectively, demonstrating an excellent linear correlation between the theoretical burst frequency and the measured burst frequency. It should be noted that the slopes of the curve-fitting equations for Equations 4 and 8 (0.937 and 0.958, respectively) were nearly equal to 1, suggesting that their calculated results were close to the true ones. Equations 4 and 8 are the better choices for calculating capillary valve burst frequency.
Figure 2.

Results of the CD-based microfluidics
(A) The 3D structures of the microfluidic chip consisted of a PMMA disk and a pressure-sensitive adhesive layer.
(B) Schematics of the centrifugal microfluidics having six capillary valves in parallel.
(C) The custom-made device for centrifugation.
(D) The linear relationships between the measured burst frequency and the theoretical burst frequency in which the measured burst frequency was represented as means (n = 20) ± SDs. The theoretical values were calculated using Equation 4 (left), Equation 6 (middle), and Equation 8 (right). A standard regression line was generated based on 20 datasets.
Here, we presented three burst frequency numerical equations as a practical guide for capillary valve design. By tuning these parameters, namely fluid properties (density and surface tension), surface properties (contact angle), and geometry (depth, width, and distance from the CD center of channels and valves), we could obtain the desired burst frequency and achieve the desired fluid flow. We often used working spin speeds much higher than the capillary valve’s burst frequency in practical applications to achieve faster fluid flow rates. However, with serial capillary valves, we must accurately calculate the burst frequency of each valve to implement the stage control of the fluid by the design purpose. For example, in double serial capillary valves, the burst frequency of the first valve was calculated to be 1000 rpm, and the working spin speed could be much higher than 1000 rpm to obtain a faster fluid flow rate. However, if the calculated burst frequency of the second valve was 3000 rpm, then the spin speed at the first stage could only be less than 3000 rpm. This enabled stage control of the fluid rather than breaking both valves simultaneously. Alternately, by altering the second valve’s parameters, its burst frequency might be increased to more than 3000 rpm. By the aforementioned rules, the burst frequency of each capillary valve on the microscope slide microfluidic chip, calculated by Equation 8, was listed in Table S4. These data were used to guide the next centrifugation design. By mastering the capillary valve’s burst frequency, it was consequently simple to create a range of centrifugal microfluidic operations and to construct automated and integrated liquid handling procedures.
Evaluation of off-chip RT-RPA reactions
RPA reactions typically had a volume of 50 μL, which was too large to be used in microfluidic chips. To verify the performance of the low-volume (e.g., 10 μL) RT-RPA amplification reaction, off-chip studies using real-time fluorescence detection were carried out. The analytical sensitivity of RT-RPA assays targeting the N, E, and ORF1ab genes of SARS-CoV-2 was first determined using a panel of serially diluted RNA templates ranging from 105 to 100 copies/reaction in five replicates. Significant amplification of RNA concentrations from 105 to 102 copies/reaction was observed in all five RPA runs of each gene. In 2/5 runs for the N and ORF1ab RT-RPA assays, 101 RNA copies/reaction were detected, whereas in 1/5 runs for the E RT-RPA assay. None of the three RT-RPA assays showed amplification of RNA concentrations at 100 copies/reaction. Based on these results, the 95% detection probability of each assay was calculated using probit regression analysis for the N, E, and ORF1ab RT-RPA assays. As shown in Figure 3A, the analytical sensitivity of the E gene was 19.06 RNA copies/reaction (95% CI: 15.75–49.59), and that of the N gene and ORF1ab gene was 17.45 RNA copies/reaction (95% CI: 14.04–59.83).
Figure 3.

Evaluation of the sensitivity and specificity of off-chip real-time RT-RPA detection
(A) Probit regression analysis for the N (left), ORF1ab (left), and E (right) genes with their individual 95% confidence interval. The fraction positive was determined from five replicated reactions. The limit of detection with a 95% probability of detection was 17.45 copies/reaction for both the N and ORF1ab genes, and 19.06 copies/reaction for the E gene.
(B) Specificities of the E, N, and ORF1ab genes using the viral panel are listed in Table S3.
The analytical specificity of the RT-RPA assay was further tested with a coronavirus panel, as they are closely related viruses (Table S3). We also tested for some other respiratory viruses because their symptoms can easily be confused with COVID-19. No cross-reactivity with any tested viruses was found in the N and E RT-RPA assays, while the positive control for SARS-CoV-2 showed significant amplification. A large increase in the amplification signal of SARS-CoV was observed in the ORF1ab RT-RPA assay, in addition to SARS-CoV-2 (Figure 3B).
SARS-CoV-2, one of the RNA viruses, mutates over time, and when the genes of the virus change, a variant of the virus occurs. The Alpha, Beta, Delta, and Omicron variants of the SARS-CoV-2 coronavirus are classified by WHO as variants of concern (VOCs), which are highly transmissible, more virulent, and significantly reduce the effectiveness of existing diagnostics, vaccines, and treatments. Multiple sequence alignments of the original strain and VOCs of SARS-CoV-2 in the E, N, and ORF1ab genes were performed using DNAMAN sequence analysis software (Lynnon Biosoft, USA), as shown in Figure S3. The primers and probes used in this study had nearly complete sequence homology with all these VOCs, resulting in the RT-RPA reaction systems being highly specific to both the original strain and VOCs of SARS-CoV-2.
The excellent performance of low-volume (10 μL) RPA reactions was consistent with the study findings of Lillis et al.,44 and this might be because smaller volumes of amplification reagents and higher concentrations of template RNA increase the likelihood of mutual contact, thereby speeding up the reaction. Low-volume RPA reactions made it possible to perform micro-volume RPA reactions on microfluidic chips, and the cost of the reagents was only a fifth of the initial cost.
To ensure a highly sensitive and specific SARS-CoV-2 RPA assay, multiplex RT-RPA assays targeting the N, E, and ORF1ab genes of the SARS-CoV-2 genome were necessary. The primers and probes for the E gene and ORF1ab gene used in this study exhibited almost complete sequence homology with SARS-CoV and could be used to detect both SARS-CoV and SARS-CoV-2.54 While the reverse primer for the N gene shared practically complete sequence homology with SARS-CoV, the alignment of the forward primer revealed many mismatches, leading to high specificity for SARS-CoV-2 only (data not shown). The E gene was not present in the SARS-CoV pseudovirus we used. Hence, only the ORF1ab RT-RPA assay showed cross-reactivity. In summary, for viruses with the highest target sequence identity to SARS-CoV-2, like SARS-CoV and MERS-CoV (91% and 66%, respectively), multiplex RT-RPA assays could reduce the percentage of false positives and enhance specificity.
Even though our RT-RPA detection system was very effective against currently circulating SARS-CoV-2 VOCs, multi-gene testing was still crucial for detecting emerging variants of SARS-CoV-2 in the future. Mutations caused gene test failure in some RPA assays in detecting gene sequences in some variants. With multiplex RT-RPA assays and targeting of highly conserved SARS-CoV-2 sequences, the possibility of detecting false negatives could be minimized, and the risk of loss of sensitivity by new genomic variations could be mitigated.
Flow control of the microscope slide-shaped microfluidic chip
The workflow of the chip is illustrated in Figure 4. Buffer mixture and sample mixture, respectively, were injected into the buffer chamber and sample chamber, as shown in Figures 4A and 4B. At this point, capillary forces propel the liquid along the channel to the inlet of the mixing chamber, which itself acts as a capillary valve. The chip was then placed into the custom-made chip centrifuge and spun. At 3000 rpm for 30 s, the buffer and sample mixtures were transferred to the mixing chamber simultaneously. During high-speed rotation, the centrifugal force held the liquid inside the mixing chamber and the siphon channel. These solutions were then mixed by 180° alternate spins in counterclockwise and clockwise directions (shake-mode) at 500 rpm for 60 s (Figure 4C). In the process of mixing, because of the reduced rotation speed, centrifugal forces no longer prevailed over capillary forces inside the siphon channel. Capillary forces transported fluid over the siphon channel crest and along the channel to the entrance of the aliquoting chamber (Figure 4D). After that, the rotational speed was increased to 1500 rpm for 30 s, and the mixture entirely flowed out of the mixing chamber and siphoned into the aliquoting chamber. The fluid initially filled four metering chambers, and the excess liquid overflowed into the waste chamber (Figure 4E). Finally, the metering chamber mixture was dispensed into the reaction chamber at 7000 rpm for 30 s and mixed with the RT-RPA reagent (Figure 4F). The buffer and sample mixture were successfully controlled by centrifugal force. Multiplex detection might be accomplished by using all four reaction chambers at once. It took 2 min 30 s to complete the spin step and an additional 20 min for incubation and fluorescence detection. Therefore, the time required to complete the entire assay was approximately 30 min.
Figure 4.

Schematic illustration of the entire flow control of the microscope slide-shaped microfluidic chip
(A) An initial state of the chip with the dried RT-RPA reagents, primers, and probes.
(B) 38.4 μL of buffer mixture (red dye) and 21.6 μL of sample mixture (blue dye) were injected into the buffer chamber and sample chamber with a pipette, respectively.
(C) Both the buffer mixture and the sample mixture were transferred into the mixing chamber at 3000 rpm and then mixed by 180° alternate rotations in counterclockwise and clockwise directions (shake-mode) at 500 rpm.
(D) During the mixing step, the siphon finished priming by capillary action.
(E) The mixture was transferred into the aliquoting chamber at 1500 rpm.
(F) The mixture in the aliquoting chamber burst into the reaction chamber at 7000 rpm.
For nucleic acid testing of SARS-CoV-2, the Chinese Center for Disease Control and Prevention (CCDC) and WHO recommend two gene targets simultaneously, while the US CDC recommends two detection targets in the N gene.55,56 RT-PCR is currently the preferred method for nucleic acid detection of SARS-CoV-2, which simultaneously detects at least two target genes and one reference gene in a single tube, making the detection more sensitive and specific. But for RPA, multiplexed amplification is particularly difficult. Primer concentrations for multiplex RT-RPA must be carefully optimized because they will compete with one another for recombinase proteins. In addition, since different target primers can mutually inhibit amplification, experimental screening of the primer ratios is required.12 As a result, only a few papers have described SARS-CoV-2 detection using the duplex RT-RPA reaction method.17,43 In this study, multiplex RT-RPA detection of three target genes of SARS-CoV-2 was successfully achieved by the microscope slide-shaped microfluidic chip. The human ACTB gene is a housekeeping gene that, in theory, is expressed in all types of human cells and is hardly influenced by the environment.57 We added the ACTB gene to the microfluidic chip as an internal reference gene to be detected simultaneously with three target genes. By detecting reference genes, the effectiveness of clinical specimen sampling and nucleic acid extraction steps can be evaluated to avoid producing false-negative results.
Sensitivity test on the microfluidic chip
Considering the high infectivity and concealment of SARS-CoV-2, sensitive detection is of great significance for controlling the epidemic. To evaluate the limit of detection (LOD) of our microfluidic chip in clinical applications, SARS-CoV-2 pseudovirus was 10-fold serially diluted and spiked into nasopharyngeal swab preservation solution to simulate clinical samples. After extraction and quantification from mock clinical samples, nucleic acids were diluted to serial final concentrations (i.e., 1, 5, 10, 20, 30, 40, 50, 102, 103, 104 copies/μL) for on-chip amplifications and detections. As shown in Figure 5A, the brightness of the detected area gradually increased as the RNA template concentrations increased. The fluorescence was brilliant and constant at concentrations larger than 50 copies/reaction, regardless of RNA template enhancement. At that point, the presence of the virus could be easily detected with the naked eye. The mean fluorescence intensity was measured from the brightness of the detected region. The threshold line was determined to be the mean of the negative controls plus three times the SD of the negative control samples (Figure 5). The mean fluorescence intensity exceeded the threshold in all replicates when the concentration of the RNA template was 40 copies/reaction. Therefore, the LOD of the E gene was 40 copies/reaction. Repeats were run three times for each concentration, and the calculated SD was expressed as the error bars. Similar to this, the LOD for the N gene was 20 RNA copies/reaction; for the ORF1ab gene, it was 10 RNA copies/reaction (Figures 5B and 5C). The internal reference human gene (i.e., ACTB gene) amplification results were positive for all the above chips.
Figure 5.

Sensitivity of on-chip RT-RPA reactions
(A–C) It showed the sensitivity of on-chip RT-RPA reactions for the E (A), N (B), and ORF1ab (C) genes. The corresponding fluorescence images (left) and ImageJ mean fluorescence intensity analyses (right) were used to illustrate the detection results for targeted RNA at certain concentrations. Means (n = 3), and standard deviations.
This sensitivity is comparable to off-chip real-time RT-RPA detection of SARS-CoV-2, showing good biocompatibility of the chip material. Remarkably, off-chip RT-RPA detection runs the risk of aerosol contamination, can only detect one gene target at a time, and requires more manual steps. In contrast, the microfluidic chip detects SARS-CoV-2 with great advantage owing to its high throughput and automatic detection. Even though intact virus particles can more accurately reflect the detection performance of the chip, the SARS-CoV-2 pseudovirus is widely used for in vitro diagnostics due to its easy availability and low risk. The detection results obtained using the pseudovirus RNA template are valid and can be used as a reference for further detection of clinical samples. In real detection situations, sample collection errors, improper sample preservation, and loss of nucleic acid extraction will reduce the final amount of RNA template, so high sensitivity is the primary assurance for accurate detection of SARS-CoV-2.
Specificity, reproducibility, and repeatability tests on the microfluidic chip
Specificity, reproducibility, and repeatability are critical determinants of POCT methods. We screened 14 viruses with homology or similar clinical symptoms to SARS-CoV-2 to verify the specificity of our microfluidic chip. Each virus was spiked into the sample preservation solution at a concentration of 105 copies/μL, and then nucleic acids were extracted. A mock clinical sample of SARS-CoV-2 with 103 copies/μL was tested simultaneously as a positive control. As shown in Figure 6A, the ORF1ab RT-RPA assay was able to amplify both SARS-CoV and SARS-CoV-2 RNA, in contrast to the N and E RT-RPA assays, which could only detect SARS-CoV-2 RNA. For the other tested viruses, cross-reactivity was not seen in any of the three assays. This specificity was entirely consistent with SARS-CoV-2 off-chip real-time RT-RPA detection. The reproducibility of the microfluidic chip was tested using five sets of experiments with 102 copies/μL of mock clinical samples, and as seen in Figure 6B, the coefficients of variation (CV) of fluorescence intensity for the E, N, and ORF1ab genes were 0.05%, 1.06%, and 1.74%, respectively. The CVs of three RT-RPA assays were below 8.3%, indicating good reproducibility. In addition, we evaluated the consistency of the chip results by performing repeatability tests using five replicate measurements of 102 copies/μL of mock clinical samples. And Figure 6C depicted good repeatability of three RT-RPA assays. The reference human ACTB amplification results were positive for all the above chips. In summary, our findings demonstrated that the on-chip RT-RPA reactions had excellent specificity, reproducibility, and repeatability and showed that our microfluidic chip was appropriate for POCT applications.
Figure 6.

Other methodological parameters of on-chip RT-RPA reactions
(A–C) It showed the specificity (A), reproducibility (B), and repeatability (C) of on-chip RT-RPA reactions for the E, N, and ORF1ab genes. Means (n = 3), and standard deviations.
Clinical sample testing
To evaluate the performance of the microscope slide-shaped microfluidic chip in clinical sample detection, we analyzed 33 clinical patient samples, of which 20 were positive and 13 were negative for COVID-19. All positive samples for RT-PCR have Ct values for the N and ORF1ab genes that range from 16.37 to 27.4 and 17.63 to 29.26, respectively. The difference between each specimen’s two Ct values is less than 2. The qualitative result for the E gene was inferred based on the assumption that it was consistent with the other two genes since the RT-PCR kit we use only has two target genes. The on-chip RT-RPA results were evaluated according to the method described above. As shown in Table 1, the sensitivity (i.e., positive coincidence rate) for the N, E, and ORF1ab genes was 95% (95% CI: 76.39%–99.11%), 90% (95% CI: 69.90%–97.21%), and 95% (95% CI: 76.39%–99.11%), respectively. The specificity (i.e., negative coincidence rate) of all three genes was 100% (95% CI: 77.19%–100%). The Kappa values for the N, E, and ORF1ab genes were 0.937, 0.876, and 0.937, respectively, demonstrating a high level of consistency between the on-chip RT-RPA and RT-PCR methods. RT-RPA did not detect all three genes in the two samples with the highest CT values among the 20 positive samples. Therefore, although if the on-chip RT-RPA method is less sensitive than RT-PCR, it is still a great addition to and replacement for the real-time RT-PCR test and will be better suited for self-testing in resource-constrained settings and on-site detection of SARS-CoV-2.
Table 1.
Sensitivity and specificity of the on-chip RT-RPA reaction and real-time RT-PCR for detection of SARS-CoV-2 in clinical samples
| RT-PCR |
||||
|---|---|---|---|---|
| Positive | Negative | |||
| RT-RPA | N | Positive | 19 | 0 |
| Negative | 1 | 13 | ||
| Total | 20 | 13 | ||
| Coincidence rate | 95% | 100% | ||
| E | Positive | 18 | 0 | |
| Negative | 2 | 13 | ||
| Total | 20 | 13 | ||
| Coincidence rate | 90% | 100% | ||
| ORF1ab | Positive | 19 | 0 | |
| Negative | 1 | 13 | ||
| Total | 20 | 13 | ||
| Coincidence rate | 95% | 100% | ||
Reagents stability test on the microfluidic chip
The lack of cold chain transportation infrastructure and refrigeration facilities in resource-limited settings can be a major problem for RT-RPA reagents, which is a significant barrier to POCT applications. We, therefore, decided to test the stability of on-chip RT-RPA reagents at −20°C, 25°C, and 45°C for 12 weeks using RNA templates at 100 and 50 copies/reaction. Negative controls were also tested to increase the reliability of the results. As expected, all analyses of RNA templates using chips stored at −20°C were positive throughout the 12 weeks (Table 2). Chips stored at 25°C demonstrated comparable stability, with all RNA templates detected in 12 weeks (Table 2). No false-positive results were recorded at the above two storage temperatures. It should be noted that chips stored at 45°C could provide accurate results for RNA templates and negative controls for up to 4 weeks. However, false-positive tests were observed in negative controls after 6 weeks of storage at 45°C, indicating that long storage at high temperatures leads to a loss of specificity (Table 2). We performed fluorescent detection immediately after the centrifugation process. The incubation step was purposefully omitted to avoid efficient nucleic acid amplification of the RT-RPA reaction. Both RNA templates and negative controls showed positive results using chips stored at 45°C. In addition, since magnesium acetate was used to initiate the RPA reaction process, we substituted an equal volume of nuclease-free water for it, and the results were still positive. This implies that the fluorescence being detected is background fluorescence caused by probe hydrolysis rather than specific fluorescence caused by the RPA amplification reaction. In our opinion, this might be due to the gradual hydrolysis of primers and probes by the residual nucleases in the lyophilized reagents at high temperatures, which would separate the fluorophores and quenchers on the probes to generate non-specific fluorescence signals.
Table 2.
Storage stability of reagents at −20°C, 25°C, and 45°C
| Storage |
−20°C |
25°C |
45°C |
||||||
|---|---|---|---|---|---|---|---|---|---|
| Week | 100 copies | 50 copies | NC | 100 copies | 50 copies | NC | 100 copies | 50 copies | NC |
| 1 | 2/2 | 2/2 | 0/2 | 2/2 | 2/2 | 0/2 | 2/2 | 2/2 | 0/2 |
| 2 | 2/2 | 2/2 | 0/2 | 2/2 | 2/2 | 0/2 | 2/2 | 2/2 | 0/2 |
| 3 | 2/2 | 2/2 | 0/2 | 2/2 | 2/2 | 0/2 | 2/2 | 2/2 | 0/2 |
| 4 | 2/2 | 2/2 | 0/2 | 2/2 | 2/2 | 0/2 | 2/2 | 2/2 | 0/2 |
| 6 | 2/2 | 2/2 | 0/2 | 2/2 | 2/2 | 0/2 | 2/2 | 2/2 | 2/2 |
| 8 | 2/2 | 2/2 | 0/2 | 2/2 | 2/2 | 0/2 | 2/2 | 2/2 | 2/2 |
| 10 | 2/2 | 2/2 | 0/2 | 2/2 | 2/2 | 0/2 | 2/2 | 2/2 | 2/2 |
| 12 | 2/2 | 2/2 | 0/2 | 2/2 | 2/2 | 0/2 | 2/2 | 2/2 | 2/2 |
Reagents stored on the microfluidic chip at 25°C for up to 12 weeks and 45°C for up to 4 weeks had no discernible effect on assay performance. Because of the excellent performance, our chips might be transported over short distances without needing a cold chain. They would also not be affected by short-term exposure to high temperatures. These findings further illustrated the wide range of potential applications for the microfluidic chip in settings with scarce resources or POCT usage.
Limitations of the study
Our microscope slide-shaped microfluidic chip is still in its early stages and has a few limitations. First, the rotation, incubation, and detection of the chip were performed separately, and the full operation of the chip required multiple manual steps to change between the centrifugal device, hybridization device, and detection device. In the future, integrated instruments and software that integrate functions such as sample loading, centrifugation, incubation, detection, and result interpretation will be developed. Second, sample preparation was typically separated from the chip. We now extract nucleic acids in vitro instead of integrating sample preparation into the chip and cannot realize a sample-in-and-answer-out detection format at this stage. Future studies should keep iteratively improving chip properties to enable on-chip nucleic acid extraction. Furthermore, subject to chip size, the microfluidic chip only has 2 units with 4 targets each, not enough for high throughput. In the next step, we will use the disc shape and increase the size of the chip to achieve higher throughput.
In this study, we developed a microscope slide-shaped microfluidic chip that incorporates multiplex RT-RPA assays for rapid and accurate detection of SARS-CoV-2. First, we showed a simple, affordable, and reliable method for surface modification that functions well for capillary fluid control in centrifugal microfluidic systems. We also conducted a correlation study of the capillary valve’s burst frequency, which was a crucial parameter for fluidic control on microfluidic chips. By contrasting the correlation coefficients (R2) and slopes of each curve-fitting equation, we chose two better burst frequency equations as the theoretical basis for our chip parameter design. RT-RPA amplification reactions of low volume (e.g., 10 μL) were constructed to detect N, E, and ORF1ab genes of SARS-CoV-2, and their good analytical sensitivity and specificity allowed for the performance of micro-volume RPA reactions on microfluidic chips. The microscope slide-shaped microfluidic chip could simultaneously detect three SARS-CoV-2 target genes and one internal reference human ACTB gene, which made multiplex RT-RPA amplification achievable. Our microfluidic chip has several advantages over PCR technology, which is widely regarded as the gold standard method in molecular diagnostics. These include low cost, quick detection (approximately 30 min), good automation, high throughput, and no risk of aerosol contamination. Mock clinical samples were used to confirm the performance of the microfluidic chip, and the LOD of the E gene, N gene, and ORF1ab gene was as low as 40, 20, and 10 RNA copies/reaction, respectively, which was pretty similar to off-chip real-time RT-RPA detection in a reaction volume of 10 μL. Chip performance was evaluated using real clinical samples, and the RT-RPA assay’s sensitivity and specificity in comparison to real-time RT-PCR were 90% and 100% for the E gene, and 95% and 100% for the N and ORF1ab genes. Furthermore, the exceptional specificity, reproducibility, and repeatability of our microfluidic chip and the excellent stability of the on-chip RPA reagents could meet the requirements of self-testing in resource-constrained environments and on-site detection of SARS-CoV-2.
STAR★Methods
Key resources table
| REAGENT or RESOURCE | SOURCE | IDENTIFIER |
|---|---|---|
| Bacterial and virus strains | ||
| Analytical specific references (inactivated virus), see Table S3 | BDS Biotech | Cat#202001 |
| Biological samples | ||
| SARS-CoV-2 clinical samples | Daping Hospital | N/A |
| Chemicals, peptides, and recombinant proteins | ||
| HPMC | Sigma-Aldrich | Cat#H9262 |
| PMMA wafers | Hanguang | Cat#037-WP02B-01 |
| Critical commercial assays | ||
| QIAamp viral RNA mini kit | Qiagen | Cat#52906 |
| SARS-CoV-2 RT-PCR nucleic acid detection kit | Sansure Biotech | Cat#20200118 |
| RT-RPA custom kit (10 μL) | Amp-Future | Cat#WLRE8205KIT-LJ |
| SARS-CoV-2 test kit (real-time PCR) | Daan Gene | Cat#20220050 |
| Viral RNA extraction kit | TianLong Science and Technology | Cat#22050880T183 |
| Oligonucleotides | ||
| Primers and probes, see Table S2 | This paper and El Wahed et al., 202154 | N/A |
| Recombinant DNA | ||
| SARS-CoV-2 pseudovirus, see Table S1 | Sangon Biotech | Cat#M591001 |
| cDNA standard plasmids for ORF1ab gene | BGI Beijing Liuhe | Cat#WHC2118612 |
| cDNA standard plasmids for E gene | BGI Beijing Liuhe | Cat#WHC2118613 |
| cDNA standard plasmids for N gene | BGI Beijing Liuhe | Cat#WHC2118614 |
| HCoV-NL63 pseudovirus | Sangon Biotech | Cat#M597003 |
| HCoV-229E pseudovirus | Sangon Biotech | Cat#M597001 |
| HCoV-OC43 pseudovirus | Sangon Biotech | Cat#M597004 |
| HCoV-HKU1 pseudovirus | Sangon Biotech | Cat#M597002 |
| MERS-CoV pseudovirus | Sangon Biotech | Cat#M592001 |
| SARS-CoV pseudovirus | Sangon Biotech | Cat#M596001 |
| Software and algorithms | ||
| DNAman 9.0 | Lynnon Biosoft | https://www.lynnon.com/dnaman.html |
| SolidWorks 2020 | Dassault Systemes | https://www.solidworks.com/sw/support/downloads.htm |
| SPSS Statistics 23.0 | IBM | https://www.ibm.com/analytics/spss-statistics-software |
| ImageJ | Schneider et al., 201258 | https://imagej.nih.gov/ij/ |
| Other | ||
| Spectrophotometer | Thermo Fisher | Cat#ND 1000 |
| Spin coater | Lebo Science | Cat#AC100 |
| Contact angle measurement system | Data Physics | Cat#OCA 20 |
| Atomic force microscope | Shimadzu | Cat#SPM9700 |
| XPS spectrometer | Thermo Fisher | Cat#Escalab 250Xi |
| Pressure-sensitive adhesive 9795R | 3M China | Cat#9344 |
| Chip centrifuge | Hanguang | Cat#SRMC-10K |
| Real-time PCR instruments | Roche Diagnostics | Cat#Cobas z 480 |
| in situ hybridization instrument | Ruicheng Instrument | Cat#SH2000 |
| Microarray chip scanner | Capitalbio | Cat#LuxScan 10k |
Resource availability
Lead contact
Further information and requests for resources and reagents should be directed to and will be fulfifilled by the lead contact, Qing Huang (qinghuang@tmmu.edu.cn).
Materials availability
This study did not generate new unique reagents.
Experimental models and subject details
The study involving clinical subjects and healthy volunteers was reviewed and approved by the Ethics Committee of the Army Medical Center (ECAMC approval number 2022–362). ECAMC approved the waiver of informed consent because the biological samples used in this study were obtained from previous clinical diagnosis and treatment, and the study posed no more than minimal risk to the subjects. All the clinical patient samples were collected at Daping Hospital of the Army Medical University. The results of this study were unaffected by the participants' age or gender.
Method details
RNA standards and RPA oligonucleotides
The SARS-CoV-2 viral RNA reference material was a pseudovirus constructed by Sangon Biotech (China). As indicated in the product specifications of the manufacturer, the complete N gene, complete E gene, and partial ORF1ab gene (Table S1) of SARS-CoV-2 were synthesized in vitro, and sub-cloned into a retroviral vector (Figure S1) to be transfected into HEK 293T cells for culture. Finally, the supernatant was extracted and purified to obtain the pseudovirus. RPA primers and probes for the N and ORF1ab genes were designed and optimized on our own, whereas the E gene was cited from previously published research54 (Table S2). All primers and probes were synthesized and purified by BGI Beijing Liuhe Co., Ltd. (China).
Surface modification and characterization methods
HPMC was purchased from Sigma-Aldrich (H9262, USA) and dissolved in deionized water at room temperature. For surface modification, all chambers and channels of a PMMA chip were filled with 2% HPMC solution using a pipette, which was then spin-coated at 6,000 rpm for 30 s before being dried in an oven at 60°C for 20 min.
Surface modification of polymers is necessarily accompanied by changes in surface energy or surface roughness.51 We modified plain PMMA wafers (Hanguang Co., China) for surface characterization.
Using a contact angle measurement system (OCA 20, Data Physics Corporation, Germany), deionized water was applied to measure the contact angle. The applied water droplet volume was 10 μL, and the measurement was started after placing the water droplet on the wafer surface for 10 s at ambient atmospheric conditions. The contact angle results were then obtained by averaging five measurements on the wafer surface at random locations. We chose diiodomethane and deionized water as probe liquids to calculate the samples' surface free energy (SFE). We also measured contact angles for a further 24 weeks to observe hydrophilic aging (i.e., hydrophobic recovery) to evaluate modification stability.
Surface roughness and atomic force microscope (AFM) 3D images were obtained from an atomic force microscope (SPM-9700, Shimadzu Co., Japan). Roughness was quantified using the root-mean-square roughness (Rq) parameter. Rq measurements were taken at five random areas (2 μm × 2 μm) on the wafer surface, and the average was calculated.
Furthermore, the surface chemical composition was monitored by X-ray photoelectron spectroscopy (XPS) performed on an XPS spectrometer (Escalab 250Xi, Thermo Fisher Scientific, USA). The thickness of the HPMC coatings was evaluated using an ellipsometer (M−2000 DI, J.A. Woollam Co., Inc., USA).
Capillary valve design and experiment
A compact disc (CD)-based microfluidic chip designed for proof-of-concept consists of six simple capillary valve devices in parallel, in which a reservoir is connected with a siphon channel and a capillary valve (Figures 2A and 2B). This chip was designed with SolidWorks software and cut with computer numerical controlled (CNC) milling (Hanguang Co., China) using a PMMA disk with a diameter of 15 cm and a thickness of 2 mm. The reservoir capable of holding 190 μL of a solution is located at R1 = 63 mm from the rotational center. The capillary valve has a depth of 1.6 mm and a width of 2.4 mm. The distance from the valve opening to the chip center is R2 = 71 mm for V1, V2, V3, and R2 = 66 mm for V4, V5, V6, respectively. The siphon channel is 0.1 mm deep, 1 mm wide for V1 and V4, 0.5 mm wide for V2 and V5, and 0.2 mm wide for V3 and V6. The centrifugal microfluidic chip was sealed by pressure-sensitive adhesives (9795R, 3M China Ltd., China) using a vacuum hot pressing machine (TBS-200, Tinkerbio Co., China). The contact angle of this adhesive with deionized water is 115.0 ± 1.1°. The adhesive was patterned with a cutting plotter (CE7000, Graphtec Co., Japan).
For better visibility, deionized water was combined with a small amount of blue ink. Each reservoir was filled with 190 μL of dyed deionized water using a pipette, the radial distance from the center of rotation to the liquid in the reservoir was R1 = 63 mm, and then the CD was placed on a custom-made chip centrifuge (SRMC-10K, Hanguang Co., China) (Figure 2C). To determine the burst frequency of the capillary valve, the CD was rotated at 300 revolutions-per-minute (RPM) and then accelerated at 10 RPM intervals. Record the rotational speed of each valve burst. Measurements were repeated 20 times on 10 different chips. Remove outliers and calculate the mean and SD of the burst frequency for each capillary valve.
Sample preparation
RNA was extracted from 280 μL of pseudovirus using the QIAamp Viral RNA Mini Kit (Qiagen, Germany), as directed by the manufacturer. RNA samples were eluted in 40 μL of elution buffer and diluted in nuclease-free water.
RNA templates were determined by quantitative RT-PCR using a commercial SARS-CoV-2 RT-PCR nucleic acid detection kit (Sansure Biotech, China). The number of copies per μL was inferred using a standard curve obtained by serially diluting cDNA quality control plasmids. The cDNA standard plasmids for the N, E, and ORF1ab genes were provided by BGI Beijing Liuhe Co., Ltd. (China), and their concentrations were measured on a NanoDrop 1000 spectrophotometer (Thermo Fisher Scientific, USA). Afterward, RNA templates with 10-fold serial dilutions ranging from 105 to 100 copies/μL were prepared and stored at −80°C for later use.
Off-chip RT-RPA reaction
Real-time RT-RPA detection was performed using an RT-RPA custom kit (Amp-Future, China) in a 10 μL total reaction volume. The RPA reaction mixture consisted of 5.9 μL of buffer A (rehydration buffer), 0.4 μL of each primer (10 μM), 0.12 μL of probe (10 μM), 1.68 μL of nuclease-free water, and 1 μL of RNA template. The total mixture was added to the test tube containing lyophilized enzyme powder and then carefully dropped 0.5 μL of buffer B (280 mM magnesium acetate) into the inner wall of each reaction tube. After capping, forcefully invert the tube 5–8 times to mix the contents, then centrifuge. We added a mixing step after the reaction started to boost reaction efficiency. Tubes were incubated for 5 min (2 min for reactions containing 103 or more template copies) in a thermostatic metal dry bath (OSE-DB-02, Tiangen Biotech Co. Ltd., China), then briefly mixed and centrifuged before being transferred to a fluorescence detector (Cobas z 480, Roche, Switzerland), and measured at 42°C for 15 min.
Analytical sensitivity and specificity of off-chip RT-RPA reactions
To determine the analytical sensitivity of the E, N, and ORF1ab RT-RPA assays, each assay was tested using 10-fold serial dilutions ranging from 105 to 10° copies/reaction of RNA template in five replicates. Background correction was applied to RPA fluorescence data by deleting the first measurement value obtained after the mixing step from all other values. All measurement points taken before the mixing step were reset to zero. Five no-template control (NTC) reactions were used to determine the fluorescence threshold. Their fluorescence values were averaged, and standard deviations were computed. After that, the threshold was calculated by adding 3.747 standard deviations to the average. The multiplicative factor of 3.747 corresponds to the 99% confidence interval for the t-distribution with 4° of freedom,59 which was chosen to increase the detection’s specificity. The proportion of positive reactions was calculated separately for each gene, and the limit of detection (LOD) with a 95% probability of detection was determined using a probit regression analysis (SPSS Statistics 23.0, IBM, USA).
The RT-RPA assays' analytical specificity was evaluated using the viruses indicated in Table S3. A coronavirus pseudovirus panel, including partial viral RNA of HCoV-NL63 (contains N gene), HCoV-229E (contains N gene), HCoV-OC43 (contains N gene), HCoV-HKU1 (contains N gene), MERS-CoV (contains N gene, E gene, and partial ORF1ab gene) and SARS-CoV (contains N gene and partial ORF1ab gene), was purchased from Sangon Biotech (China). Other viruses containing intact viral RNA were provided by BDS Biotech (China). The manufacturer’s synthetic report or personal communication provided the concentrations of each type of virus in units of copies/μL. We uniformly diluted to 105 copies/μL for specificity analysis.
Chip design and fabrication
The structure of the microscope slide-shaped microfluidic chip is shown in Figure S2. The chip consisted of two layers: a PMMA plate with dimensions of 75 mm (length) × 25 mm (width) × 2.2 mm (height) and a 100 μm thick pressure sensitive adhesive (9795R, 3M China Ltd., China) (Figure S2A). The PMMA plate was designed with SolidWorks software and fabricated using a standard injection molding process according to standard protocols (Hanguang Co., China). The adhesive was patterned with a cutting plotter (CE7000, Graphtec Co., Japan). Figure S2B shows an enlarged schematic of the chip, which includes a sample chamber (40 μL), a buffer chamber (40 μL), a mixing chamber (80 μL), a metering chamber (10 μL), and four reaction chambers (10 μL, diameter: 3 mm). The metering chamber to reaction chamber capillary channel was 0.2 mm wide, whereas the other channels were 1.0 mm wide. All chambers have a depth of 1.6 mm, and all channels have a depth of 0.1 mm.
An RT-RPA reaction mixture consisting of 0.4 μL of each primer (10 μM), 0.12 μL of probe (10 μM), and 9.08 μL of nuclease-free water was prepared and mixed with lyophilized enzyme powder. After utilizing the optimized methods to modify the chip’s surface, the reaction chamber was preloaded with the mixture and dried in a vacuum freeze dryer (LGJ-100F, Beijing Songyuan Huaxing Technology Development Co., Ltd., China). The two layers were then bonded together using a vacuum hot-pressing machine (TBS-200, Tinkerbio Co., China). Afterward, the centrifugal chip was sealed with aluminum foil with a small desiccant packet (Figure S2C) and kept at −20°C until use.
On-chip RT-RPA reactions performed with the microscope slide-shaped microfluidic chip
For multiplex detection of SARS-CoV-2, RT-RPA reaction mixtures containing specific primers and probes for the E, N, and ORF1ab genes were preloaded into reaction chambers 1, 2, and 3, respectively (Figure S2B). To monitor the sampling process and sample extraction, the human ACTB gene was used as a reference gene to avoid false negative results. Its reaction mixture was preloaded into reaction chamber 4 (Figure S2B). 38.4 μL of buffer mixture (35.4 μL of buffer A and 3 μL of buffer B) and 21.6 μL of sample mixture (6 μL of RNA templates and 15.6 μL of nuclease-free water) were pipetted into the buffer chamber and sample chamber, respectively (Figure S2B). Then, the chip was transferred into the custom-made chip centrifuge for spinning. The entire flow control of the microfluidic chip was completed in the device (Figure 2C). Afterward, all vents were sealed with tape. The chip was placed immediately on an in situ hybridization instrument (SH2000, Ruicheng Instrument Co., Ltd.) and incubated for 20 min at 42°C. An additional mixing step was performed 5 min after the start of the incubation: the chip was quickly transferred into the chip centrifuge and mixed by alternating clockwise and counterclockwise motor rotations at a low spin speed for 30 s. After mixing, the chip was put back into the hybridizer and continued to incubate until the completion of 20 min. Finally, a microarray chip scanner (LuxScan10k, Capitalbio Co., China) was used to detect fluorescence. We used ImageJ software to analyze the image results. The original image required split channels and a selection of the green one because of the HEX fluorophore used in the probe. Select the following two parameters: Mean gray value and Limit to a threshold. The brightness of the detected area was converted to a value representing the mean intensity of fluorescence, which was used for quantitative comparison with the negative control to determine the presence of the virus.
Validation with mock clinical samples
Nasopharyngeal swabs (LS-C-F-001, Longseemed Co., China) were collected from healthy volunteers and stored in 3 mL of sample preservation solutions (LS-R-P-003, Longseemed Co., China). We used sample preservation solutions with serial concentrations of SARS-CoV-2 pseudovirus to mimic clinical samples to assess the potential of the diagnostic performance of the microfluidic chip in clinical applications. In addition, a negative control sample (solution unspiked with SARS-CoV-2 pseudovirus) was prepared to ensure detection accuracy. Nucleic acids were extracted and quantified from mock clinical samples and a negative control according to the above methods. For specificity analysis, pseudoviruses and inactivated viruses listed in Table S3 were spiked into sample preservation solutions at 105 copies/μL.
Clinical application evaluation
The diagnostic performance of the on-chip RT-RPA assays in clinical applications was verified with suspected COVID-19 cases tested at Daping Hospital of the Army Medical University. RNA was extracted by an automated nucleic acid workstation with a compatible nucleic acid extraction kit (TianLong Science and Technology Co., Ltd., China) and determined by real-time RT-PCR using a commercial SARS-CoV-2 nucleic acid detection kit (Daan Gene Co., Ltd., China). For RT-PCR, positive samples were those with a Ct value ≤35,whereas negative samples had a Ct value >35. A total of 20 positive samples and 13 negative samples were selected for testing. The RT-RPA assays' sensitivity (i.e., positive coincidence rate) and specificity (i.e., negative coincidence rate) were calculated in comparison to the RT-PCR as a standard method. A Kappa test was used to determine a 95% confidence interval and Kappa value for the coincidence rates.
Chip reagents stability test
To study the stability of on-chip RT-RPA reagents at different temperatures, chips were stored at −20°C, 25°C, and 45°C for 12 weeks. Chips at each storage temperature were tested in duplicate using RNA templates at 100 and 50 copies/reaction weekly for the first 4 weeks and every 2 weeks after that. Negative control was also tested at the same time to avoid false positives. To assure the accuracy of each storage temperature, mercury thermometers (F519189, Sangon Biotech, China) were stored with chips. Temperatures were taken twice daily to confirm no significant and persistent fluctuations (+/−1°C) in storage temperature during the study.
Quantification and statistical analysis
All statistical analyses were performed using SPSS Statistics 23.0 software. Graph data are presented as mean ± SD. The statistical details of experiments can be found in the figure legends and results and discussion section.
Acknowledgments
This work was supported by the Biosafety Construction Project (grant number: A3702022001), the Chongqing Clinical Key Specialty Construction Project, the Biosafety research program (grant number: 19SWAQ06), and the Technological Innovation Capability Improvement Project (grant number: 2020XYY18).
Author contributions
R.L.: Conceptualization, Methodology, Formal analysis, Investigation, Writing – original draft, Visualization. N.S.: Resources, Investigation, Data curation. X.R.: Investigation. X.S.: Validation. W.Li.: Validation. Y.L.: Resources. J.L.: Resources. C.C.: Validation. H.W.: Validation. W.Lu.: Supervision, Writing – review & editing. S.D.: Supervision, Writing – review & editing. Q.H.: Conceptualization, Writing – review & editing, Project administration, Supervision, Resources, Funding acquisition.
Declaration of interests
The authors declare that they have no known competing financial interests or personal relationships that could have appeared to influence the work reported in this paper.
Published: February 21, 2023
Footnotes
Supplemental information can be found online at https://doi.org/10.1016/j.isci.2023.106245.
Supplemental information
Data and code availability
-
•
All data reported in this paper will be shared by the lead contact upon request.
-
•
This paper does not report original code.
-
•
Any additional information required to reanalyze the data reported in this paper is available from the lead contact upon request.
References
- 1.Coronaviridae Study Group of the International Committee on Taxonomy of Viruses The species severe acute respiratory syndrome-related coronavirus: classifying 2019-ncov and naming it SARS-cov-2. Nat. Microbiol. 2020;5:536–544. doi: 10.1038/s41564-020-0695-z. [DOI] [PMC free article] [PubMed] [Google Scholar]
- 2.Zhu N., Zhang D., Wang W., Li X., Yang B., Song J., Zhao X., Huang B., Shi W., Lu R., et al. A novel coronavirus from patients with pneumonia in China, 2019. N. Engl. J. Med. 2020;382:727–733. doi: 10.1056/NEJMoa2001017. [DOI] [PMC free article] [PubMed] [Google Scholar]
- 3.Li Q., Guan X., Wu P., Wang X., Zhou L., Tong Y., Ren R., Leung K.S.M., Lau E.H.Y., Wong J.Y., et al. Early transmission dynamics in wuhan, China, of novel coronavirus-infected pneumonia. N. Engl. J. Med. 2020;382:1199–1207. doi: 10.1056/NEJMoa2001316. [DOI] [PMC free article] [PubMed] [Google Scholar]
- 4.World Health Organization . 2022. WHO Coronavirus Disease (Covid-19) Dashboard.https://covid19.who.int/ [Google Scholar]
- 5.Kannan S., Shaik Syed Ali P., Sheeza A. Omicron (b.1.1.529) - variant of concern - molecular profile and epidemiology: a mini review. Eur. Rev. Med. Pharmacol. Sci. 2021;25:8019–8022. doi: 10.26355/eurrev_202112_27653. [DOI] [PubMed] [Google Scholar]
- 6.Meo S.A., Meo A.S., Al-Jassir F.F., Klonoff D.C. Omicron SARS-cov-2 new variant: global prevalence and biological and clinical characteristics. Eur. Rev. Med. Pharmacol. Sci. 2021;25:8012–8018. doi: 10.26355/eurrev_202112_27652. [DOI] [PubMed] [Google Scholar]
- 7.Chen J., Wang R., Gilby N.B., Wei G.W. Omicron variant (b.1.1.529): infectivity, vaccine breakthrough, and antibody resistance. J. Chem. Inf. Model. 2022;62:412–422. doi: 10.1021/acs.jcim.1c01451. [DOI] [PMC free article] [PubMed] [Google Scholar]
- 8.Corman V.M., Landt O., Kaiser M., Molenkamp R., Meijer A., Chu D.K., Bleicker T., Brünink S., Schneider J., Schmidt M.L., et al. Detection of 2019 novel coronavirus (2019-ncov) by real-time rt-pcr. Euro Surveill. : bulletin européen sur les maladies transmissibles. 2020;25:2000045–2000130. doi: 10.2807/1560-7917.ES.2020.25.3.2000045. [DOI] [PMC free article] [PubMed] [Google Scholar]
- 9.World Health Organization . 2020. Laboratory Testing of 2019 Novel Coronavirus (2019-ncov) in Suspected Human Cases: Interim Guidance, 17 January 2020.https://www.who.int/publications/i/item/laboratory-testing-of-2019-novel-coronavirus-(-2019-ncov)-in-suspected-human-cases-interim-guidance-17-january-2020 [Google Scholar]
- 10.Yan L., Zhou J., Zheng Y., Gamson A.S., Roembke B.T., Nakayama S., Sintim H.O. Isothermal amplified detection of dna and rna. Mol. Biosyst. 2014;10:970–1003. doi: 10.1039/c3mb70304e. [DOI] [PubMed] [Google Scholar]
- 11.Piepenburg O., Williams C.H., Stemple D.L., Armes N.A. Dna detection using recombination proteins. PLoS Biol. 2006;4 doi: 10.1371/journal.pbio.0040204. [DOI] [PMC free article] [PubMed] [Google Scholar]
- 12.Lobato I.M., O'Sullivan C.K. Recombinase polymerase amplification: basics, applications and recent advances. Trends Anal. Chem. 2018;98:19–35. doi: 10.1016/j.trac.2017.10.015. [DOI] [PMC free article] [PubMed] [Google Scholar]
- 13.Kersting S., Rausch V., Bier F.F., von Nickisch-Rosenegk M. Multiplex isothermal solid-phase recombinase polymerase amplification for the specific and fast dna-based detection of three bacterial pathogens. Mikrochim. Acta. 2014;181:1715–1723. doi: 10.1007/s00604-014-1198-5. [DOI] [PMC free article] [PubMed] [Google Scholar]
- 14.Rohrman B.A., Richards-Kortum R.R. A paper and plastic device for performing recombinase polymerase amplification of hiv dna. Lab Chip. 2012;12:3082–3088. doi: 10.1039/c2lc40423k. [DOI] [PMC free article] [PubMed] [Google Scholar]
- 15.Peñarrubia L., Ruiz M., Porco R., Rao S.N., Juanola-Falgarona M., Manissero D., López-Fontanals M., Pareja J. Multiple assays in a real-time rt-pcr SARS-cov-2 panel can mitigate the risk of loss of sensitivity by new genomic variants during the covid-19 outbreak. Int. J. Infect. Dis. 2020;97:225–229. doi: 10.1016/j.ijid.2020.06.027. [DOI] [PMC free article] [PubMed] [Google Scholar]
- 16.Public Health England . 2020. Investigation of Novel SARS-Cov-2 Variant Variant of Concern 202012/01.https://assets.publishing.service.gov.uk/government/uploads/system/uploads/attachment_data/file/959438/technical_briefing_voc_sh_njl2_sh2.pdf [Google Scholar]
- 17.Cherkaoui D., Huang D., Miller B.S., Turbé V., Mckendry R.A. Harnessing recombinase polymerase amplification for rapid multi-gene detection of SARS-cov-2 in resource-limited settings. Biosens. Bioelectron. 2021;189 doi: 10.1016/j.bios.2021.113328. [DOI] [PMC free article] [PubMed] [Google Scholar]
- 18.Borst A., Box A.T.A., Fluit A.C. False-positive results and contamination in nucleic acid amplification assays: suggestions for a prevent and destroy strategy. Eur. J. Clin. Microbiol. Infect. Dis. 2004;23:289–299. doi: 10.1007/s10096-004-1100-1. [DOI] [PubMed] [Google Scholar]
- 19.Land K.J., Boeras D.I., Chen X.S., Ramsay A.R., Peeling R.W. Reassured diagnostics to inform disease control strategies, strengthen health systems and improve patient outcomes. Nat. Microbiol. 2019;4:46–54. doi: 10.1038/s41564-018-0295-3. [DOI] [PMC free article] [PubMed] [Google Scholar]
- 20.Bai Y., Ji J., Ji F., Wu S., Tian Y., Jin B., Li Z. Recombinase polymerase amplification integrated with microfluidics for nucleic acid testing at point of care. Talanta. 2022;240 doi: 10.1016/j.talanta.2022.123209. [DOI] [PubMed] [Google Scholar]
- 21.Yang Y., Chen Y., Tang H., Zong N., Jiang X. Microfluidics for biomedical analysis. Small Methods. 2020;4 doi: 10.1002/smtd.201900451. [DOI] [Google Scholar]
- 22.Xu H., Xia A., Wang D., Zhang Y., Deng S., Lu W., Luo J., Zhong Q., Zhang F., Zhou L., et al. An ultraportable and versatile point-of-care dna testing platform. Sci. Adv. 2020;6:z7445. doi: 10.1126/sciadv.aaz7445. [DOI] [PMC free article] [PubMed] [Google Scholar]
- 23.Liu D., Shen H., Zhang Y., Shen D., Zhu M., Song Y., Zhu Z., Yang C. A microfluidic-integrated lateral flow recombinase polymerase amplification (mi-if-rpa) assay for rapid covid-19 detection. Lab Chip. 2021;21:2019–2026. doi: 10.1039/D0LC01222J. [DOI] [PubMed] [Google Scholar]
- 24.Ducrée J., Haeberle S., Lutz S., Pausch S., Stetten F.V., Zengerle R. The centrifugal microfluidic bio-disk platform. J. Micromech. Microeng. 2007;17:S103–S115. doi: 10.1088/0960-1317/17/7/s07. [DOI] [Google Scholar]
- 25.Kim T.H., Park J., Kim C.J., Cho Y.K. Fully integrated lab-on-a-disc for nucleic acid analysis of food-borne pathogens. Anal. Chem. 2014;86:3841–3848. doi: 10.1021/ac403971h. [DOI] [PubMed] [Google Scholar]
- 26.Chen Y., Mei Y., Zhao X., Jiang X. Reagents-loaded, automated assay that integrates recombinase-aided amplification and cas12a nucleic acid detection for a point-of-care test. Anal. Chem. 2020;92:14846–14852. doi: 10.1021/acs.analchem.0c03883. [DOI] [PubMed] [Google Scholar]
- 27.Zong N., Gao Y., Chen Y., Luo X., Jiang X. Automated centrifugal microfluidic chip integrating pretreatment and molecular diagnosis for hepatitis b virus genotyping from whole blood. Anal. Chem. 2022;94:5196–5203. doi: 10.1021/acs.analchem.2c00337. [DOI] [PubMed] [Google Scholar]
- 28.Lutz S., Weber P., Focke M., Faltin B., Hoffmann J., Müller C., Mark D., Roth G., Munday P., Armes N., et al. Microfluidic lab-on-a-foil for nucleic acid analysis based on isothermal recombinase polymerase amplification (rpa) Lab Chip. 2010;10:887–893. doi: 10.1039/b921140c. [DOI] [PubMed] [Google Scholar]
- 29.Wang S., Cai G., Duan H., Qi W., Lin J. Automatic and multi-channel detection of bacteria on a slidable centrifugal disc based on fta card nucleic acid extraction and recombinase aided amplification. Lab Chip. 2021;22:80–89. doi: 10.1039/D1LC00915J. [DOI] [PubMed] [Google Scholar]
- 30.Schulz M., Calabrese S., Hausladen F., Wurm H., Drossart D., Stock K., Sobieraj A.M., Eichenseher F., Loessner M.J., Schmelcher M., et al. Point-of-care testing system for digital single cell detection of mrsa directly from nasal swabs. Lab Chip. 2020;20:2549–2561. doi: 10.1039/d0lc00294a. [DOI] [PubMed] [Google Scholar]
- 31.Choi G., Jung J.H., Park B.H., Oh S.J., Seo J.H., Choi J.S., Kim D.H., Seo T.S. A centrifugal direct recombinase polymerase amplification (direct-rpa) microdevice for multiplex and real-time identification of food poisoning bacteria. Lab Chip. 2016;16:2309–2316. doi: 10.1039/C6LC00329J. [DOI] [PubMed] [Google Scholar]
- 32.Chen J., Xu Y., Yan H., Zhu Y., Wang L., Zhang Y., Lu Y., Xing W. Sensitive and rapid detection of pathogenic bacteria from urine samples using multiplex recombinase polymerase amplification. Lab Chip. 2018;18:2441–2452. doi: 10.1039/c8lc00399h. [DOI] [PubMed] [Google Scholar]
- 33.Ali U., Karim K.J.B.A., Buang N.A. A review of the properties and applications of poly (methyl methacrylate) (pmma) Polym. Rev. 2015;55:678–705. doi: 10.1080/15583724.2015.1031377. [DOI] [Google Scholar]
- 34.Tsaloglou M.N., Watson R.J., Rushworth C.M., Zhao Y., Niu X., Sutton J.M., Morgan H. Real-time microfluidic recombinase polymerase amplification for the toxin b gene of clostridium difficile on a slipchip platform. Analyst (London) 2015;140:258–264. doi: 10.1039/C4AN01683A. [DOI] [PubMed] [Google Scholar]
- 35.Siegrist J., Gorkin R., Clime L., Roy E., Peytavi R., Kido H., Bergeron M., Veres T., Madou M. Serial siphon valving for centrifugal microfluidic platforms. Microfluid. Nanofluidics. 2010;9:55–63. doi: 10.1007/s10404-009-0523-5. [DOI] [Google Scholar]
- 36.Tsougeni K., Vourdas N., Tserepi A., Gogolides E., Cardinaud C. Mechanisms of oxygen plasma nanotexturing of organic polymer surfaces: from stable super hydrophilic to super hydrophobic surfaces. Langmuir. 2009;25:11748–11759. doi: 10.1021/la901072z. [DOI] [PubMed] [Google Scholar]
- 37.Bhattacharya A., Misra B.N. Grafting: a versatile means to modify polymers: techniques, factors and applications. Prog. Polym. Sci. 2004;29:767–814. doi: 10.1016/j.progpolymsci.2004.05.002. [DOI] [Google Scholar]
- 38.Cáceres C.A., Mazzola N., França M., Canevarolo S.V. Controlling in-line the energy level applied during the corona treatment. Polym. Test. 2012;31:505–511. doi: 10.1016/j.polymertesting.2012.02.002. [DOI] [Google Scholar]
- 39.Ma M., Mao Y., Gupta M., Gleason K.K., Rutledge G.C. Superhydrophobic fabrics produced by electrospinning and chemical vapor deposition. Macromolecules. 2005;38:9742–9748. doi: 10.1021/ma0511189. [DOI] [Google Scholar]
- 40.Kitsara M., Nwankire C.E., Walsh L., Hughes G., Somers M., Kurzbuch D., Zhang X., Donohoe G.G., O Kennedy R., Ducrée J. Spin coating of hydrophilic polymeric films for enhanced centrifugal flow control by serial siphoning. Microfluid. Nanofluidics. 2014;16:691–699. doi: 10.1007/s10404-013-1266-x. [DOI] [Google Scholar]
- 41.Okada H., Kaji N., Tokeshi M., Baba Y. Channel wall coating on a poly-(methyl methacrylate) ce microchip by thermal immobilization of a cellulose derivative for size-based protein separation. Electrophoresis. 2007;28:4582–4589. doi: 10.1002/elps.200700105. [DOI] [PubMed] [Google Scholar]
- 42.Shah J.J., Geist J., Locascio L.E., Gaitan M., Rao M.V., Vreeland W.N. Surface modification of poly(methyl methacrylate) for improved adsorption of wall coating polymers for microchip electrophoresis. Electrophoresis. 2006;27:3788–3796. doi: 10.1002/elps.200600118. [DOI] [PubMed] [Google Scholar]
- 43.Shang M., Li J., Sun X., Su N., Li B., Jiang Y., Chong H., Lu W., Huang Q. Duplex reverse transcription multienzyme isothermal rapid amplification assays for detecting SARS-cov-2. Clin. Lab. 2021;67 doi: 10.7754/Clin.Lab.2021.210239. [DOI] [PubMed] [Google Scholar]
- 44.Lillis L., Siverson J., Lee A., Cantera J., Parker M., Piepenburg O., Lehman D.A., Boyle D.S. Factors influencing recombinase polymerase amplification (rpa) assay outcomes at point of care. Mol. Cell. Probes. 2016;30:74–78. doi: 10.1016/j.mcp.2016.01.009. [DOI] [PMC free article] [PubMed] [Google Scholar]
- 45.Nwankire C.E., Dowling D.P. Influence of nm-thick atmospheric plasma deposited coatings on the adhesion of silicone elastomer to stainless steel. J. Adhes. Sci. Technol. 2010;24:1291–1302. doi: 10.1163/016942409X12561252292062. [DOI] [Google Scholar]
- 46.Coma V., Sebti I., Pardon P., Pichavant F.H., Deschamps A. Film properties from crosslinking of cellulosic derivatives with a polyfunctional carboxylic acid. Carbohydr. Polym. 2003;51:265–271. doi: 10.1016/S0144-8617(02)00191-1. [DOI] [Google Scholar]
- 47.Sojoudi H., Walsh M.R., Gleason K.K., Mckinley G.H. Investigation into the formation and adhesion of cyclopentane hydrates on mechanically robust vapor-deposited polymeric coatings. Langmuir. 2015;31:6186–6196. doi: 10.1021/acs.langmuir.5b00413. [DOI] [PubMed] [Google Scholar]
- 48.Wang M., Wang X., Moni P., Liu A., Kim D.H., Jo W.J., Sojoudi H., Gleason K.K. Cvd polymers for devices and device fabrication. Adv. Mater. 2017;29 doi: 10.1002/adma.201604606. [DOI] [PMC free article] [PubMed] [Google Scholar]
- 49.Encinas N., Pantoja M., Abenojar J., Martínez M.A. Control of wettability of polymers by surface roughness modification. J. Adhes. Sci. Technol. 2010;24:1869–1883. doi: 10.1163/016942410X511042. [DOI] [Google Scholar]
- 50.Owens D.K., Wendt R.C. Estimation of the surface free energy of polymers. J. Appl. Polym. Sci. 1969;13:1741–1747. doi: 10.1002/app.1969.070130815. [DOI] [Google Scholar]
- 51.Nemani S.K., Annavarapu R.K., Mohammadian B., Raiyan A., Heil J., Haque M.A., Abdelaal A., Sojoudi H. Surface modification of polymers: methods and applications. Adv. Mater. Interfac. 2018;5 doi: 10.1002/admi.201801247. [DOI] [Google Scholar]
- 52.Madou M., Zoval J., Jia G., Kido H., Kim J., Kim N. Lab on a cd. Annu. Rev. Biomed. Eng. 2006;8:601–628. doi: 10.1146/annurev.bioeng.8.061505.095758. [DOI] [PubMed] [Google Scholar]
- 53.Zeng J., Banerjee D., Deshpande M., Gilbert J.R., Duffy D.C., Kellogg G.J. In: In Held in Dordrecht, 2000-01-01. van den Berg A., Olthuis W., Bergveld P., editors. Springer Netherlands; 2000. Design analyses of capillary burst valves in centrifugal microfluidics; pp. 579–582. [Google Scholar]
- 54.El Wahed A.A., Patel P., Maier M., Pietsch C., Rüster D., Böhlken-Fascher S., Kissenkötter J., Behrmann O., Frimpong M., Diagne M.M., et al. Suitcase lab for rapid detection of SARS-cov-2 based on recombinase polymerase amplification assay. Anal. Chem. 2021;93:2627–2634. doi: 10.1021/acs.analchem.0c04779. [DOI] [PMC free article] [PubMed] [Google Scholar]
- 55.Tang Y.W., Schmitz J.E., Persing D.H., Stratton C.W. Laboratory diagnosis of covid-19: current issues and challenges. J. Clin. Microbiol. 2020;58:e00512–e00520. doi: 10.1128/JCM.00512-20. [DOI] [PMC free article] [PubMed] [Google Scholar]
- 56.National Institute for Viral Disease Control and Prevention . 2020. Specific Primers and Probes for Detection 2019 Novel Coronavirus.https://ivdc.chinacdc.cn/kyjz/202001/t20200121_211337.html [Google Scholar]
- 57.Lupberger J., Kreuzer K.A., Baskaynak G., Peters U.R., le Coutre P., Schmidt C.A. Quantitative analysis of beta-actin, beta-2-microglobulin and porphobilinogen deaminase mrna and their comparison as control transcripts for rt-pcr. Mol. Cell. Probes. 2002;16:25–30. doi: 10.1006/mcpr.2001.0392. [DOI] [PubMed] [Google Scholar]
- 58.Schneider C.A., Rasband W.S., Eliceiri K.W. Nih image to imagej: 25 years of image analysis. Nat. Methods. 2012;9:671–675. doi: 10.1038/nmeth.2089. [DOI] [PMC free article] [PubMed] [Google Scholar]
- 59.Holstein C.A., Griffin M., Hong J., Sampson P.D. Statistical method for determining and comparing limits of detection of bioassays. Anal. Chem. 2015;87:9795–9801. doi: 10.1021/acs.analchem.5b02082. [DOI] [PubMed] [Google Scholar]
Associated Data
This section collects any data citations, data availability statements, or supplementary materials included in this article.
Supplementary Materials
Data Availability Statement
-
•
All data reported in this paper will be shared by the lead contact upon request.
-
•
This paper does not report original code.
-
•
Any additional information required to reanalyze the data reported in this paper is available from the lead contact upon request.