Abstract
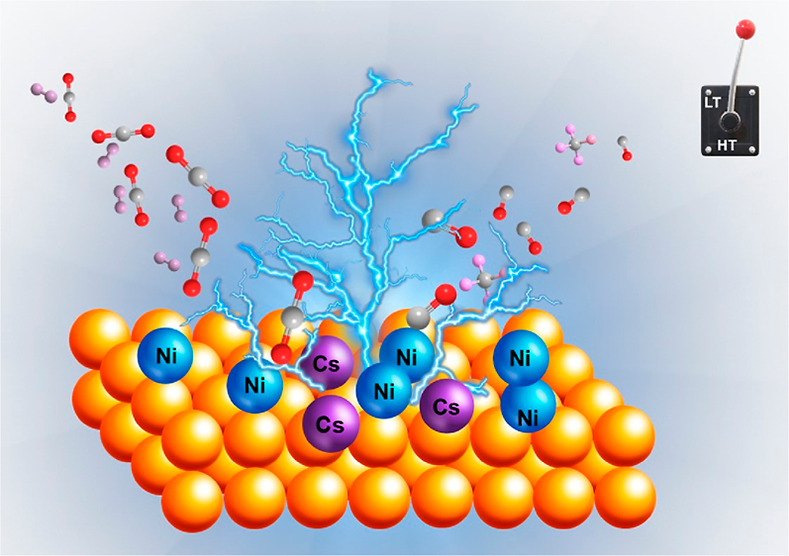
Reverse water gas shift (RWGS) competes with methanation as a direct pathway in the CO2 recycling route, with methanation being a dominant process in the low-temperature window and RWGS at higher temperatures. This work showcases the design of multi-component catalysts for a full-temperature-range RWGS behavior by suppressing the methanation reaction at low temperatures. The addition of alkali promoters (Na, K, and Cs) to the reference Ni/CeO2 catalyst allows identifying a clear trend in RWGS activation promotion in both low- and high-temperature ranges. Our characterization data evidence changes in the electronic, structural, and textural properties of the reference catalyst when promoted with selected dopants. Such modifications are crucial to displaying an advanced RWGS performance. Among the studied promoters, Cs leads to a more substantial impact on the catalytic activity. Beyond the improved CO selectivity, our best performing catalyst maintains high conversion levels for long-term runs in cyclable temperature ranges, showcasing the versatility of this catalyst for different operating conditions. All in all, this work provides an illustrative example of the impact of promoters on fine-tuning the selectivity of a CO2 conversion process, opening new opportunities for CO2 utilization strategies enabled by multi-component catalysts.
1. Introduction
The rapid increase of world population combined with the development of technological advances powered by uncontrolled fossil fuel exploitation has propitiated the perfect conditions to exponentially accelerate climate change, challenging the future of our planet. For instance, Glasgow COP26, celebrated in 2021, has been a powerful platform to introduce signing state members into future zero-emission technologies, which will contribute to reducing the average global temperature to 2 °C (preferably to 1.5 °C), an essential decrease to prevent climate catastrophes.1 More than ever, it is necessary to develop different strategies in the transition to renewable energy that contribute to the reduction of the greenhouse gas effect and mitigate climate changes via CO2 capture and utilization. In this context, the conversion of CO2 into valuable chemicals such as methane or syngas through catalytic routes has been targeted as potential alternatives for large-scale CO2 fixation.2
The hydrogenation of exhausted CO2 can be used to obtain a synthetic natural gas (CH4), which can be further used as a fuel or chemical to produce other high-value products. CO2 methanation is an exothermic reaction, thermodynamically favored at lower reaction temperatures between 200 and 400 °C (eq 1).3 Nevertheless, this reaction consumes 4 mol of H2 per mol CO2, making it very challenging unless an abundant source of green H2 is available. Alternatively, the reverse water gas shift (RWGS) (eq 2) consumes only one mol of H2 per mol of CO2, making it more economically appealing in terms of reactant cost. This reaction is mildly endothermic and highly competitive with the exothermic methanation reaction at low–medium temperatures, making the design of catalysts critical to improve the selectivity and the low-temperature activity to either the RWGS reaction or CO2 methanation.4,5 RWGS is considered a potential route to produce syngas, which is further upgraded in a Fischer–Tropsch (FT) process to obtain fuel hydrocarbon.6 Hence, it is essential to design a new generation of advanced catalysts that allows feasible coupling between FT or methanol conversion and RWGS reactions, opening multiple possibilities for sequential conversion of CO2 to synthetic fuels and chemicals.
| 1 |
| 2 |
In particular, when the RWGS is coupled to a second unit such as FT synthesis or a methanol production reaction, there is a significant temperature gap between both reactors. Typically, the upstream RWGS reaction will run at a high-temperature range around 600–750 °C and downstream unit at 250–400 °C.7 Hence, developing low-temperature RWGS with suppressed CO2-methanation activity is vital to facilitate overall energy integration.
The CO2 molecule is highly stable, which makes the boosting of the kinetic reactions essential through the design of highly active catalysts. For instance, Ni-based catalysts have been the most studied catalyst for CO2 hydrogenation not only due to their high catalytic activity but also for their low cost. Also, Ni-based systems have been proven active in RWGS.8−10 However, this type of system undergoes deactivation with time due to a variety of reasons, such as agglomeration of Ni particles, carbon deposition on Ni particles, and solid-state reactions involving Ni (i.e., spinel formation).11 In this sense, the support has an essential effect on the morphology of the catalyst, adsorption, and catalytic properties that help to prevent the catalyst’s deactivation.12 Due to this, the enhancement between the metal and the support is essential to minimize the aforementioned limitations.13
Different supports have been employed in Ni-based catalysts such as CeO2,14−17 ZrO2,18,19 TiO2,20,21 SiO2,22,23 and Al2O3.24−26 Among these supports, CeO2 has proved to show exceptional performance in the methanation reaction and RWGS due to its high oxygen storage capacity, oxygen mobility, and high reducibility.27,28 For instance, it has been reported that CeO2 is able to not only promote the dispersion of Ni particles in Ni–CeO2 catalysts but also change Ni properties via metal–support interactions.29,30 Recently, different approaches have been suggested to enhance Ni/CeO2 catalysts in CO2 methanation through the design of nanostructured catalysts. It has been proved that the structuration of catalysts is a route to potentiate the maximum CO2 conversion at low temperatures due to the formation of defect sites and oxygen vacancies.31,32 Additionally, it has been shown that the addition of small amounts of promoters such as Mg, Co, Ru, Zr, La, Y, and Fe potentiate the stability and the catalytic activity of Ni-based catalysts in the CO2 hydrogenation reaction.33−35 Recently, le Saché et al. have reported the synthesis of effective switchable ruthenium supported on the CeO2–ZrO2 catalyst for chemical CO2 recycling via CO2 methanation and RWGS, which has been observed to be highly active for both reactions just by adjusting the temperature conditions.36
Promoters, such as alkali metals (Na and K),37,38 alkaline earth metals (Mg, Ca, and Ba),39,40 and transition metals (V, Mn, Zn, and Zr),41−44 have been probed to enhance the Ni-based catalyst activity due to the change in the chemical surface, which promotes chemical adsorption of CO2 and a further decrease in the activation energy of CO2 molecules.45 For instance, K-promoted Ni-based catalysts have been reported to enhance Ni activity to the RWGS reaction due to the improvement of basicity properties and prevention of carbon deposition.46,47 Recently, Azancot et al. have reported an in-depth study to elucidate the catalytic sites formed though the K–Ni interactions and their effect on the dry reforming of methane, which evidenced the formation of Ni–O–K phases promoting the basic sites and improving the stability of the catalyst.48,49 However, a high amount of K may cause a decrease in the catalytic activity and possible corrosion issues in the reactor due to K desorption during the reaction.50 Similarly, Ni-based catalysts with a low amount of Na have shown to control the selectivity of CO2 methanation due to the change in the surface physicochemical properties. An inverse effect was described by Le et al. that showed a negative effect of Na promoted in the Ni/SiO2 catalyst due to the change in the intermediates formed during the reaction as a result of basicity modification.37 Finally, Cs-promoted Ni-based catalysts have been studied to a lesser extent but mostly related to the RWGS reaction due to its enhancement in suppressing the methanation reaction.51,52 Recently, this enhancement of the RWGS reaction has been associated with the effect of Cs in the modification of acid/basic properties of the catalyst, where the alkali metal promotes the formation of basic sites and the stabilization of the active phase, favoring CO selectivity.53 Although the addition of alkali metals in catalysts for CO2 methanation and RWGS has been explored, a systematic study of the effect of alkali metals in the Ni/CeO2 catalyst for low-temperature- and high-temperature RWGS is still lacking.
In this scenario, the present paper showcases the design of multi-component alkali-metal-promoted Ni/CeO2 catalysts with switchable activity for both high- and low-temperature RWGS challenging the competition of CO2 methanation. Along with the design of the catalyst, our work aims to elucidate the effect of the selected promoters in each reaction to establish activity–structure correlations, opening new routes for rational catalyst design, which are urgently needed to address global warming.
2. Techniques and Experimental Methodologies
2.1. Catalyst Synthesis
The alkali-promoted Ni/CeO2 catalysts were synthesized by the wet co-impregnation method, as described elsewhere. For the nonpromoted catalyst (Ni/CeO2), 1.5 g of Ni(NO3)2·6H2O (5.11 mmol) was dissolved in 30 mL of water and mixed with 2.7 g of CeO2 (commercialized by Rhone-Poulenc) while maintaining in homogeneous impregnation for 4 h at room temperature. After the impregnation, the water from the soaked powder was slowly removed by a vacuum-assisted rotary evaporator. The material was dried in air at 100 °C overnight prior to the calcination at 550 °C at a rate of 10 °C/min and kept for 4 h. The nickel content in the Ni/CeO2 catalyst was calculated to be 10 wt %. Similarly, 3 g of the alkali metal-promoted catalyst x–Ni/CeO2 (x = K, Na, Cs) were prepared by mixing 1.5 g of Ni(NO3)2·6H2O (5.11 mmol) and xNO3 (to maintain a nickel content of 10 wt % and a x/Ni molar ratio of 1:10) (0.511 mmol) and were dissolved in 30 mL of water and mixed with CeO2. After the impregnation for 4 h, the water was evacuated from the material, and the catalysts were dried at 100 °C overnight, previous to the calcination at 550 °C for 4 h.
2.2. X-ray Diffraction Measurements
X-ray diffraction measurements were performed to evaluate the crystallinity and phase identification of the catalyst using diffractometer equipment (Siemens D-500) equipped with a Ni-filtered Cu Kα radiation source (40 mA, 45 kV) between 2θ = 10–80°. The patterns were collected using a step size of 0.05° and a step time of 300 s.
2.3. N2 Adsorption Isotherms at −196 °C
A volumetric equipment brand Micromeritics model ASAP 2010 instrument was used to evaluate the textural properties of the materials through the N2 adsorption–desorption isotherms at −196 °C. The samples were degassed at 150 °C overnight in vacuum conditions before the measurements. The Brunauer–Emmett–Teller (BET) method was applied to the experimental data to determine the specific surface area, while the Barrett–Joyner–Halenda (BJH) method was used to obtain the average pore size distribution and pore volume.
2.4. Scanning Electron Microscopy
The catalysts were morphologically evaluated using a Hitachi S4800 microscope equipped with a cold cathode field-emission gun (voltage, from 0.5 to 30 kV), resolution of 1 nm (at 15 kV) in order to elucidate the metal dispersion and the morphology of the synthesized catalysts. Additionally, the microscope is equipped with a Bruker-X Flash-4010 EDX detector with a resolution of 133 eV (at the Mn Kα line).
2.5. X-ray Photoelectron Spectroscopy
X-ray photoelectron spectroscopy (XPS) spectra of the studied catalyst were collected using a constant energy mode K α spectrometer Thermo Fisher Scientific. This equipment poses an energy scan of 200 eV (survey) and a narrow scan of 50 eV aiming to measure the whole energy band and selectively measure the targeted elements. All XPS spectra were collected using an Al Kα radiation source of 1486.6 eV, with a monochromator crystal at 3 mA × 12 kV. The reference binding energy was established using the C 1s core level, which is located at 284.6 eV binding energy (BE). All catalysts were reduced ex situ at 350 °C and conserved in octane until analysis. A residual pressure of ca., 5 × 10⁻⁷ N/m2, was established as a set point in the analysis chamber prior to the experiments.
2.6. Hydrogen Temperature-Programmed Reduction
Hydrogen temperature-programmed reduction (H2-TPR) measurements were conducted in a conventional U-shape reactor. In a typical experiment, 50 mg of the catalyst was exposed to a gaseous mixture of 5% H2/Ar, and a flow rate of 50 mL/min from room temperature to 900 °C with a heating rate of 10 °C/min was used. A thermal conductivity detector was used to track the H2 consumption. Prior to the TPR measurements, the catalyst was pre-treated with He (50 mL/min) at 150 °C for 1 h to eliminate possible impurities.
2.7. Catalytic Activity Test
The catalytic activity of the materials was evaluated using a continuous flow quartz fixed-bed reactor setup with an outside diameter of 0.5 in., which was placed vertically in a tubular furnace. The catalysts were located on top of a quartz wool bed inside that reactor. A thermocouple was located at the center of the reactor to monitor the temperature throughout the experiments. Typically, 250 mg of sample (100–200 μm particle size) was diluted in SiC to obtain a 1 cm3 reactor bed to avoid heat-transfer limitations and placed into a cylindrical reactor. Prior to the reaction, the sample was reduced and activated using a flow of 50 mL/min of H2/N2 (50/50%) at 800 °C for 1 h (step skipped for the nonreduced catalysts). After the reduction of the catalyst, a 50 mL/min gas mixture flow (50% N2, 40% H2, and 10% CO2) was set in the inlet of the reactor and evaluated in the temperature range from 200 to 800 °C, using a temperature increasing rate of 10 °C/min and keeping the system in isothermal conditions in each step for 1 h. The weight hourly space velocity (WHSV) was constantly kept at 12,000 mL g–1 h–1 with a H2/CO2 ratio of 4:1. The gases were fed using Aalborg GFC17S-VBL6-AO mass flow controllers with an accuracy of ±1%. Prior to the analysis of the outlet stream, the produced water was condensed using a chiller-condenser system. The outlet stream was quantified using an ABB AO2020 Advanced Optima Process Gas Analyzer, where several values are extracted during the 1 h isothermal condition step. The catalytic activity was quantified calculating the CO2 conversion (eq 3) and CH4 (eq 4) and CO (eq 5) selectivities
| 3 |
| 4 |
| 5 |
where  is the concentration of CO2 in
the inlet stream and
  ,
,  , and FCOout correspond to the concentrations
of CO2, CH4, and CO at the outlet streams, respectively.
ChemStations’ ChemCad software (Soave–Redlich–Kwong equation of state) was used to obtain the theoretical thermodynamic equilibrium for CO2 conversion in the analysis temperature range and flow conditions aiming to provide a complete overview of the experimental results. The resulting theoretical equilibrium curve is shown in the catalyst CO2 conversion performance plot figures.
2.8. Catalyst Stability Test
The stability of the catalysts was evaluated by performing switching cycles in the temperature range of low- (CO2 methanation range) and high-temperature RWGS using the same reaction conditions as used in catalyst activity tests.
3. Results
3.1. X-ray Diffraction
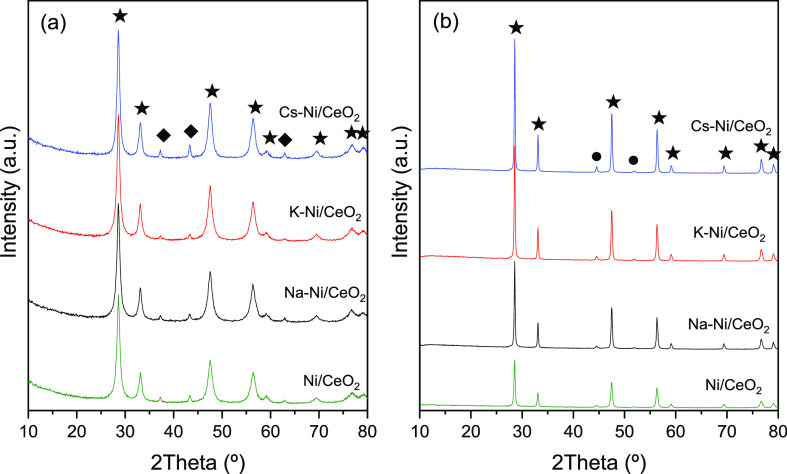
X-ray diffraction (XRD) measurements were used to evaluate the structural characteristics of the catalysts, as depicted in Figure 1. The XRD patterns of the fresh calcined catalysts (Figure 1a) show the typical peaks of the CeO2 at 2θ (°) = 28.67, 33.05, 44.55, 56.50, 59.26, 69.41, 76.63, and 78.91. Additionally, reflection planes attributed to the NiO are observed at ca. 2θ (°) = 37.14, 43.1, and 62.82 (JDPS 47-1094). However, after the reduction under a H2 atmosphere, higher crystallinity and bigger particles of CeO2 are observed (Figure 1b). In addition, the reflection planes (111) and (200) of metallic Ni at 2θ = 44.7 and 51.9, respectively, appear upon treatment under a reductive atmosphere. The absence of any diffraction peak attributed to the alkali promoters in the calcined and reduced catalyst is attributed to the small amount of metal (1:10 x/Ni molar ratio x = Na, K, and Cs) and also to their high dispersion. The average crystal size was quantified by using the Scherrer equation evaluating the FMWH as summarized in Table 1. The Ni crystal size in both the calcined and reduced catalysts increases with the addition of the promoters. However, the increase in the Ni particle size is more evident in the reduced catalyst. For instance, Chen et al. showed that K species in Ni-based catalysts weakens the Ni2+ support interactions, enhancing the particle growth.47,50 Similarly, average crystal sizes for CeO2 were calculated using the (111) diffraction plane at 2θ = 28.6° (Table 1), where an increase is observed in the CeO2 crystal size after the incorporation of K, Na, and Cs in the catalyst. This increase can be explained due to the modifications in grain boundary mobility brought by the promoter loading. For instance, it has been reported that at low Na+ loadings (0.5–2 wt %), Na+ cations diffuse and incorporate into the CeO2 lattice, generating oxygen vacancies that enhance the grain boundary mobility.54,55
Figure 1.
XRD diffraction patterns of (a) calcined catalysts and (b) H2 reduced catalysts. [(★) CeO2 JDPS 34-0394, (●) Ni JDPS 04-0850, and (◆) NiO JDPS 47-1094].
Table 1. Crystal Size and Textural Properties of the Calcined and Reduced Catalysts.
| crystal
size (nm) |
||||||
|---|---|---|---|---|---|---|
| calcined |
reduced |
|||||
| catalyst | NiOa | CeO2c | Nib | CeO2c | SBET(m2/g) | VT (cm3/g) |
| Ni/CeO2 | 17.6 | 16.4 | 18.9 | 27.9 | 132 | 0.061 |
| Na–Ni/CeO2 | 20.4 | 21.2 | 37.9 | 34.9 | 113 | 0.051 |
| K–Ni/CeO2 | 17.5 | 18.5 | 28.3 | 34.9 | 106 | 0.046 |
| Cs–Ni/CeO2 | 20.5 | 21.2 | 28.3 | 34.9 | 101 | 0.042 |
Calculated using the NiO(200) diffraction plane.
Calculated using the Ni0(111) diffraction plane.
Calculated using the CeO2(111) diffraction plane.
3.2. Nitrogen Isotherms at −196 °C
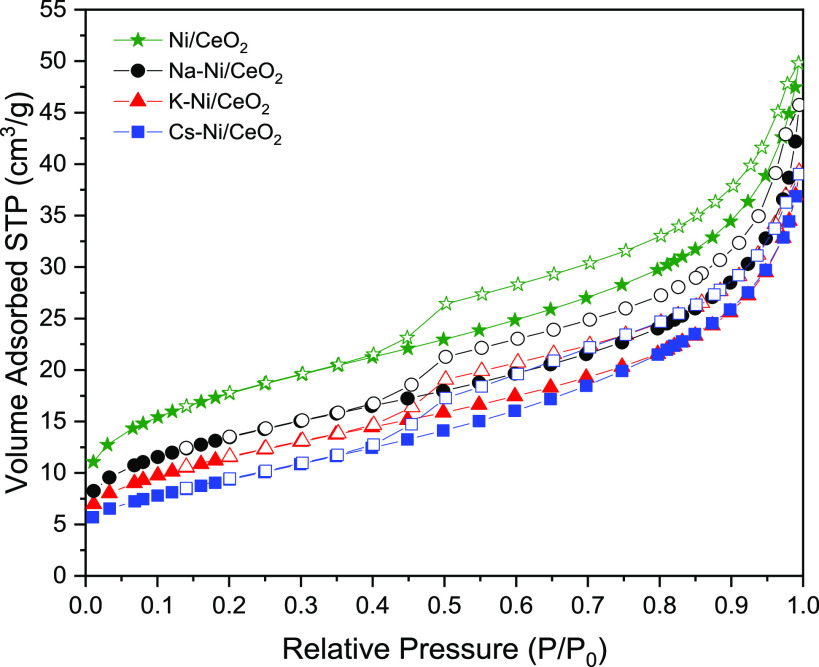
Nitrogen adsorption/desorption isotherms were recorded at −196 °C to evaluate the textural properties of the catalysts. As observed in Figure 2, the four catalysts present a typical isotherm of mesoporous materials. Furthermore, all samples show a type IV isotherm which is characteristic of mesoporous materials with a hysteresis loop H3.56 The surface area of the alkali-promoted catalysts suffers from not only a notable decrease in comparison with the Ni/CeO2 catalyst due to the partial block of the cavities but also the formation of bigger particles in the surface of the catalyst, which are in agreement with the tendency observed in the crystal size. In addition, the pore volume of the promoted catalyst shows a reduction of ca. 23% as a result of the incorporation of the promoters. This decrease in the textural properties follows the trend of Na < K < Cs, which is concordant with the promoter atomic radii (i.e., Na, 180 pm; K, 220 pm; and Cs, 265 pm). Finally, Figure S1 shows the pore size distribution of the catalysts, where it is observed that the incorporation of the promoters do not have a considerable effect in the pore characteristics compared to the monometallic catalyst.
Figure 2.
N2 isotherms at −196 °C of the evaluated catalysts.
3.3. Scanning Electron Microscopy
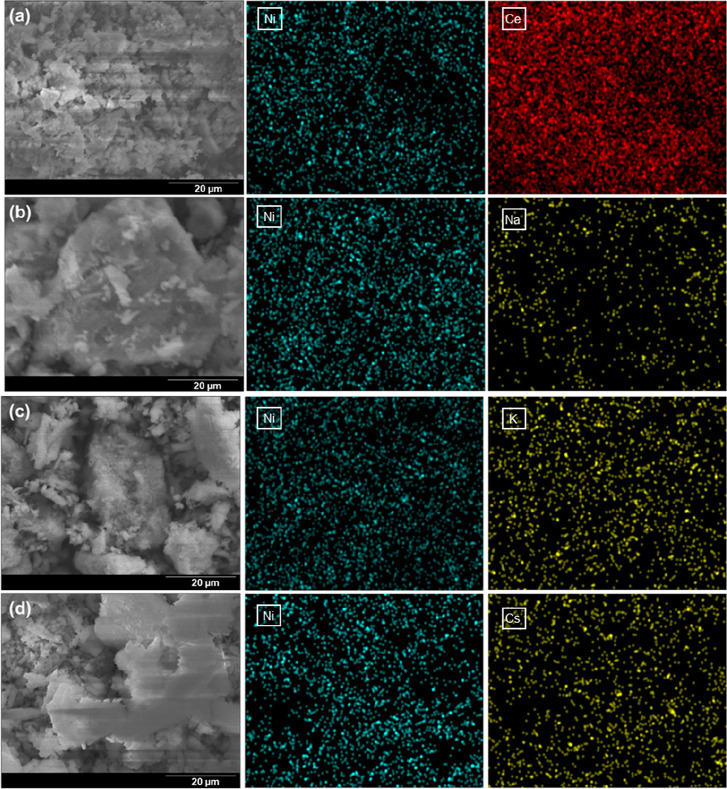
The elemental composition and morphology of the alkali-promoted Ni supported in CeO2 catalysts were studied using a scanning electron microscope, equipped with an energy-dispersive X-ray spectrometer. Figure 3 shows the scanning electron microscopy–energy-dispersive X-ray spectrometry (SEM–EDS) images of the catalysts. In all catalysts, a Ni phase homogeneously dispersed through the support is observed. Furthermore, in the case of Na-, K-, and Cs-promoted Ni-based catalysts, the alkali metals are also found to be highly dispersed on the surface of the catalyst in close contact with Ni particles favoring active phase–promoter interactions. From the morphology perspective, no significant differences among the studied samples are observed.
Figure 3.
SEM images and EDS spectra of (a) Ni/CeO2, (b) Na–Ni/CeO2, (c) K–Ni/CeO2, and (d) Cs–Ni/CeO2.
3.4. X-ray Photoelectron Spectroscopy
3.4.1. Calcined Samples
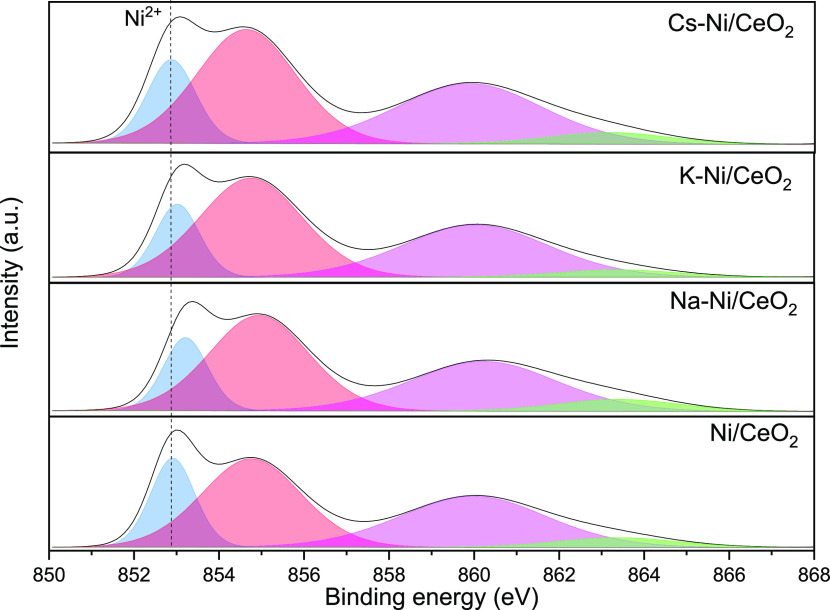
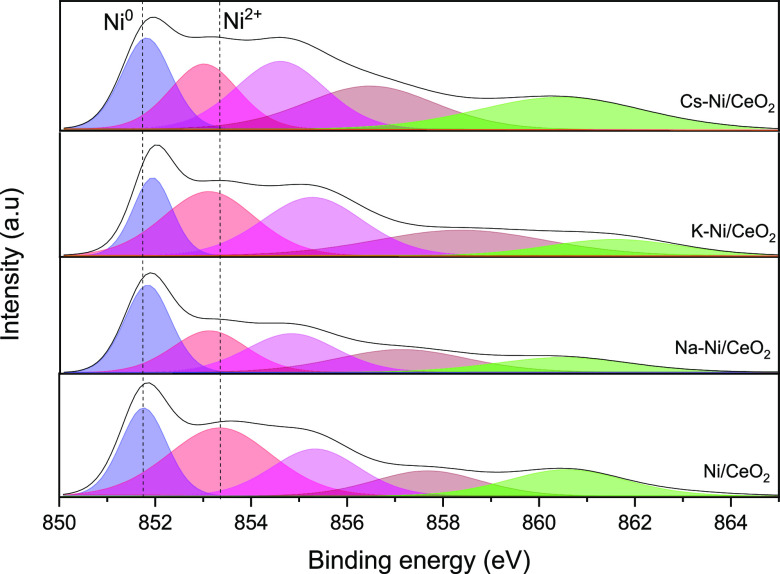
X-ray photoelectron spectroscopy (XPS) analysis was carried out to elucidate the effect of promoters on the chemical environment states of Ni and surface composition. Figure 4 summarizes the Ni 2p3/2 XPS spectra of the calcined samples, and the relative distribution of Ni2+ in the CeO2 support is summarized in Table 2. Typical peaks of Ni2+ in different environments appear at BEs close to 852.9 and 855 eV. However, in alkali-promoted catalysts, these peaks shifted to higher BE values as a consequence of the change of the environmental surface chemistry caused by the addition of the promoters, as previously reported elsewhere.47,54 For instance, previous works showcased the partial formation of K2NiO2 or K2NiO3 phases after sample calcination at 450 °C.57 As reported in Table 2, the Ni2+/CeO2 ratio suffered a decrease after the incorporation of the promoters, evidencing the partial coverage of Ni and a possible particle size increase due to the weakening of the Ni2+–support interaction as discussed in the X-ray Diffraction section.
Figure 4.
XPS spectra of the Ni 2p3/2 region for all the calcined samples.
Table 2. BEs of the Ni 2p3/2 Levels for the Calcined Catalysts and Ni2+/CeO2 Atomic Ratios.
| Ni 2p3/2 |
||
|---|---|---|
| Ni2+ | Ni2+/CeO2 | |
| catalysts | BE (eV) | a.u. |
| Ni/CeO2 | 852.9–854.7 | 1.84 |
| Na–Ni/CeO2 | 853.2–854.9 | 0.77 |
| K–Ni/CeO2 | 853.0–854.7 | 0.58 |
| Cs–Ni/CeO2 | 852.8–854.6 | 0.58 |
3.4.2. Reduced Samples
On the other hand, the XPS spectra of the H2 pre-reduced samples present several differences in comparison with that of the nonactivated catalysts. As summarized in Table 3, the Ni0/(Nitotal) ratio increases after the incorporation of the promoters, which reveals that the addition of alkali metals facilitates the reduction of Ni in the x-Ni/CeO2 (x = Na and Cs) catalysts, showing a promoting effect of alkali metals in the reducibility behavior of NiO particles as well as a promotional effect rendering higher surface metallic Ni availability. Interestingly, the opposite was observed for the K-containing sample. This could be attributed to the formation of K2NiO2 or K2NiO3 phases that make the Ni reduction difficult. Additionally, in the presence of Ni0, after the reduction of catalysts, it is important to mention that in the case of promoted catalysts, the binding energy of Ni2+ species is shifted to a lower BE (Figure 5), which may also be an indicator of the electron transference between the alkali metal and Ni, as has been described in previous publications.58 Particularly, the observed shift of BEs of Ni0 and Ni2+ in the XPS spectra of Cs-promoted catalysts becomes more evident due to the marked electropositive nature of Cs, which presents a high tendency to transfer electrons and thus leads to remarkable alteration of the surface chemical environment in the Cs-containing system.
Table 3. BEs of the Ni 2p3/2 Levels for the Reduced Catalysts and Ni0/Nitotal Atomic Ratios.
| Ni 2p3/2 | Ce 3d3/2 | |||
|---|---|---|---|---|
| Ni0 | Ni2+ | Ni0/(Nitotal) | Ce4+ | |
| catalysts | BE (eV) | BE (eV) | % | BE (eV) |
| Ni/CeO2 | 851.8 | 853.4–855.3 | 26.6 | 915.94 |
| Na–Ni/CeO2 | 851.8 | 853.1–854.8 | 38.1 | 916.11 |
| K–Ni/CeO2 | 851.9 | 853.1–855.2 | 20.6 | 916.09 |
| Cs–Ni/CeO2 | 851.8 | 853.0–854.6 | 29.9 | 916.13 |
Figure 5.
XPS spectra of the Ni 2p3/2 region for all the reduced samples.
3.5. H2-Temperature-Programmed Reduction
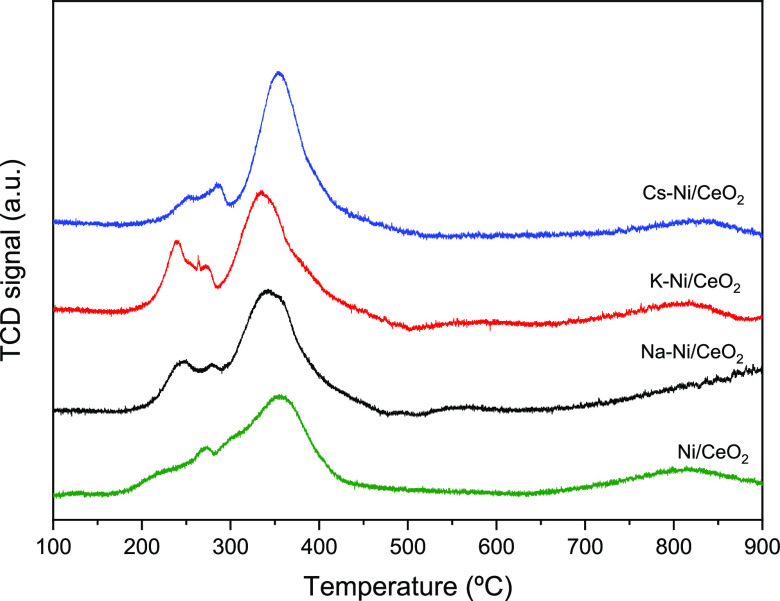
Further understanding of the redox properties, as well as the metal–support and metal–promoter interaction, was gained from TPR measurements. Figure 6 shows the H2-TPR consumption profiles of the Ni-based catalyst and its alkali-promoted counterparts. All samples show the characteristic peak centered at ca. 350 °C, which is commonly assigned to the reduction of Ni2+ interacting with the CeO2 support and the reduction of surface ceria species that can be easily reduced by dissociated hydrogen on metallic Ni.59,60 The TPR peak above 500 °C is attributed to the reduction of bulk ceria. Additionally, for the Ni/CeO2 samples, a smaller peak can be seen at lower temperatures (ca. 250 °C), which can be attributed to the reduction of small NiO particles and NiO particles weakly interacting with ceria.61 Interestingly, promoted catalysts present an increase in H2 consumption at this lower-temperature zone. For the three promoter samples, two small reduction events appear, which testifies the boosting effect of the addition of the promoters in the reducibility as a result of the incorporation or close contact of alkali cations with the CeO2 lattice, resulting in lattice distortion and creation of oxygen vacancies, as it has been suggested in previous publications.54 This distortion and generation of oxygen may increase the oxygen mobility and, as a consequence, enhance the reducibility of the NiO particles.62 Furthermore, this reducibility can be equally associated with the promoter–nickel interactions that allow a promoted reduction of Ni due to the nature of alkali metals in good agreement with our obtained XPS data. It can be highlighted that the K–Ni/CeO2 sample presents a slight shift to lower temperatures of the entire TPR profile that allows us to correlate these results with those obtained by XRD. It is well known that the reduction temperature is directly correlated with the metal particle size, which is demonstrated for this catalyst as a smaller crystallite size of NiO and CeO2 (Table 1) as the reason for the small change in the reduction temperature.
Figure 6.
H2-TPR profiles of all the studied catalysts.
3.6. Catalytic Activity
Given the multiple scenarios and flue gases in which CO2 conversion units may fit, we envisage versatile catalysts as key players for industrial decarbonization. In this sense, we tested our catalysts’ RWGS in the full temperature range to allow end-product flexibility. For instance, the low-temperature range pursues the integration of RWGS with an FT unit to produce synthetic fuels, while the high-temperature RWGS leads to CO (and syngas) as a valuable feedstock for the chemical industry. Catalysts were pre-conditioned (reduction) with H2 before the reaction took place. However, the pre-activation carries an extra cost to the process, and because both RWGS and CO2 methanation are predominantly reductive atmospheres, fresh (nonreduced) samples were also tested to check whether the pre-conditioning step could be ruled out.
3.6.1. Nonreduced and Reduced Catalysts
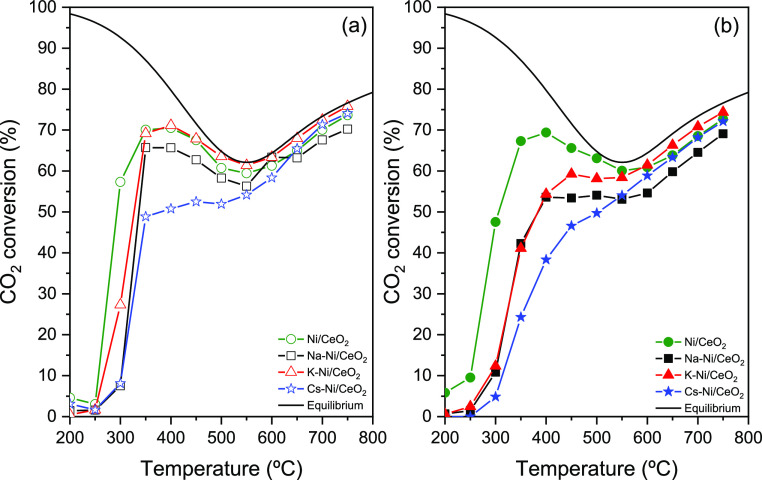
Figure 7a,b shows the CO2 conversion of Ni/CeO2 and Na-, K-, and Cs-promoted catalysts without pre-activation treatment and H2 reduced ones, respectively. The 1:10 promoter/Ni ratio in the catalyst was selected based on previous publications that suggested that low concentrations of alkali metals can help to not only enhance and control the selectivity in the methanation reaction and RGWS via alkali metal–Ni interactions but also generate oxygen vacancies in CeO2 due to incorporation of alkali in the oxide lattice.54 As observed in Figure 7a, the addition of Na, K, and Cs has an effect on the CO2 conversion with a reduction of the catalytic activity following the trend Cs < Na < K at lower temperatures. This is in agreement with the catalyst’s characterization, where a partial coverage of Ni particles by promoters is observed. The decrease in the catalytic activity may be attributed to this partial coverage of Ni nanoparticles by the promoters, obtaining the lower conversion with the catalysts promoted with the bigger alkali metals (Cs, 2.67 Å; K, 2.35 Å; and Na, 1.90 Å atomic radius). In the case of Na-promoted catalysts, this decrease in the catalytic activity is also affected by the bigger particle size. As it was observed in the XRD, the Na-promoted catalyst presents a bigger particle size compared with other catalysts from the series. This inherently causes the worst active phase dispersion and fewer active site availability and, by consequence, a decrease in the catalytic activity. Additionally, after performing a reduction treatment of the catalysts in a H2 atmosphere up to 750 °C (Figure 7b), this decrease in the catalytic activity becomes more evident following a similar trend between the alkali metals. This trend may be attributed to not only the effect of the promoters on the particle size and dispersion of the active phase of the catalysts but also the thereof mentioned partial coverage of some Ni active sites by the alkali metals.37,63
Figure 7.
CO2 conversion of (a) nonreduced and (b) pre-reduced at 750 °C catalysts. Conditions: atmospheric pressure, WHSV = 12,000 mL gcat–1 h–1, H2/CO2 = 4:1.
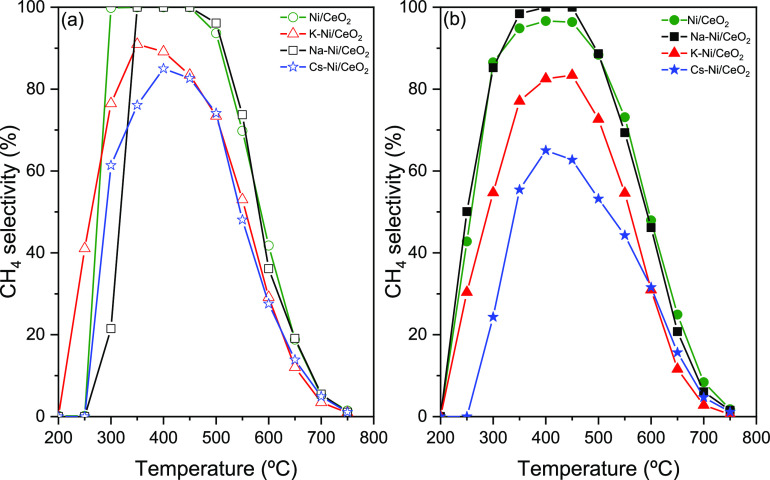
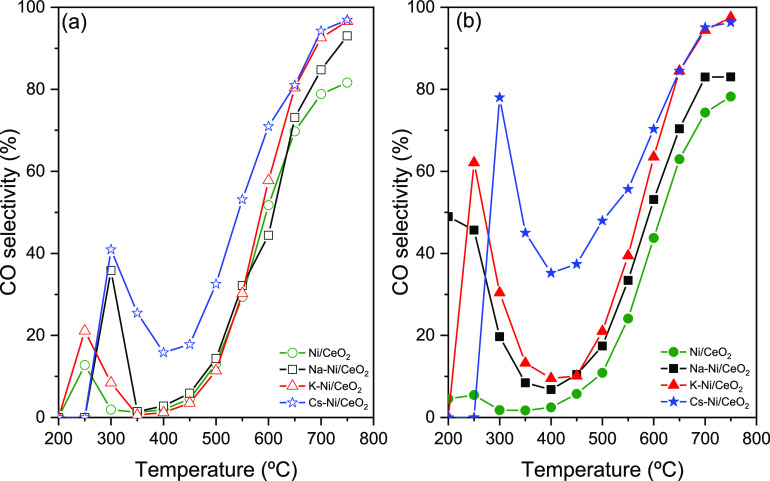
Similarly, if we observe Figure 8a,b, which presents the CH4 selectivity in the nonactivated and in the reduced catalysts, respectively, the promoted catalysts show a different performance in comparison to the reference system, especially in reduced catalysts where we observed a more notorious suppressive effect of the methanation reaction in the promoted catalysts. For instance, Zhang et al. suggested that the addition of alkali metals with an alkaline support in Ni-based catalysts may stir the reaction by the generation of HCOO* and CO32– intermediates, which slow down their further reduction to CH4.64 The opposite is observed in the CO2 conversion, and the addition of the alkali metals has a considerable promoting effect on the increase of CO selectivity (Figure 9a,b). Despite the promoting effect of the three alkali metals in CO selectivity, in the specific case of the Cs–Ni/CeO2 catalyst, an important improvement is observed in the selectivity in both low- and high-temperature ranges, which confirms the effect of the promoter in the performance of low- and high-temperature RWGS. Most importantly, even though Cs slightly lowers CO2 conversion in the low-temperature range, the selectivity for RWGS is remarkably boosted. When we focus on CH4 selectivity in Figure 8b, we can find that at low temperatures the Cs–Ni/CeO2 catalyst is able to suppress the CH4 formation by approximately 30%, while the CO selectivity (Figure 9b) is enhanced, indicating the suitability of this multicomponent system for all temperature range RWGS.
Figure 8.
CH4 selectivity for (a) nonreduced and (b) reduced at 750 °C catalysts. Conditions: atmospheric pressure, WHSV = 12,000 mL gcat–1 h–1, H2/CO2 = 4:1.
Figure 9.
CO selectivity for (a) nonreduced and (b) reduced at 750 °C catalysts. Conditions: atmospheric pressure, WHSV = 12,000 mL gcat–1 h–1, H2/CO2 = 4:1.
As observed in Figure 9a,b, this CO-selective boosting effect and CH4 suppression at low temperatures are less evident in the Na–Ni/CeO2 catalyst, which may be attributed to the bigger particle size and low convergence of the active sites compared to other catalysts. Additionally, in general terms, this suppression of CH4 and boosting of CO formation can also be explained as due to the lower hydrogen coverage of the active metals and the hindrance the H-assisted CO dissociation.65,66
A similar phenomenon is observed in the K-promoted Ni/CeO2 catalysts, while in the nonreduced catalyst, the effect of the alkali metal is less drastic in terms of suppressing the CH4 selectivity and enhancing the CO formation. The H2-reduced catalysts present a decrease in the catalytic activity similar to that observed in Na–Ni/CeO2. Despite the decrease in CO2 conversion in the K–Ni/CeO2 catalyst (Figure 7), there is a clear effect of K in the suppressing effect of CH4 formation (Figure 8), while boosting the formation of CO at low temperatures (Figure 9), reaching a CO selectivity up to 60% at 250 °C. The boosting of CO formation in K-promoted catalysts can be explained by the weak interactions of CO and the catalyst surface, which may cause the CO species to desorb rather than be further hydrogenated into CH4.67 Additionally, the reduction in the CO2 conversion at low temperatures may be explained due to the interactions K–Ni that covers Ni nanoparticles that also favor weaker surface–CO interactions, as suggested in previous publications.50
Overall, the CO boosting effect of the promoted catalysts compared with that of the nonpromoted Ni/CeO2 catalyst gives evidence of the suitability of these catalyst systems in the design of novel catalysts being able to work in the complete temperature range of the RWGS reaction. For instance, from Table 4 that summarizes the CO production rates in the evaluated catalysts at a low temperature (350 °C), it can be observed that using the Cs-promoted catalyst it is possible to obtain a CO production rate that is 10 times bigger compared to the nonpromoted catalyst in confirming our strategy of designing a full-temperature-range RWGS catalyst. Furthermore, all alkali-promoted catalysts show an improvement in the CO production compared to that of the monometallic Ni-based catalyst.
Table 4. Comparative CO Production Rates (μmol CO•gcat.–1•s–1) of the Studied Catalysts.
| CO rate (μmol CO gcat.–1 s–1) |
||||
|---|---|---|---|---|
| sample | nonreduced | reduced | temperature (°C) | reference |
| Ni/CeO2 | 0.126 | 0.169 | 350 | this work |
| K–Ni/CeO2 | 0.062 | 0.813 | 350 | this work |
| Na–Ni/CeO2 | 0.136 | 0.529 | 350 | this work |
| Cs–Ni/CeO2 | 0.882 | 1.425 | 350 | this work |
| Ni–TiO2 | 1.767 | 360 | Li et al.68 | |
| Ni–TiO2–NH3 | 0.411 | 360 | Li et al.68 | |
| β-Mo2C | 1.000 | 300 | Zhang et al.69 | |
| Pt–Al2O3 | 1.600 | 400 | Kim et al.70 | |
| NiFe/CeAl | 0.513 | 400 | Yang et al.71 | |
| NiCr/CeAl | 0.454 | 400 | Yang et al.71 | |
| Ni/CeAl | 0.461 | 400 | Yang et al.71 | |
| Ni/Al | 0.469 | 400 | Yang et al.71 | |
| Rh/S-1 | 0.333 | 300 | Wang et al.72 | |
| Rh@S-1 | 0.167 | 300 | Wang et al.72 | |
3.7. Stability and Switchability Test
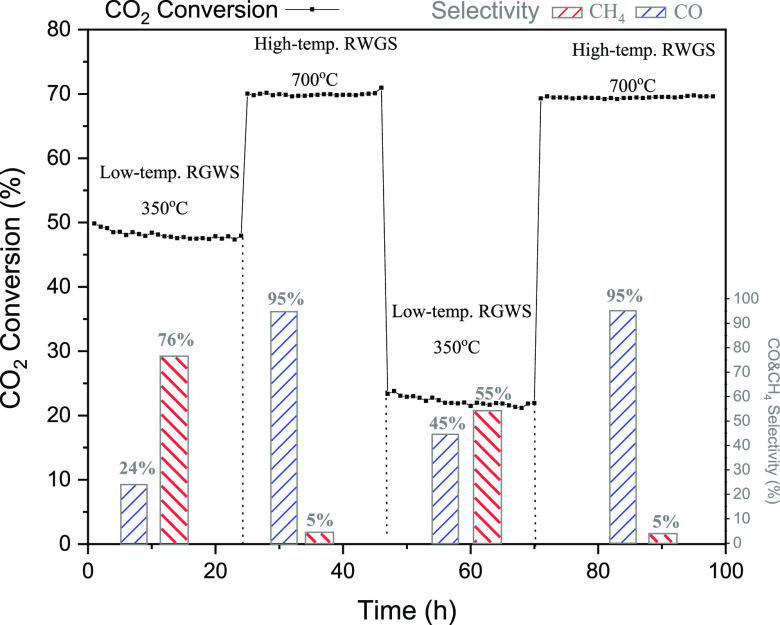
The stability of the catalysts is an essential parameter to evaluate its potential for use in large-scale applications. Because it has been widely described in the literature about the rapid sintering and deactivation of Ni-based catalysts in the CO2 methanation reaction and especially in RWGS,73 we evaluated the stability of the Cs–Ni/CeO2 catalyst, which presented the most relevant performance in terms of selectivity in the low-temperature RWGS reaction. This catalyst presented the best compromise between higher CO selectivity and CO2 conversion. The stability tests were conducted over four cycles of 24 h switching from 350 to 700 °C in order to mimic a change between low-temperature RWGS conditions and the commonly used RWGS reaction conditions.
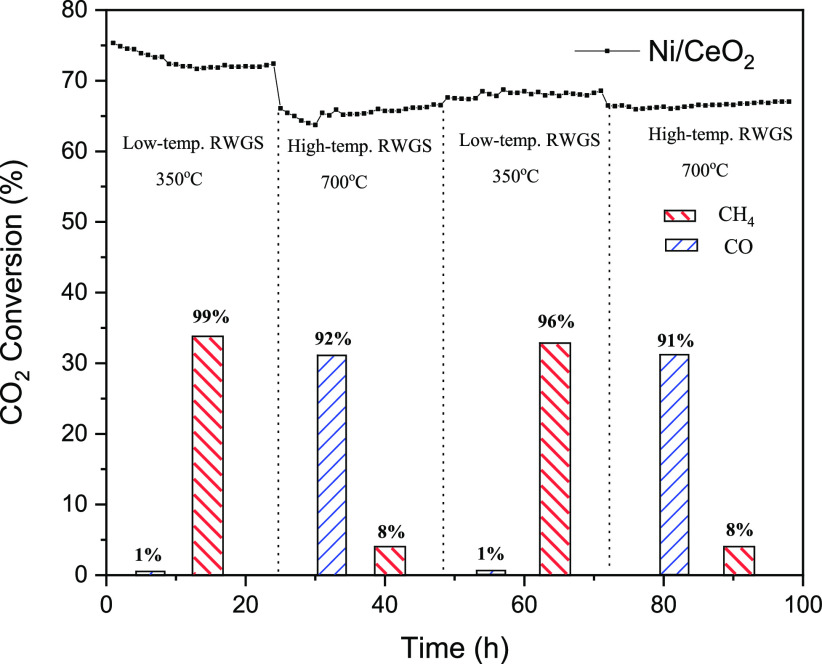
For the sake of comparison with the reference system, Figure 10 shows the stability test in Ni/CeO2 varying the temperature from 350 to 700 °C, where the track of CO2 selectivity is combined over the analysis time and the associated product selectivity (shown as bars due to the stability of the catalyst through the step). The results clearly show that Ni/CeO2 is stable in each reaction range, just showing a slight catalytic activity decrease after the first cycle. However, especially in the RWGS cycles, a decrease of ca. 10% is observed in the catalytic activity, possibly attributed to the partial sintering of Ni particles. The switch in the cycle highly affects the product selectivity, which shows the successful transition from the low-temperature RWGS to high-temperature RWGS. For instance, the selectivity products perfectly match with the values of the catalytic activity described in Figure 7.
Figure 10.
Stability test for the nonreduced Ni/CeO2 catalyst, switching temperature from 350 to 700 °C. CO2 conversion is shown as dotted lines, CH4 selectivity as red bars, and CO selectivity as blue bars. Conditions: atmospheric pressure, WHSV = 12,000 mL gcat–1 h–1, H2/CO2 = 4:1.
Figure 11 shows the evolution of CO2 conversion, and its product selectivity through the four cycles switching from low-temperature (350 °C) to high-temperature (700 °C) RWGS reaction conditions in the Cs-promoted Ni/CeO2 catalyst (Cs–Ni/CeO2). In the first cycle, the catalyst was reduced in situ, showing similar values of CO2 conversion and product selectivity, as reported above. Additionally, at 350 °C, the CO selectivity improved up to 24% compared to that of the monometallic catalyst, and the activity remained stable for 24 h. The second step in cycle 1 corresponds to the RWGS reaction conditions, where not only a higher CO2 conversion was observed but also the CO selectivity remained stable for up to 24 h. However, in cycle 2, which corresponds to the catalyst already reduced during the reaction, the catalytic activity suffered from a decrease in the CO2 methanation conditions due to the sintering of the particles, as was observed in Figure 7. Despite the decrease in the catalytic activity, under these conditions, the methanation suffered a remarkable suppression, and the CO selectivity was boosted up to 45% compared to that of the monometallic catalyst. Finally, in the second step of cycle 2, the catalyst was subject to a second time to the RWGS conditions (700 °C), showing a similar CO selectivity as in cycle 1 again and giving evidence of its high stability after almost 100 h of experiment. This reflects the effect of Cs on not only boosting the CO selectivity but also the stability on the catalyst via Ni particle stabilization, which makes this catalyst a potential candidate for RWGS. It is highly advantageous in terms of energy optimization to have a catalyst that presents a CO selectivity up to 45% at low temperatures (350 °C) rather than at 600 °C as required for the Ni/CeO2 catalyst.
Figure 11.
Stability test for the nonreduced Cs–Ni/CeO2 catalyst, switching temperature from 350 to 700 °C. CO2 conversion is shown as the dotted line, CH4 selectivity as red bars, and CO selectivity as blue bars. Conditions: atmospheric pressure, WHSV = 12,000 mL gcat–1 h–1, H2/CO2 = 4:1.
3.8. Characterization of the Spent Catalysts
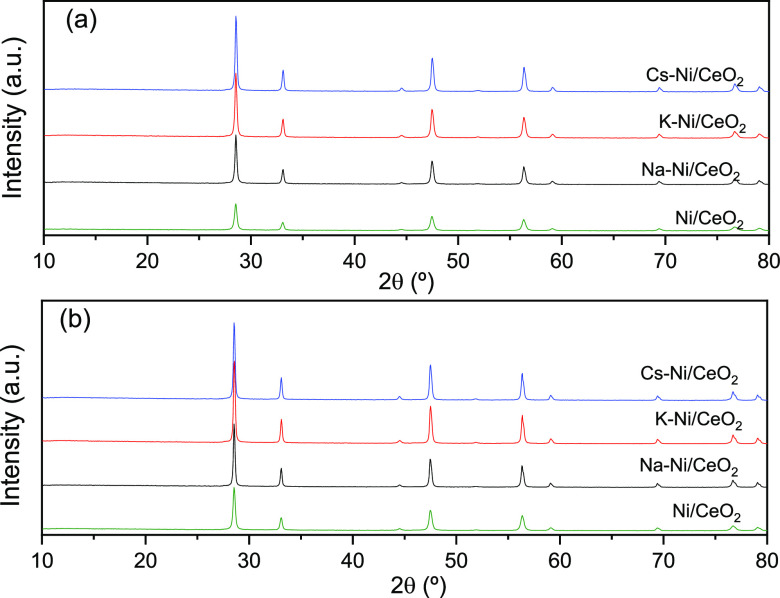
The XRD patterns of the spent catalyst provide valuable information related to the effect of the promoters on the active phase of the catalyst after the catalytic performance. In addition to the stability tests described in the previous section for both the nonpromoted and Cs-promoted catalysts, Figure 12 shows the XRD patterns of the spent catalyst, both nonreduced and reduced. From these XRD patterns, an increase in the Ni particle size was observed after the incorporation of promoters (Table 1); whereas from Table 5 which summarizes the Ni particle size of the spent catalysts, a considerable increase in the Ni particle size was observed in the nonpromoted catalyst, mainly attributing to the widely described sintering effect of Ni. However, the average particle size of the spent promoted catalysts remained more stable, which give evidence of the effect of alkali promoters in the sintering of Ni nanoparticles.
Figure 12.
XRD patterns of spent (a) nonreduced and (b) reduced catalysts.
Table 5. Average Crystal Size of Ni in Spent Catalysts.
| crystal
size (nm) |
||
|---|---|---|
| Spent |
||
| catalyst | Ni | Ni (reduced) |
| Ni/CeO2 | 28.3 | 29.6 |
| Na–Ni/CeO2 | 38.2 | 39.5 |
| K–Ni/CeO2 | 29.7 | 30.1 |
| Cs–Ni/CeO2 | 28.3 | 28.7 |
4. Conclusions
The addition of alkali metals in Ni-based catalyst systems was evaluated as a strategy in the design of novel flexible catalysts for the RWGS reaction in both low- and high-temperature ranges, facilitating a potential coupling between FT or methanol conversion and RWGS reactions. It was observed that the addition of Na, Cs, and K into the Ni/CeO2 catalyst modified not only the textural properties of the catalyst but also the chemical and electronic surface properties as was observed from the XPS and H2-TPR measurements, which has an inherent effect on the catalytic performance. For instance, it was observed that the addition of alkali metals improved the reducibility and also the dispersion of the active phase of the Ni/CeO2 catalyst. The catalytic activity was studied on both the nonreduced and H2 pre-reduced catalysts and the effect of pretreatment conditions on the selectivity of the products was observed. Furthermore, the boosting effect of the alkali metals on the CO selectivity was observed, especially in the Cs–Ni/CeO2 catalyst, with an increase of ca. 40% in CO selectivity at 350 °C compared to the nonpromoted catalysts. Additionally, the stability test performed in the Cs–Ni/CeO2 catalyst showed that this catalyst could switch from low-to high-RGWS reaction, obtaining a relevant performance in terms of CO selectivity compared with that of the Ni/CeO2 catalyst. We acknowledge that further research is needed to improve the catalyst’s activity in low-temperature ranges and to fully suppress methanation. In this sense, our multi-component catalysts open new research avenues toward the design of switchable low/high-temperature RWGS reaction units for gas-phase CO2 conversion, representing a step ahead in catalyst optimization to combat global warming.
Acknowledgments
The authors would like to acknowledge financial support from grants PID2019-108502RJ-I00 and IJC2019-040560-I, both funded by MCIN/AEI/10.13039/501100011033, as well as from RYC2018-024387-I funded by MCIN/AEI/10.13039/501100011033 and by ESF Investing in your future. This research was also partially funded by the University of Seville via the VI PPIT grant scheme for talented researchers and the BIOALL project MSCA-RISE 2020 (grant agreement ID: 101008058).
Supporting Information Available
The Supporting Information is available free of charge at https://pubs.acs.org/doi/10.1021/acs.energyfuels.2c00784.
Pore size distribution of the evaluated catalysts calculated using the BJH model (PDF)
Author Contributions
J.G.-L.: performed the synthesis and the characterization, as well as contributed to the writing of the original draft, Q.Z.: catalytic test and data processing, J.J.V.-P.: performed XPS measurements, A.S.-E.: XPS data processing and contributed to improving the manuscript, L.P.-P.: catalyst characterization and contributed to improving and review of the manuscript, and T.R.R.: supervision, project administration, and review of the manuscript.
The authors declare no competing financial interest.
Supplementary Material
References
- Masood E.; Tollefson J. ‘COP26 Hasn’t Solved the Problem’: Scientists React to UN Climate Deal. Nature 2021, 599, 355–356. 10.1038/d41586-021-03431-4. [DOI] [Google Scholar]
- Wu J.; Zhou X.-D. Catalytic Conversion of CO2 to Value Added Fuels: Current Status, Challenges, and Future Directions. Chin. J. Catal. 2016, 37, 999–1015. 10.1016/S1872-2067(16)62455-5. [DOI] [Google Scholar]
- Ashok J.; Pati S.; Hongmanorom P.; Tianxi Z.; Junmei C.; Kawi S. A Review of Recent Catalyst Advances in CO2 Methanation Processes. Catal. Today 2020, 356, 471–489. 10.1016/j.cattod.2020.07.023. [DOI] [Google Scholar]
- Zhu M.; Ge Q.; Zhu X. Catalytic Reduction of CO2 to CO via Reverse Water Gas Shift Reaction: Recent Advances in the Design of Active and Selective Supported Metal Catalysts. Trans. Tianjin Univ. 2020, 26, 172–187. 10.1007/s12209-020-00246-8. [DOI] [Google Scholar]
- Renda S.; Ricca A.; Palma V. Precursor Salts Influence in Ruthenium Catalysts for CO2 Hydrogenation to Methane. Appl. Energy 2020, 279, 115767. 10.1016/j.apenergy.2020.115767. [DOI] [Google Scholar]
- Biloen P.; Sachtler W. M. H. Mechanism of Hydrocarbon Synthesis over Fischer-Tropsch Catalysts. Adv. Catal. 1981, 30, 165–216. 10.1016/S0360-0564(08)60328-4. [DOI] [Google Scholar]
- Yang L.; Pastor-Pérez L.; Villora-Pico J. J.; Gu S.; Sepúlveda-Escribano A.; Reina T. R. CO2 Valorisation via Reverse Water-Gas Shift Reaction Using Promoted Fe/CeO2-Al2O3 Catalysts: Showcasing the Potential of Advanced Catalysts to Explore New Processes Design. Appl. Catal., A 2020, 593, 117442. 10.1016/j.apcata.2020.117442. [DOI] [Google Scholar]
- Tada S.; Shimizu T.; Kameyama H.; Haneda T.; Kikuchi R. Ni/CeO2 Catalysts with High CO2 Methanation Activity and High CH4 Selectivity at Low Temperatures. Int. J. Hydrogen Energy 2012, 37, 5527–5531. 10.1016/j.ijhydene.2011.12.122. [DOI] [Google Scholar]
- Bian Z.; Chan Y. M.; Yu Y.; Kawi S. Morphology Dependence of Catalytic Properties of Ni/CeO2 for CO2 Methanation: A Kinetic and Mechanism Study. Catal. Today 2020, 347, 31–38. 10.1016/j.cattod.2018.04.067. [DOI] [Google Scholar]
- Sun F.-m.; Yan C.-f.; Wang Z.-d.; Guo C.-q.; Huang S.-l. Ni/Ce–Zr–O Catalyst for High CO2 Conversion during Reverse Water Gas Shift Reaction (RWGS). Int. J. Hydrogen Energy 2015, 40, 15985–15993. 10.1016/j.ijhydene.2015.10.004. [DOI] [Google Scholar]
- Lee W. J.; Li C.; Prajitno H.; Yoo J.; Patel J.; Yang Y.; Lim S. Recent Trend in Thermal Catalytic Low Temperature CO2 Methanation: A Critical Review. Catal. Today 2021, 368, 2–19. 10.1016/j.cattod.2020.02.017. [DOI] [Google Scholar]
- Vance C. K.; Bartholomew C. H. Hydrogenation of Carbon Dioxide on Group Viii Metals: III, Effects of Support on Activity/Selectivity and Adsorption Properties of Nickel. Appl. Catal. 1983, 7, 169–177. 10.1016/0166-9834(83)80005-0. [DOI] [Google Scholar]
- Jalama K. Carbon Dioxide Hydrogenation over Nickel-, Ruthenium-, and Copper-Based Catalysts: Review of Kinetics and Mechanism. Catal. Rev. 2017, 59, 95–164. 10.1080/01614940.2017.1316172. [DOI] [Google Scholar]
- Wang L.; Zhang S.; Liu Y. Reverse Water Gas Shift Reaction over Co-Precipitated Ni-CeO2 Catalysts. J. Rare Earths 2008, 26, 66–70. 10.1016/S1002-0721(08)60039-3. [DOI] [Google Scholar]
- WANG L.; LIU H.; LIU Y.; CHEN Y.; YANG S. Influence of Preparation Method on Performance of Ni-CeO2 Catalysts for Reverse Water-Gas Shift Reaction. J. Rare Earths 2013, 31, 559–564. 10.1016/S1002-0721(12)60320-2. [DOI] [Google Scholar]
- Zhou G.; Liu H.; Cui K.; Jia A.; Hu G.; Jiao Z.; Liu Y.; Zhang X. Role of Surface Ni and Ce Species of Ni/CeO2 Catalyst in CO2 Methanation. Appl. Surf. Sci. 2016, 383, 248–252. 10.1016/j.apsusc.2016.04.180. [DOI] [Google Scholar]
- Rui N.; Zhang X.; Zhang F.; Liu Z.; Cao X.; Xie Z.; Zou R.; Senanayake S. D.; Yang Y.; Rodriguez J. A.; Liu C.-J. Highly Active Ni/CeO2 Catalyst for CO2 Methanation: Preparation and Characterization. Appl. Catal., B 2021, 282, 119581. 10.1016/j.apcatb.2020.119581. [DOI] [Google Scholar]
- da Silva D. C. D.; Letichevsky S.; Borges L. E. P.; Appel L. G. The Ni/ZrO2 Catalyst and the Methanation of CO and CO2. Int. J. Hydrogen Energy 2012, 37, 8923–8928. 10.1016/j.ijhydene.2012.03.020. [DOI] [Google Scholar]
- Jia X.; Zhang X.; Rui N.; Hu X.; Liu C.-j. Structural Effect of Ni/ZrO2 Catalyst on CO2 Methanation with Enhanced Activity. Appl. Catal., B 2019, 244, 159–169. 10.1016/j.apcatb.2018.11.024. [DOI] [Google Scholar]
- Zhou R.; Rui N.; Fan Z.; Liu C.-j. Effect of the Structure of Ni/TiO2 Catalyst on CO2 Methanation. Int. J. Hydrogen Energy 2016, 41, 22017–22025. 10.1016/j.ijhydene.2016.08.093. [DOI] [Google Scholar]
- Tada S.; Kikuchi R.; Wada K.; Osada K.; Akiyama K.; Satokawa S.; Kawashima Y. Long-Term Durability of Ni/TiO2 and Ru–Ni/TiO2 Catalysts for Selective CO Methanation. J. Power Sources 2014, 264, 59–66. 10.1016/j.jpowsour.2014.04.075. [DOI] [Google Scholar]
- Ye R.-P.; Gong W.; Sun Z.; Sheng Q.; Shi X.; Wang T.; Yao Y.; Razink J. J.; Lin L.; Zhou Z.; Adidharma H.; Tang J.; Fan M.; Yao Y.-G. Enhanced Stability of Ni/SiO2 Catalyst for CO2 Methanation: Derived from Nickel Phyllosilicate with Strong Metal-Support Interactions. Energy 2019, 188, 116059. 10.1016/j.energy.2019.116059. [DOI] [Google Scholar]
- Wu H. C.; Chang Y. C.; Wu J. H.; Lin J. H.; Lin I. K.; Chen C. S. Methanation of CO 2 and Reverse Water Gas Shift Reactions on Ni/SiO 2 Catalysts: The Influence of Particle Size on Selectivity and Reaction Pathway. Catal. Sci. Technol. 2015, 5, 4154–4163. 10.1039/C5CY00667H. [DOI] [Google Scholar]
- Garbarino G.; Riani P.; Magistri L.; Busca G. A Study of the Methanation of Carbon Dioxide on Ni/Al2O3 Catalysts at Atmospheric Pressure. Int. J. Hydrogen Energy 2014, 39, 11557–11565. 10.1016/j.ijhydene.2014.05.111. [DOI] [Google Scholar]
- Garbarino G.; Bellotti D.; Riani P.; Magistri L.; Busca G. Methanation of Carbon Dioxide on Ru/Al 2 O 3 and Ni/Al 2 O 3 Catalysts at Atmospheric Pressure: Catalysts Activation, Behaviour and Stability. Int. J. Hydrogen Energy 2015, 40, 9171–9182. 10.1016/j.ijhydene.2015.05.059. [DOI] [Google Scholar]
- Wolf A.; Jess A.; Kern C. Syngas Production via Reverse Water-Gas Shift Reaction over a Ni-Al 2 O 3 Catalyst: Catalyst Stability, Reaction Kinetics, and Modeling. Chem. Eng. Technol. 2016, 39, 1040–1048. 10.1002/ceat.201500548. [DOI] [Google Scholar]
- Yao H.; Yao Y. F. Y. Ceria in Automotive Exhaust Catalysts: I. Oxygen Storage. J. Catal. 1984, 86, 254–265. 10.1016/0021-9517(84)90371-3. [DOI] [Google Scholar]
- Li Y.; Fu Q.; Flytzani-Stephanopoulos M. Low-Temperature Water-Gas Shift Reaction over Cu- and Ni-Loaded Cerium Oxide Catalysts. Appl. Catal., B 2000, 27, 179–191. 10.1016/S0926-3373(00)00147-8. [DOI] [Google Scholar]
- Laosiripojana N.; Assabumrungrat S. Catalytic Steam Reforming of Ethanol over High Surface Area CeO2: The Role of CeO2 as an Internal Pre-Reforming Catalyst. Appl. Catal., B 2006, 66, 29–39. 10.1016/j.apcatb.2006.01.011. [DOI] [Google Scholar]
- Trovarelli A.; Deleitenburg C.; Dolcetti G.; Lorca J. L. CO2 Methanation Under Transient and Steady-State Conditions over Rh/CeO2 and CeO2-Promoted Rh/SiO2: The Role of Surface and Bulk Ceria. J. Catal. 1995, 151, 111–124. 10.1006/jcat.1995.1014. [DOI] [Google Scholar]
- Fukuhara C.; Hayakawa K.; Suzuki Y.; Kawasaki W.; Watanabe R. A Novel Nickel-Based Structured Catalyst for CO 2 Methanation: A Honeycomb-Type Ni/CeO 2 Catalyst to Transform Greenhouse Gas into Useful Resources. Appl. Catal., A 2017, 532, 12–18. 10.1016/j.apcata.2016.11.036. [DOI] [Google Scholar]
- Ye R.-P.; Li Q.; Gong W.; Wang T.; Razink J. J.; Lin L.; Qin Y.-Y.; Zhou Z.; Adidharma H.; Tang J.; Russell A. G.; Fan M.; Yao Y.-G. High-Performance of Nanostructured Ni/CeO2 Catalyst on CO2 Methanation. Appl. Catal., B 2020, 268, 118474. 10.1016/j.apcatb.2019.118474. [DOI] [Google Scholar]
- Zhi G.; Guo X.; Wang Y.; Jin G.; Guo X. Effect of La2O3 Modification on the Catalytic Performance of Ni/SiC for Methanation of Carbon Dioxide. Catal. Commun. 2011, 16, 56–59. 10.1016/j.catcom.2011.08.037. [DOI] [Google Scholar]
- Zhu H.; Razzaq R.; Li C.; Muhmmad Y.; Zhang S. Catalytic Methanation of Carbon Dioxide by Active Oxygen Material Ce x Zr 1–x O 2 Supported Ni Co Bimetallic Nanocatalysts. AIChE J. 2013, 59, 2567–2576. 10.1002/aic.14026. [DOI] [Google Scholar]
- Winter L. R.; Gomez E.; Yan B.; Yao S.; Chen J. G. Tuning Ni-Catalyzed CO2 Hydrogenation Selectivity via Ni-Ceria Support Interactions and Ni-Fe Bimetallic Formation. Appl. Catal., B 2018, 224, 442–450. 10.1016/j.apcatb.2017.10.036. [DOI] [Google Scholar]
- le Saché E.; Pastor-Pérez L.; Haycock B. J.; Villora-Picó J. J.; Sepúlveda-Escribano A.; Reina T. R. Switchable Catalysts for Chemical CO 2 Recycling: A Step Forward in the Methanation and Reverse Water–Gas Shift Reactions. ACS Sustainable Chem. Eng. 2020, 8, 4614–4622. 10.1021/acssuschemeng.0c00551. [DOI] [Google Scholar]
- Le T. A.; Kim T. W.; Lee S. H.; Park E. D. Effects of Na Content in Na/Ni/SiO 2 and Na/Ni/CeO 2 Catalysts for CO and CO 2 Methanation. Catal. Today 2018, 303, 159–167. 10.1016/j.cattod.2017.09.031. [DOI] [Google Scholar]
- Hu X.; Lu G. Inhibition of Methane Formation in Steam Reforming Reactions through Modification of Ni Catalyst and the Reactants. Green Chem. 2009, 11, 724. 10.1039/b814009j. [DOI] [Google Scholar]
- Hu D.; Gao J.; Ping Y.; Jia L.; Gunawan P.; Zhong Z.; Xu G.; Gu F.; Su F. Enhanced Investigation of CO Methanation over Ni/Al 2 O 3 Catalysts for Synthetic Natural Gas Production. Ind. Eng. Chem. Res. 2012, 51, 4875–4886. 10.1021/ie300049f. [DOI] [Google Scholar]
- Bacariza M. C.; Graça I.; Bebiano S. S.; Lopes J. M.; Henriques C. Magnesium as Promoter of CO 2 Methanation on Ni-Based USY Zeolites. Energy Fuels 2017, 31, 9776–9789. 10.1021/acs.energyfuels.7b01553. [DOI] [Google Scholar]
- Liu Q.; Gu F.; Lu X.; Liu Y.; Li H.; Zhong Z.; Xu G.; Su F. Enhanced Catalytic Performances of Ni/Al2O3 Catalyst via Addition of V2O3 for CO Methanation. Appl. Catal., A 2014, 488, 37–47. 10.1016/j.apcata.2014.09.028. [DOI] [Google Scholar]
- Zhao A.; Ying W.; Zhang H.; Hongfang M.; Fang D. Ni/Al2O3 Catalysts for Syngas Methanation: Effect of Mn Promoter. J. Nat. Gas Chem. 2012, 21, 170–177. 10.1016/S1003-9953(11)60350-2. [DOI] [Google Scholar]
- Wang W.; Li X.; Zhang Y.; Zhang R.; Ge H.; Bi J.; Tang M. Strong Metal–Support Interactions between Ni and ZnO Particles and Their Effect on the Methanation Performance of Ni/ZnO. Catal. Sci. Technol. 2017, 7, 4413–4421. 10.1039/C7CY01119A. [DOI] [Google Scholar]
- Li H.; Ren J.; Qin X.; Qin Z.; Lin J.; Li Z. Ni/SBA-15 Catalysts for CO Methanation: Effects of V, Ce, and Zr Promoters. RSC Adv. 2015, 5, 96504–96517. 10.1039/C5RA15990C. [DOI] [Google Scholar]
- Guo M.; Lu G. The Difference of Roles of Alkaline-Earth Metal Oxides on Silica-Supported Nickel Catalysts for CO 2 Methanation. RSC Adv. 2014, 4, 58171–58177. 10.1039/C4RA06202G. [DOI] [Google Scholar]
- Osaki T.; Mori T. Role of Potassium in Carbon-Free CO2 Reforming of Methane on K-Promoted Ni/Al2O3 Catalysts. J. Catal. 2001, 204, 89–97. 10.1006/jcat.2001.3382. [DOI] [Google Scholar]
- Chen C. S.; Lin J. H.; You J. H.; Yang K. H. Effects of Potassium on Ni–K/Al 2 O 3 Catalysts in the Synthesis of Carbon Nanofibers by Catalytic Hydrogenation of CO 2. J. Phys. Chem. A 2010, 114, 3773–3781. 10.1021/jp904434e. [DOI] [PubMed] [Google Scholar]
- Azancot L.; Blay V.; Blay-Roger R.; Bobadilla L. F.; Penkova A.; Centeno M. A.; Odriozola J. A. Evidence of New Ni-O-K Catalytic Sites with Superior Stability for Methane Dry Reforming. Appl. Catal., B 2022, 307, 121148. 10.1016/j.apcatb.2022.121148. [DOI] [Google Scholar]
- Azancot L.; Bobadilla L. F.; Centeno M. A.; Odriozola J. A. IR Spectroscopic Insights into the Coking-Resistance Effect of Potassium on Nickel-Based Catalyst during Dry Reforming of Methane. Appl. Catal., B 2021, 285, 119822. 10.1016/j.apcatb.2020.119822. [DOI] [Google Scholar]
- Borowiecki T.; Denis A.; Rawski M.; Gołębiowski A.; Stołecki K.; Dmytrzyk J.; Kotarba A. Studies of Potassium-Promoted Nickel Catalysts for Methane Steam Reforming: Effect of Surface Potassium Location. Appl. Surf. Sci. 2014, 300, 191–200. 10.1016/j.apsusc.2014.02.053. [DOI] [Google Scholar]
- Lee J. Y.; Lee D.-W.; Lee M. S.; Lee K.-Y. Cs-Promoted Ni/Fe Catalyst as a Cr-Free, High Temperature Shift Catalyst for Steam Methane Reformate without Additional Supply of Steam. Catal. Commun. 2011, 15, 37–40. 10.1016/j.catcom.2011.08.010. [DOI] [Google Scholar]
- Watanabe R.; Watanabe S.; Hirata N.; Fukuhara C. Effect of Promoter Addition on Water Gas Shift Property over Structured-Type Iron Oxide Catalyst. Catal. Lett. 2016, 146, 2478–2484. 10.1007/s10562-016-1872-9. [DOI] [Google Scholar]
- Varvoutis G.; Lykaki M.; Papista E.; Carabineiro S. A. C.; Psarras A. C.; Marnellos G. E.; Konsolakis M. Effect of Alkali (Cs) Doping on the Surface Chemistry and CO2 Hydrogenation Performance of CuO/CeO2 Catalysts. J. CO2 Util. 2021, 44, 101408. 10.1016/j.jcou.2020.101408. [DOI] [Google Scholar]
- Ang M. L.; Oemar U.; Saw E. T.; Mo L.; Kathiraser Y.; Chia B. H.; Kawi S. Highly Active Ni/ x Na/CeO 2 Catalyst for the Water–Gas Shift Reaction: Effect of Sodium on Methane Suppression. ACS Catal. 2014, 4, 3237–3248. 10.1021/cs500915p. [DOI] [Google Scholar]
- Lee J.-S.; Choi K.-H.; Ryu B.-K.; Shin B.-C.; Kim I.-S. Effects of Gallia Additions on Sintering Behavior of Gadolinia-Doped Ceria. Mater. Res. Bull. 2004, 39, 2025–2033. 10.1016/j.materresbull.2004.07.022. [DOI] [Google Scholar]
- Thommes M.; Kaneko K.; Neimark A. V.; Olivier J. P.; Rodriguez-Reinoso F.; Rouquerol J.; Sing K. S. W. Physisorption of Gases, with Special Reference to the Evaluation of Surface Area and Pore Size Distribution (IUPAC Technical Report). Pure Appl. Chem. 2015, 87, 1051–1069. 10.1515/pac-2014-1117. [DOI] [Google Scholar]
- Luan X.; Yong J.; Dai X.; Zhang X.; Qiao H.; Yang Y.; Zhao H.; Peng W.; Huang X. Tungsten-Doped Molybdenum Sulfide with Dominant Double-Layer Structure on Mixed MgAl Oxide for Higher Alcohol Synthesis in CO Hydrogenation. Ind. Eng. Chem. Res. 2018, 57, 10170–10179. 10.1021/acs.iecr.8b01378. [DOI] [Google Scholar]
- Pasha N.; Lingaiah N.; Siva Sankar Reddy P.; Sai Prasad P. S. An Investigation into the Effect of Cs Promotion on the Catalytic Activity of NiO in the Direct Decomposition of N2O. Catal. Lett. 2007, 118, 64–68. 10.1007/s10562-007-9146-1. [DOI] [Google Scholar]
- Wang Y.; Zhu A.; Zhang Y.; Au C. T.; Yang X.; Shi C. Catalytic Reduction of NO by CO over NiO/CeO2 Catalyst in Stoichiometric NO/CO and NO/CO/O2 Reaction. Appl. Catal., B 2008, 81, 141–149. 10.1016/j.apcatb.2007.12.005. [DOI] [Google Scholar]
- Chary K. V. R.; Rao P. V. R.; Vishwanathan V. Synthesis and High Performance of Ceria Supported Nickel Catalysts for Hydrodechlorination Reaction. Catal. Commun. 2006, 7, 974–978. 10.1016/j.catcom.2006.04.013. [DOI] [Google Scholar]
- Pashalidis I.; Theocharis C. R.. Investigations on the Surface Properties of Pure and Alkali or Alkaline Earth Metal Doped Ceria. Studies in Surface Science and Catalysis; Elsevier, 2000; Vol. 128, pp 643–652. [Google Scholar]
- Shan W.; Luo M.; Ying P.; Shen W.; Li C. Reduction Property and Catalytic Activity of Ce1–XNiXO2 Mixed Oxide Catalysts for CH4 Oxidation. Appl. Catal., A 2003, 246, 1–9. 10.1016/S0926-860X(02)00659-2. [DOI] [Google Scholar]
- Liang C.; Ye Z.; Dong D.; Zhang S.; Liu Q.; Chen G.; Li C.; Wang Y.; Hu X. Methanation of CO2: Impacts of Modifying Nickel Catalysts with Variable-Valence Additives on Reaction Mechanism. Fuel 2019, 254, 115654. 10.1016/j.fuel.2019.115654. [DOI] [Google Scholar]
- Zhang Z.; Zhang X.; Zhang L.; Gao J.; Shao Y.; Dong D.; Zhang S.; Liu Q.; Xu L.; Hu X. Impacts of Alkali or Alkaline Earth Metals Addition on Reaction Intermediates Formed in Methanation of CO2 over Cobalt Catalysts. J. Energy Inst. 2020, 93, 1581–1596. 10.1016/j.joei.2020.01.020. [DOI] [Google Scholar]
- Beierlein D.; Häussermann D.; Pfeifer M.; Schwarz T.; Stöwe K.; Traa Y.; Klemm E. Is the CO2 Methanation on Highly Loaded Ni-Al2O3 Catalysts Really Structure-Sensitive?. Appl. Catal., B 2019, 247, 200–219. 10.1016/j.apcatb.2018.12.064. [DOI] [Google Scholar]
- Vogt C.; Monai M.; Kramer G. J.; Weckhuysen B. M. The Renaissance of the Sabatier Reaction and Its Applications on Earth and in Space. Nat. Catal. 2019, 2, 188–197. 10.1038/s41929-019-0244-4. [DOI] [Google Scholar]
- Büchel R.; Baiker A.; Pratsinis S. E. Effect of Ba and K Addition and Controlled Spatial Deposition of Rh in Rh/Al2O3 Catalysts for CO2 Hydrogenation. Appl. Catal., A 2014, 477, 93–101. 10.1016/j.apcata.2014.03.010. [DOI] [Google Scholar]
- Li J.; Lin Y.; Pan X.; Miao D.; Ding D.; Cui Y.; Dong J.; Bao X. Enhanced CO 2 Methanation Activity of Ni/Anatase Catalyst by Tuning Strong Metal–Support Interactions. ACS Catal. 2019, 9, 6342–6348. 10.1021/acscatal.9b00401. [DOI] [Google Scholar]
- Zhang X.; Zhu X.; Lin L.; Yao S.; Zhang M.; Liu X.; Wang X.; Li Y.-W.; Shi C.; Ma D. Highly Dispersed Copper over β-Mo 2 C as an Efficient and Stable Catalyst for the Reverse Water Gas Shift (RWGS) Reaction. ACS Catal. 2017, 7, 912–918. 10.1021/acscatal.6b02991. [DOI] [Google Scholar]
- Kim S. S.; Lee H. H.; Hong S. C. A Study on the Effect of Support’s Reducibility on the Reverse Water-Gas Shift Reaction over Pt Catalysts. Appl. Catal., A 2012, 423–424, 100–107. 10.1016/j.apcata.2012.02.021. [DOI] [Google Scholar]
- Yang L.; Pastor-Pérez L.; Gu S.; Sepúlveda-Escribano A.; Reina T. R. Highly Efficient Ni/CeO2-Al2O3 Catalysts for CO2 Upgrading via Reverse Water-Gas Shift: Effect of Selected Transition Metal Promoters. Appl. Catal., B 2018, 232, 464–471. 10.1016/j.apcatb.2018.03.091. [DOI] [Google Scholar]
- Wang C.; Guan E.; Wang L.; Chu X.; Wu Z.; Zhang J.; Yang Z.; Jiang Y.; Zhang L.; Meng X.; Gates B. C.; Xiao F.-S. Product Selectivity Controlled by Nanoporous Environments in Zeolite Crystals Enveloping Rhodium Nanoparticle Catalysts for CO 2 Hydrogenation. J. Am. Chem. Soc. 2019, 141, 8482–8488. 10.1021/jacs.9b01555. [DOI] [PubMed] [Google Scholar]
- Tsiotsias A. I.; Charisiou N. D.; Yentekakis I. V.; Goula M. A. Bimetallic Ni-Based Catalysts for CO2 Methanation: A Review. Nanomaterials 2020, 11, 28. 10.3390/nano11010028. [DOI] [PMC free article] [PubMed] [Google Scholar]
Associated Data
This section collects any data citations, data availability statements, or supplementary materials included in this article.


