

Abstract
Alternative splicing of the HIV transcriptome is controlled through cis regulatory elements functioning as enhancers or silencers depending on their context and the type of host RNA binding proteins they recruit. Splice site acceptor A3 (ssA3) is one of the least used acceptor sites in the HIV transcriptome and its activity determines the levels of tat mRNA. Splice acceptor 3 is regulated by a combination of cis regulatory sequences, auxiliary splicing factors, and presumably RNA structure. The mechanisms by which these multiple regulatory components coordinate to determine the frequency in which ssA3 is utilized is poorly understood. By NMR spectroscopy and phylogenetic analysis, we show that the ssA3 regulatory locus is conformationally heterogeneous and that the sequences that encompass the locus are conserved across most HIV isolates. Despite the conformational heterogeneity, the major stem loop (A3SL1) observed in vitro folds to base pair the Polypyrimdine Tract (PPyT) to the Exon Splicing Silencer 2p (ESS2p) element and to a conserved downstream linker. The 3D structure as determined by NMR spectroscopy further reveals that the A3 consensus cleavage site is embedded within a unique stereochemical environment within the apical loop, where it is surrounded by alternating base-base interactions. Despite being described as a receptor for hnRNP H, the ESS2p element is sequestered by base pairing to the 3’ end of the PPyT and within this context it cannot form a stable complex with hnRNP H. By comparison, hnRNP A1 directly binds to the A3 consensus cleavage site located within the apical loop, suggesting that it can directly modulate U2AF assembly. Sequence mutations designed to destabilize the PPyT:ESS2p helix results in an increase usage of ssA3 within HIV-infected cells, consistent with the PPyT becoming more accessible for U2AF recognition. Additional mutations introduced into the downstream ESS2 element synergize with ESS2p to cause further increases in ssA3 usage. When taken together, our work provides a unifying picture by which cis regulatory sequences, splicing auxiliary factors and RNA structure cooperate to provide stringent control over ssA3. We describe this as the pair-and-lock mechanism to restrict access of the PPyT, and posit that it operates to regulate a subset of the heterogenous structures encompassing the ssA3 regulatory locus.
Introduction
The cellular replication of the Human Immunodeficiency Virus type 1 (hereafter referred to as HIV) requires tight regulation at the levels of transcription, splicing, mRNA nuclear export and translation.[1] Splicing of the HIV transcriptome is complex due in part to its cell-type dependent splicing patterns, RNA sequence heterogeneity, RNA structural heterogeneity and differential binding of host proteins (RBPs) to specific and apparently non-specific sites throughout the viral genome.[2–7] The heterogeneity is manifested by the more than 40 mRNA isoforms that are produced through the alternative splicing of a single polycistronic transcript into three major spliced classes: unspliced (US, ~9kb size), partially spliced (PS, ~4kb size) and multiply spliced (MS, ~2kb size). The biochemical mechanisms that regulate HIV splicing have been studied extensively using a combination of in vivo and in vitro assays.[2–4, 6–22] Although insightful, these studies at times yield divergent interpretations with regard to the balance between cis/trans regulation and to the extent that viral RNA sequence and structure influence splicing outcomes. Understanding the various layers of splice site regulation will help to elucidate the RNA processing mechanisms that contribute to HIV pathogenicity, latency and ultimately to identify novel targets for therapeutic intervention.
Splicing of the HIV transcriptome is regulated by host machinery and further modulated by the viral protein Rev.[1] Current models of HIV RNA processing suggest that cis sequences, collectively referred to as splicing regulatory elements (SREs), modulate the utilization of 5’ donor and 3’ acceptor sites by differentially recruiting members of the hnRNP and SR family of host proteins.[1, 3, 4, 18] HnRNPs generally suppress acceptor site utilization whereas SR proteins promote splicing; however, the rules are not absolute since sequence context can invert these apparent activities.[23] The A3-D4 exon (tat exon 1) is unique to tat mRNA and as such its incorporation is tightly regulated by several SREs and a weak Polypyrimidine Tract (PPyT) acting proximal to splice site A3 (ssA3). Two Exonic Splicing Silencers, ESS2p and ESS2, have been reported to function as independent suppressors of ssA3 by binding to the cellular hnRNP H and A/B proteins, respectively.[10, 12, 13, 24] These proteins purportedly block spliceosome assembly. By contrast, splicing at A3 is activated by the Exonic Splicing Enhancers, ESE2 and ESEtat, which independently recruit the SRSF2 and SRSF6 proteins to stabilize spliceosome assembly.[25–27]
Given the stringent regulation of ssA3 by cis/trans factors, this genetic region represents a model system to better understand the mechanisms by which HIV RNA sequence conservation, structure, conformational dynamics, and protein binding modulate splicing outcomes. To that end, we carried out a detailed study of the ssA3 regulatory locus (nts 5756–5798) with an emphasis on characterizing the structural and hnRNP binding properties of a fragment that compositely contains the PPyT, the A3 cleavage site and the ESS2p element. We show that a larger ssA3 construct that encompasses the PPyT and all of the known SREs is conformationally heterogeneous, but that the predominant conformer folds to base pair ESS2p to the 3’-end of PPyT to form a stem loop (A3SL1) that positions the A3 cleavage splice site at its apex. The 5’ end of the PPyT is further sequestered in base pairs to a conserved linker sequence that connects the ESS2p to the remaining downstream SREs. Mutations to ESS2p that weaken its ability to base pair with the PPyT results in an increase usage of ssA3 within HIV infected cells, and a concomitant decrease of the pool of unspliced viral transcripts. Furthermore, we provide evidence that ESS2p and ESS2 act synergistically not independently, since mutations to both causes an even larger increase in ssA3 usage compared to single-site mutants.
To characterize the physicochemical properties of A3SL1, we determined its high-resolution structure using a conjoined NMR-SAXS method and measured site-specific conformational dynamics spanning several orders of magnitude. Conserved residues within the A3 cleavage site undergo slow conformational dynamics to remodel the local environment by switching base-base interactions. We further determined that hnRNP A1 and hnRNP H differentially bind the A3SL1 stem loop because their cognate sequence epitopes are either exposed or sequestered by surrounding RNA structure, respectively. Interestingly, hnRNP A1 binds directly to the A3 cleavage site suggesting that it can directly compete with U2AF35 binding. By comparison, the putative hnRNP H ESS2p epitope is sequestered by base pairs to the PPyT and inhibits stable complex formation; however, it can support high-affinity binding when placed within an apical loop context. In sum, this work illustrates the mechanisms by which HIV RNA sequence, structure and its dynamics differentially modulate the recruitment of host RBPs with known splicing regulatory function. It further illuminates how HIV RNA structural heterogeneity (local or global conformational switching) is a genetically encoded property and one of several mechanistic layers that regulate viral RNA processing.
Materials and Methods
Preparation of the A3SL construct
The A3SL constructs used in this study correspond to native residues of HIV-1NL4–3. The RNA samples were transcribed in vitro from synthetic DNA templates (IDT) and yield was optimize. The constructs used in probing the alternative conformation are A3SL(5755–5851), A3SL1 (5756–5798) and A3SL2,3 (5802–5853). Uniformly 13C, 15N and 2H labeled rNTPs were purchased from Cambridge Isotope laboratories for NMR studies. Following synthesis, the RNA sample were purified by denaturing PAGE electrophoresis (12%), excised from the gel, electroeluted and desalted via washing of the sample with RNasefree water using a Millipore Amicon Ultra Centrifugal filter device. Samples were annealed by heating at 95°C for 5 min and flash-cooled on ice. Samples were subsequently concentrated to the desired NMR concentration (0.1 to 0.7 mM) using a Millipore Amicon Ultra-4 centrifugal filter, followed by exchange into an NMR buffer [5 mM K2HPO4 (pH 6.5)]. Sample concentration was determined using RNA theoretical molar extinction coefficients.
Phylogenetic analysis
Nucleotide sequences (excluding recombinants) comprising A3SL were derived from the Los Alamos HIV sequence database in GLUE for HIV-1 group M subtypes (7 total), group O, and group N for which at least 10 sequences had been submitted for phylogenetic analysis. Sequences were aligned using Blast and MAAFT as implemented in GLUE. Alignments were manually inspected and adjusted using Seqotron. Consensus sequences and logos were generated also using Weblogo based on the majority nucleotide present at each site. Ten randomly selected representatives sequences from each strain were used for the calculation of the mean evolutionary distance and inference of a maximum likelihood (ML) phylogenetic tree with BEAST v1.10 suite. The maximum composite likelihood method was used for distance calculation, whereas the Gamma distributed sites (GTR Gamma) model with gamma-distributed rate variation among sites was chosen for tree reconstruction.
Quantification of the effects of the mutation to the ESS2p and ESS2 elements on HIV splicing
Silent mutations were made to HIV splicing regulatory elements (SREs) alone or in combinations using pNL-CH (a slightly modified version of pNL4–3[28] as the parent plasmid. WT pNL-CH and SRE mutant plasmids were transfected into 293T cells using FuGene 6 using the manufacture’s protocol (Promega). Cells were plated at 5 × 10⁵ cells per well in a 6 well plate 12 hours prior to transfection. Transfections used 30 μl FuGene 6 plus 3 μg plasmid DNA in 3 ml medium per well (DMEM, 10%FBS, 1% Pen/Strep). Medium was changed 12 hours post-transfection and cells were harvested 48 hours post-transfection. Total cellular RNA was isolated using Qiagen RNeasy Plus Kits (Qiagen).
Quantification of HIV-1 transcripts for each size class was done as described before[7], with slight modifications to the cDNA reactions as follows. Briefly, Primer-ID tagged deep sequencing was done using two cDNA primers exclusive to either the 1.8 KB (completely spliced) or 4 KB (partially spliced) spliced viral RNA size classes. cDNAs were made as previously described but using 4μg total cellular RNA input, and extending the reaction by adding 1.0 μl of reverse transcriptase after the first hour and incubating an additional hour. cDNAs were PCR amplified using a forward primer upstream of the major splice donor D1. Forward and reverse PCR primers also added Illumina platform specific sequences, and the resulting libraries were sequenced using Illumina MiSeq 300 base paired-end reads. Data were processed using in-house scripts (available on request).
An additional deep sequencing assay was done using a random 14 base cDNA primer attached to Illumina platform-specific sequences. This random primer primes across the entire HIV genome. HIV-specific cDNAs were PCR amplified and libraries constructed and sequenced using the primers described above for the size class assays. Forward sequencing reads in this assay begin just upstream of D1 and read through either a splicing junction at D1 or, if unspliced, into the gag intron. Quantification of spliced and unspliced reads was done with an in-house script (available on request). The splicing experiments were conducted using a single biological replicate. However, we used three primer sets, and performed the mutational studies individually and together to reveal additive effects.
NMR data acquisition, processing and analysis
NMR spectra were recorded on Bruker Avance (700, 800 and 900 MHz) high-field spectrometers equipped with cryogenically cooled HCN triple resonance probes and a z-axis pulse-field gradient accessory. To check RNA conformational homogeneity and purity, 1D 1H NMR experiments were performed. All NMR data were processed by NMRPipe/NMRDraw[29] and analyzed using the software NMRView J/ Sparky.[30, 31] Exchangeable 1H spectra were measured at 280K with the Watergate NOESY (τm=200ms) pulse sequence. The Watergate NOESY experiment was collected on 700MHz Non-exchangeable protons were assigned following well-established procedures.[32, 33] 1H-1H NOESY (τm=200ms) and 1H-1H total correlated spectroscopy TOCSY (τc=120ms) were recorded in 100%D2O at 298 K on A3SL1 samples labeled with different combinations of deuterated rNTPs including equimolar rNTPS: (3’, 4’, 5’, 5”) and rYTP (5, 3’, 4’, 5’, 5”). Assignments were further verified through acquisition of 1H-13C heteronuclear multiple quantum coherence spectra of A3SL1 constructs selectively labeled with 13C(rATP), 13C(rGTP) and 13C(rUTP).
Residual dipolar coupling (RDCs) were measured using 1H-13C TROSY HSQC[34] for both isotropic and anisotropic (ASLA, Pf1 bacteriophage at ~10 mg/ml) 13C-selectively labeled A3SL1 constructs in 100% D2O and 5mM K2HPO4 pH 6.5. Dipolar coupling values of C2H2, C8H8/C6H6 and C1’H1’ were determined by taking the difference in 1JCH couplings under anisotropic and isotropic conditions.
Dynamics experiments
R1, R1ρ and CEST experiments were performed on a sample of A3SL1 at 25 °C on a Bruker spectrometer operating at a 1H frequency of 600 MHz. For measurement of fast dynamics, published pulse sequences were used to acquire 13C R1 and R1ρ data at 25°C with a 6.25 kHz applied spin-lock field used for R1ρ experiments[35].
CEST experiments were recorded with a 13C B1 saturating field of 25 Hz and 100 Hz. The B1 field was applied during a constant period of TEX=0.3 s. For B1 saturating field of 25/100 Hz experiments were recorded with 105/48 two-dimensional planes with the position of the 13C B1 field ranging from 132.5 to 157.5 ppm in steps of 30/120 Hz separately. Acquisition times of 65/22 ms in t1/t2 were used, along with a relaxation delay between scans of 1.5 s. The ChemEx software were used to analyze the CEST data assuming a two-site exchange model (https://github.com/gbouvignies/chemex).
SEC-SAXS analysis of A3SL1
SEC-SAXS experiments were performed on A3SL1 (20mM Bis-Tris and 20mM NaCl at pH6.2) at BioCAT (beamline 18-ID, Advanced Photon Source). Data was collected and processed as previously described[36], with the exception of an extended detector (q ~ 0.005–0.38Å). Initial molecular reconstructions were performed in Primus from ATSAS program suite[37]. Guinier fitting was used to test for aggregation and estimate the Rg (Rg × q<1.3) and the curve was fit to generate the pair distance distribution p(r) plot using GNOM[38]. Initial ab initio model were created using DAMMIF in slow mode where 10 independent models were generated[39]. The models were aligned and averaged using DAMAVER[39, 40], and the most probable model from the average was generated using DAMFILT.
Structure calculations
The criteria of distance restraints utilized in structure calculations for A3SL1 was based on the intensity of peaks on 1H-1H NOESY (τm=200ms) spectra. Restraints boundaries were obtained qualitatively by peak intensity of the NOE and grouped into strong (1.8–3.0 Å), medium (2.5–4.5 Å) and weak (3.5–6.0 Å) bins. Sugar pucker restraints were obtained from analysis of H1’-H2’ 1H-1H TOCSY (τc=75ms) peak intensities. Residues displaying strong TOCSY peaks were set to C2’-endo conformation in A3SL1 (A5770, C5774, A5775, G5776 and C5790). Glycosidic restraints were obtained from 1H-13C heteronuclear multiple quantum coherence spectra collected on selectively labeled 13C rNTPs constructs. Glycosidic angle restraints were set to the anti-conformation (180 ± 90°) for all residues in A3SL1 except G5776 and G5788. G5776 and G5788 in A3SL1 were set to the syn (0 ± 90°) conformation based on observed downfield chemical shift and/or peak intensity respectively. Standard A-form backbone dihedral angle restraints were applied to all residues in A3SL1 RNA. Hydrogen bond and planarity restraints (Xplor-NIH only; 20 kcal/mol Å) were applied to all Watson-Crick (WC) and GU base pairs displaying NOE cross-peak pattern in the H2O 1H-1H NOESY spectra.
Structure calculation for A3SL1 construct was performed in four steps and incorporated both NMR and SAXS data. The four general steps was performed as follows: generation of a structure pool using Xplor-NIH[41], followed by filtering with experimental SAXS data; extended simulation of selected structures in amber; 1ns of simulation with inclusion of RDCs; and a final refinement stage that included 100 ps of simulation of at 0 K with RDCs and the ab initio SAXS molecular envelope. The four-stage procedure resulted in good agreement between final structures and both NMR and SAXS data is described in detail below.
XPLOR-NIH 2.34 was used to generate 1024 structures pool based upon initial hydrogen bond, NOE, and dihedral restraints. Converged structures were scored based upon their fit to experimental SAXS data using Crysol in batch mode[42], allowing for constant subtraction and a maximum q value of 0.25 Å−1. The resulting χ2 value from SAXS fitting was plotted along with total energy for each structure, and the 10 structures that best satisfied both values (lowest energy and χ2) were used for further simulation. The selected 10 structures with the lowest overall scores were then chosen for further simulation in Amber 16 with the ff99OL3 force field[43, 44]. These selected structures were subjected to energy minimization in AMBER. Minimization and subsequent calculations were performed in implicit solvent with the generalized Born model (igb=1). Structures were prepared for simulation in Amber using tleap. Energy minimization consisted of 4000 cycles of minimization, performing 2000 cycles of steepest decent followed by 2000 cycles of conjugate gradient (ntmin=1, ncyc=2000). Following minimization, simulations were conducted using GPU-accelerated pmemd on NVIDIA Tesla P100 GPUs[45]. Simulations employed a 999.9-Å non-bonded cutoff with a 10-Å cutoff for the calculation of Born radii. In order to manage temperature, Langevin dynamics with collision frequency of 2.0 ps−1 was used. During this stage, only hydrogen-bonding and NOE (20 kcal mol−1A−1) and sugar pucker restraints (300kcal mol−1rad−1) were generated using Pseudorotation Phase Angle, and chirality restraints were used. For the 20-ns simulation followed by a 25 ns molecular dynamics production run, and finalized in a 1 ns structural refinement under the presence of specific RDC restraints. The final frame of each simulation was extracted using cpptraj[46], yielding the starting structures for further refinement. Residual dipolar coupling restraints obtained in the NMR experiments discussed above were incorporated in a 1 ns simulation to constrain the final structures from the production run, and to assess validity of the calculation. Simulation with RDC restraints required the use of Sander and the ff99OL3 force field. The restrained 1 ns simulations were conducted with a salt concentration of 10 mM, a non-bonded cutoff of 24 Å, and a 10 Å cutoff for Born radii calculation.
Preparation and calorimetric titrations of UP1, hnRNP H
The UP1 construct used in these studies was prepared and purified as previously described.[36, 47] Calorimetric titration studies were performed at 25 °C using VP-ITC calorimeter (MicroCal, LLC) with the A3SL1 RNA. Each RNA sample was prepared by diluting to a concentration of ~5 μM in binding buffer (20mM Na2HPO4 20mM NaCl 1mM TCEP at pH 6.2). HqRRM12 and UP1 protein was prepared for the titration studies by exchanging it in the same binding buffer as used for RNA sample preparation using Amicon Ultra-4 centrifugal filter devices. The HqRRM12 protein (~80 μM) was titrated into 1.4 ml of 5 μM RNA over 36 injection of 8ul each. The UP1 protein (~50 μM) was titrated into 1.4 ml of 3 μM RNA over 36 injection of 8ul each. To minimize the accumulation of experimental error associated with batch-to-batch variation, titrations were performed in triplicate. Data were analyzed using KinITC routines supplied with Affinimeter.[48]
Results
Phylogenetic conservation of sequences surrounding splice site A3.
The region (nts 5756–5798, based on HIV NL4–3, GeneBank accession number M19921.2) encompassing ssA3 that includes the polypyrimidine tract (PPyT) and the splicing regulatory elements ESS2p, ESEtat, ESE2 and ESS2 was recently shown to adopt multiple structures in vivo and in vitro.[5] Given the importance of ssA3 and its SRE locus in controlling tat mRNA levels, we reasoned that the propensity to form various RNA structures might be reflected at the level of sequence conservation despite the selection pressure to maintain Tat coding capacity. To that end, we performed phylogenetic alignments of HIV group M, O and N subtype reference strains extracted from the Los Alamos HIV database in GLUE. In total, we analyzed 6,124 HIV group M, 59 group O and 12 group N sequences. Figure 1A shows group M subtype-specific along with groups O and N consensus logos determined from the alignments. The results reveal a relatively high degree of sequence conservation across this genomic region where the most phylogenetically conserved features include the PPyT and the A3 cleavage site 5’-YAG/A-3’ (Y=pyrimidine and predominantly C for group M) motif. The composition of the PPyT includes interspersed purines that presumably weaken the affinity for U2AF2 as part of exon definition.[3, 4] The 5’-UUGGGU-3’ ESS2p element is highly conserved in group M viruses; however, the third G is replaced by a Y or A in groups O and N, respectively (Figure 1A). A preference for 5’-AGR-3’ (where R=purine) repeats in the ESE2 and ESEtat elements are present in all strains; however, the length of the repeat and the degree to which pyrimidines interrupt the pattern varies. Finally, the ESS2 element is the least conserved of the SREs that are known to modulate the efficiency of ssA3.
Figure 1. Phylogenetic analysis of the splice site A3 regulatory locus.

(A) Results of phylogenetic analysis for HIV group M subtypes, group N, group O and group P sequences are represented as subtype-specific consensus logos. The height of the individual nucleotides within the logos is proportional to the observed frequency of the nucleotide at the particular position within the alignment. The region shown corresponds to residues 5753–5853 using the HIV NL4–3 numbering system (GeneBank accession number M19921.2). Note, insertion mutations were observed in HIV group M subtype B near the A3 cleavage site region which leads additional A in A3ss 5’-AGAAA-3’ comparing to the other subtypes. (B) Sequence and secondary structure of A3SL in vivo and in vitro with regulatory elements highlighted in blue (polypyrimidine), red (ESS2p), black (ESEtat), purple (ESE2) and green (ESS2). (C) All completely spliced tat transcript isoforms increase when ESS2p, ESS2, or both are mutated. There are four completely spliced tat transcript isoforms. The D1 to A3 tat transcript splices directly from the major splice donor D1 to splice acceptor A3. SX1 tat transcripts include the first small exon between A1 and D2 before splicing to A3. SX2 tat transcripts include the second small exon between A2 and D3 before splicing to A3. SX1 and SX2 are tat transcripts that include both small exons.
To look for potential correlations between phylogenetics and RNA folding heterogeneity, we mapped the sequence conservation of subtype B onto representative in vivo and in vitro structures of the ssA3 regulatory locus (Figure 1B). The most folded structure observed in vivo forms a stem loop (referred to as A3SL) that base pairs the PPyT to a stretch of the ESEtat/ESE2 elements to form the longest helix within A3SL.[5] As described above, both the PPyT and ESEtat/ESE2 sequences are highly conserved so it’s plausible that these regions interact across many strains of HIV. The locations of the A3 cleavage site, ESS2p, and ESS2 are each localized within single stranded regions, which could provide entry points for splicing auxiliary factors to bind (Figure 1B). By comparison, the major structure of the ssA3 locus observed in vitro consists of three stem loops in which the PPyT base pairs to ESS2p to fold the first stem loop (hereafter referred to as A3SL1). Like the PPyT, the ESS2p element is highly conserved so this helix has propensity to form across many viral strains (Figure S1). The A3 cleavage site is located within a 9-nt apical loop of A3SL1, whereas the other SREs are either weakly paired in the second SL (ESEtat) and third SL (ESE2) or unpaired (ESS2) at the 3’ end. In sum, the ssA3 regulatory locus is phylogenetically conserved across all major HIV strains and its sequence composition intrinsically supports the formation of heterogeneous structures as observed in vivo and in vitro.
Mutations of the ESS2p and ESS2 elements lead to an increase in ssA3 usage.
Given that ssA3 is the least used of all HIV acceptor sites, we decided to test the functional significance of its phylogenetically conserved silencers (ESS2p and ESS2) by introducing silent mutations and analyzing spliced RNA levels using a deep sequencing assay that quantifies spliced transcripts in the context of full-length HIV.[7] Table S1 list total read counts analyzed for the different viral transcript isoforms analyzed in this study. In wild type controls, Tat transcripts make up 6–7% of all completely spliced mRNAs. Mutation of ESS2p alone increased Tat transcripts to 48%, and mutation of ESS2 alone to 29% (Figure 1C). Combined mutation of ESS2p and ESS2 had approximately additive effects, increasing Tat transcripts to 77% (Figure 1C). The effect of ESS2p mutation on ssA3 was greater than ESS2, the reverse of earlier reports.[3] The majority of Tat transcripts splice directly from the major splice donor D1 to A3. Additional Tat isoforms exist that include either or both of two small upstream non-coding exons before splicing to A3. We observed an increase in all of these Tat splicing isoforms in the single and combined mutations. Interestingly, not only did splicing to A3 increase, but splicing overall increased, resulting in a reduction of unspliced transcripts – a condition known as over-splicing. In wild type controls, 81% of reads were unspliced transcripts (gag/pro/pol or genomic RNA). Mutation of ESS2 alone had little effect, reducing unspliced transcripts to 79%, but mutation of ESS2p alone reduced unspliced transcripts to 57%. Combined mutation of both ESS2 and ESS2p silencer elements synergistically reduced unspliced transcripts to 27%, in contrast to previous work indicating independent action of ESS2 and ESS2p.[12] This suggests that silencers of A3 are critical not just for suppression of splicing to form Tat transcripts, but for suppression of HIV splicing overall.
As described above, ESS2p (but not ESS2) is embedded within RNA structure in both the in vivo and in vitro models so its silent mutations may modulate the conformational heterogeneity of the ssA3 locus such that the splicing patterns serve as a proxy for structure-function comparisons. To evaluate how the silent mutations might impact the folding of the ssA3 locus, we mapped them to the A3SL and A3SL1 secondary structural models. Figure 1B shows that the silent mutations when mapped to A3SL localize to unpaired regions, and are not expected to affect helical structure. By comparison, the ESS2p silent mutations when mapped onto A3SL1 reveals that the U5780C and G5783C substitutions would disrupt two base pairs (AU and UG) to destabilize the PPyT:ESS2p helix (Figure 1B). In both A3SL and A3SL1, the ESS2 element is single-stranded so the silent mutations are not expected to influence either secondary structure.
NMR evidence that the ssA3 regulatory locus folds predominantly to base pair the PPT to ESS2p.
To better understand the intrinsic folding properties of the ssA3 regulatory locus under controlled experimental conditions, we collected NMR spectra on GU(15N)-selectively labeled constructs designed to recapitulate secondary structures of A3SL (5755–5851), A3SL1 (nts 5756–5798), and A3SL2,3 (nts 5802–5853). Figure 2B shows the overlay of 1H-15N HSQC spectra collected for each GU(15N)-selectively labeled construct. The overlaid spectra illustrate that the majority of the correlation signals observed for A3SL can be attributed to A3SL1 and A3SL2,3; however, there are a few additional A3SL signals that do not overlay with the smaller stem loop constructs. Most notably, signals at ~10.6/144 and 11.8/158 ppm have 1H/15N chemical shifts consistent with those expected for GU wobble base pairs, but those signals are not observed in spectra collected on A3SL1 and A3SL2,3. A3SL contains a G5759:U5840 wobble base pair in its lower helix (Figure 1B). Other A3SL correlation peaks not observed in the smaller SLs have chemical shifts consistent with additional GC and AU base pairs. One possible explanation for these differences is that A3SL adopts alternate conformations that are in slow exchange on the NMR time scale. This suggestion agrees with recent DMS chemical probing results that show this same region is structurally heterogeneous in vivo and in vitro.[5]
Figure 2. NMR evidence that the splice site A3 regulatory locus adopts different conformations in solution.

(A) Secondary structure of the major conformation of the splice site A3 regulatory locus observed in vitro. Arrows depict the construct boundaries that were used for NMR probing of the different conformers: A3SL (red), A3SL1 (green), A3SL2,3 (blue). (B) Overlay of the 1H-15N HSQC spectra of the imino region collected ine 5 mM K2HPO4 (283 K and pH 6.5) and 90% H2O/10% D2O buffer condition for A3SL (red), A3SL1 (green), A3SL2,3 (blue). The arrows designate extra correlation peaks observed in the A3SL construct, not observed in A3SL1 or A3SL2,3. (C) Imino region of a 1H-1H NOESY (700 MHz and τm = 200 ms) spectrum for A3SL1 collected in 5 mM K2HPO4 (283K and pH 6.5) and 90% H2O/10% D2O. (D) HNN-COSY spectrum of A3SL1 encompassing nts 5756–5798 (detail sequence and secondary structural information are shown in the figure 3A). Positive contours for the hydrogen bond donors are shown in red and negative contours for hydrogen bond acceptors are in blue.
Given the NMR evidence that A3SL1 independently folds, we proceeded to determine its secondary structure by assigning the imino chemical shifts of the base-paired regions. To this end, we in vitro transcribed several isotopically labeled and unlabeled constructs (see Methods). Figure 2B shows the 1H-1H NOESY spectrum of the imino region of A3SL1. Sequential and long-range range (G/U)NH-(G/U)NH NOE cross peaks can be traced for 4 out of 7 bps for the lower stem and 5 out of 6 bps for the upper stem (Figure 2B) at 283 K. We observed sequential NOE interactions from G5781 to U5784, which forms the core of the ESS2p element. Direct hydrogen bond interactions between A5766:U5784, C5768:G5782, and C5769:G5881 observed in the HNN COSY spectrum (Figure 2C) unambiguously confirm that the ESS2p element base pairs to the 3’ end of the PPyT. Similarly, direct hydrogen bonds were also observed in the HNN COSY for 4 base pairs of the lower helix, that includes the 5’ end of the PPyT. Collectively, these data demonstrate that the intact ssA3 regulatory locus is structurally dynamic and that A3SL1 folds independently to base pair the PPyT to the ESS2p (upper helix) element and adjacent 3’ linker (lower helix). An internal loop separates the upper and lower helices of A3SL1.
A3SL1 adopts a globally defined 3D structure that undergoes local dynamics to switch tertiary contacts.
To better understand the stereochemical and biophysical determinants of the folding properties of A3SL1, we carried out a comprehensive NMR structural dynamics study. Such studies are necessary to benchmark mechanisms by which RNA structure, dynamics and interactions cooperate to regulate ssA3 activity. Multiple A3SL1 constructs that varied in nucleotide selective labeling were prepared to assign NMR chemical shifts, obtain distance restraints, measure RDCs and perform NMR dynamics measurements (see Methods). Figure 3A shows a representative 1H-1H NOESY spectrum collected in 5 mM K2HPO4 (298 K pH 6.5) 100% D2O for an A3SL1 construct where all ribose 3’-5’ positions and pyrimidine position 5 were selectively deuterated. Well-resolved and sharp NOE cross peaks are observed using this labeling pattern allowing the detection of sequential H8/H6 (i) to H1’ (i-1) NOE cross peaks for both the lower and upper helices. Canonical nearest neighbor and long-range H2 to i+1 H1’ NOE interactions were assigned for A5766, A5770, A5793 and A5796 providing further validation that these nucleotides form canonical AU base pairs.
Figure 3. NMR evidence that A3SL1 adopts a defined structure that undergoes local conformational dynamics on the micro-to-millisecond time scale.

(A) Left, sequence and secondary structure diagram of A3SL1 where nucleotides are color coded according to regulatory elements: blue, polypyrimidine tract (PPyT); red, ESS2p element. Right, representative 1H-1H NOESY (800MHz and τm=200ms) spectrum collected in 5mM K2HPO4 (298K and pH 6.5) and 100% D2O. Assignments of intra-nucleotide nOe (H8/H6-H1’) interactions are indicated for every other nucleotide. Numbers are colored according to secondary structural elements shown in figure A. Note, G* corresponds to the non-native guanosine added to increase transcription yields. (B) Left, 13C-CEST profiles indicate that residues within the A3 cleavage site (A5775 and A5778) undergo slow conformational dynamics to rearrange tertiary interactions whereas conformational exchange is not observed for A5696, which is located in the PPyT:Linker helix. Right, proposed model for rearrangement of tertiary interactions within the A3 cleavage site.
Of significance, we observed extensive NOE interactions within the internal and apical loops suggesting that these regions contain a high-degree of tertiary structure (Figure 3A). Within the internal loop, sequential NOE cross peaks could be traced along the 5’ side for residues U5763-U5765 and along the 3’ side for residues G5785-C5787 and G5788-A5791. Despite being large (9-nts), sequential NOE cross peaks can be traced along the entire apical loop, except for at the U5773/C5774 step (Figure 3A). Notably, we observed multiple NOE interactions in the vicinity of the A3 cleavage site indicating that this region has residual tertiary structure. For example, sequential and stacking NOE cross peaks were detected for A5770-U5773, which are on the 5’-side of the apical loop. Similar NOE patterns were also observed for A5770-U5773; however, the NOE interactions between A5775/G5778 and G5776/A5777 are relatively weaker, suggesting dynamics. Analysis of the 1H-13C HMQC spectrum for a G(13C)-selectively labeled construct revealed that the 13C chemical shifts of G5776 and G5788 fall downfield relative to the carbon shifts of the other guanosines, indicating these bases adopt a syn conformation about the glyosidic bond (Figure S2). In sum, the NMR data indicate A3SL1 folds into a 3D structure with tertiary interactions within its non-canonical loops, including the location of the A3 cleavage site.
Despite the spectral evidence that A3SL1 adopts a predominant conformation, additional weak cross peaks were observed (Figure 3A) in the 1H-1H NOESY spectrum suggesting that A3SL1 undergoes local structural rearrangements to a minor conformation. As a test for slow conformational dynamics, we performed chemical exchange saturation transfer (CEST) experiments on an A(13C)-selectively labeled A3SL1 construct. Figure 3B shows representative 13C-CEST profiles for A5775, A5778, nucleobases located within the A3 cleavage site, and A5791 and A5796, nucleobases located within the PPyT:Linker helix. The 13C-CEST profiles for A5775 and A5778 clearly show that these residues interconvert to an excited state conformation with chemical shifts of ~139.0 and 138.5 ppm, respectively. By comparison, only a single dip is observed in the 13C-CEST profiles of A5775 and A5778, indicating that the PPyT:Linker helix does not undergo local reshuffling of base-base interactions. Global fitting of the A5775 and A5778 13C-CEST profiles with a two-state exchange model reveal that these residues interconvert with an exchange rate (kex) of 194.9 ± 11.5 s−1 and an excited state population of 1.33 ± 0.29%.
In sum, the NMR analysis provides evidence that A3SL1 folds into a stable and predominant structure that fully embeds the PPyT, ssA3 cleavage site and ESS2p element within tertiary interactions. Localized and slow conformational dynamics switch a subset of these interactions to remodel the stereochemical environment of the A3 cleavage site.
The global structure of A3SL1 reveals the spatial positioning of ssA3 relative to the PPyT and ESS2p element.
To gain insights into the coordination of the regulatory elements that locally control ssA3 activity, we determined the 3D structure of A3SL1 using a hybrid NMR-SAXS approach. Figure S3 shows SAXS data sets on A3SL1 samples that were resolved by size exclusion chromatography. The radius of gyration (Rg) calculated from the linear region of the Guinier plot is 20.9 ± 0.2 Å and the maximum dimension (Dmax) derived from the pair distance distribution function P(r) is ~70 Å. These dimensions indicate that A3SL1 folds into a compact structure despite having large 9-nt apical loop. The compactness of A3SL1 was further verified by the inverted parabolic shape of the Kratky plot.
We determined the structure of A3SL1 using 450 NOE derived distance restraints and 34 13C-1H residual dipolar couplings, RDCs (see Table S2). Complete details of the structure calculation routine are described in the Methods section. Figure 4A shows the superposition (RMSD=1.55 Å) of the resulting 10 lowest energy A3SL1 structures with lower and upper helical stems aligned. Alignments of residues from just the lower or upper helical stems gives RMSD values of 0.25 Å and 0.91 Å respectively, indicating that the structures are well defined by the experimental parameters in the base paired regions. Moreover, the measured and back-calculated RDC values for the lowest energy structure shows an excellent agreement with R2 = 0.93 (Figure 4B). The experimental and back-calculated SAXS data from the lowest energy structure are also in excellent agreement with χ2 value of 2.7 from the CRYSOL score (Figure 4C).
Figure 4. The NMR and SAXS refined structure of A3SL1.

(A) Ensemble of 10 lowest energy AMBER structures of A3SL1. The structures are superimposed using all base paired residues. The A3SL1 structure is color coded according to regulatory elements: blue, polypyrimidine tract (PPyT) and red, ESS2p element. (B) Correlation plot between measured and back-calculated RDCs for the lowest energy AMBER A3SL1 structure. (C) Crysol back-calculated scattering curve (red) of lowest energy A3SL1 structure fit to experimental SAXS data (black circle). SAXS data were collected on an A3SL1 sample in 20 mM Bis-Tris and 20 mM NaCl buffer at pH 6.2. (D) Zoomed-in view of the A3 cleavage site (apical loop) environment shows transient hydrogen bond pattern.
The high-resolution A3SL1 structure reveals that the PPyT is fully sequestered by tertiary interactions with the ESS2p element and the adjacent 3’ linker (Figure 4A). As is evident from the NMR data, the 3’ end of the PPyT base pairs to ESS2p to form the upper helix of A3SL1. The lower helix of A3SL1 is formed through base pairs of the 5’ end of the PPyT to the linker sequence. The PPyT:ESS2p and PPyT:Linker helices are separated by a highly structured asymmetric internal loop, leading to continuous stacking of PPyT residues around the A3SL1 helical axis. Further evidence for coaxial stacking of the PPyT:ESS2p and PPyT:Linker helices is derived from 13C-TROSY detected spin relaxation rates where we observed similar average R2/R1 values for C8 atoms from both helices and the internal loop (Figure S4). Significantly higher R2/R1 values were observed for C8 atoms from the apical loop, indicating that it tumbles independently of the adjacent coaxial stacked PPyT:ESS2p and PPyT:Linker helices.
The 9-nt apical loop, which encompasses the consensus A3 cleavage site, is also highly structured. Interestingly, residual tertiary interactions occur within the apical loop that brings the most 3’ end of the PPyT into hydrogen bonding distances of the consensus A3 cleavage site (Figure 4D). Indeed, among the 10 lowest energy structures, U5771 base pairs to U5779 in four of the structures and to A5778 in six of the structures. These transient hydrogen bond interactions allow partial stacking of U5771/U5772 and A5777/A5778 on each side of the apical loop, which is consistent with the observed NOE patterns.
In sum, A3SL1 folds into a well-defined 3D structure that fully sequesters the PPyT in tertiary interactions with the ssA3 cleavage site, the ESS2p element and the 3’ adjacent linker. These regions are phylogenetically conserved across most strains of HIV and suggests that many tertiary contacts need to be remodeled to allow access of the splicing machinery and auxiliary splicing factors.
HnRNP A1 but not HnRNP H forms a specific and thermodynamically stable complex with A3SL1.
The processes that regulate ssA3 are complex and include apparent contributions from a weak PPyT, cognate SRE-hnRNP/SR pairs and RNA structure.[5, 10, 12, 13, 26, 27] In principle, RNA conformational dynamics (global and local) can differentially influence each of these regulatory processes. We decided to investigate how the A3SL1 structure modulates binding to hnRNP A1 and hnRNP H proteins, putative repressors of ssA3.[3, 4] To that end, we performed calorimetric titrations of the RNA binding domains of these hnRNPs into A3SL1. Figure 5A shows that UP1 domain of hnRNP A1 binds A3SL1 as a 1:1 complex with an apparent dissociation constant of Kd 17.3 ± 0.67 nM. The binding mechanism includes a large negative change in total enthalpy suggesting that a specific UP1-A3SL1 complex forms. Some curvature of the isotherm is observed at lower UP1:A3SL1 molar ratios, which might be explained by partial melting of residual RNA structure at the binding site. We further determined the specificity of the binding interface on A3SL1 by monitoring changes in the 13C HSQC spectrum upon titrating unlabeled UP1 into a 13C(G)-selectively labeled A3SL1 construct. The titration shows very specific NMR signal changes with line-broadening of correlation peaks assigned to G5776, within the A3 cleavage site, and G5781 and G5783, within the adjacent ESS2p element. Collectively, the calorimetric and NMR data indicate that hnRNP A1 binds A3SL1 with high affinity and specificity within its apical loop surface. The structural integrity of a 1:1 UP1:A3SL1 complex was further evaluated by SEC-SAXS to indicate that a stoichiometrically well-resolved complex forms with dimensions (Rg=27.8 ± 0.1 Å and Dmax=68.4) distinctly different than the free A3SL1 (Figure S3).
Figure 5. Calorimetric and NMR evidence that hnRNP A1 binds the A3 cleavage site with high affinity and specificity.
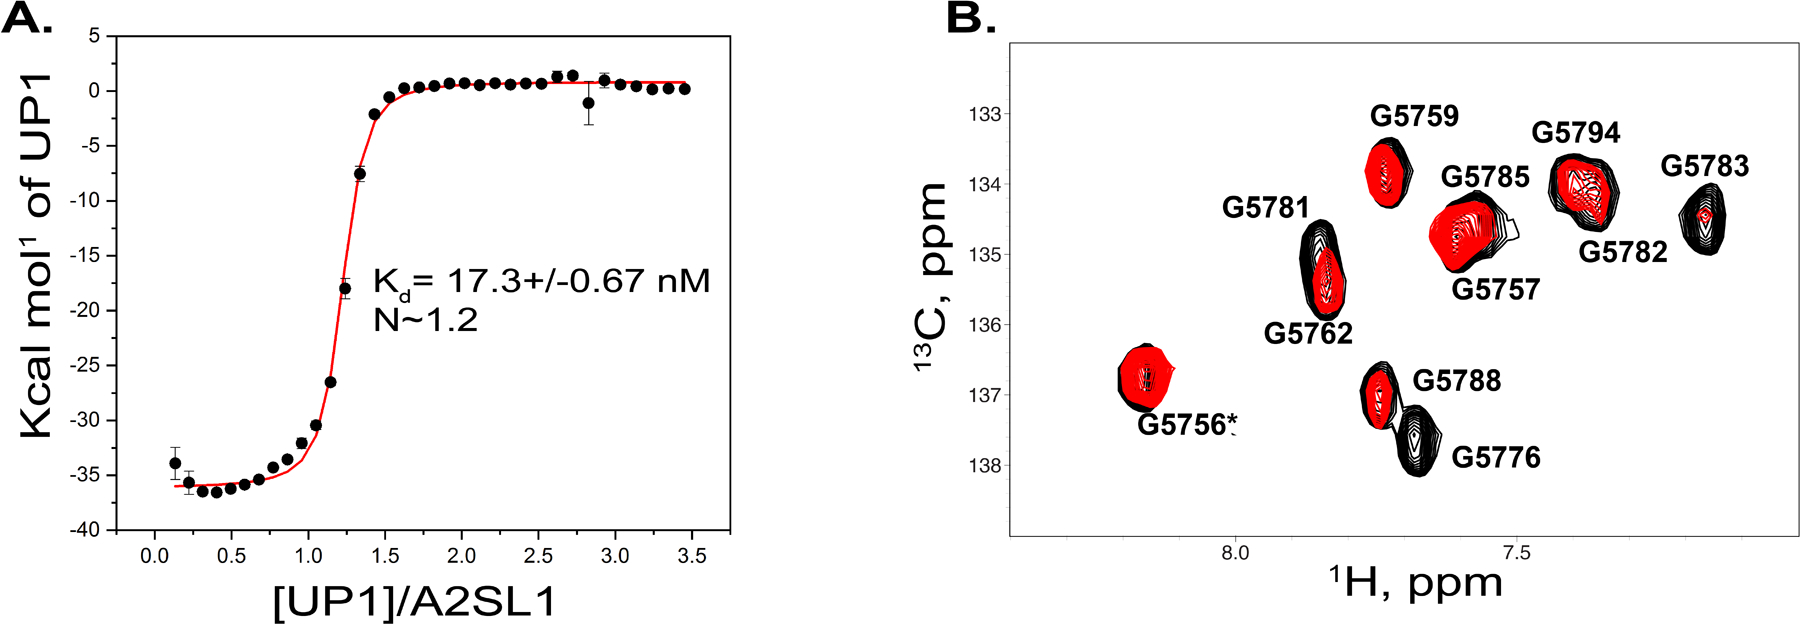
(A) Calorimetric titrations of UP1 into A3SL1 reveals a specific interaction. Titrations were performed in 10 mM K2HPO4, 40 mM KCl, and 0.5 mM sodium EDTA (pH 6.5) at 298K. (B) TROSY 1H–13C HSQC titration of a G(13C)-selectively labeled A3SL1 construct with the UP1 domain of hnRNP A1. The spectrum is zoomed in on the C8–H8 region wherein black correlation peaks represent free A3SL1 and red correlation peaks correspond to A3SL1 in the presence of a sub-stoichiometric amount of UP1 (1:0.5). The spectra were collected at 900 MHz and at 298 K.
Using calorimetry and NMR, we failed to detect the formation of a stable and robust hnRNP H-A3SL1 complex. The calorimetric titration reveals that HqRRM1,2 (the N-terminal tandem qRRMs) interacts moderately with A3SL1, but the stoichiometry of the complex is ~0.1(Figure S5). This suggest that hnRNP H interacts non-productively with A3SL1, which was further verified by 1H-13C TROSY HSQC titrations using a 13C(G)-selectively labeled A3SL1 construct. Figure S5 shows very minor NMR signal perturbations at molar ratios comparable to where hnRNP A1 induces significant shift perturbations. We reasoned the non-productive binding is a result of the PPyT:ESS2p helix that sequesters the conserved 5’-UGGGU-3’ motif.
As a test, we titrated HqRRM1,2 into a model SL construct that positions the G-tract within a 7-nt apical loop (Figure S6A). The binding isotherm is distinctly different to that of the HqRRM1,2-A3SL1 titration. By comparison, HqRRM1,2 binds the model SL robustly and with more specificity as determined by the large change in total enthalpy and the ~0.7 stoichiometry. To evaluate if HqRRM1,2 can bind A3SL, we designed a minimum construct (A3SLWT, min) that locks the structure in a non-alternating conformation. In A3SLWT, min, nts 5783–5814 are replaced by a GAGA tetraloop to preserve the secondary structure of the lower helix and the large internal loop that contains the 5’-UGGGU-3’ motif (Figure S6B). Relative to the model SL, calorimetric titrations reveal that HqRRM1,2 binds A3SLWT, min poorly and non-specifically since the binding isotherm does not saturate under identical experimental conditions (Figure S6B). This observation is consistent with genome-wide CLIP-seq studies that showed that hnRNP H does not cross link at high levels to the ESS2p element as observed for other sites throughout the viral transcriptome (REF). Calorimetric titrations of HqRRM1,2 into an A3SL minimum construct that contains the U5780C and G5783C substitutions (A3SLMut, min) shows comparable non-specific binding as observed for the A3SLWT, min (Figure S6C). Collectively, the data demonstrates that hnRNP H has intrinsically weak affinity for the ssA3 regulatory locus likely because the surrounding secondary structure sequesters its binding surface in base pair interactions with the PPyT within the context of the A3SL1 conformation or via non-canonical interactions within A3SL. By comparison, hnRNP A1 forms a robust and stable complex with A3SL1 through a surface that directly overlaps the ssA3 cleavage site.
Discussion
The mechanisms that control HIV RNA processing are intrinsically complex given the polycistronic nature of its transcript and the dual demands to code and to serve as genome for nascent virions. Homeostatic levels of splicing must be maintained so that the HIV transcriptome can regulate these dual processes. Offsets in any direction has potential to inhibit viral replication.[10, 49] Heterogeneous viral RNA structures provide a mechanism to control splicing by differentially exposing binding surfaces for core and auxiliary splicing factors (Figure 6). The HIV RNA transcript folds co- and post-transcriptionally as is reflected in its distinct spliced RNA pools. Thus, viral RNA structural heterogeneity naturally occurs so long as new transcripts are synthesized. Such structural heterogeneity can differentially modulate viral RNA metabolism and hence influence replication fidelity.
Figure 6.

Heterogenous A3SL structures confer more stringent control to differentially regulate HIV splice site A3 activity via multiple mechanisms.
In this study, we demonstrate using NMR spectroscopy that the phylogenetically conserved ssA3 regulatory locus intrinsically adopts different structures where the A3SL1 conformer folds into a compact shape that completely sequesters the PPyT into base paired helices (PPyT:ESS2p and PPyT:Linker) and further locks the A3 cleavage site in residual tertiary interactions. We describe this as the pair-and-lock mechanism to control ssA3 utilization. Mutations that disrupt the pairing interactions correlate with an increase in A3 splicing efficiency, providing solid support of the formation of the PPyT:ESS2p helix.
Thus, the pair-and-lock mechanism can impart more stringent control over a sub-population of heterogeneously folded viral transcripts (Figure 6).
The A3SL1 structure can intrinsically fold as previously determined by chemo-enzymatic probing and here by NMR for in vitro synthesized RNA; however, it is not the most abundant structure observed in HIV infected cells.[5] The factors that chaperone the folding of RNA in the cellular environment are multifaceted, but intrinsic properties that drive a particular structure to form are encoded in its sequence. This is true for the ssA3 regulatory locus since the ability to form the A3SL1 structure is seen at the level of sequence conservation. Solution NMR spectroscopy provides direct evidence of the hydrogen bonding pattern of the PPyT:ESS2p interaction, and it further shows how the entire PPyT is engaged in tertiary contacts with the moderately conserved linker sequence. Moreover, the high-resolution A3SL1 3D structure reveals that the A3 cleavage site is embedded within a stacked stereochemical environment that locally rearranges on the us-ms timescale to regulate access to the most 3’-end of the PPyT. The highly conserved 5’-YAG/A-3’ splice site resides at the top of the apical loop and forms a surface that supports robust and specific interactions with hnRNP A1. While hnRNP A1 is believed to repress ssA3 activity through binding the distal ESS2 element, the sequence of ESS2 is the least conserved SRE. During cellular splicing, hnRNP A1 can compete binding of U2AF to sub-optimal 5’-YCG-3’ splice sites so as to ensure that U2AF more efficiently assembles at optimized 5’-YAG-3’ splice sites.[50] Interestingly, the 5’-CAGG-5’ ssA3 motif is strictly conserved in group M viruses (Figure 1A). Thus, it is plausible that hnRNP A1 binds directly to the A3 cleavage site to further reduce the extent to which U2AF can assemble. Of course, this is further modulated by pairing the PPyT to ESS2p and the remainder of A3SL1. Studies to understand the roles played by hnRNP A1 in HIV splicing often yield mixed results in part because the binding specificity of hnRNP A1is determined by a short and repetitive 5’-YAG-3’ motif. To that end, CLIPseq shows that hnRNP A1 binds diffusely throughout the HIV transcriptome but the mechanistic nature of those interactions is not easily determined by sequencing reads.[23] It is plausible that the nature of hnRNP A1-HIV interactions are non-equivalent and that RNA structure lifts the degeneracy of a short motif to facilitate local site-specific regulation even in the background of diffuse binding. The biophysical study conducted here on the hnRNP A1-A3SL1 complex provides an in vitro benchmark to test this concept.
Our work further demonstrates how the A3SL1 structure blocks binding of hnRNP H suggesting that the major role of ESS2p is to restrict access to the PPyT. This concept is further supported by the observation that HqRRM1,2 binds the A3SL mimic weakly and non-specifically. When the hnRNP H consensus motif was placed within an apical loop environment, we observed specific and high affinity binding. This implies that A3SL1 would need to undergo a large-scale conformation change to expose the ESS2p element to hnRNP H. Interpreting our mutational splicing data through the A3SL1 structure supports this model since those mutations are predicted to weaken the PPyT:ESS2p helix. Such large-scale conformational changes to rearrange the PPyT:ESS2p helix would likely need to be chaperoned by an RNA binding protein. The us-ms dynamics observed within the apical and internal loops reveal that the accessibility of these sites is modulated by local structural fluctuations that rearrange base pairing and stacking.
In sum, the work presented here provides a comprehensive biophysical analysis of the ssA3 regulatory locus and its interactions with cognate hnRNPs. It further demonstrates that the structural properties of A3SL1 are genetically encoded to fold the PPyT:ESS2p/PPyT:Linker helices and to establish the stereochemical environment of the A3 consensus cleavage site. Given these observations, we propose that the ssA3 regulatory determinants function locally through conserved tertiary interactions that are modulated by changes to the pool of heterogeneous RNA secondary structures that switch conformations over the course of an active HIV infection.
Supplementary Material
Acknowledgements
This work was funded by National Institutes of Health grants U54 AI170660 (the Center for HIV RNA Studies, RS and AE) and R01AI150830 (BST). This research used resources of the Advanced Photon Source, a U.S. Department of Energy (DOE) Office of Science User Facility operated for the DOE Office of Science by Argonne National Laboratory under Contract No. DE-AC02-06CH11357. This project was supported by grant 9 P41 GM103622 from the National Institute of General Medical Sciences of the National Institutes of Health. Use of the Pilatus 3 1M detector was provided by grant 1S10OD018090-01 from NIGMS. The authors would like to thank the BioCAT (Beamline 18-ID) scientist, Srinivas Chakravarthy, for assistance with analyzing MAL. This study also made use of the Campus Chemical Instrument Center NMR facility at the Ohio State University, and the authors would like to thank Alexandar L. Hansen for assistance with performing and analyzing the 13C-CEST experiments. We would also like to thank Jeffrey Levengood (CWRU) and John Collins (formerly of University of Michigan) for designing and preparing the mutant constructs, respectively that were used in the quantitative splicing assay.
Data Availability
Chemical shift assignments have been deposited in the BMRB for A3SL1 with accession code 51310. The coordinates for A3SL1 have been deposited in the PDB with accession code 7VO6 and SAXS data have been deposited in the Small Angle Scattering Biological Data bank under accession code SASDPD3.
References
- [1].Karn J, Stoltzfus CM. Transcriptional and posttranscriptional regulation of HIV-1 gene expression. Cold Spring Harb Perspect Med. 2012;2:a006916. [DOI] [PMC free article] [PubMed] [Google Scholar]
- [2].Emery A, Swanstrom R. HIV-1: To Splice or Not to Splice, That Is the Question. Viruses. 2021;13. [DOI] [PMC free article] [PubMed] [Google Scholar]
- [3].Stoltzfus CM. Chapter 1. Regulation of HIV-1 alternative RNA splicing and its role in virus replication. Adv Virus Res. 2009;74:1–40. [DOI] [PubMed] [Google Scholar]
- [4].Stoltzfus CM, Madsen JM. Role of viral splicing elements and cellular RNA binding proteins in regulation of HIV-1 alternative RNA splicing. Curr HIV Res. 2006;4:43–55. [DOI] [PubMed] [Google Scholar]
- [5].Tomezsko PJ, Corbin VDA, Gupta P, Swaminathan H, Glasgow M, Persad S, et al. Determination of RNA structural diversity and its role in HIV-1 RNA splicing. Nature. 2020;582:438–42. [DOI] [PMC free article] [PubMed] [Google Scholar]
- [6].Ocwieja KE, Sherrill-Mix S, Mukherjee R, Custers-Allen R, David P, Brown M, et al. Dynamic regulation of HIV-1 mRNA populations analyzed by single-molecule enrichment and long-read sequencing. Nucleic Acids Res. 2012;40:10345–55. [DOI] [PMC free article] [PubMed] [Google Scholar]
- [7].Emery A, Zhou S, Pollom E, Swanstrom R. Characterizing HIV-1 Splicing by Using Next-Generation Sequencing. J Virol. 2017;91. [DOI] [PMC free article] [PubMed] [Google Scholar]
- [8].Exline CM, Feng Z, Stoltzfus CM. Negative and positive mRNA splicing elements act competitively to regulate human immunodeficiency virus type 1 vif gene expression. J Virol. 2008;82:3921–31. [DOI] [PMC free article] [PubMed] [Google Scholar]
- [9].Madsen JM, Stoltzfus CM. A suboptimal 5’ splice site downstream of HIV-1 splice site A1 is required for unspliced viral mRNA accumulation and efficient virus replication. Retrovirology. 2006;3:10. [DOI] [PMC free article] [PubMed] [Google Scholar]
- [10].Madsen JM, Stoltzfus CM. An exonic splicing silencer downstream of the 3’ splice site A2 is required for efficient human immunodeficiency virus type 1 replication. J Virol. 2005;79:10478–86. [DOI] [PMC free article] [PubMed] [Google Scholar]
- [11].Domsic JK, Wang Y, Mayeda A, Krainer AR, Stoltzfus CM. Human immunodeficiency virus type 1 hnRNP A/B-dependent exonic splicing silencer ESSV antagonizes binding of U2AF65 to viral polypyrimidine tracts. Molecular and cellular biology. 2003;23:8762–72. [DOI] [PMC free article] [PubMed] [Google Scholar]
- [12].Jacquenet S, Ropers D, Bilodeau PS, Damier L, Mougin A, Stoltzfus CM, et al. Conserved stem-loop structures in the HIV-1 RNA region containing the A3 3’ splice site and its cis-regulatory element: possible involvement in RNA splicing. Nucleic acids research. 2001;29:464–78. [DOI] [PMC free article] [PubMed] [Google Scholar]
- [13].Jacquenet S, Mereau A, Bilodeau PS, Damier L, Stoltzfus CM, Branlant C. A second exon splicing silencer within human immunodeficiency virus type 1 tat exon 2 represses splicing of Tat mRNA and binds protein hnRNP H. J Biol Chem. 2001;276:40464–75. [DOI] [PubMed] [Google Scholar]
- [14].Bilodeau PS, Domsic JK, Mayeda A, Krainer AR, Stoltzfus CM. RNA splicing at human immunodeficiency virus type 1 3’ splice site A2 is regulated by binding of hnRNP A/B proteins to an exonic splicing silencer element. J Virol. 2001;75:8487–97. [DOI] [PMC free article] [PubMed] [Google Scholar]
- [15].Bilodeau PS, Domsic JK, Stoltzfus CM. Splicing regulatory elements within tat exon 2 of human immunodeficiency virus type 1 (HIV-1) are characteristic of group M but not group O HIV-1 strains. J Virol. 1999;73:9764–72. [DOI] [PMC free article] [PubMed] [Google Scholar]
- [16].Zhang L, Stoltzfus CM. A suboptimal src 3’ splice site is necessary for efficient replication of Rous sarcoma virus. Virology. 1995;206:1099–107. [DOI] [PubMed] [Google Scholar]
- [17].Jablonski JA, Caputi M. Role of cellular RNA processing factors in human immunodeficiency virus type 1 mRNA metabolism, replication, and infectivity. J Virol. 2009;83:981–92. [DOI] [PMC free article] [PubMed] [Google Scholar]
- [18].Jablonski JA, Buratti E, Stuani C, Caputi M. The secondary structure of the human immunodeficiency virus type 1 transcript modulates viral splicing and infectivity. J Virol. 2008;82:8038–50. [DOI] [PMC free article] [PubMed] [Google Scholar]
- [19].Schaub MC, Lopez SR, Caputi M. Members of the heterogeneous nuclear ribonucleoprotein H family activate splicing of an HIV-1 splicing substrate by promoting formation of ATP-dependent spliceosomal complexes. J Biol Chem. 2007;282:13617–26. [DOI] [PubMed] [Google Scholar]
- [20].Caputi M, Zahler AM. Determination of the RNA binding specificity of the heterogeneous nuclear ribonucleoprotein (hnRNP) H/H’/F/2H9 family. J Biol Chem. 2001;276:43850–9. [DOI] [PubMed] [Google Scholar]
- [21].Caputi M, Mayeda A, Krainer AR, Zahler AM. hnRNP A/B proteins are required for inhibition of HIV-1 pre-mRNA splicing. The EMBO journal. 1999;18:4060–7. [DOI] [PMC free article] [PubMed] [Google Scholar]
- [22].Takata MA, Soll SJ, Emery A, Blanco-Melo D, Swanstrom R, Bieniasz PD. Global synonymous mutagenesis identifies cis-acting RNA elements that regulate HIV-1 splicing and replication. PLoS Pathog. 2018;14:e1006824. [DOI] [PMC free article] [PubMed] [Google Scholar]
- [23].Kutluay SB, Emery A, Penumutchu SR, Townsend D, Tenneti K, Madison MK, et al. Genome-Wide Analysis of Heterogeneous Nuclear Ribonucleoprotein (hnRNP) Binding to HIV-1 RNA Reveals a Key Role for hnRNP H1 in Alternative Viral mRNA Splicing. J Virol. 2019;93. [DOI] [PMC free article] [PubMed] [Google Scholar]
- [24].Saliou JM, Bourgeois CF, Ayadi-Ben Mena L, Ropers D, Jacquenet S, Marchand V, et al. Role of RNA structure and protein factors in the control of HIV-1 splicing. Frontiers in bioscience : a journal and virtual library. 2009;14:2714–29. [DOI] [PubMed] [Google Scholar]
- [25].Hallay H, Locker N, Ayadi L, Ropers D, Guittet E, Branlant C. Biochemical and NMR study on the competition between proteins SC35, SRp40, and heterogeneous nuclear ribonucleoprotein A1 at the HIV-1 Tat exon 2 splicing site. J Biol Chem. 2006;281:37159–74. [DOI] [PubMed] [Google Scholar]
- [26].Erkelenz S, Hillebrand F, Widera M, Theiss S, Fayyaz A, Degrandi D, et al. Balanced splicing at the Tat-specific HIV-1 3’ss A3 is critical for HIV-1 replication. Retrovirology. 2015;12:29. [DOI] [PMC free article] [PubMed] [Google Scholar]
- [27].Sertznig H, Hillebrand F, Erkelenz S, Schaal H, Widera M. Behind the scenes of HIV-1 replication: Alternative splicing as the dependency factor on the quiet. Virology. 2018;516:176–88. [DOI] [PubMed] [Google Scholar]
- [28].Adachi A, Gendelman HE, Koenig S, Folks T, Willey R, Rabson A, et al. Production of acquired immunodeficiency syndrome-associated retrovirus in human and nonhuman cells transfected with an infectious molecular clone. J Virol. 1986;59:284–91. [DOI] [PMC free article] [PubMed] [Google Scholar]
- [29].Delaglio F, Grzesiek S, Vuister GW, Zhu G, Pfeifer J, Bax A. NMRPipe: a multidimensional spectral processing system based on UNIX pipes. Journal of biomolecular NMR. 1995;6:277–93. [DOI] [PubMed] [Google Scholar]
- [30].Johnson BA, Blevins RA. NMR View: A computer program for the visualization and analysis of NMR data. J Biomol NMR. 1994;4:603–14. [DOI] [PubMed] [Google Scholar]
- [31].Lee W, Tonelli M, Markley JL. NMRFAM-SPARKY: enhanced software for biomolecular NMR spectroscopy. Bioinformatics. 2015;31:1325–7. [DOI] [PMC free article] [PubMed] [Google Scholar]
- [32].Takor G, Morgan CE, Chiu L-Y, Kendrick N, Clark E, Jaiswal R, et al. Introducing Structure–Energy Concepts of RNA at the Undergraduate Level: Nearest Neighbor Thermodynamics and NMR Spectroscopy of a GAGA Tetraloop. Journal of Chemical Education. 2020. [Google Scholar]
- [33].Fürtig B, Richter C, Wöhnert J, Schwalbe H. NMR spectroscopy of RNA. Chembiochem. 2003;4:936–62. [DOI] [PubMed] [Google Scholar]
- [34].Al-Hashimi HM, Gosser Y, Gorin A, Hu W, Majumdar A, Patel DJ. Concerted motions in HIV-1 TAR RNA may allow access to bound state conformations: RNA dynamics from NMR residual dipolar couplings. Journal of molecular biology. 2002;315:95–102. [DOI] [PubMed] [Google Scholar]
- [35].Hansen AL, Al-Hashimi HM. Dynamics of large elongated RNA by NMR carbon relaxation. J Am Chem Soc. 2007;129:16072–82. [DOI] [PubMed] [Google Scholar]
- [36].Penumutchu SR, Chiu LY, Meagher JL, Hansen AL, Stuckey JA, Tolbert BS. Differential Conformational Dynamics Encoded by the Linker between Quasi RNA Recognition Motifs of Heterogeneous Nuclear Ribonucleoprotein H. Journal of the American Chemical Society. 2018;140:11661–73. [DOI] [PMC free article] [PubMed] [Google Scholar]
- [37].Franke D, Petoukhov MV, Konarev PV, Panjkovich A, Tuukkanen A, Mertens HDT, et al. ATSAS 2.8: a comprehensive data analysis suite for small-angle scattering from macromolecular solutions. J Appl Crystallogr. 2017;50:1212–25. [DOI] [PMC free article] [PubMed] [Google Scholar]
- [38].Semenyuk AV, Svergun DI. GNOM - a program package for small-angle scattering data processing. Journal of Applied Crystallography. 1991;24:537–40. [DOI] [PMC free article] [PubMed] [Google Scholar]
- [39].Franke D, Svergun DI. DAMMIF, a program for rapid ab-initio shape determination in small-angle scattering. Journal of applied crystallography. 2009;42:342–6. [DOI] [PMC free article] [PubMed] [Google Scholar]
- [40].Volkov VV, Svergun DI. Uniqueness of ab initio shape determination in small-angle scattering. Journal of Applied Crystallography. 2003;36:860–4. [DOI] [PMC free article] [PubMed] [Google Scholar]
- [41].Schwieters CD, Kuszewski JJ, Tjandra N, Clore GM. The Xplor-NIH NMR molecular structure determination package. J Magn Reson. 2003;160:65–73. [DOI] [PubMed] [Google Scholar]
- [42].Svergun D, Barberato C, Koch MHJ. CRYSOL– a Program to Evaluate X-ray Solution Scattering of Biological Macromolecules from Atomic Coordinates. Journal of Applied Crystallography. 1995;28:768–73. [Google Scholar]
- [43].Pérez A, Marchán I, Svozil D, Sponer J, Cheatham TE, Laughton CA, et al. Refinement of the AMBER force field for nucleic acids: improving the description of alpha/gamma conformers. Biophys J. 2007;92:3817–29. [DOI] [PMC free article] [PubMed] [Google Scholar]
- [44].Zgarbová M, Otyepka M, Sponer J, Mládek A, Banáš P, Cheatham TE, et al. Refinement of the Cornell et al. Nucleic Acids Force Field Based on Reference Quantum Chemical Calculations of Glycosidic Torsion Profiles. J Chem Theory Comput. 2011;7:2886–902. [DOI] [PMC free article] [PubMed] [Google Scholar]
- [45].Gotz AW, Williamson MJ, Xu D, Poole D, Le Grand S, Walker RC. Routine Microsecond Molecular Dynamics Simulations with AMBER on GPUs. 1. Generalized Born. J Chem Theory Comput. 2012;8:1542–55. [DOI] [PMC free article] [PubMed] [Google Scholar]
- [46].Roe DR, Cheatham TE 3rd. PTRAJ and CPPTRAJ: Software for Processing and Analysis of Molecular Dynamics Trajectory Data. J Chem Theory Comput. 2013;9:3084–95. [DOI] [PubMed] [Google Scholar]
- [47].Davila-Calderon J, Patwardhan NN, Chiu LY, Sugarman A, Cai Z, Penutmutchu SR, et al. IRES-targeting small molecule inhibits enterovirus 71 replication via allosteric stabilization of a ternary complex. Nature communications. 2020;11:4775. [DOI] [PMC free article] [PubMed] [Google Scholar]
- [48].Burnouf D, Ennifar E, Guedich S, Puffer B, Hoffmann G, Bec G, et al. kinITC: a new method for obtaining joint thermodynamic and kinetic data by isothermal titration calorimetry. Journal of the American Chemical Society. 2012;134:559–65. [DOI] [PubMed] [Google Scholar]
- [49].Mandal D, Feng Z, Stoltzfus CM. Excessive RNA splicing and inhibition of HIV-1 replication induced by modified U1 small nuclear RNAs. J Virol. 2010;84:12790–800. [DOI] [PMC free article] [PubMed] [Google Scholar]
- [50].Tavanez JP, Madl T, Kooshapur H, Sattler M, Valcarcel J. hnRNP A1 proofreads 3’ splice site recognition by U2AF. Mol Cell. 2012;45:314–29. [DOI] [PubMed] [Google Scholar]
Associated Data
This section collects any data citations, data availability statements, or supplementary materials included in this article.
Supplementary Materials
Data Availability Statement
Chemical shift assignments have been deposited in the BMRB for A3SL1 with accession code 51310. The coordinates for A3SL1 have been deposited in the PDB with accession code 7VO6 and SAXS data have been deposited in the Small Angle Scattering Biological Data bank under accession code SASDPD3.