Abstract
Malformations of cortical development (MCD) are neurological conditions displaying focal disruption of cortical architecture and cellular organization arising during embryogenesis, largely from somatic mosaic mutations, and causing intractable epilepsy. Identifying the genetic causes of MCD has been a challenge, as mutations remain at low allelic fractions in brain tissue resected to treat condition-related epilepsy. Here, we report a genetic landscape from 283 brain resections, identifying 69 mutated genes through intensive profiling of somatic mutations, combining whole-exome and targeted-amplicon sequencing with functional validation including in utero electroporation of mice and single-nucleus RNA sequencing. Genotype-phenotype correlation analysis elucidated specific MCD gene sets associating distinct pathophysiological and clinical phenotypes. The unique single-cell level spatiotemporal expression patterns of mutated genes in control and patient brains implicate critical roles in excitatory neurogenic pools during brain development, and in promoting neuronal hyperexcitability after birth.
Keywords: epilepsy, focal cortical dysplasia, brain mosaicism, mTOR, single-cell sequencing, whole-exome sequencing, somatic, migration, excitation
Editor summary:
This Brain Somatic Mosaicism Network analysis of 283 cases of malformations of cortical development identifies 69 candidate and known genes in 76 patients. snRNA-seq and mouse modelling implicates radial glia and daughter excitatory neurons.
Introduction
MCDs are heterogeneous groups of neurodevelopmental disorders with localized malformation of cortical structures, often presenting with intractable epilepsy1. Major MCD subtypes include different classes of focal cortical dysplasia (FCD), hemimegalencephaly (HME), and tuberous sclerosis complex (TSC)2. The International League Against Epilepsy (ILAE) has classified FCD subtypes based on neuropathological features and cell types3. Fifty percent of patients with epileptic surgery due to refractory epilepsy show cortical dysplasia, and 50~75% of MCD patients become seizure-free after surgical resection, which has led to remarkable clinical benefits4–6. The abnormal histology of resected regions includes loss of cortical lamination, enlarged dysplastic neurons, or balloon cells, sometimes accompanied by other brain abnormalities. Similar to brain tumors, it can be difficult to predict pathology before surgery.
Again, like with brain tumors, genetic studies may offer insights into mechanisms. Somatic mTOR pathway gene mutations are frequently detected in HME and type II FCD foci7,8. Recently, small- or medium-size cohort studies (<130 cases) confirmed these results and correlated defects in neuronal migration, cell size, and neurophysiology9–11. Still, 30~70% of MCD cases remain genetically unsolved9–11, suggesting other genes are yet to be discovered.
Detecting mutant alleles in resected bulk tissue from MCD patients is challenging because unlike in brain tumors, the mutant cells in MCD are probably not hyperproliferative, and thus variant allelic fraction (VAF) are low, often <5%, diluted by genomes of surrounding non-mutated cells12. Fortunately, new computational algorithms can help reduce false-positive and false-negative signals, even when no ‘normal’ paired sample is available for comparison13–15. Recent deep-learning technologies and state-of-the-art image-based artificial intelligence software such as DeepMosaic, trained on non-cancer mosaic variants have significantly improved accuracy14. The NIH-supported Brain Somatic Mosaicism Network (BSMN) established a ‘Common pipeline’, incorporating a ‘best practice’ workflow to reliably and reproducibly identify low VAF somatic variants16. With these advances, we assessed for mosaic variants that might point to gene networks beyond mTOR in MCD lesions. Our results offer insights into potentially druggable pathways in cases of incomplete resection or drug-resistant forms of MCD.
Results
Sequencing approach to identify causes of MCD
To perform a thorough genetic screening for somatic mutations in resected epileptic tissue, we formed the FCD Neurogenetics Consortium and from 22 separate international centers, enrolled 293 cases that met clinical and pathological criteria for FCD or HME. Our cohort included 30 HME cases, 80 type I-, 128 type II-, 31 type III-, and 12 unclassified-FCD cases. We included acute resected brains from 10 neurotypicals and 2 TSC cases for comparison (Fig. 1a, Supplementary Table 1). Patients with environmental causes, syndromic presentations such as TSC, inherited mutations, multifocal lesions, or tumors were excluded (Methods).
Figure 1. Comprehensive genetic profiling and validation of somatic variants in 283 MCD patients.
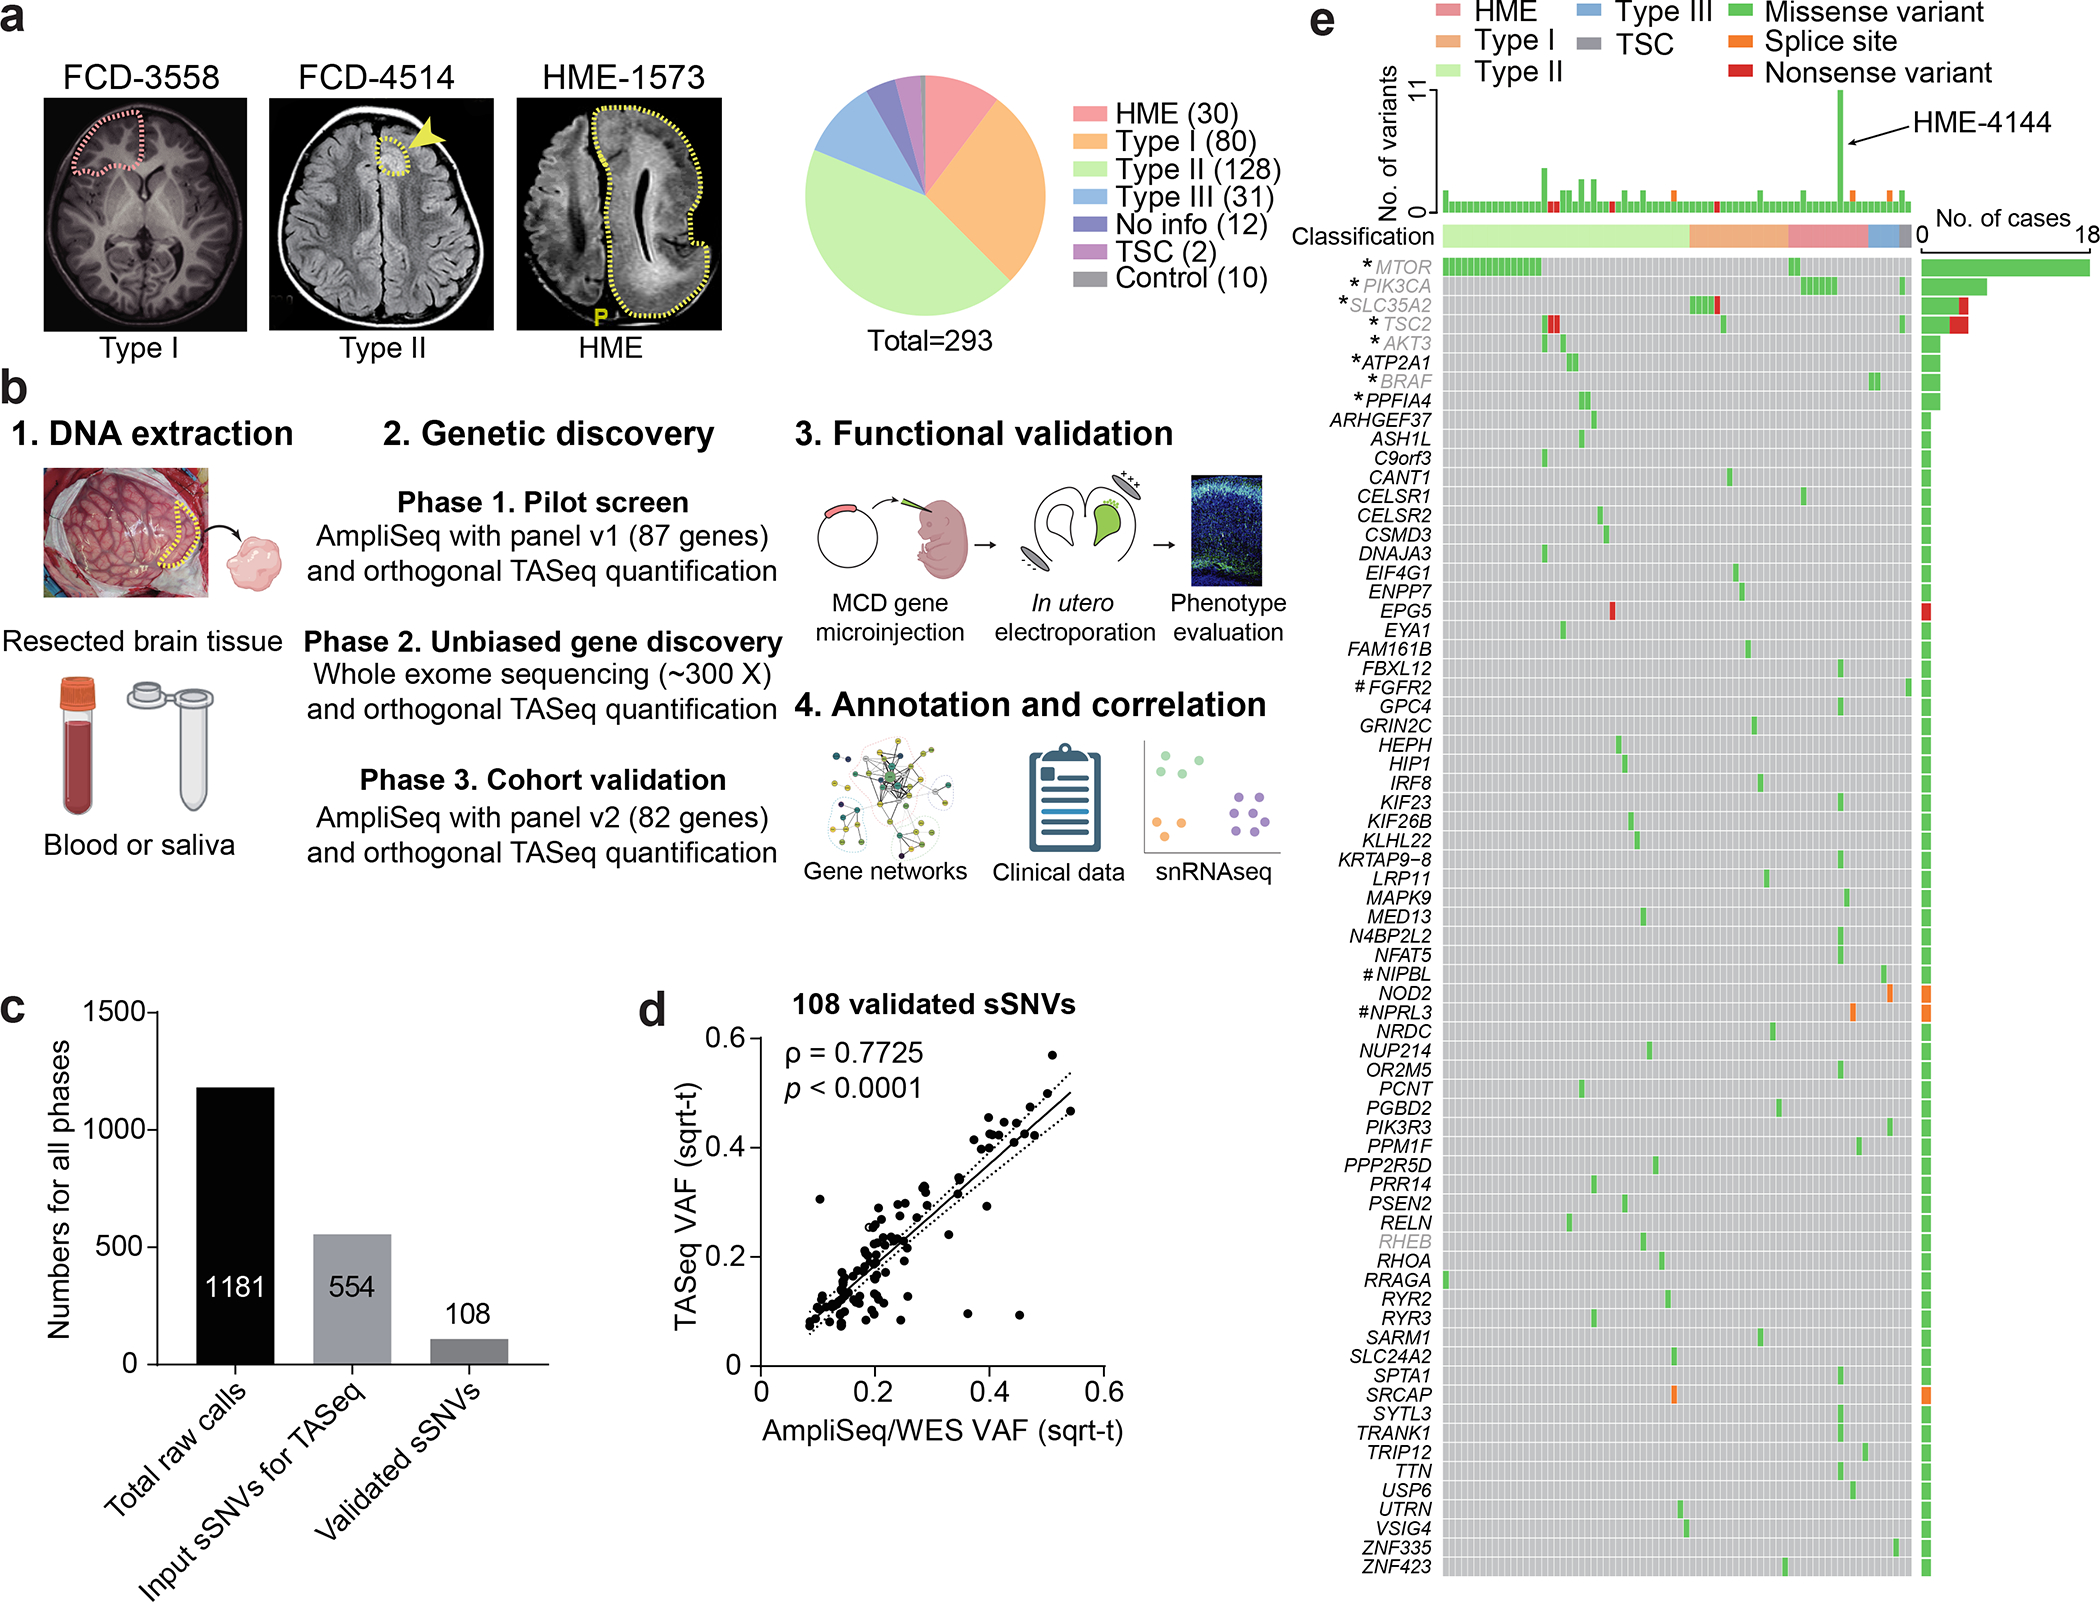
(a) Representative MRI image of FCD-3558 (FCD type I), FCD-4514 (FCD type II), HME-1573, and composition MCD cohort. Yellow arrow and dash: affected brain regions. FCD-3558, MRI was non-lesional, the epileptic focus was mapped to the right frontal lobe (red dashed line) and resected. (b) Three-phase comprehensive genetic MCD profiling workflow, followed by quantification/validation of each variant with target amplicon sequencing (TASeq). Phase 1] 1000 × pilot screening of DNA with an 87-gene mTOR-related panel. Phase 2] 300 × whole-exome sequencing (WES) with best-practice somatic variant discovery for novel candidate genes. Phase 3] Cohort-level validation with an updated, high-confidence TASeq gene set arising from Phases 1 and 2. A subset of somatic mutations was functionally validated in mice. Annotation and correlation with gene networks, clinical data, and single-single-nucleus RNAseq. (c) 1181 sSNV calls were detected from all three phases, yielding 108 validated sSNVs. (d) Correlation between square-root transformed (sqrt-t) AmpliSeq/WES variant allele fraction (VAF) and TASeq VAF. Solid line: Simple linear regression (goodness of fit). Dashed lines: 95% confidence band. Spearman correlation coefficient ρ and corresponding two-tailed t-test p-value. (e) Oncoplot of 69 genes from 108 validated sSNVs. Top: most patients had one gene mutated, a few patients had more than one gene mutated, and patient HME-4144 had 11 different validated genes mutated. Grey: genes recurrently mutated in previous HME/FCD cohorts. *: genes recurrently mutated in our cohort. #: genes non-recurrently mutated but complementary to other cohorts of epilepsy-associated developmental lesions.
We used a three-phase genetic screening, each followed by filtering for likely causative mutations using published methods17,18, and each followed by orthogonal targeted amplicon sequencing (TASeq) for intra-case validation and VAF quantification, normalized with controls (~5000 X, TASeq) (Fig. 1b, Extended Data Fig. 1). In Phase 1, we performed amplicon sequencing (AmpliSeq, ~1000 X) profiling the entire open reading frame of 87 genes (‘MCD panel v1’, Supplementary Table 2a) previously detected in FCD/HMEs or known PI3K-AKT3-mTOR interactors (Supplementary Table 2b). In Phase 2, 80 cases (75 unsolved cases plus 5 solved cases) from Phase 1 and additionally collected 54 cases, we performed unbiased deep whole-exome sequencing (WES, ~300 X) on paired samples, where available, or unpaired samples (i.e. brain plus blood/saliva vs. brain only). In Phase 3, from an additional subcohort of 96 new cases (86 MCD plus 10 neurotypical), we designed the ‘MCD panel v2’ (Supplementary Table 2c) including known and novel genes detected in Phases 1 and 2 (Methods). We also re-sequenced unsolved cases from Phase 2 (30 cases), expecting that the higher read depth afforded by panel sequencing could provide greater sensitivity to detect low VAF mutations potentially missed by WES. Phase 2 used BSMN best practice guidelines for mapping and variant calling16 (Extended Data Fig. 1b,c).
From Phases 1 to 3, 1181 candidate somatic single nucleotide variant (sSNV) calls were identified (Supplementary Table 3a). Of these, 627 were excluded based on gnomAD allele frequencies, dinucleotide repeats, homopolymers, and additional BSMN established criteria (Methods)19,20. This yielded 554 candidate sSNVs, each assessed by TASeq, yielding 108 validated sSNVs (19.4% validation rate, Fig. 1c, Supplementary Table 3b), comparing similarly to other BSMN effort validation rates in WGS16,21. The validation rate of candidate sSNV calls in each phase was 12.1% (15/124), 20.9% (67/320), and 23.6% (26/110), respectively. The measured square-root transformed VAFs between the AmpliSeq/WES and TASeq were correlated as expected (Spearman ρ = 0.7725) (Fig. 1d). Of the 69 genes mutated in 76 patients, 60 were not previously implicated in MCD. Eight were recurrently mutated, including 6 known MCD genes (MTOR, PIK3CA, SLC35A2, TSC2, AKT3, BRAF) as well as 2 novel candidates (ATP2A1, PPFIA4) (Fig. 1e, Extended data Fig. 2a,b). There were also several genes mutated that were recently linked to epilepsy-associated developmental lesions (FGFR2, NIPBL, NPRL3)22, one gene recently identified in FCD (RHEB23), and 57 genes we found mutated in a single brain sample.
We estimate only ~7% of mutations identified are likely attributable to false discovery during variant calling, based upon the background mutation rate in 75 BSMN neurotypical brain samples, and published experience from the BSMN16,24, processed with the same workflow (see Methods). Thus, 93% of our candidate and known MCD mutations would not have been identified in a size-matched neurotypical control cohort. We estimate the false negative rate of phase 2 was 1.67%, assuming VAF rates comparable to what was detected (Methods). We also calculated the probability of identifying the same gene mutated in two separate patients by chance (Methods), taking into consideration the mutation rate, cohort size of each phase, gene length, and panel size. ATP2A1 and PPFIA4, the two novel recurrently mutated candidates, both reached significance from our permutation analysis (p = 0.000127 for ATP2A1 and p = 0.000258 for PPFIA4, Methods).
Most patients (80.52%, 62 cases) showed a single somatic mutation, but some showed two somatic mutations (14.29%, 11 cases), and a few showed more than two mutations (5.19%, 4 cases). Interestingly, HME-4144 showed 11 different somatic mutations, all of which were validated with TASeq. Although there are several possible explanations for HME-4144, we suspect this reflects clonal expansion from a driver mutation, with the detection of multiple passenger mutations, as reported in brain tumors25.
Single-base mutational signatures (SBS) can describe potential mutational mechanisms in human disease26. We found 60.2% of mutations were C>T, likely arising from mutation of the methylated CpG dinucleotide DNA epigenetic mark27 (Extended Data Fig. 3). Enrichment of SBS1 and SBS5, clock-like mutational signatures suggest endogenous mutations arising during corticogenesis DNA replication.
Functional dissection of the MCD genes
Interestingly, most validated genes were non-recurrently mutated in our cohort, suggesting substantial genetic heterogeneity in MCD. This nevertheless provided an opportunity to study converging functional gene networks. Thus, we performed Markov clustering with a STRING network generated from the putative MCD genes28, as well as recently reported novel MCD candidates (NAV2, EEF2, CASK, NF1, KRAS, PTPN11)22,29 (Fig. 2a). We identified four clusters, with cluster 1 (“mTOR pathway”) showing the highest term enrichment to the mTOR/MAP kinase signaling, supporting prior results for Type II MCDs. Because MCD panel v1 included many mTOR pathway genes not identified as mutated in patients from WES, we repeated the analysis by excluding genes not identified a priori from WES and recovered the same clusters (Extended Data Fig. 4). Cluster 1 also highlighted newly identified genes FGFR2, KLHL22, RRAGA, PPP2R5D, PIK3R3, EEF2, EIF4G1, and MAPK9. Cluster 2 identified “Calcium Dynamics” and included genes ATP2A1, RYR2, RYR3, PSEN2, TTN, and UTRN. Cluster 3 was labeled “Synaptic Functions” and included genes CASK, GRIN2C, and PPFIA4. Cluster 4 was labeled “Gene Expression” and included intellectual disability genes, mostly involved in nuclear function, including NUP214, PRR14, PCNT, NIPBL, SRCAP, ASH1L, TRIP12, and MED13 (Fig. 2b, Methods). We further performed ClueGO analysis and found enrichment in mTOR signaling, focal adhesion assembly, cardiac muscle cell contraction, and artery morphogenesis (Extended Data Fig. 5). ClueGO also displayed isolated gene ontology (GO) term clusters such as ‘calcium ion import’ and ‘protein localization to synapse’. There were recurrently mutated genes in all four clusters, and while several of these clusters were not previously reported in MCDs, they were previously implicated in epilepsy, neurodevelopmental and neurodegenerative disease30,31, suggesting functional overlap with MCDs.
Figure 2. Genes mutated in MCD highlight four major gene networks.
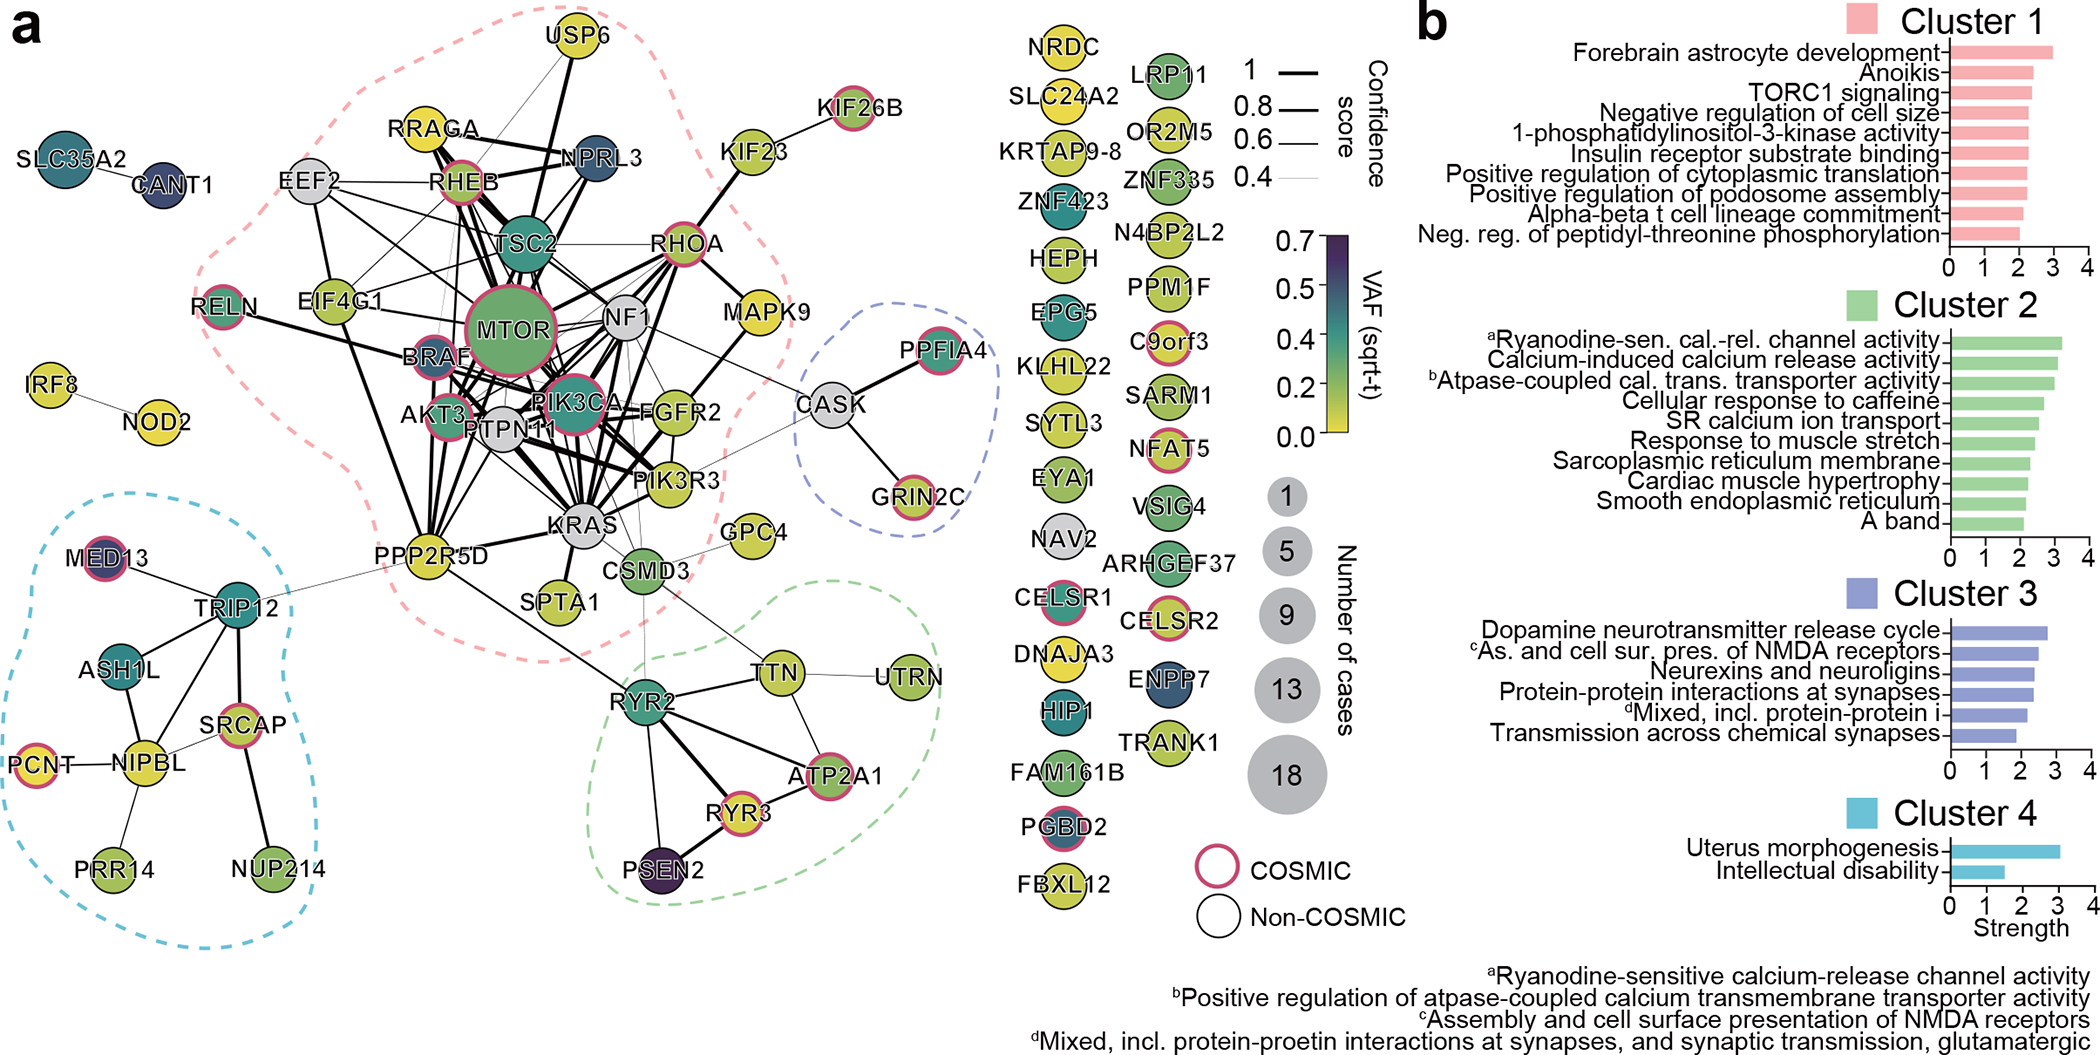
(a) STRING DB pathway analysis of the 69 MCD discovered genes and six novel genes (a total of 75 genes) from recent publications identify MTOR/MAP kinase pathway (pink, Cluster 1), Calcium dynamics (green, Cluster 2), Synapse (purple, Cluster 3), Gene expression (blue, Cluster 4). Edge thickness: STRING confidence score. Node size and color: square root transformed (sqrt-t) number of patients carrying a given mutation and average VAF across all patients, respectively. Non-clustered orphan genes were listed at right. Red border: variant reported in COSMIC DB. (b) Gene Ontology (GO) analysis results confirm the functions of compositions in each network. Top GO terms or KEGG pathways based on strength. Strength calculated by STRING.
Functional validation of selected genes in mouse brain
To investigate the roles of novel MCD genes and modules, we first revisited previous publications characterizing our novel MCD genes in the context of cortical development. In the ‘gene expression’ group in Fig. 2, NIPBL32, ZNF33533, and ZNF42334 were already reported as key regulators of neuronal migration during murine cortical development, but not in somatic mosaicism or MCD contexts. To expand functional validation, we selected two potential canonical mTOR pathway mutations (RRAGA p.H226R, KLHL22 p.R38Q), and two genes not known as mTOR interactors (GRIN2C p.T529M, RHOA p.P75S), discovered in FCD-7967, 3560, 5157, and 3876 respectively. RRAGA encodes Ras-related GTP binding A (RAGA), a GTPase sensing amino acid and activating mTOR signaling. The mosaic p.H226R mutation occurs within the C-terminal ‘roadblock’ domain (CRD), which binds to the RAGB protein and is conserved throughout vertebrate evolution (Extended Data Fig. 2c) and thus could change binding affinity35. KLHL22 encodes a CUL3 adaptor, determining E3 ubiquitin ligase specificity, and mediating degradation of DEPDC5, required for mTORC1 activation36. The KLHL22 p.R38Q variant in FCD-3560 is near the BTB (Broad-Complex, Tramtrack, and Bric-à-brac) domain that interacts with CUL3 (Extended Data Fig. 2d), suggesting the variant could enhance mTORC1 activity. GRIN2C encodes a subunit of the NMDA receptor regulating synaptic plasticity, memory, and cognition37,38, the dysfunction of which is implicated in neurocognitive diseases 39,40. GRIN2C p.T529M mutation is located in the S1 glutamate ligand-binding domain (S1 LBD) (Extended Data Fig. 2e). GRIN2A p.T531M mutation, an analog mutation of GRIN2C p.T529M in our cohort, was previously reported in epilepsy-aphasia spectrum disorders, where it increased NMDA receptors ‘open-state’ probability40. This suggests that the p.T529M mutation activates the channel, likely in an mTOR-independent fashion. RHOA encodes RHOA protein, a small GTPase, regulating cytoskeletal dynamics, cell migration, and cell cycle. RHOA p.P75S mutation is located in the interdomain region between the second GTP/GDP binding domain and Rho insert domain (Extended Data Fig. 2f). This mutation is implicated in skin cancer multiple times in the Catalogue Of Somatic Mutations In Cancer (COSMIC) database (DB)41. Thus, all mutations assessed here are likely gain-of-function and exert functional impact on cells in which they are expressed.
To test this hypothesis, we introduced episomal expression vectors carrying mutant or wildtype (WT) genes co-expressing enhanced green fluorescent protein (EGFP) into the dorsal subventricular zone via electroporation at mouse embryonic day 14 (E14), then harvested tissue at either E18 to assess migration, or at postnatal day 21 (P21) to assess cell size and phospho-S6 as a reporter of mTOR activity42 (Fig. 3a). In E18 cortices, we found EGFP-positive cells expressing mutant but not WT forms of RRAGA and KLHL22 showed significant migration defects of varying severity, whereas mutant GRIN2C showed no defect (Fig. 3b). These migration defects in RRAGA and KLHL22 mutant cells replicate major findings of MCD disrupted cortical architecture. Notably, RHOA WT and mutant cells both showed significantly disrupted neuronal migration and atypical cell clusters near the subventricular zone (SVZ) (Extended Data Fig. 6a), likely due to the high level of expression. Nevertheless, some low GFP-expressing cells, likely containing a small number of plasmid copies, showed evidence of migration, whereas mutant cells, irrespective of the level of GFP, showed disrupted migration. This indicates the RHOA mutation can contribute to the malformation of cortical development.
Figure 3. Selected novel MCD somatic variants show functional defects in embryonic mouse brain and patient samples.
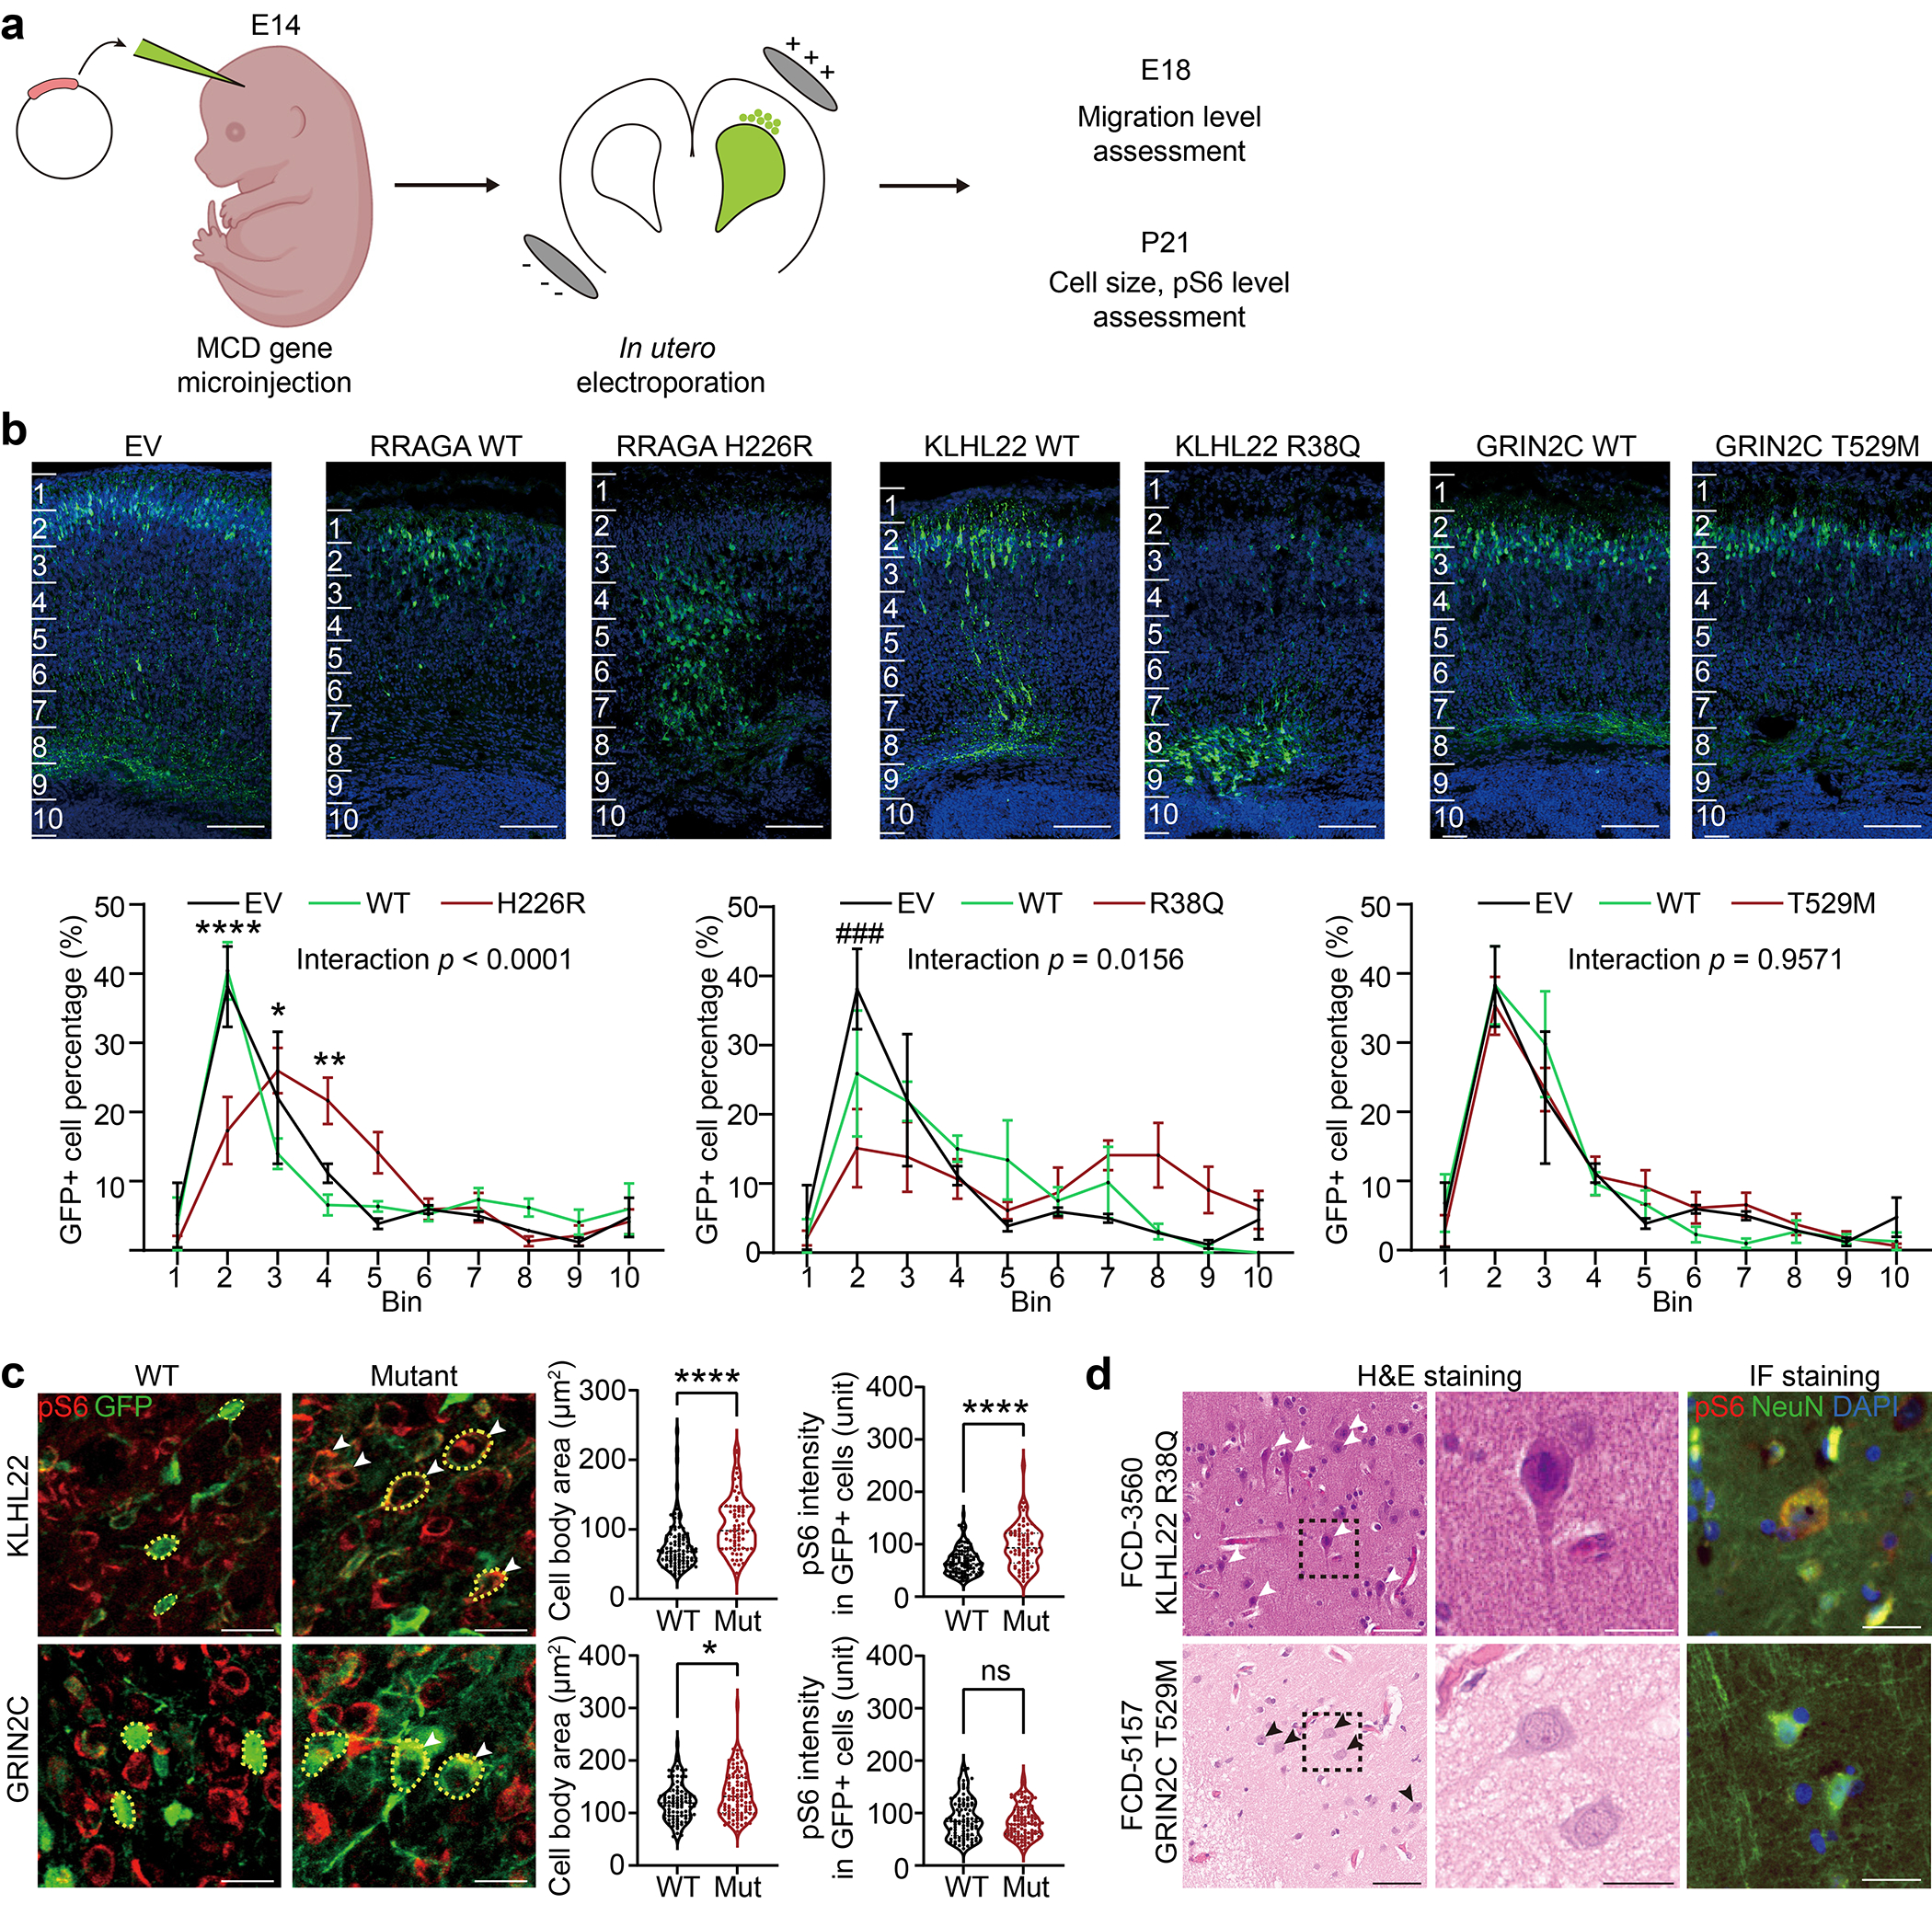
(a) Validation of candidate mosaic variants in mice. (b) Two different mutations in novel FCD type II genes, RRAGA H226R and KLHL22 R38Q, but not a novel FCD type I gene, GRIN2C, disrupt cellular radial migration from the subventricular zone (SVZ). Below: two-way ANOVA and Sidak multiple comparisons with p-values of interaction between genotype and bin factor. * or # indicates a p-value in comparison between WT and mutant group, or EV and mutant group respectively. Ten bins from the surface of the cortex (top) to SVZ (bottom). Scale bar: 100 μm. Mean ± SEM (standard error mean). n=3, 3, 6, 3, 6, 4, 3 biologically independent animals for EV, RRAGA WT, RRAGA H226R, KLHL22 WT, KLHL22 R38Q, GRIN2C WT, and GRIN2C T529M, respectively. (c) Immunofluorescence in postnatal day 21 mouse cortices for KLHL22 and GRIN2C wild-type (WT) or mutant isoform. Neurons expressing mutant KLHL22 and GRIN2C recapitulate histological phenotypes shown in (d), with enlarged cell bodies (white arrow) compared to WT isoforms (WT control), whereas only neurons expressing KLHL22 but not GRIN2C mutant isoform display increased pS6 levels compared to control. Yellow dashed lines: examples of cell body size quantification. Two-tailed Mann-Whitney U-test. Dashed lines and dotted lines in the violin plots indicate median and quartiles, respectively. Scale bar: 20 μm. n=105 cells (3 mice), 70(3), 95(3), 107(3) for KLHL22 WT, KLHL22 R38Q, GRIN2C WT, and GRIN2C T529M, respectively. (d) H&E and phospho-S6 (pS6) staining of the resected brain from FCD-3560 and FCD-5157. One representative H&E or IF staining is shown for each patient case. The box area is zoomed in the middle image. Arrows: dysplastic cells. Right: Immunofluorescence (IF) for pS6 and NeuN. Note that dysplastic pS6-positive neurons with increased pS6 levels are present in FCD-3560 but not in FCD-5157. Scale bar: 60 μm on the left, 20 μm on the middle and right. ****p < 0.0001; *p < 0.05; ns, non-significant. ###p < 0.001. EV: empty vector.
We next assessed cellular phenotype at P21 with samples available in both mice and the corresponding patients and found enlarged cell body area in mutant forms of KLHL22 and GRIN2C compared with wildtype. In contrast, elevated levels of pS6 staining, described previously in association with mTOR pathway mutations6, was found only in mutant KLHL22, but not in mutant GRIN2C mice (Fig. 3c). Interestingly, the RRAGA mutant cells showed increased pS6 level but not enlarged cell bodies compared to wildtype. Since this case (FCD-7967, type 2B) has additional MTOR mutation, the increase in cell body size of dysplastic cells is likely to be induced by MTOR but not RRAGA mutation (Extended Data Fig. 6b).
To assess correlation with human samples, we assessed available archived neuropathological tissue sections for histology and pS6 activity. Similar to our mouse models, we found patient FCD-3560 carrying KLHL22 p.R38Q showed enlarged neurons that co-stained for excess pS6, whereas FCD-5157 carrying GRIN2C p.T529M showed only a slight increase in cell body size and no evidence of excessive pS6 (Fig. 3d). While this analysis does not take into account the genotype of individual cells, it suggests KLHL22 but not GRIN2C mutations impact mTOR signaling.
Genotype-phenotype correlations in MCD patients
To assess the phenotypic contributions of the MCD genes we found, we focused on 76 of our ‘genetically solved’ MCD cases, comparing detailed neuropathology, brain imaging, and clinical course. We performed Pearson correlation followed by hierarchical clustering based upon ILAE neuropathological diagnosis, compared with GO term-based curated genesets (Fig. 4 Supplementary Table 3c) or with sSNVs in COSMIC DB because a subset of MCDs shows cell over-proliferation, similar to cancer, in the lesion during cortical development. (Methods, Supplementary Table 4). We found that FCD Type IIA and Type IIB, and HME were more tightly clustered than FCD Type I or III (Fig. 4a), likely reflecting shared neuropathological features that include large dysplastic neurons. As expected, FCD Type IIA, Type IIB, and HME were positively associated with the mTOR pathway GO term and the presence of oncogenic variants, FCD Type III, however, was associated with the MAPK pathway, consistent with recent publications implicating BRAF, FGFR2, NOD2, and MAPK9 in their etiology43–45. FCD Type I showed strong positive correlations for glycosylation, consistent with recent findings of somatic mutations in SLC35A2 and CANT146,47.
Figure 4. Clinical phenotypic outcomes correlate with genotype-based classifications in MCD.
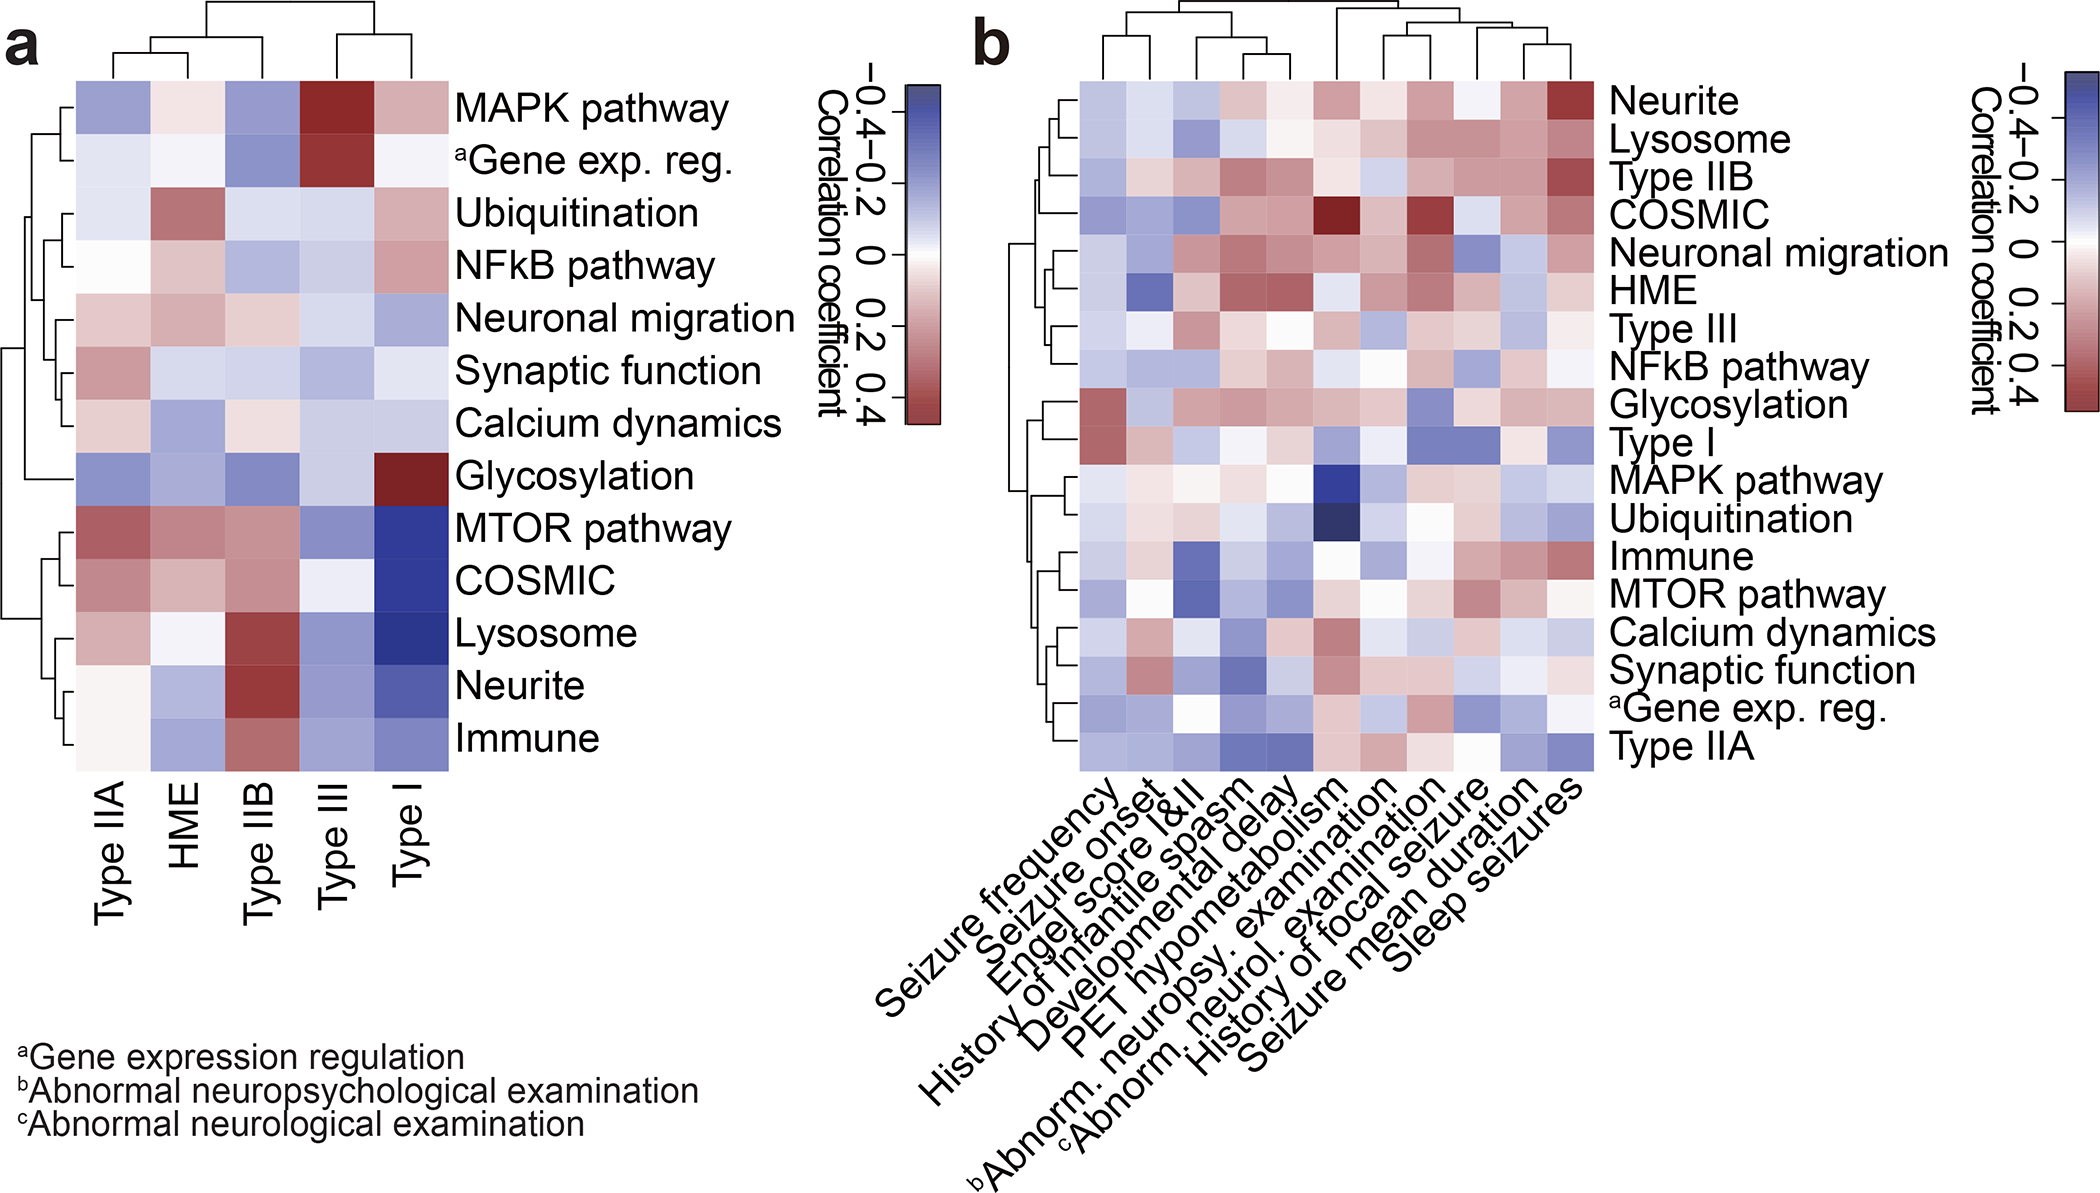
(a) Correlation heatmap for classification based on genetic information (y-axis) vs. International League Against Epilepsy (ILAE) classification based on histology (x-axis) using Pearson correlation. Shade: the value of the Phi coefficient. Note that Type IIA and HME are enriched with mTOR and Ubiquitination genes, while Type I is enriched in Glycosylation and depleted in MTOR and COSMIC genes. HME: hemimegalencephaly. (b) Correlation between classification based on genetic information and various clinical phenotypes. Shade: the value of Phi (binary data) or Pearson (continuous) correlation coefficient. For example, positron emission tomography (PET) hypometabolism is enriched in COSMIC genes and depleted in the MAPK pathway, whereas abnormal neurological examination is enriched in COSMIC genes. Raw data are in Supplementary Table 4.
We next investigated correlations between clinical phenotypes extracted from detailed medical records including seizure type, neuropsychological examination, and positron emission tomography (PET) metabolism, often used to help localize seizure focus48,49. Seizure frequency, early age of onset, Engel score, and history of infantile spasms drove clinical clustering, likely reflecting shared clinical features in the most challenging patients. Focusing on the correlations, PET hypometabolism around the resected region, correlated positively with COSMIC DB entry, and negatively with MAPK and ubiquitination (Fig. 4b), suggesting divergent metabolic mechanisms. Abnormal neurological examination correlated positively with COSMIC DB entry and negatively with Type I histology, which may reflect the effects of mutations on baseline neurological function.
MCD genes enriched in the excitatory neuronal lineage
To infer the cell type in which MCD genes function, we mapped the net expression of the MCD genes (i.e. eigengene) onto a published single-cell transcriptome dataset from the 2nd-trimester human telencephalon, at a time when mutations probably arose50 (Fig. 5a,b). This showed a strong positive correlation of the net expression levels of the MCD geneset with dividing radial glial cells (Pearson r = 0.3655, p = 7.915×10−121) and a moderate correlation in dividing intermediate progenitor cells (IPCs; Pearson r = 0.1527, p = 2.448×10⁻²¹) and mature excitatory neuron cells (Pearson r = 0.1780, p = 1.557×10⁻²⁸). We found a lack of positive correlation with inhibitory neuronal lineages including medial and central ganglionic eminences (MGE, CGE) and mature interneuron clusters (Fig. 5c). We next performed deconvolution of the MCD geneset into four module eigengenes, utilizing weighted co-expression network analysis (WGCNA), which identified cell types classified as mature excitatory neurons (turquoise and blue), microglia (brown), and unassigned (grey) (Fig. 5d). Quantification supported enrichment in dividing radial glia, excitatory neurons, and microglia, the latter likely driven by MCD candidate genes IRF8 and VSIG4 (Fig. 5e). Taken together, the expression of MCD genes is more enriched in dorsal cortex neurogenic pools and implicated in the maturation of excitatory rather than inhibitory neurogenic pools, as well as microglia.
Figure 5. Single-nucleus transcriptomes reveal MCD gene enrichment in radial glia and excitatory neurons in the developing human cortex.
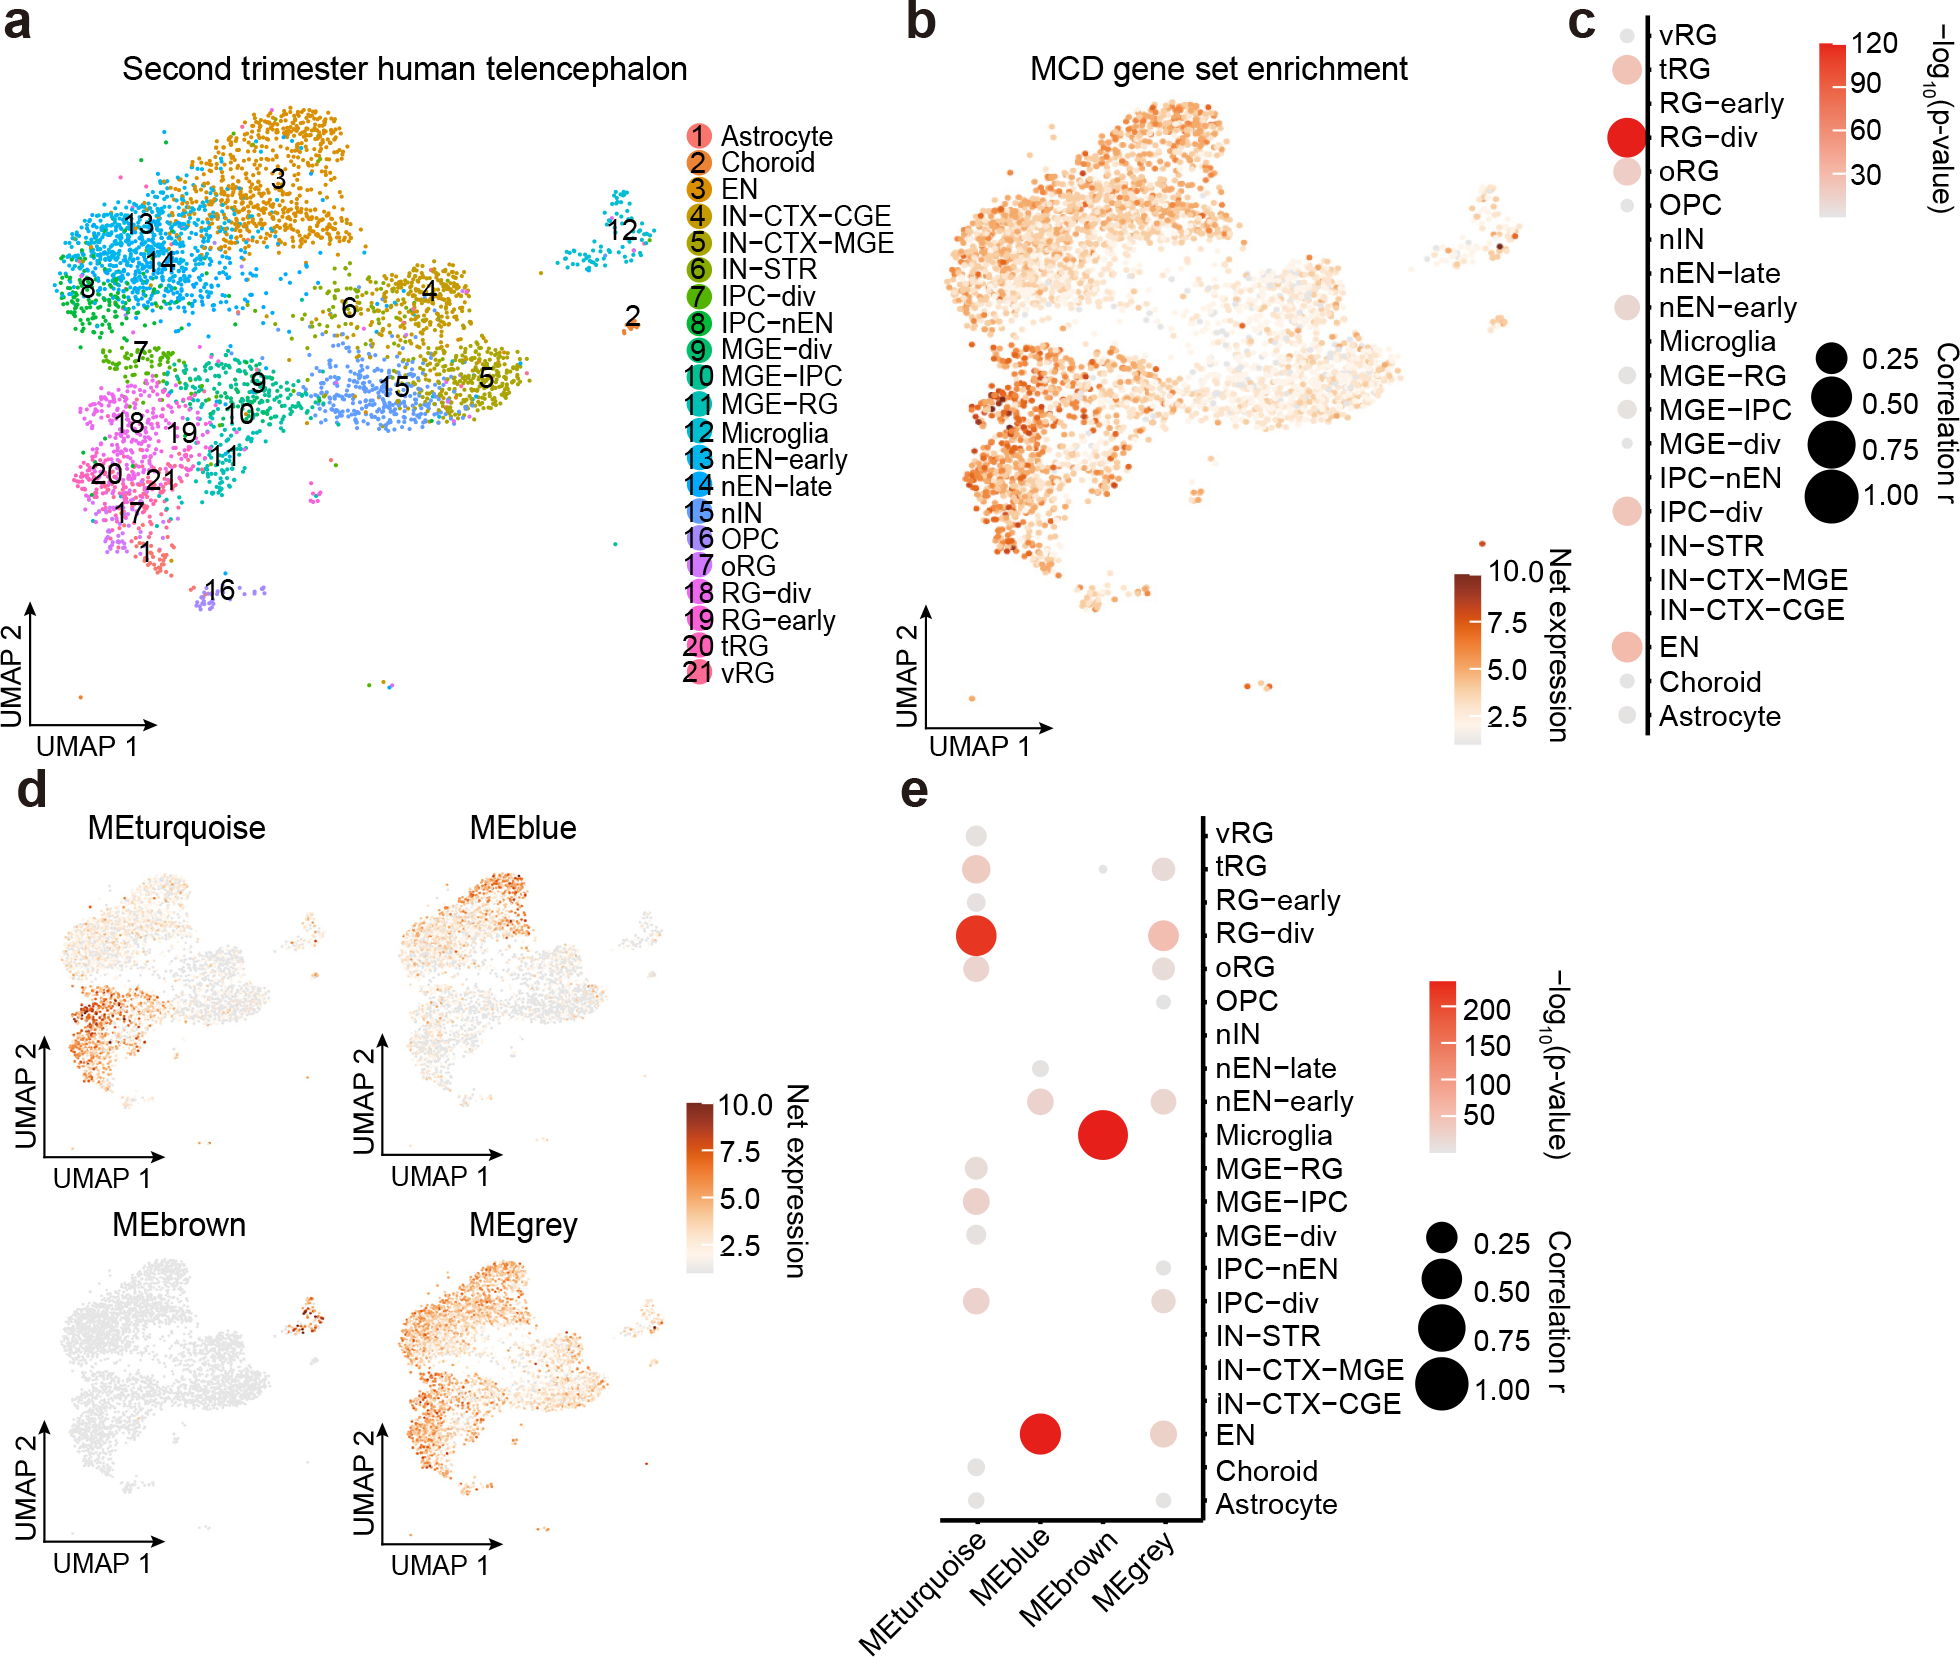
(a) Uniform Manifold Approximation and Projection (UMAP) for single-nucleus transcriptome in 2nd-trimester fetal human telencephalon from a public dataset50. (b) UMAP enrichment patterns of an eigengene using MCD genes. Note enrichment for excitatory neurons and radial glia (dark brown). vRG: vertical radial glia, tRG: truncated radial glia, RG-div: dividing radial glia, oRG: outer radial glia, EN: excitatory neuron, nEN: newborn excitatory neuron, IPC: intermediate progenitor cell, STR: striatum, IN: interneuron, CTX: cortex, MGE: medial ganglionic eminence, CGE: central ganglionic eminence. (c) Quantification of enrichment of (b) based on cell types, showing enrichment for RG-div. (d) Four eigengenes decomposed from (b). (e) Quantification of enrichment of (d) based on cell types showing enrichment in dividing radial glia, microglia, and inhibitory cortical neurons from the medial ganglionic eminence (MGE). Net expression: Relative and scaled net expression level of a given eigengene generated by a defined gene list. The size and color of the dot plots in (c) and (e) indicate Pearson correlation coefficient r and corresponding non-adjusted asymptotic p-value derived from a two-sided Student’s t-test, respectively.
MCD gene expression is enriched in dysplastic cells
We next performed single-nucleus RNA sequencing (snRNAseq) analysis in resected MCD brain tissue. We reasoned that single-nucleus transcriptomes would be more revealing than bulk transcriptomes, but the average VAF of ~6% in our MCD cohort meant that the vast majority of sequenced cells would be genetically wild-type. We thus decided to focus snRNAseq on resected cortex from patients with shared pathological MCD hallmarks across a range of VAFs. We selected five resected brain samples, one from a patient with FCD (FCD-4512 SLC24A2 p.V631I, 0.6% VAF and SRCAP c.2630+1G>A, 1.64% VAF), two from patients with HME (HME-4688 PIK3CA p.E545K, 25.1% VAF and HME-6593 PIK3CA p.H1047R, 13.1% VAF), and two from patients with TSC meeting full diagnostic criteria. We also included brains from four neurotypical cases for comparison. We sequenced a total of 33,206 nuclei (see Methods).
While the FCD brain snRNAseq data showed substantial overlapping cell clusters with controls using UMAP clustering, HME and TSC brains showed distinct cell cluster distributions (Fig. 6a,b). We found that very few HME cells matched expression patterns for typical brain cells, even after standard normalization and scaling (Fig. 6b,c, see Methods). We characterized transcriptomic profiles of each cluster based upon established marker gene expression (Fig. 6d) as well as differentially expressed gene (DEG) analysis (Extended Data Fig. 7a, Supplementary Table 5a) and weighted gene coexpression network analysis (WGCNA, Extended Data Fig. 7b, Supplementary Table 5b) to assign likely cell types. We labeled these clusters according to their closest relatives: ‘Excitatory neuron-like (ExN-L)’, ‘astrocyte-like (Ast-L)’, ‘oligodendrocyte progenitor cell-like (OPC-L) or ‘oligodendrocyte-like (OD-L)’. Even with these categories, some clusters remained undefined (U) (Fig. 6a, Extended Data Fig. 7c).
Figure 6. Single-nucleus transcriptomes showed MCD gene expression enriched in MCD-specific cell types.
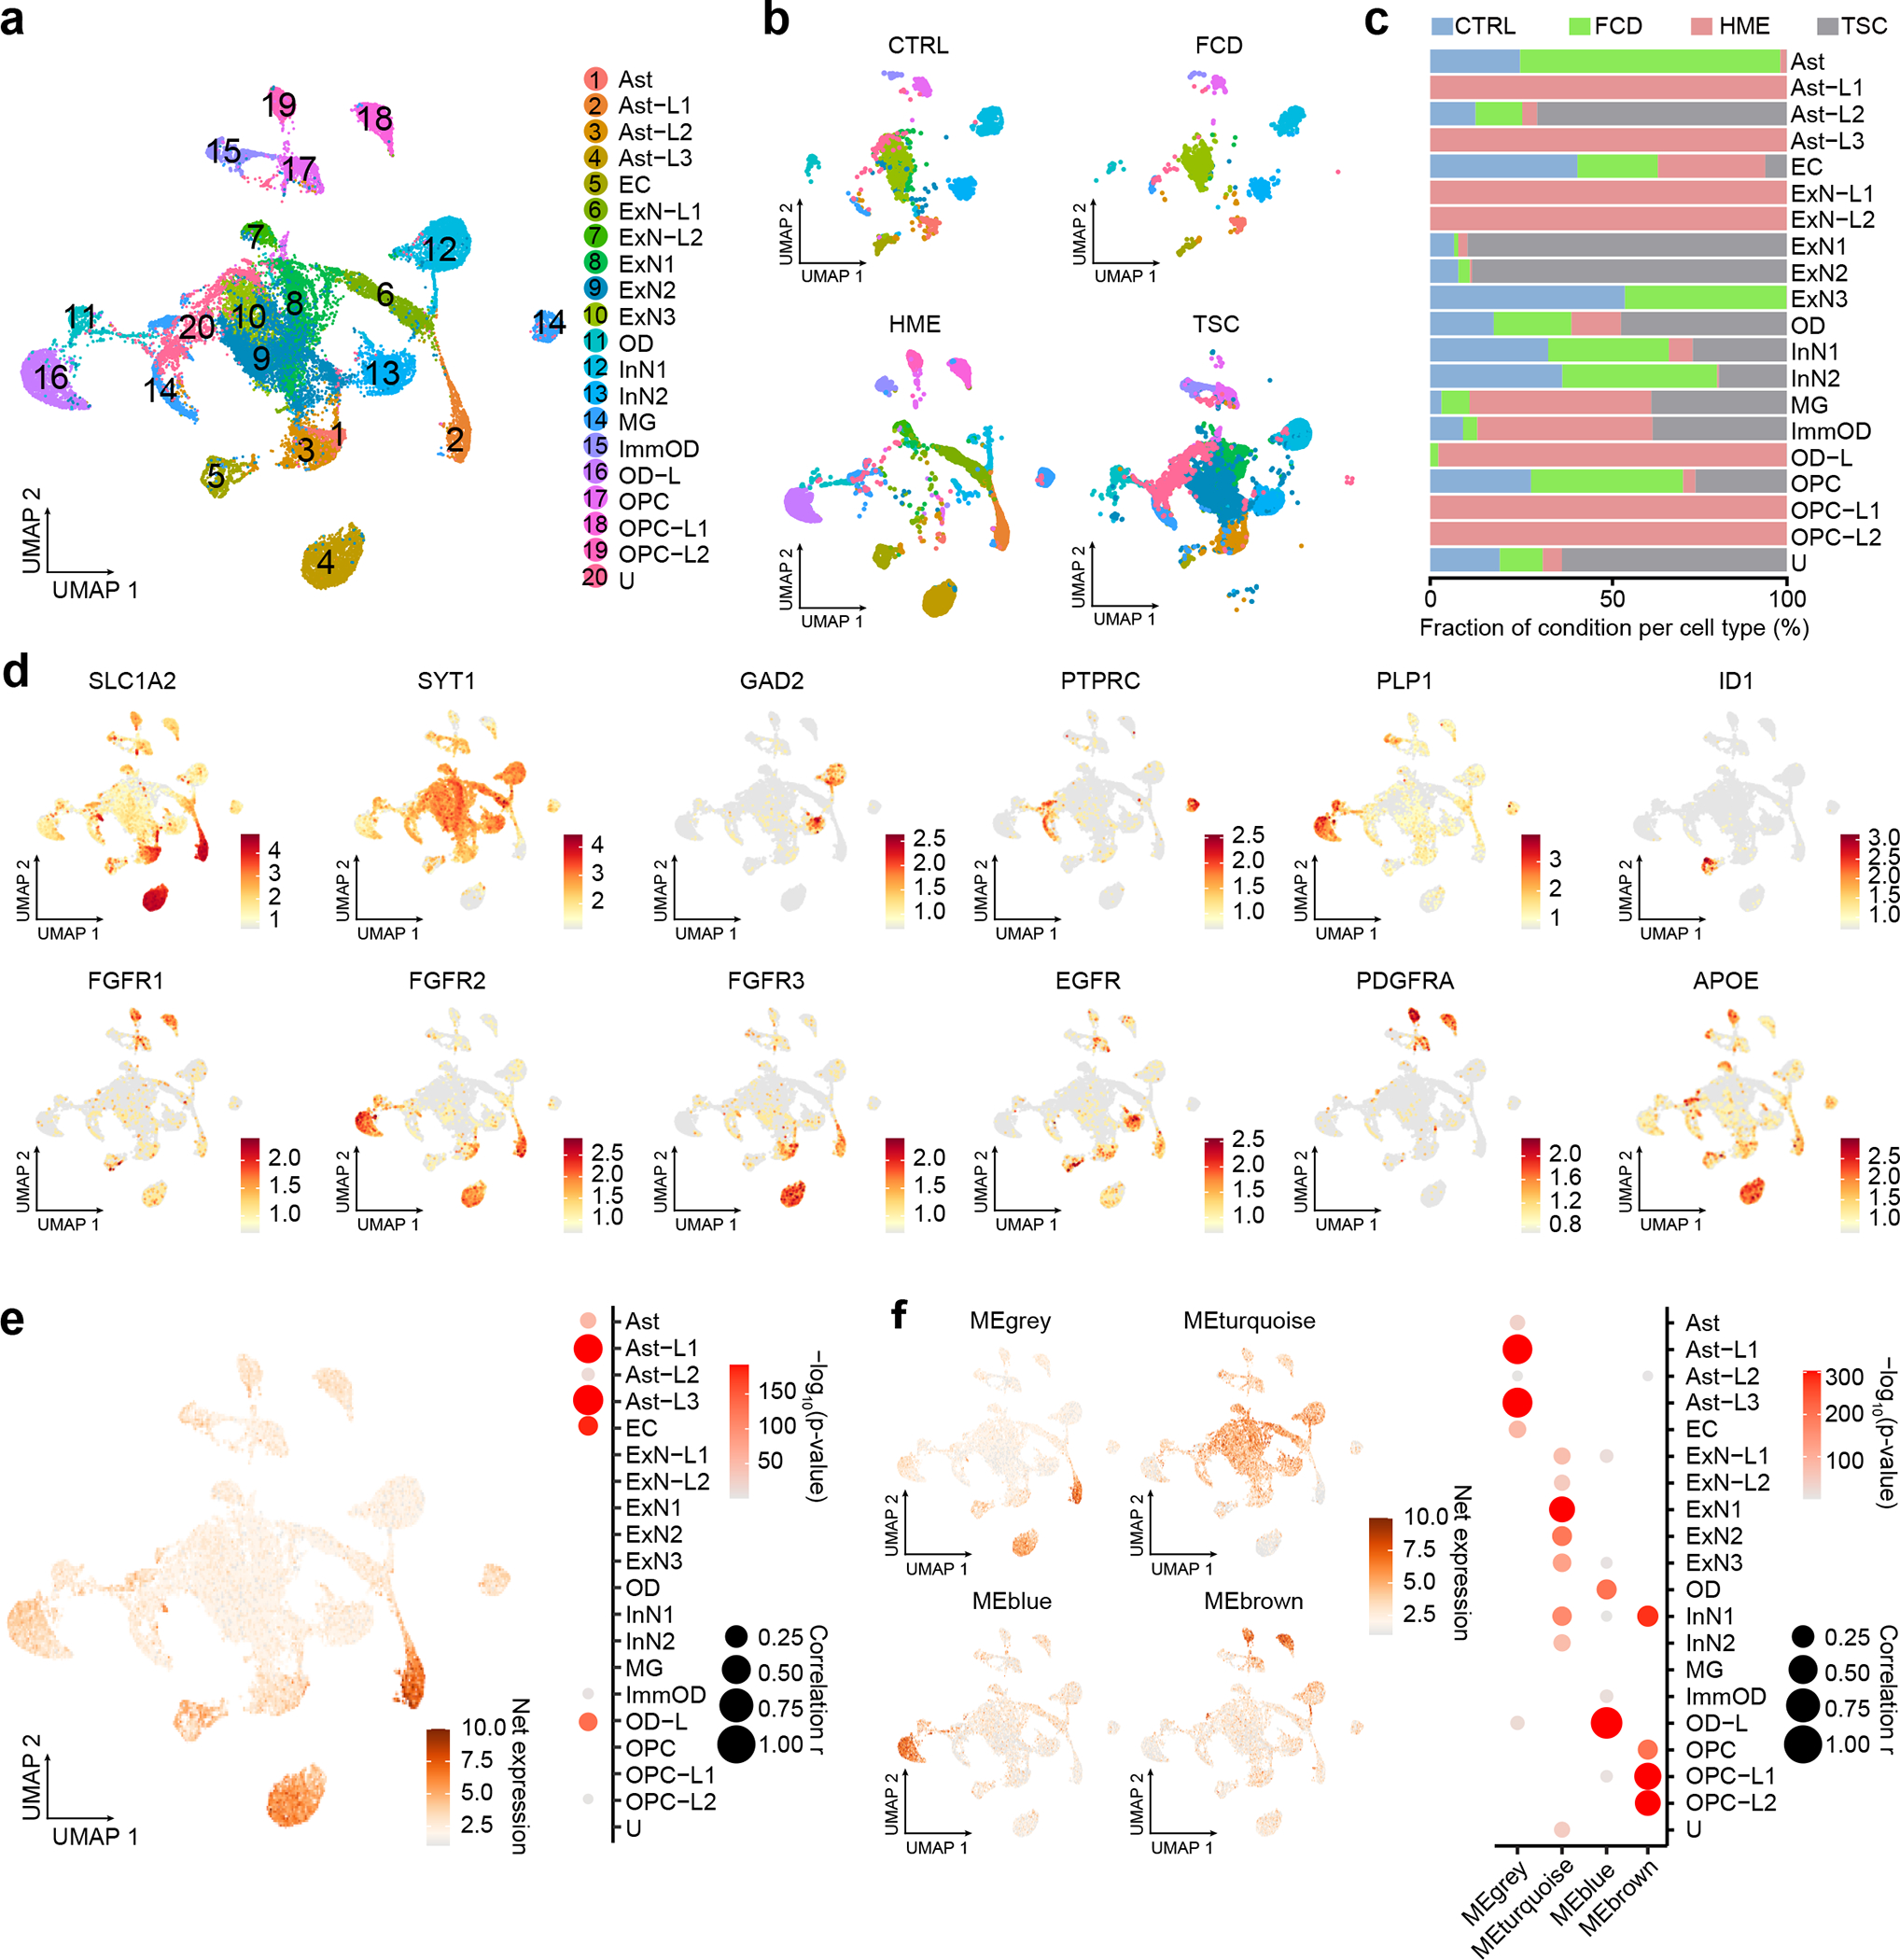
(a) UMAP for the 33,206 single-nucleus transcriptomes from cortical resections, revealing disrupted cell clusters, especially for HME and TSC brain, but only mild disruption in FCD brain. Cell type classification. Ast: astrocyte, EC: endothelial cells, ExN: excitatory neuron, ImmOD: immature oligodendrocyte, InN: inhibitory neuron, MG: microglia, OD: oligodendrocyte, OPC: Oligodendrocyte precursor cells, U: unidentified. (b) UMAP is split by disease condition. (c) The proportion of disease conditions for each cell type. (d) Expression pattern of selected marker genes in normal human cortex vs. several atypical markers related to brain cancer or Alzheimer’s disease. Color scale: Average expression level. (e) Eigengene with all 75 MCD genes and quantification of enrichment based on cell types. (f) four genes decomposed from (e) and quantification of results. Net expression: Relative and scaled net expression level of a given eigengene generated by a defined gene list. The size and color of the dot plots in (e) and (f) are Pearson correlation coefficient r and corresponding non-adjusted asymptotic p-value derived from a two-sided Student’s t-test, respectively.
We noted that several of the HME clusters showed excessive expression of growth factor receptor (GFR) gene families, specifically FGFR1 in cluster OPC-L1/2 in HME, FGFR2 in cluster Ast-L1/3 and OD-L, FGFR3 in Ast-L1/3, EGFR in Ast-L1/3 and OPC-L1/2, and PDGFRA in cluster OPC-L1/2 (Fig. 6d). To identify the cell types expressing these genes, we performed RNA in situ hybridization in HME brain sections followed by hematoxylin-eosin staining. We found co-localization of these same FGFR family, EGFR, and PDGFRA transcripts with dysplastic cells (Extended Data Fig. 8). Previous experiments indicate that it is most often the dysplastic cells within HME and MCD that carry mosaic mutations9, suggesting an effect of these mutations on growth factor receptor expressions that correlates with dysplasia.
Next, we investigated the net expression patterns of genes mutated in MCD within this snRNAseq dataset. The net expression of the MCD geneset was enriched in Ast-L1/3 and OD-L, which were labeled as dysplastic cells (Fig. 6e). Interestingly, the individual mutated genes displayed converging expression patterns resulting in four different eigengenes (Fig. 6f, grey, turquoise, blue and brown), with gene members for each eigengene (Extended Data Fig. 9). These show distinct enrichment patterns across cell types, implying that members of each eigengene may be associated with the pathophysiology of the corresponding dysplastic cell type in HMEs.
We next performed a pseudo-bulk DEG analysis by aggregating all cell types within the same disease condition, comparing HME, TSC, and FCD with CTRL (Extended Data Fig. 10a, Supplementary Table 5c). and detected 1735, 1017, and 981 differentially expressed genes in HME, TSC, and FCD, respectively. Intriguingly, 21.33% (16/75) or 13.33% (10/75) of MCD mutated genes in our list overlapped with DEGs of HME or TSC, but less overlapped with FCD (7/75, 9.33%) likely due to low VAF. Permutation tests suggest that the overlaps in HME and TSC are unlikely to have arisen by chance (see Methods). This suggests that many MCD-mutated genes are misregulated in MCD-specific cell types.
Next, we performed cell-type specific DEG analysis comparing disease with CTRL group to investigate pathophysiology within Ast, ExN, OPC, and OD lineages determined by single-cell analysis (Extended Data Fig. 10b, Supplementary Table 5c). Interestingly, in the HME brain, the Ast lineage, which has the largest upregulated DEGs across cell types, showed increased expression of genes related to lipid biosynthesis or energy metabolism and postsynaptic membrane. These same genes were also enriched in mutated mTOR-expressing sorted cell populations in a rodent FCD model51. In the TSC Ast lineage, the genes related to calcium dynamics and synaptic function were strongly upregulated compared to CTRL Ast, which was also found in the ExN lineage (Supplementary Table 5d). In FCD ExN lineage compared to CTRL ExNs, terms relevant to mTOR downstream pathways (ribosome complex-related terms), calcium dynamics (calcium channel complex), and synapse (postsynapse-related terms) were enriched. Moreover, at the individual gene level, many histone remodeling enzymes or transcription factors participating in gene expression regulation were encountered within the DEGs of FCD ExN (Supplementary Table 5c), consistent with the four enriched terms in Fig. 2. Taken together, the predicted pathways and functions in MCD based on the gene ontology of 75 MCD genes are altered in Ast or ExN lineage in MCD, suggesting underlying pathogenic mechanisms of MCDs.
Discussion
Our multi-omics study of the genetic landscape of MCD confirmed the important role of mTOR/MAP kinase and glycosylation pathways, seen in about 60.5% of those with mutations. Moreover, our results also suggest a role for biological processes including gene expression, synaptic function, and calcium dynamics, which made up the other 39.5% of those with mutations. While these pathways may be independent in mediating MCD pathophysiology, it is possible that they may have some crosstalk 52–54.
Only 76 of 283 patients showed one or more putative somatic mutations as a likely cause of MCD. There could be numerous causes for the relatively low solve rate in MCD, including the potential to miss very low VAF (<0.5%) mutations and the contribution of complex mutations that could be missed by our pipeline. Finally, although patients with environmental causes, syndromic, or inherited causes were excluded from our cohort, these factors could still contribute to MCD.
With our approach, we identified two recurrently-mutated genes not previously implicated in MCD and validated 3 other genes found mutated in single patients from prior studies. Confirming the remaining candidate and identifying further MCD candidate genes will require larger MCD cohorts. Including novel MCD candidate genes emerging from 300X WES into the 1000X Phase 3 AmpliSeq allowed both confirmation of mutations, a more accurate estimate of VAF, and identification of additional patients with these genes mutated that would have been perhaps missed with 300X WES. In vivo functional validation by modeling mutations in developing mouse brains suggests many identified genes likely contribute to disease. Like with de novo germline mutations discovered in autism, we suggest that there could be dozens if not hundreds of additional MCD genes, based on the low number of recurrently mutated genes 55.
The four gene networks, mTOR/MAP kinase, calcium dynamics, synapse, and gene expression, play important roles both during neurogenesis and neuronal migration, as well as in establishing neuronal excitability. For instance, calcium dynamics regulates cytoskeletal activity and excitability56,57. Genotypic information also showed correlations with phenotype, for instance, PET brain hypometabolism and abnormality in the neurological examination correlated with the presence of a likely oncogenic variant within COSMIC DB.
We also characterized the expression patterns of MCD mutated genes in neurotypical and MCD brains at single-cell resolution. The cell types most strongly expressing mutated genes include dorsal forebrain radial glial progenitors and their daughter excitatory neurons, consistent with the likely site of origin of somatic brain mutations58. The fact that mutated genes also showed the strongest enrichment with these same clusters suggests that mutated genes can drive gene expression in convergent pathways. The prior studies indicating that MCD dysplastic cells express markers for both glia and neurons59 are consistent with our findings, with mutations driving critical roles predominantly in dividing radial glia, with profound effects on lineage and cellular dysplasia. The MCD genes in patient brains found in our study demonstrated critical roles during cortical development, significantly correlating with patient phenotypes. These findings could lead to new molecular classifications and diagnostic strategies for MCD, and ultimately to personalized therapies for epilepsy.
Methods
The study protocol was approved by the UC San Diego IRB (#140028). Informed consent was obtained from all participants or their legal guardians at the time of enrollment. All work with mice was performed in accordance with UCSD IACUC protocol S15113.
Overview of the FCD cohort
This study is a multi-center international collaboration. We recruited a cohort of 283 individuals from the ‘FCD Neurogenetics Consortium’ (see the member list). These individuals were diagnosed with FCD type I, II, III, HME, or TSC and underwent surgical resection to treat drug-resistant epilepsy between 2013 and 2021. Any cases that underwent surgical resection due to environmental factors, for example, stroke, or acute trauma, were excluded. For each individual, resected brain tissue was collected, along with paired blood or saliva samples and parental samples, where available. Clinical history, pre- and post-operative brain imaging, histopathology, ILAE classification according to the surgical tissue pathology report, and Engel surgical outcome score (at least two years after surgery) were collected, when available.
DNA extraction
Pulverized cortical samples (~0.3 g) were homogenized with a Pellet Pestle Motor (Kimble, #749540–0000) or Handheld Homogenizer Motor (Fisherbrand, #150) depending on the size of the tissue, and resuspended with 450 μL RLT buffer (Qiagen, #40724) in a 1.5 ml microcentrifuge tube (USA Scientific, #1615–5500). Homogenates were then vortexed for 1 minute and incubated at 70°C for 30 minutes. 50 μl Bond-Breaker TCEP solution (Thermo Scientific, #77720) and 120 mg stainless steel beads with 0.2 mm diameter (Next Advance, #SSB02) were added, and cellular disruption was performed for 5 minutes on a DisruptorGenie (Scientific industries). The supernatant was transferred to a DNA Mini Column from an AllPrep DNA/RNA Mini Kit (Qiagen, #80204) and centrifuged at 8500 xg for 30 seconds. The column was then washed with Buffer AW1 (kit-supplied), centrifuged at 8500 xg for 30 seconds and washed again with Buffer AW2 (kit-supplied), and then centrifuged at full speed for 2 minutes. The DNA was eluted two times with 50 μl of pre-heated (70°C) EB (kit-supplied) through centrifugation at 8,500 xg for 1 minute.
AmpliSeq and WES sequencing for somatic mutation candidates
AmpliSeq and whole-exome sequencing (WES) were used at different phases to perform the genetic screening within available samples from the cohort. Customized AmpliSeq DNA panels for Illumina (Illumina, #20020495) were used for Massive Parallel Amplicon Sequencing21. 87 or 82 genes related to the mTOR pathway or curated based on the results of Phase 1 and 2, respectively, were subjected to the AmpliSeq design system; a list of designed genes is provided in Supplementary Table 2a–c. Two pools were designed for tiling the capture region. Genomic DNA from extracted tissue was diluted to 5 ng/uL in low TE provided in AmpliSeq Library PLUS (384 Reactions) kit (Illumina, #20019103). AmpliSeq was carried out following the manufacturer's protocol (document #1000000036408v07). For amplification, 14 cycles each with 8 minutes were used. After amplification and FUPA treatment, libraries were barcoded with AmpliSeq CD Indexes (Illumina, #20031676) and pooled with similar molecular numbers based on measurements made with a Qubit dsDNA High Sensitivity kit (Thermo Fisher Scientific, #Q32854) and a plate reader (Eppendorf, PlateReader AF2200). The pooled libraries were subjected to Illumina NovaSeq 6000 platform for PE150 sequencing. The AmpliSeq design in ‘Phase 1’ is under design ID IAA7610, and the AmpliSeq design in ‘Phase 3’ is under design ID IAA26010.
Genomic DNA (~ 1.0 μg) was prepared for whole-exome sequencing, and libraries were captured using the Agilent SureSelect XT Human All Exon v.5 or Nextera DNA Exome kits. Then, 100, 125, or 150 bp paired-end reads (median insert size ~ 210 bp) were generated using the Illumina HiSeq X 2500 platform. The sequencing experiments were designed to yield three datasets of ~ 100X coverage on each sample, with a coverage goal of 300X from the brain and 100X from blood/saliva.
Somatic variant calling from AmpliSeq and WES
Reads were aligned to GRCh37 using BWA (version 3.7.16a), sorted per each read group with SAMtools (version 1.7 for WES, version 1.9 for AmpliSeq), and merged into a single BAM file with Sambamba (version 0.6.7). The merged BAM files were marked for duplicate reads using Picard (v2.12.1 for WES, v2.18.27 for AmpliSeq), duplicated reads were not removed for AmpliSeq because of the nature of the method. Then, we performed indel realignment and base quality recalibration using GATK (v3.7.0), resulting in the final uniformed processed BAM files.
Both tissue-specific and tissue-shared mosaic variants were called from the AmpliSeq and WES sequencing data. AmpliSeq and WES variants were called according to the availability of the control tissue. Brain- and blood/saliva-specific variants were called using MuTect2 (GATK v3.8.1 for WES, v4.0.4 for AmpliSeq) paired mode and Strelka2 (v2.9.2) somatic mode60; the BAM files from the brain sample (combined and non-combined from independent sequencing libraries) and blood/saliva samples were treated as “tumor-normal” and “normal-tumor” pairs separately and cross-compared between each other. Variants called by both callers were listed. Mosaic variants shared between the brain and blood/saliva samples were called using the single mode of MosaicHunter15 by either combining all brain replicates or calling each separate sample. Variants that passed all the MosaicHunter filters also were listed. Somatic variants from WES data were further called by GATK (v3.7.0) haplotypecaller with ploidy parameter set to 50, followed by a series of heuristic filters described as the best-practice by the Brain somatic mosaicism network16, tissue-shared variants were called by the combination of MuTect261 (GATK v3.8.1) single-mode and DeepMosaic14.
A union of different pipelines was selected to get maximum sensitivity. Mosaic candidates from the combined lists were refined using the following criteria: (i) the variant had more than 3 reads for the alternative allele; (ii) the variant was not present in UCSC repeat masker or segmental duplications; (iii) the variant was at least 2 bp away from a homopolymeric tract; and (iv) the variant exhibited a gnomAD allele frequency lower than 0.001. Variants that exist in the 1000 genome project (phase 3) also were excluded from the analysis. Variants from both exome data sources were tested and a combination of tissue-specific mosaic variants and tissue-shared mosaic variants were collected and the credible interval of VAFs was calculated using a Bayesian-based method described previously62. To filter for candidate MCD disease-causing variants, we further filtered out synonymous variants in coding regions, variants with CADD Phred score < 25, and candidates that fell out of coding regions and were not predicted to affect splicing, annotated by ANNOVAR and BEDtools (version 2.27.1), the annotation scripts were provided on GitHub (https://github.com/shishenyxx/MCD_mosaic).
False discovery estimation
To calculate the false discovery of random variants detected in normal samples, we incorporated 75 normal control samples (71 brains and 4 other organs) previously sequenced with 250–300X WGS, which should provide similar sensitivity as our exomes, the deep WGS were generated by efforts from the NIMH Brain Somatic Mosaicism Consortium16, from controls21, and from our recent mutation detection pipeline24. Variants were filtered based on the identical criteria as described in the above data analysis part, with >0.005 VAF, all on exonic regions defined by NCBI, and CADD score >25. While 13 variants remain positive from this pipeline from the 75 samples (0.17 per control), 306 candidate variants were determined in our 134 MCD exomes (2.28 per MCD case), which lead to an estimated 7.59% per sample false discovery rate (Supplementary Table 6).
False negative rate estimation for phase 2 relative to phase 1
Only FCD type II cases fulfilling the clinical criteria were considered for this calculation to control the comparison conditions between phase I and phase II. Of the 67 type II patients who underwent Phase 1 AmpliSeq with the 87 mTOR genes, 9 cases were positively validated with mTOR mutations (9/67, 13.43%). Of the 17 novel type IIA/B patients in WES that did not undergo Phase 1 AmpliSeq, 2 were detected with positively validate mTOR mutations on the 87 genes (2/17, 11.76%). Thus, we conclude that our false-negative rate for Phase 2 WES relative to the Phase 1 AmpliSeq is 13.43% - 11.76% = 1.67%.
Estimation of probability of observing recurrency in mutated genes in MCD
Based on the previously established estimation63,64, we simulated the number of detected sSNVs and their recurrence. In phases 2 and 3 of our genetic discovery, we positively validated 67 and 26 sSNVs from 134 and 126 brains, respectively. Assuming the same mosaic mutation rate and cohort size, we would be expecting the same number (67 + 26) of positively detected sSNVs. We permuted 10,000 times for 67 deleterious sSNVs from the 19909 human coding genes, plus 26 deleterious sSNVs from the 59 genes in phase 3, and estimated the distribution of the same gene being hit more than once. After correcting for gene length (average length of human coding genes: 66645.9, the average length of the 59 genes in phase 3: 158929.7, correlated relative to the average length65), from the permutation analysis, the probability of observing more than hits is p = 0.000127 for ATP2A1 and p = 0.000258 for PPFIA4. The probability of observing more than one hit on each of the 59 genes is provided, respectively in Supplementary Table 7.
Orthogonal validation and quantification of mosaic mutations with targeted amplicon sequencing
Targeted amplicon sequencing (TASeq) with Illumina TruSeq was performed with a coverage goal of >1000X for 554 candidate variants detected by computational pipelines described above for both AmpliSeq and WES, to experimentally validate the mosaic candidates before functional assessment. PCR products for sequencing were designed with a target length of 160–190 bp with primers being at least 60 bp away from the base of interest. Primers were designed using the command-line tool of Primer366,67 with a Python (v3.7.3) wrapper17,18 (Supplementary Table 8). PCR was performed according to standard procedures using GoTaq Colorless Master Mix (Promega, M7832) on sperm, blood, and an unrelated control. Amplicons were enzymatically cleaned with ExoI (NEB, M0293S) and SAP (NEB, M0371S) treatment. Following normalization with the Qubit HS Kit (ThermFisher Scientific, Q33231), amplification products were processed according to the manufacturer’s protocol with AMPure XP beads (Beckman Coulter, A63882) at a ratio of 1.2x. Library preparation was performed according to the manufacturer’s protocol using a Kapa Hyper Prep Kit (Kapa Biosystems, KK8501) and barcoded independently with unique dual indexes (IDT for Illumina, 20022370). The libraries were sequenced on Illumina HiSeq 4000 or NovaSeq 6000 platform with 100 bp paired-end reads. Reads from TASeq were aligned to GRCh37 with BWA (version 3.7.16a), sorted, realigned, and recalibrated with SAMtools (version 1.9), Picard (version 2.18.27), and GATK v3.8.1. Candidate variants were annotated with the same ANNOVAR and BEDtools (version 2.27.1) scripts also provided on GitHub (https://github.com/shishenyxx/MCD_mosaic) and exact binomial confidence intervals were calculated for the same variants in the target sample as well as normal controls. Variants detected from AmpliSeq and/or WES are considered to be positively validated in a given tissue by TASeq if 1) the 95% lower binomial confidence interval is higher than 0.5%; 2) the 95% higher binomial confidence interval is lower than 40%; 3) the 95% lower binomial confidence interval of the negative control is below 0.5%.
Oncoplot generation
Oncoplot in Fig. 1e was generated using maftools (v2.6.05) R library.
Mutational signature analysis
Mutational signature analysis was performed using a web-based somatic mutation analysis toolkit (Mutalisk)68. PCAWG SigProfiler full screening model was used.
STRING analysis
STRING analysis was performed by STRING v1128. A total of 75 MCD genes (69 novel and known genes from our cohort and 6 novel genes from two other recent MCD cohort studies) were loaded as input and MCL clustering was performed. The terms in Gene Ontology (GO), KEGG pathways, and the top 10 terms GO or KEGG pathways were shown in Fig. 2b. If there are less than 10 terms for those terms (such as clusters 3 and 4 in Fig. 2), we included all the terms in GO or KEGG pathways, Local network cluster (STRING), Reactome pathways, and Disease-gene associations (DISEASES) to show the enriched terms. Visualization was performed by Cytoscape v3.9.
ClueGO analysis
Visualization of the functionally grouped biological terms was performed by ClueGO v2.5 69, a Cytoscape plug-in. A total of 75 MCD genes from Fig. 2 were loaded and GO terms in the ‘Biological Process’ category were used for visualization. Terms with a p < 0.01, a minimum count of 3, and an enrichment factor > 1.5, are grouped into clusters based on membership similarities.
Animals
Pregnant Crl:CD1(ICR) mice (E14) for mouse modeling were purchased from Charles River Laboratory. All mice used were maintained under standard group housing laboratory conditions with temperatures of 18~23°C, 40~60% humidity, 12 hours of light/dark cycle, and free access to food and water. The age and number of mice used for each experiment are detailed in the figure legends. The sex of the embryos or subject mice used was not tested.
DNA constructs
RRAGA, KLHL22, and RHOA ORF regions were amplified from the hORFeome library and inserted into the pCIG2 (pCAG-IRES-GFP) vector. GRIN2C ORF region was purchased from DNASU Plasmid Repository at Arizona State University Biodesign Institute. Gibson Assembly Cloning Kit (E5510S, New England Biolabs) was used for joining point mutation-carrying gene fragments (amplified by primers below) and linearlized pCIG2 vector (digested by XhoI and XmaI). The mutation was confirmed by Sanger sequencing.
The sequence information of primers used to amplify mutation-carrying DNA fragments is in Supplementary Table 8.
In utero electroporation
In utero electroporation was performed as described70 with endotoxin-free plasmids (0.5–1 μg) plus 0.1% Fast Green (Sigma, catalog no. 7252) injected into a single lateral ventricle in E14.5 embryos then electroporated with BTX ECM830 instrument using pulses of 45 V for 50 ms with 455-ms intervals were used.
Mouse brain sectioning
The brain was fixed by submersion or perfusion with 4% paraformaldehyde (PFA) for E18.5 or P21 mice respectively, cryoprotected in 30% sucrose for 48 hrs, embedded in Tissue-Tek A, sectioned at 20 um (CryoStar NX70, Thermo Fisher Scientific), mounted onto SuperFrost Plus slides, and dried on a 50 °C heating block before staining.
Immunofluorescence staining and imaging
A section was rehydrated and washed by 1X PBS for 10 min 3 times, permeabilized in PBST (0.3% Triton X-100 in 1X PBS) for 10 min, and blocked by blocking solution (5% normal BSA in 1X PBS) for 2 hrs in room temperature. Sections were stained with diluted primary antibodies in the blocking solution overnight at 4 °C. The next day, the sections were washed with PBST for 5 min three times and stained with secondary antibodies in blocking solution for 2 hrs in RT. Blocking solution was dropped off from the slides and nuclei staining with DAPI solution (0.1ug/ml of DAPI in PBST) was performed for 15 min. The slides were mounted with DAKO fluorescent mount solution (catalog no. S3023). Zeiss 880 Airyscan Confocal is used for imaging according to the manufacturer's instructions.
Antibodies
phospho-S6 (1:800 dilution, catalog no. 5364S; Cell Signaling, AB_10694233), NeuN (1:100, MAB377X; Sigma-Aldrich, AB_2149209), GFP (1:500, catalog no. GFP-1020, Aves Labs, AB_10000240), Alexa Fluor Goat 488 chicken IgY (H+L) (1:1,000 dilution, catalog no. A-11039, AB_2534096), Alexa Fluor 594 donkey anti-rabbit lgG (H+L) (1:1,000, catalog no. R37119, AB_2556547).
Genotype-phenotype association
The functional modules to be tested were selected based on the enriched GO terms. A given known and candidate MCD gene was assigned as a member to one or multiple modules based on GO terms related to the given gene (results summarized in Supplementary Table 3c). Subsequently, a given patient became a member of one (or multiple) functional module(s) if the genes detected in that patient were assigned to that (those) functional module(s). To associate likely oncogenic sSNVs with clinical phenotypes, the cases carrying a (or multiple) sSNV(s) listed in COSMIC DB were labeled as ‘COSMIC’. All available clinical information on the patient was collected and harmonized using ILAE terms (summarized in Supplementary Table 4). Pearson correlation coefficients were calculated by cor.test() function in R. The value of correlation coefficients was displayed as colors in the heatmap of Fig. 4 using r-gplots (v3.1.1) package. If two groups with binary values were used for calculation, Phi coefficient was used.
Single-nucleus RNA sequencing
A fresh-frozen brain tissue (~50 mg) was placed into a glass dounce homogenizer containing 1 ml cold lysis buffer (0.05% (v/v) NP-40, 10 mM Tris (pH 7.4), 3 mM MgCl2, 10 mM NaCl) and dounce 10 times with a loose pestle and following 10 times with a tight pestle. The homogenate was incubated for 10 min in RT. 9 ml of wash buffer (1% BSA in 1X PBS) was added to the homogenate and filtered by a 30 um cell strainer. The strained homogenate was spun down in 500 g to remove the supernatant. The pellet was resuspended with 5 ml of wash buffer. Straining and spinning down steps were performed once more, and the pellet was resuspended into 500 ul of wash buffer. 10 ul of nuclei resuspension was mixed with counting solution (0.02% Tween 20, 0.1ug/ml DAPI, 1% BSA in 1X PBS) and nuclei density was measured by manual nuclei counting using DAPI signal. The resuspension was diluted by wash buffer to make the desired concentration (800~1000 nuclei/ul). Maximum 2 samples were pooled together targeting 10000 nuclei per reaction. Gel beads emulsion (GEM) generation, cDNA, and sequencing library constructions were performed in accordance with instructions in the Chromium Single Cell 3' Reagent Kits User Guide (v3.1). A library pool was sequenced with 800 million read pairs using NovaSeq 6000. Age and sex information in specimens used in Fig. 6: 5-year-old (yo) male for CTRL-8352, 3 yo female for CTRL-8353, 4 month-old female for HME-4688, 3 yo male for HME-6593 and 1 yo female for TSC-4258. The information for FCD-4512 is in Supplementary Table 4.
Single-nucleus RNAseq bioinformatics pipeline
Fastq files from single-nucleus libraries were processed through Cell Ranger (v6.0.2) analysis pipeline with –include-introns option and hg19 reference genome. Pooled library was demultiplexed and singlets were taken by demuxlet (v1.0). Seurat (v4.0.5) package was used to handle single nuclei data objects. Nuclei passed a control filter (number of genes > 500, number of reads >1000, percentage of mitochondrial gene < 10%) was used for downstream analysis. Protein coding genes were used for further downstream analysis. Data were normalized and scaled with the most variable 3000 features using the ‘SCTransform’ functions. Dimensionality reduction by PCA and UMAP embedding was performed using runPCA and runUMAP functions. Clustering was performed by FindNeighbors and FindClusters functions. Cell type identification was performed using known cell type markers expressed in the brain including excitatory (RORB, CUX2, SATB2), inhibitory neuron (GAD1, GAD2), astrocyte (SLC1A2, SLC1A3), oligodendrocyte (MOBP, PLP1), immature oligodendrocyte (BCAS1), oligodendrocyte precursor cell (PDGFRA), microglia (PTPRC), and endothelial cell markers (CLDN5, ID1) as well as using positive markers found by FindAllMarkers function with 3000 most variable features in scaled data. DEG analysis was performed by ‘FindMarkers’ function in Seurat v4.0 with all genes available in the assay. The genes with adjusted p-value < 0.01 were taken and listed in Supplementary Table 5c. The final visualization of various snRNAseq data was performed by ggplot2 (v3.3.5) and matplotlib (v3.5.0).
Weighted gene co-expression network analysis
‘r-wgcna’ package (v1.69) was used for WGCNA according to instructions71. Briefly, a similarity matrix was generated based on Pearson’s correlation coefficient value among the top 3000 variable features in single-nucleus transcriptome data, which was used to calculate the subsequently signed type of network adjacency matrix. Next, the topological overlap matrix (TOM) and the corresponding dissimilarity (1-TOM) value were generated from the adjacency matrix. Finally gene modules were generated by ‘cutreeDynamic’ function with ‘tree’ method, minAbsSplitHeight = 0.9 and minClusterSize = 30 option. Similar gene modules were merged by ‘mergeCloseModules’ function with cutHeight = 0.25.
Correlation between cell type and eigengene expression
Pearson correlation coefficient r (>0, negative values were not presented) between a given cell type and net expression levels of a given geneset and Student asymptotic p-value for the correlation were plotted as the colour and size of dots in dot plots, respectively.
RNAscope
We used published methods and purchased target probes (FGFR1 (catalog no. 310071-C2), FGFR2 (311171), FGFR3 (310791), EGFR (310061-C4), PDGFRA(604481-C2)) for genes of interest containing an 18–25 base region complementary to the target, as spacer sequencing, and a 14 base Z-tail sequence72, including RNA pol III positive control and random sequence negative control, following the manufacturer recommendations (Advanced Cell Diagnostics, Hayward, CA). Images were acquired on a Leica STED Sp8 with a Falcon microscope.
Permutation analysis for the enrichment of MCD genes
To test the enrichment of differentially expressed MCD genes in RNA sequencing against a random distribution, we designed a permutation analysis. All human genes used in the single-cell RNA-seq analysis (n=19909) were randomly shuffled 10,000 times and the same number of genes as described in the differential expression analysis (Extended Data Fig. 10a) was selected for each shuffle. The number of overlaps between each shuffle and the MCD genes was compared and the number of overlaps was used as the outcome and a null distribution was generated from the 10,000 shuffles. All 75 positively validated MCD genes are confirmed to be existing in the initial gene list. After 10,000 permutations, the permutation p-value was calculated with numbers observed to overlap.
Statistics and Reproducibility
Statistical analyses were performed by R or Prism 8 (GraphPad Software). Two-way ANOVA and Sidak multiple comparisons were performed in Fig. 3b and Extended Data Fig. 6a with p-values of interaction between genotype and bin factor. Mann-Whitney U-test was performed for Fig. 3c and Extended Data Fig. 6b. The images used in Fig. 3d and Extended Data Fig. 8 were taken from patient-derived tissue slices which are unique and not biologically reproducible. Detailed statistical information is described in Supplementary Table 9.
Extended Data
Extended Data Fig. 1. Workflow of genetic discovery and bioinformatic pipeline to detect sSNVs in the MCD cohort.
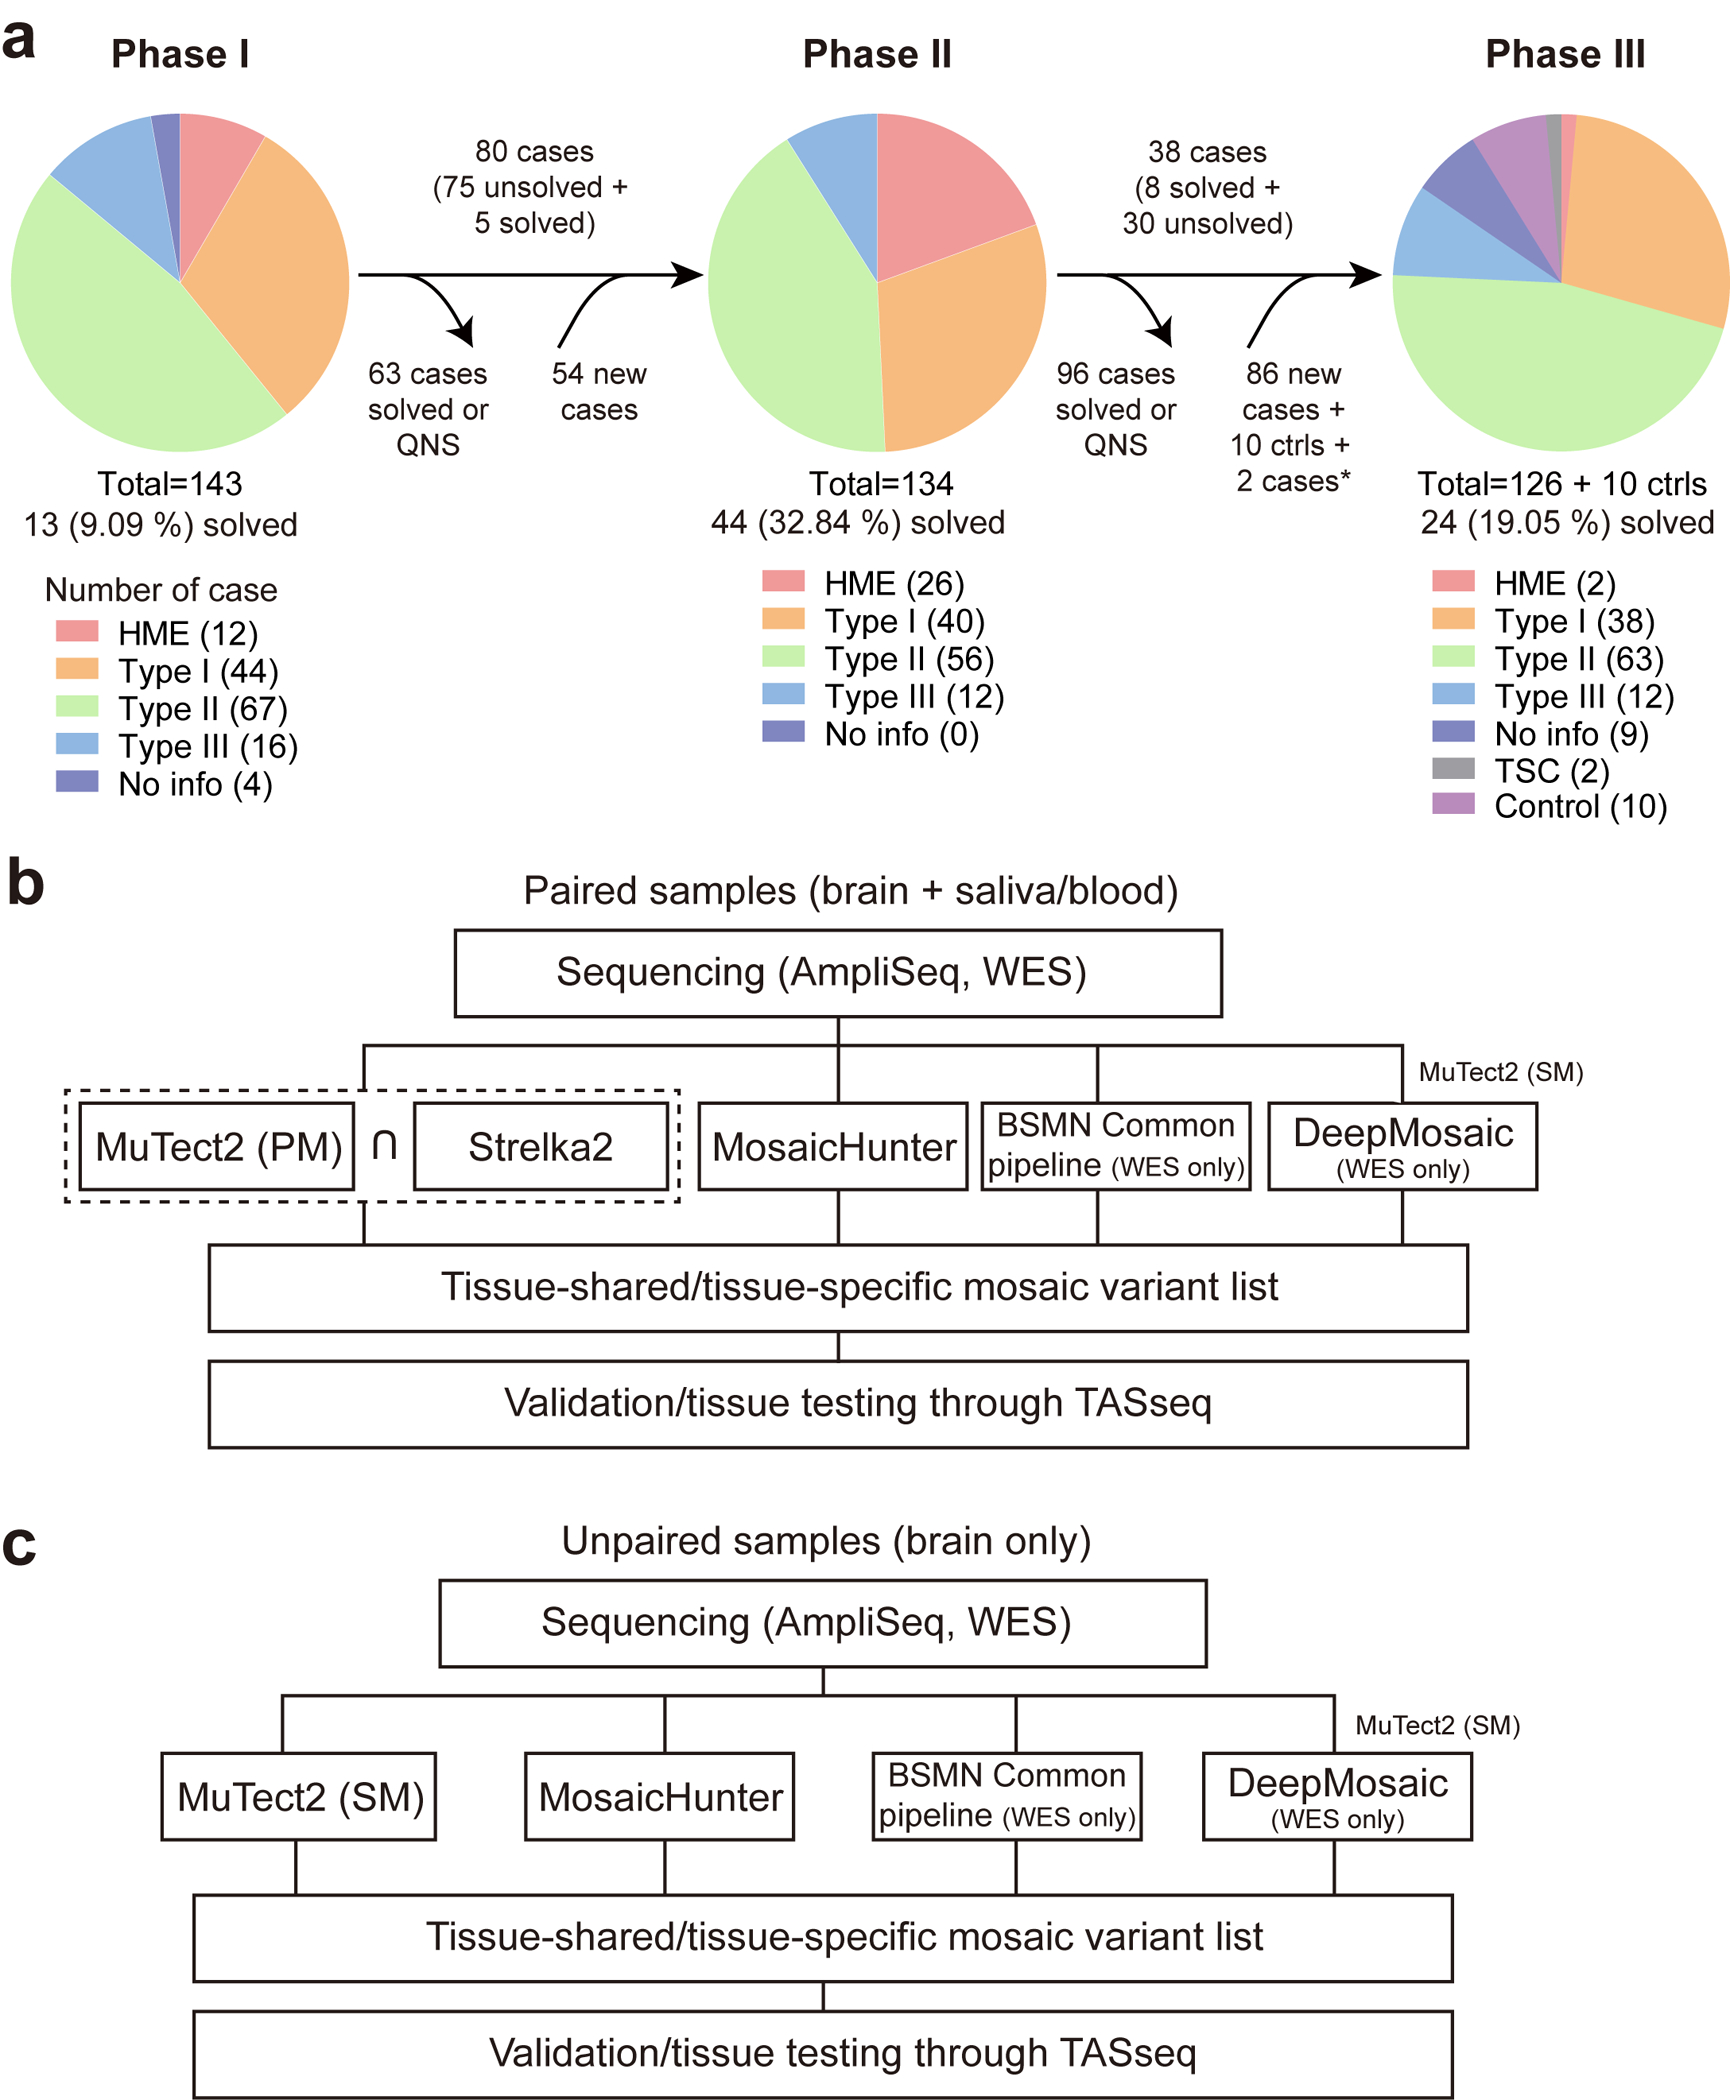
(a) Workflow chart describing the flow of cases for each phase of genetic discovery. QNS: quantity not sufficient. 2 cases labeled by a star are sequenced in phase 1 but not phase 2. (b) The pipeline for paired samples. Notably, the dashed square indicates that the sharing variants between MuTect2 paired mode and Strelka2 were used for the downstream analysis. BSMN common pipeline and DeepMosaic were used only for WES datasets. The DeepMosaic input variants were generated by MuTect2 single mode. (c) The pipeline for unpaired samples. The pipeline is similar except that MuTect2 single mode without Strelka2 is used. PM: paired mode, SM: single mode.
Extended Data Fig. 2. The locations of the selected MCD variants.
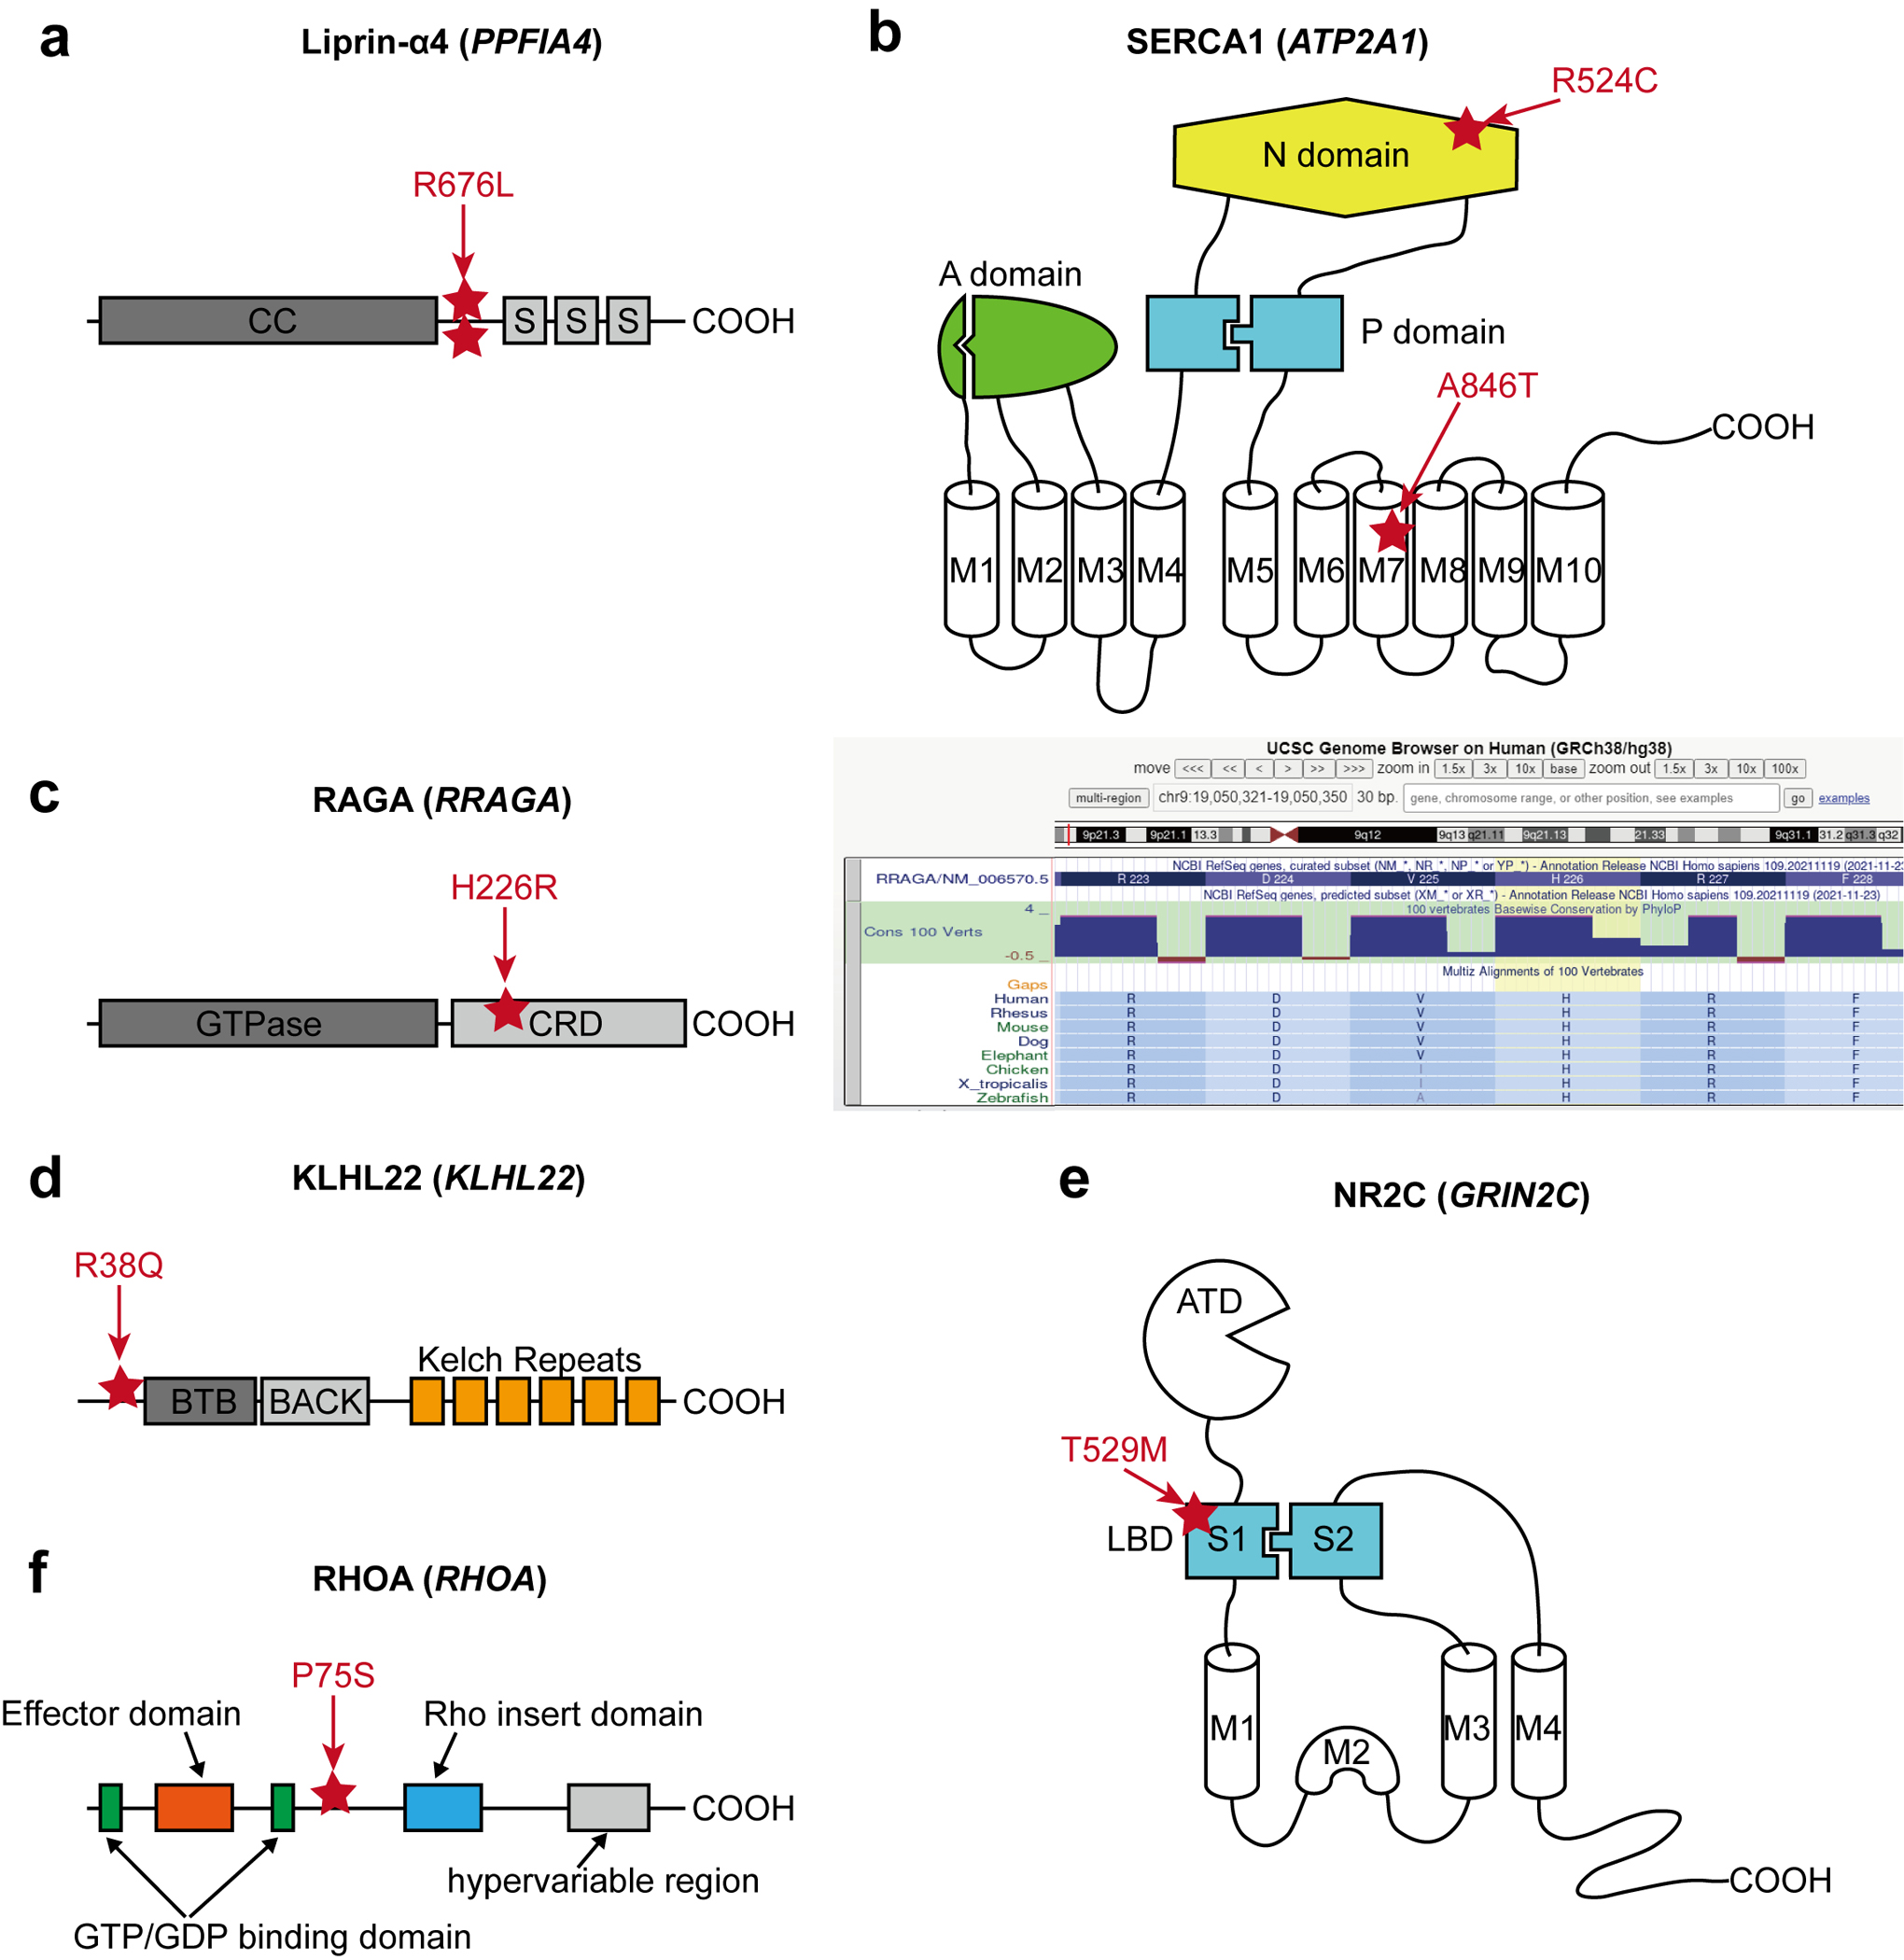
(a) The location of two recurrent SNV calls is at the same position between the coiled-coil domain (CC) and the first SAM domain (S) of Liprin-α4. (b) Two different variants in SERCA1. p.R524C mutation is at the nucleotide ATP-binding (N) domain, whereas the pA846T variant is in the 7th transmembrane (M7) domain. A: Actuator domain, P: Phosphorylation domain, M: Transmembrane domain. (c) Left: The location of p.H226R variant in RAGA protein. GTPase: GTPase domain, CRD: C-terminal roadblock domain. Right: UCSC genome browser screenshot describing that p.H226 is a conserved site across all vertebrates. (d) The location of the p.R38Q variant in the N-terminal region before the BTB (Broad-Complex, Tramtrack, and Bric-à-brac) domain of KLHL22. (e) A variant in the S1 domain of NR2C. S1 and S2 together make the ligand-binding domain (LBD), the target of glutamate. ATD: Amino-terminal domain. (f) RHOA p.P75S variant in the interdomain space between the second GTP/GDP binding domain and Rho insert domain.
Extended Data Fig. 3. Mutational signature analysis shows cell-division-related clock-like signatures in the MCD cohort.
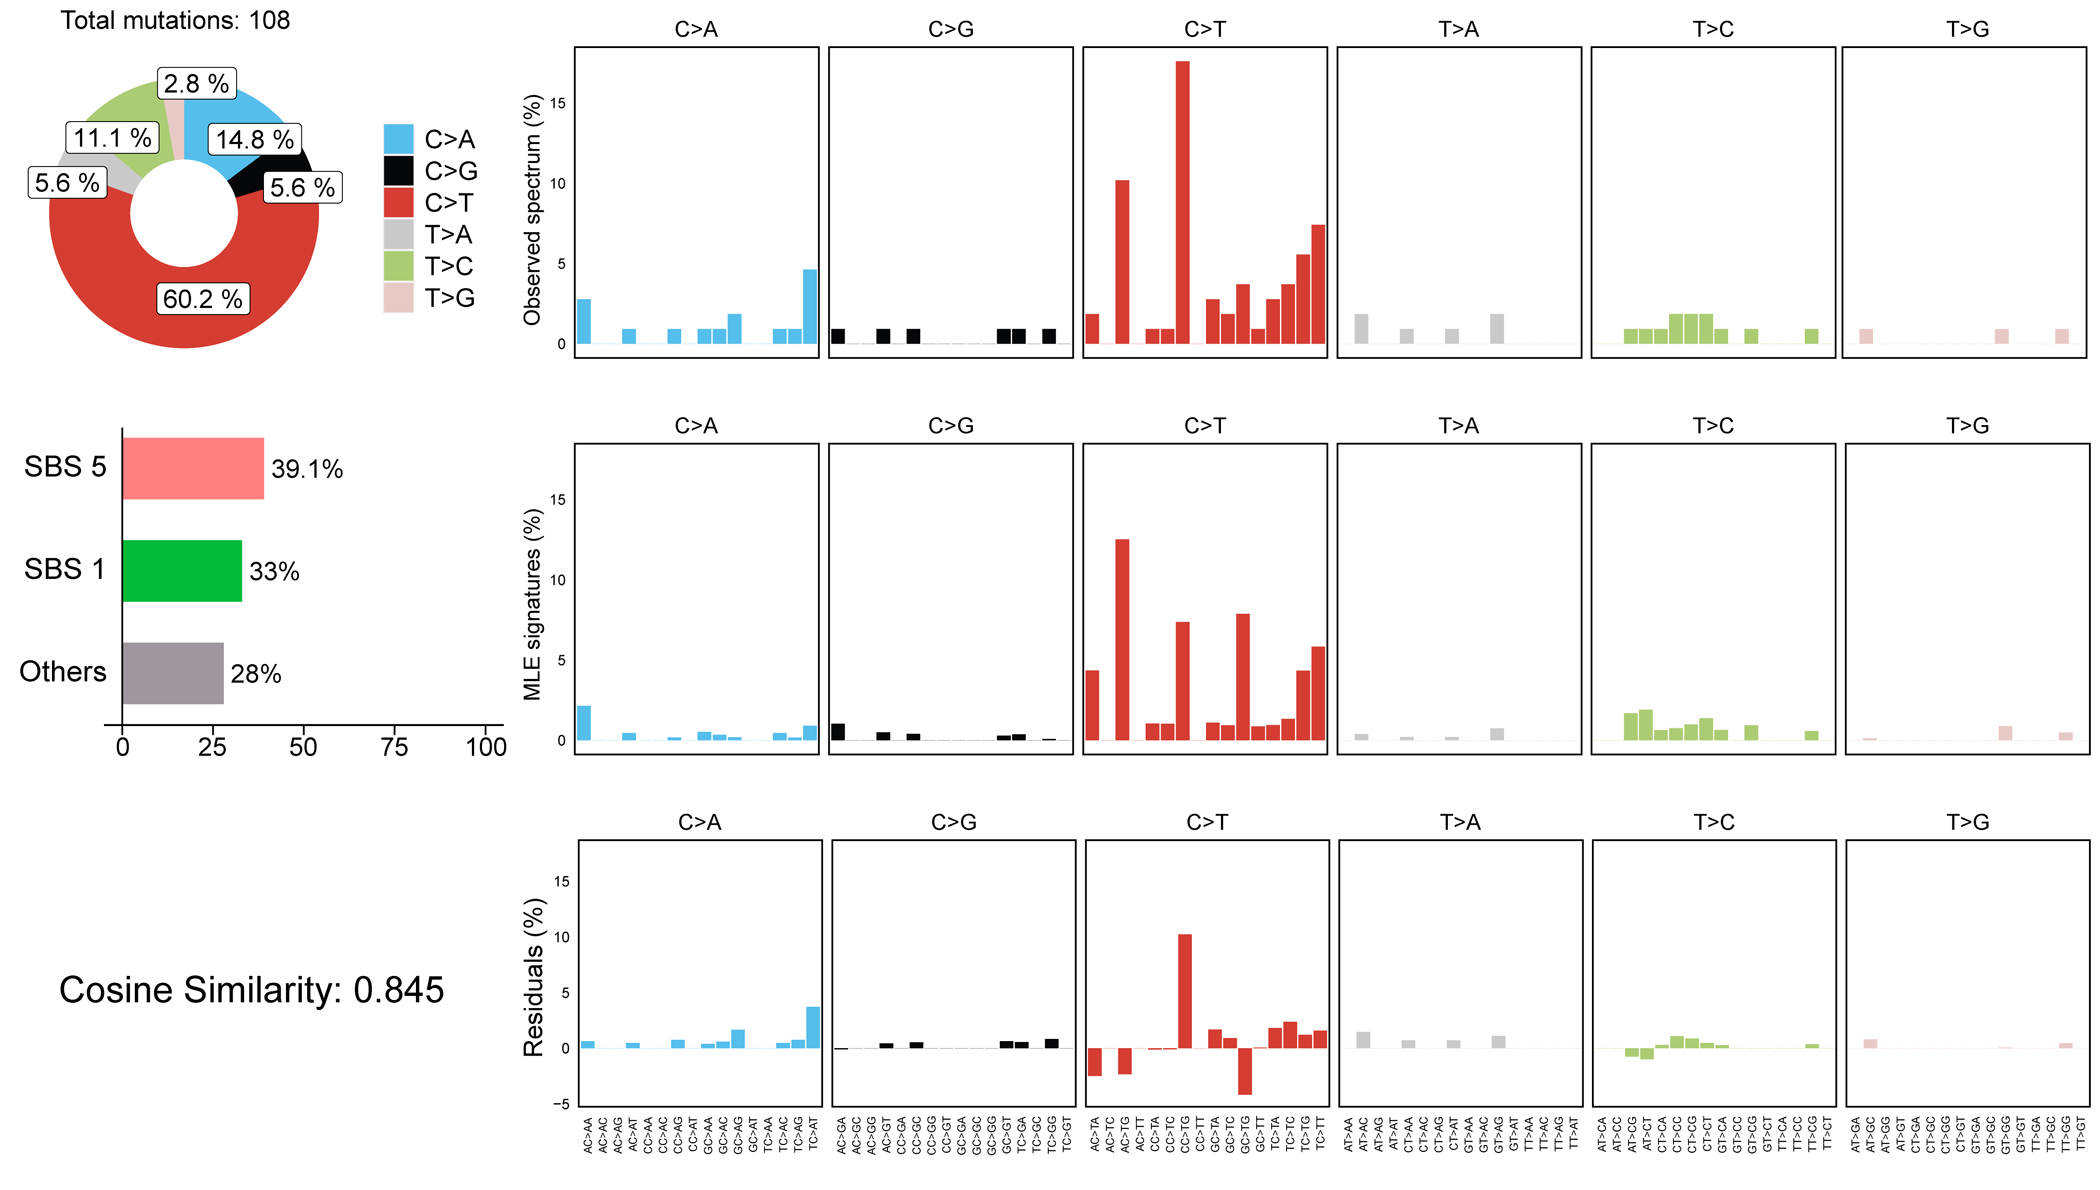
SBS5 (39.1%) and SBS1 (33%) revealed by Mutalisk are clock-like mutational signatures. SBS1 especially correlates with stem cell division and mitosis.
Extended Data Fig. 4. Four major gene networks were reconstructed from the WES dataset.
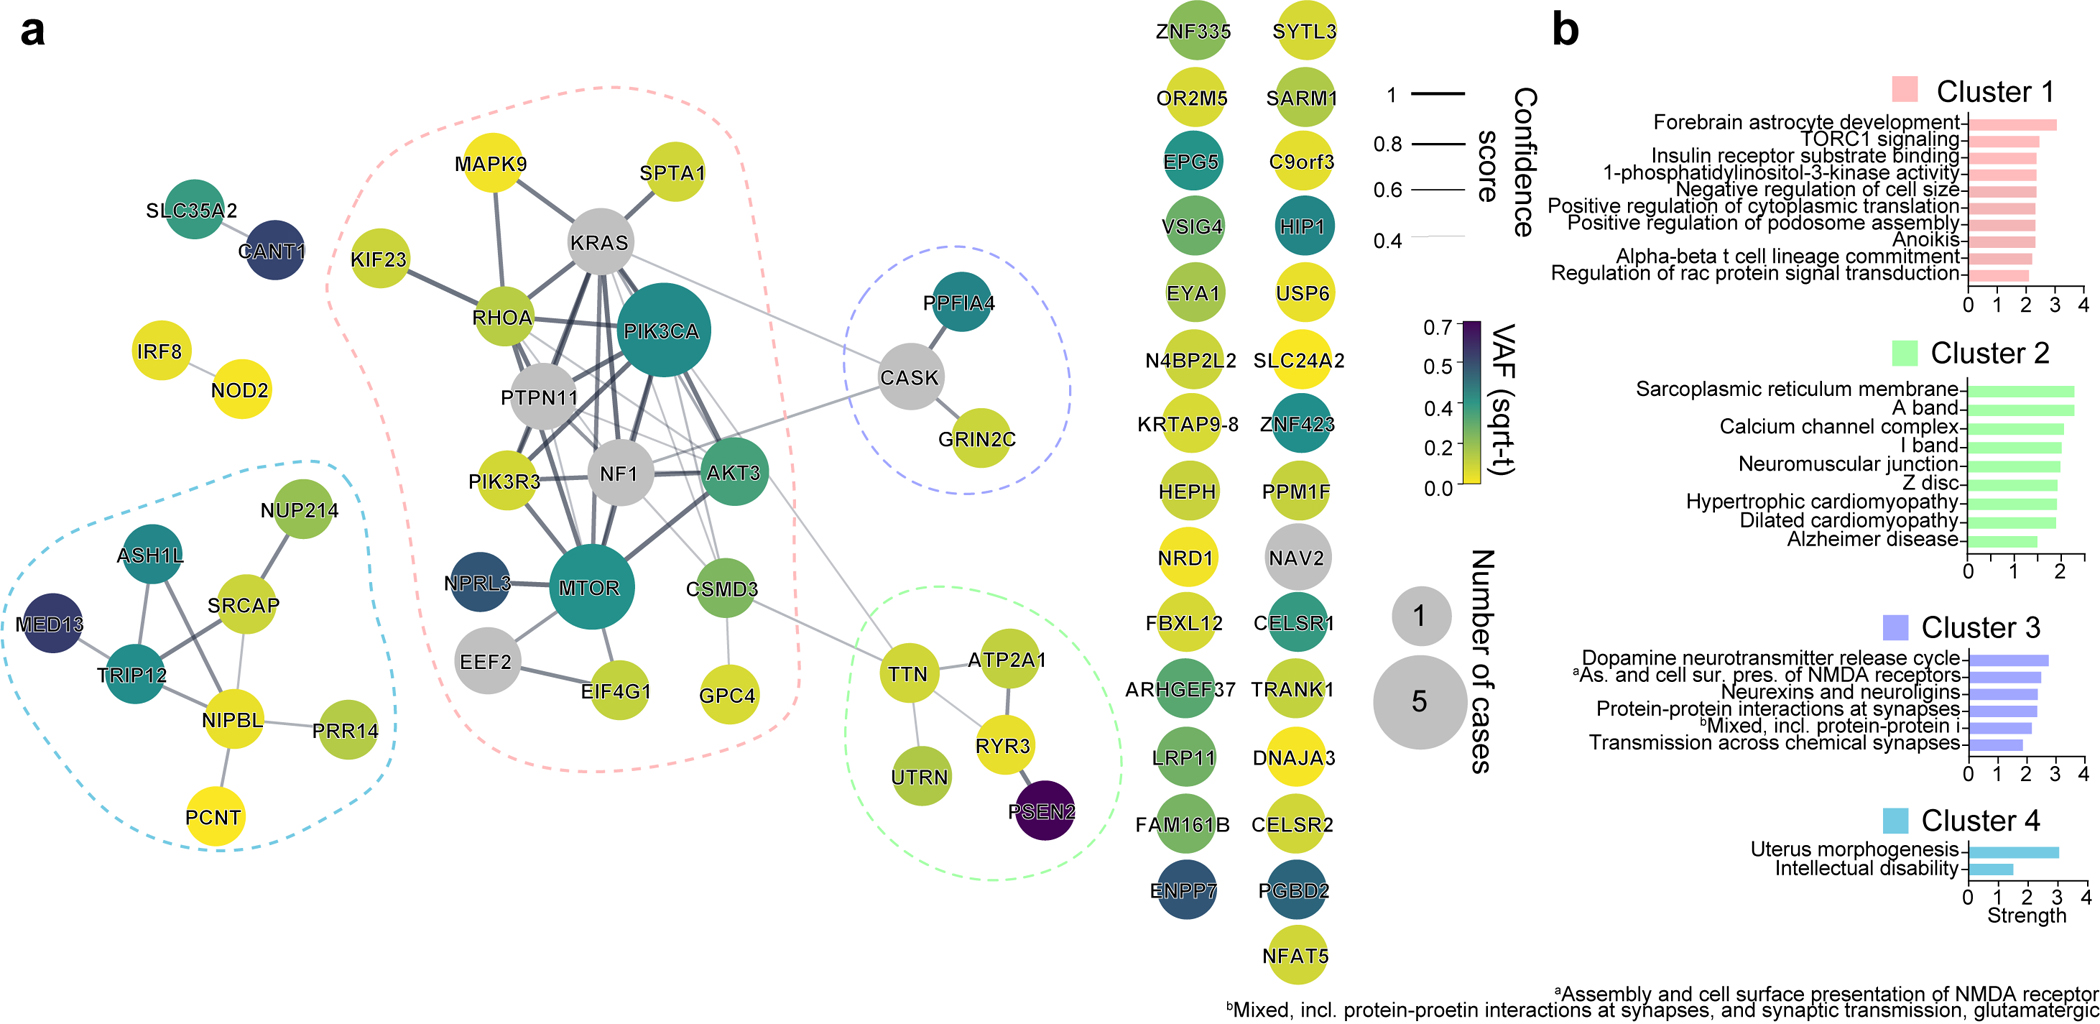
(a) STRING DB pathway analysis of the 59 MCD discovered genes and six novel genes (a total of 65 genes) from recent publications identifies MTOR/MAP kinase pathway (pink, Cluster 1), Calcium dynamics (green, Cluster 2), Synapse (purple, Cluster 3), Gene expression (blue, Cluster 4). Edge thickness: confidence score calculated by STRING. Size and color of a node: square root transformed (sqrt-t) number of patients carrying a given mutation and average VAF across all patients, respectively. Non-clustered orphan genes are listed on the right. (b) Gene Ontology (GO) analysis results confirmed the functions of compositions in each network. Top GO terms or KEGG pathways. Strength calculation and cluster generation were performed by STRING.
Extended Data Fig. 5. ClueGO analysis using the MCD genes result identifies the biological processes and molecular pathways.
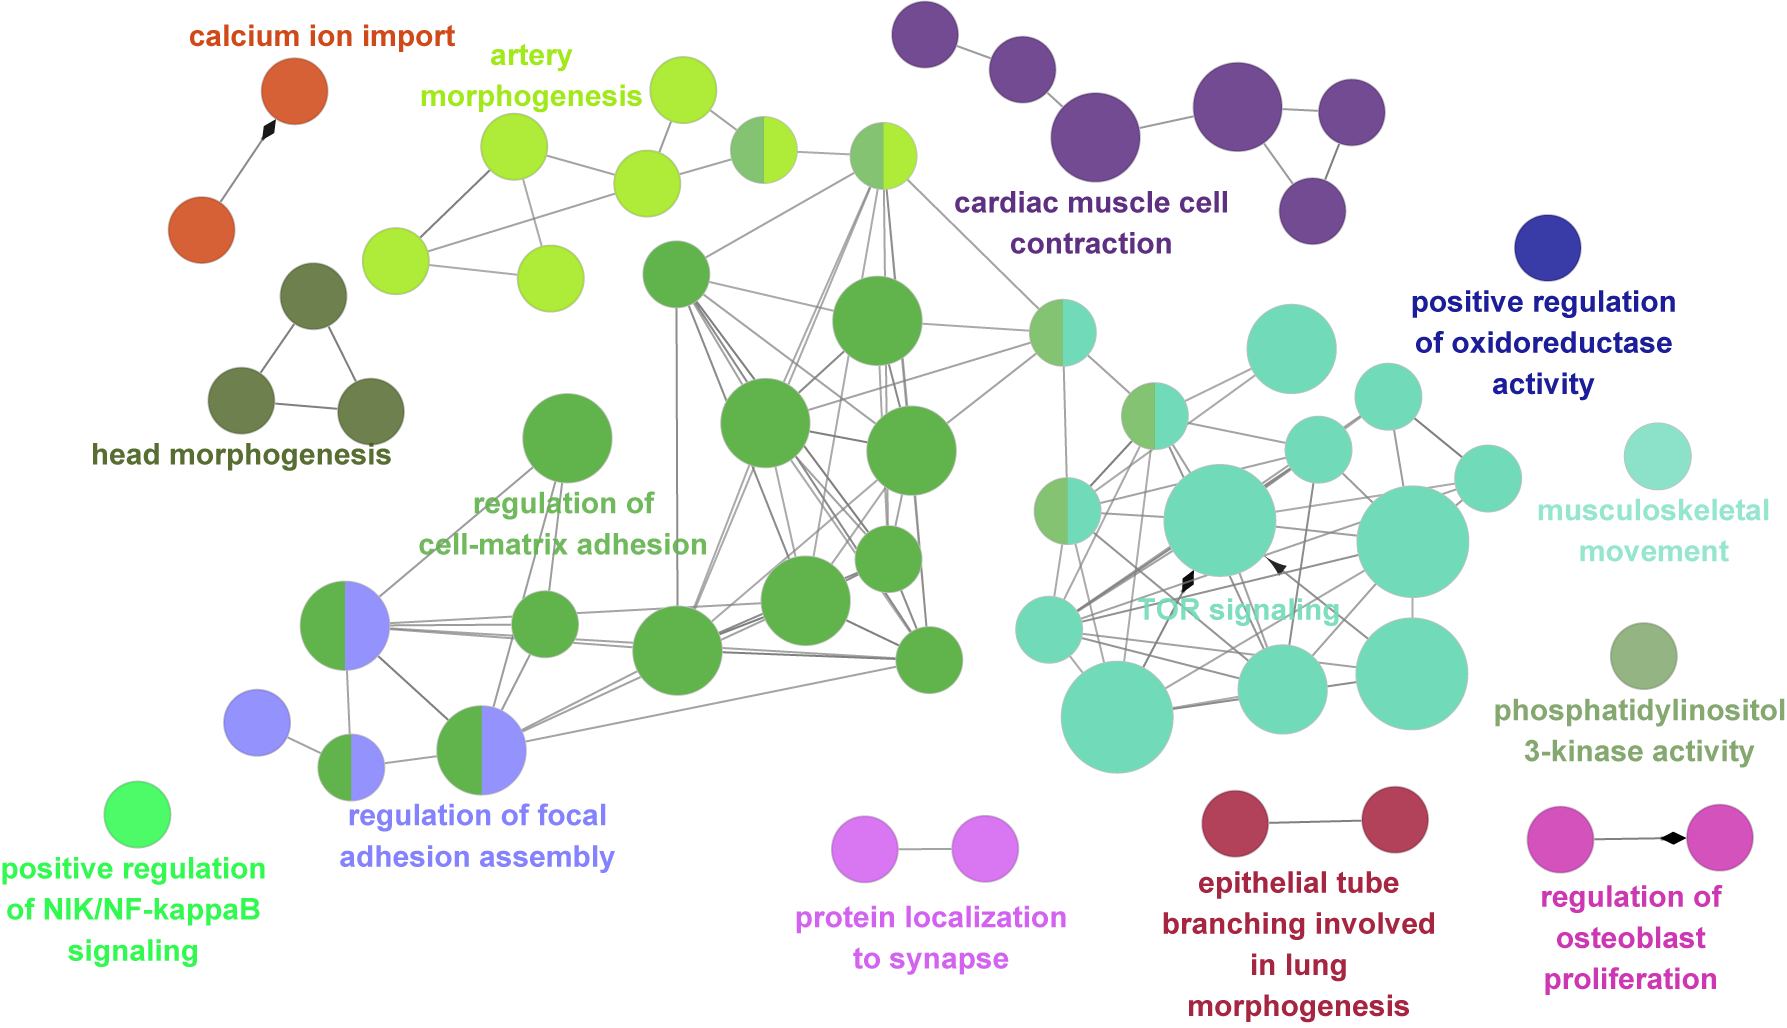
The main cluster is related to TOR signaling, regulation of cell-matrix adhesion, regulation of focal adhesion assembly, and artery morphogenesis. Notably, there are also isolated clusters that were not covered in previous studies, for example, cardiac muscle cell contraction, calcium ion import, and protein localization to the synapse. Corrected p-value with Bonferroni step down was reflected in node size (two-sided hypergeometric test, Large: p < 0.0005, medium: p < 0.005, small: p < 0.05). All p-values are in Supplementary Table 9.
Extended Data Fig. 6. Additional functional analyses for new RRAGA and RHOA mutations.
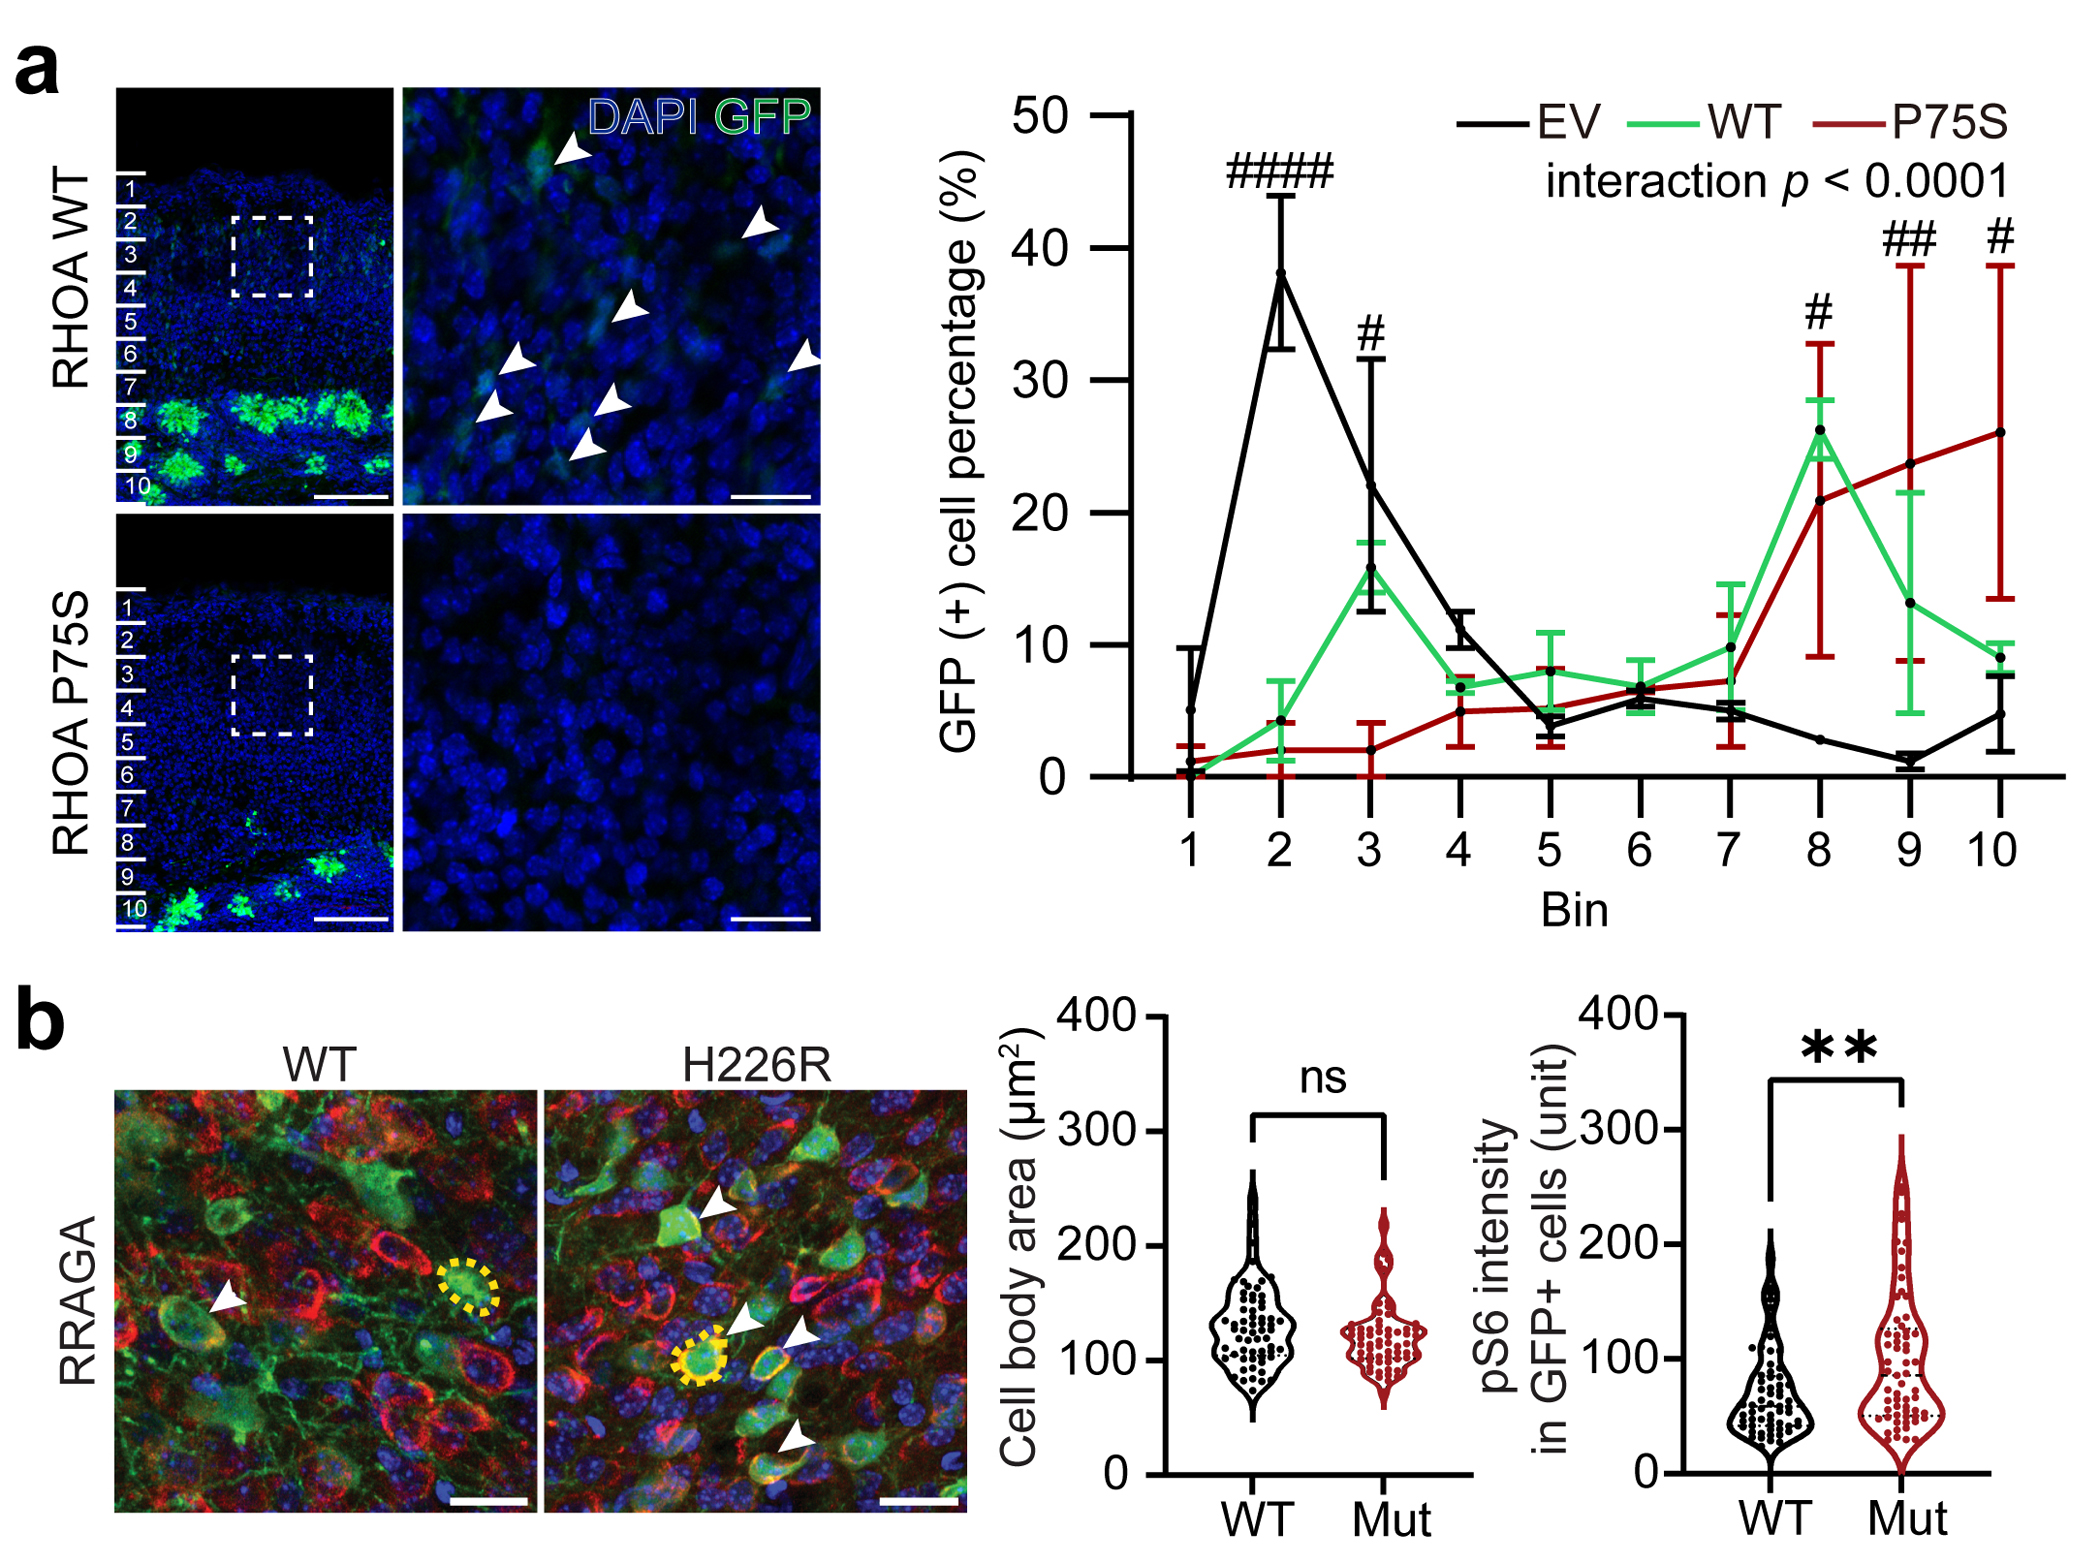
(a) Over-expression of RHOA WT and P75S mutant form in cortical neurogenic pool induce both significant defects in migration. Notably, some portion of WT form-expressing cells migrate to the superior cortical area (white arrow), whereas mutant form-expressing cells did not show any migrating cells at all. The dashed square area is magnified to the right side images. Scale bar: 100 μm and 20 μm for left and right images, respectively. Right, Quantification of the migration level. EV data was exported from Fig. 3b. Two-way ANOVA and Sidak multiple comparisons with p-values of interaction between genotype and bin factor. Ten bins from the surface of the cortex (top) to SVZ (bottom). n=3, 3, 2 biologically independent mice for EV, RHOA WT and RHOA P75S, respectively. Mean ± SEM. (b) Immunofluorescence in postnatal day 21 mouse cortices for RRAGA wild-type (WT) or mutant isoform. Yellow dashed lines: examples of cell body size quantification. Dashed lines and dotted lines in the violin plots indicate median and quartiles, respectively. Two-tailed Mann-Whitney U-test. Scale bar: 20 μm. n=61 cells (3 mice), 61 (2) for RRAGA WT and RRAGA H226R, respectively * or # indicates a p-value in comparison between WT and mutant group, or EV and mutant group respectively. ####p < 0.0001; ##p < 0.01; #p < 0.05; **p < 0.01; ns, non-significant.
Extended Data Fig. 7. Cell-type identification by DEGs and WGCNA in the MCD snRNAseq dataset.
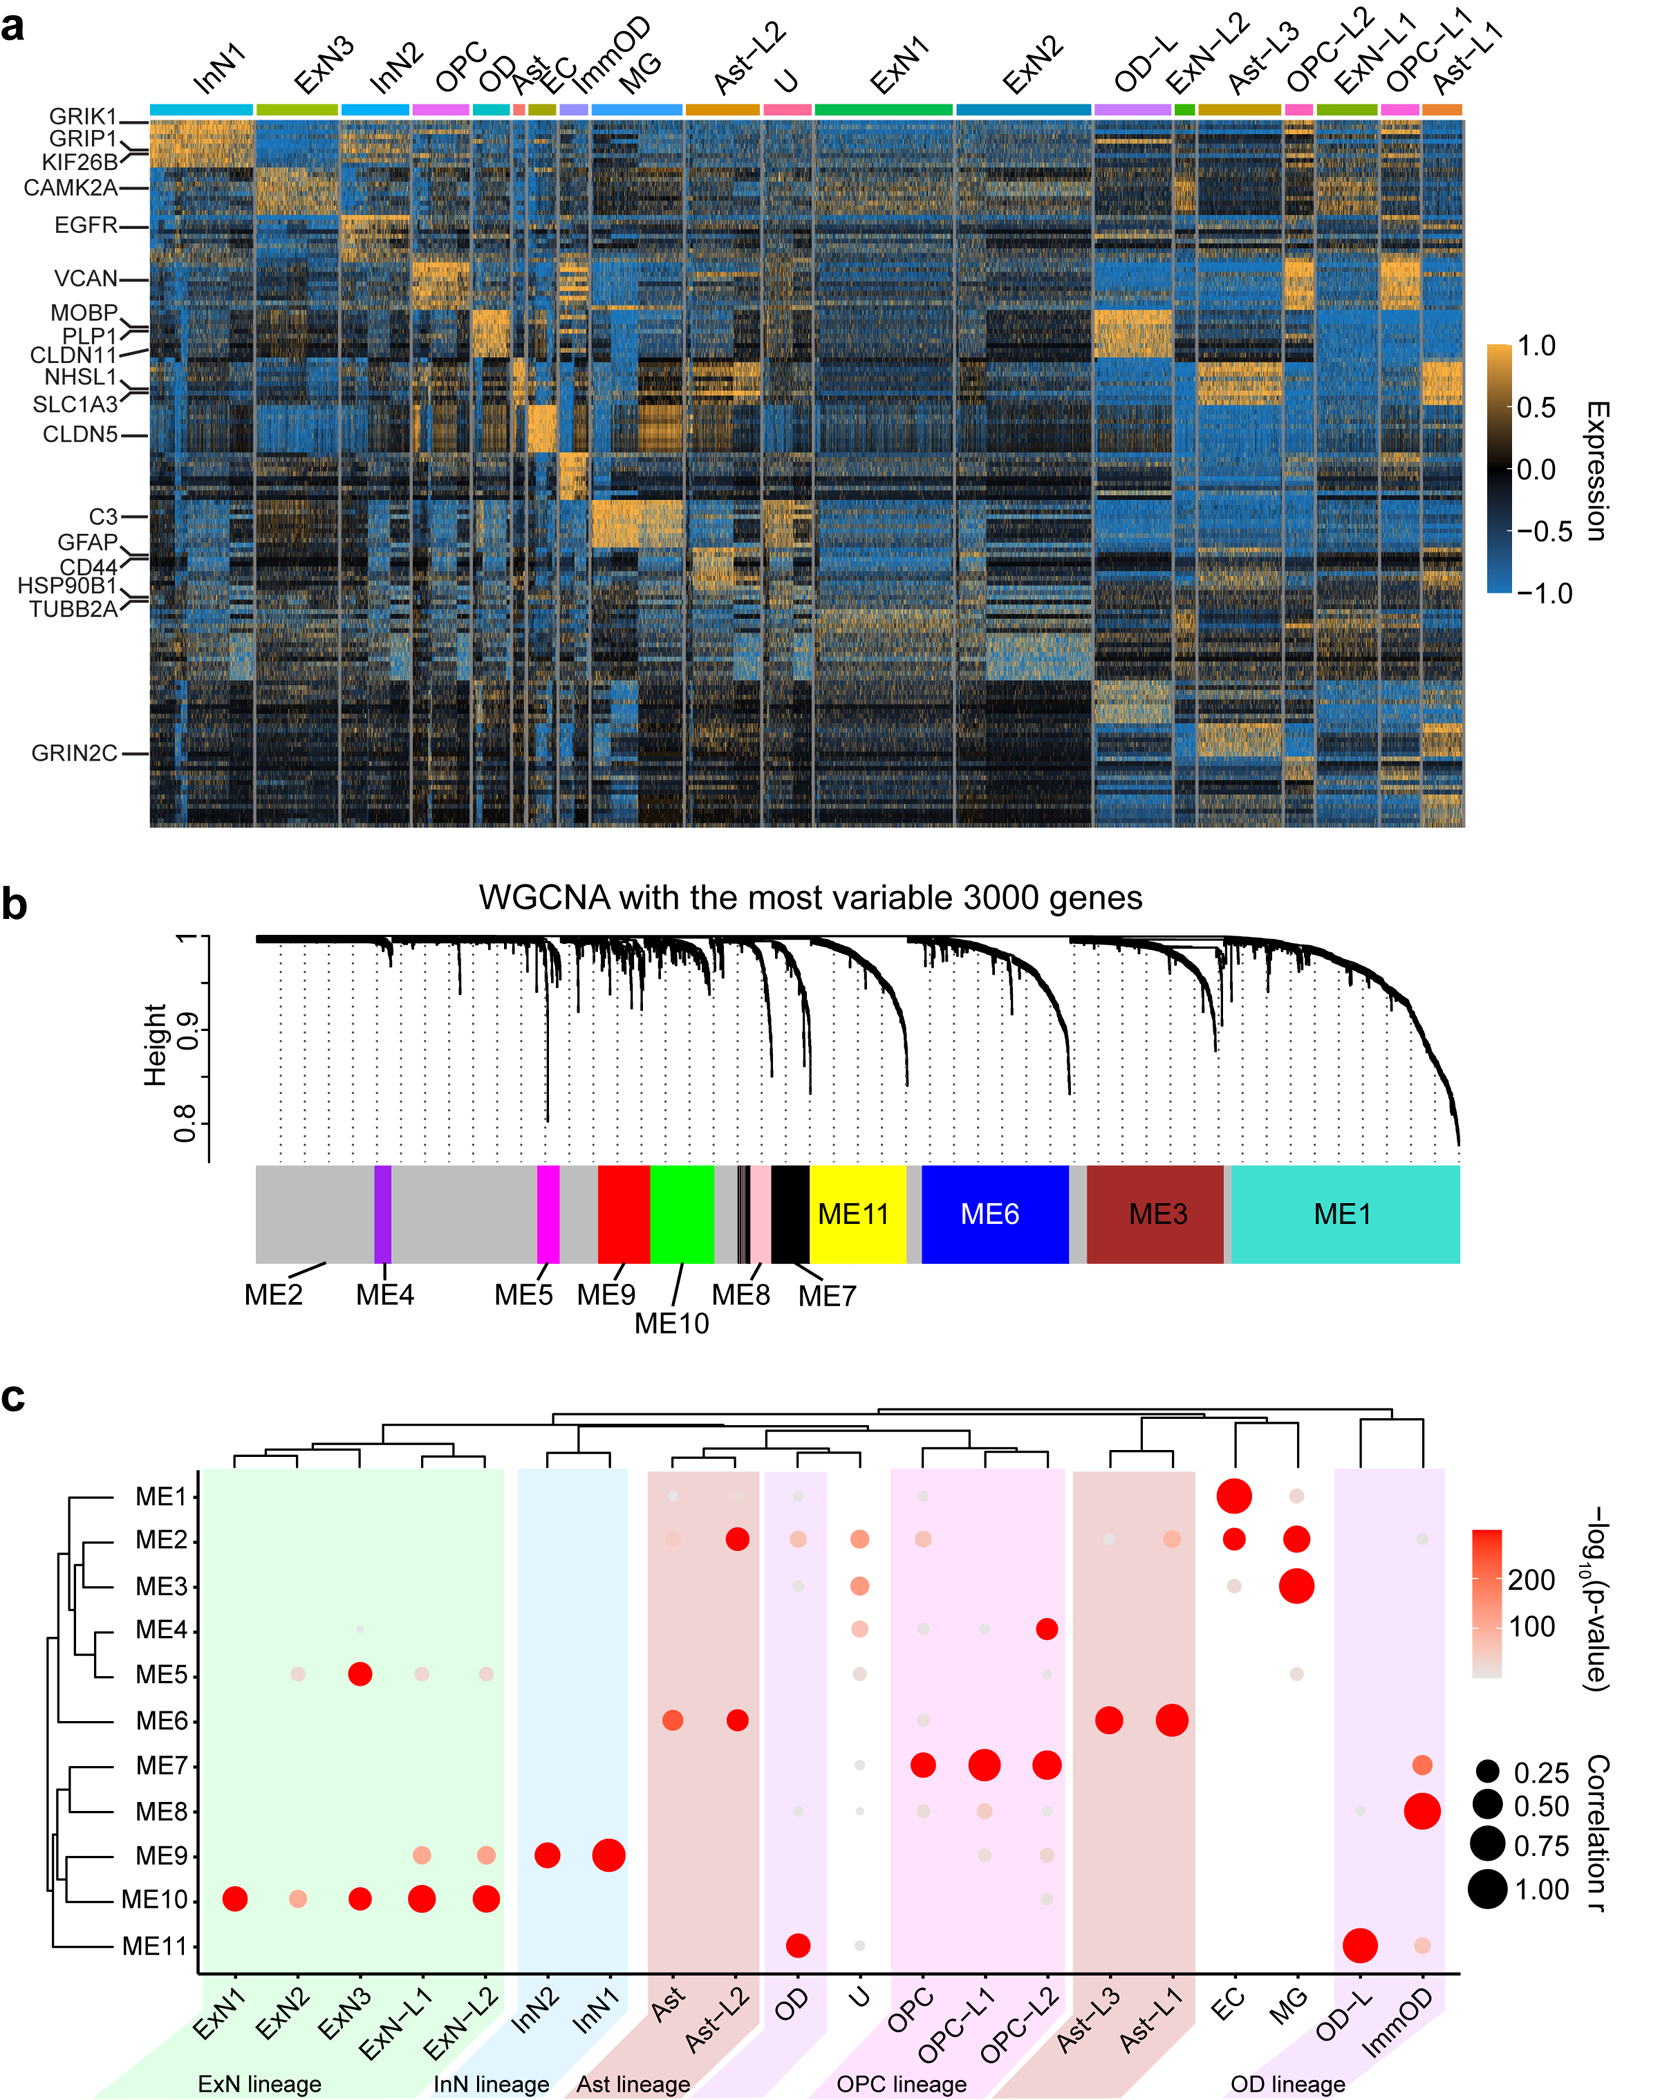
(a) DEG analysis using FindAllMarker function in Seurat v4 package. The top 10 genes for each cluster were presented. Some notable marker genes are presented on the left side. Color: scaled gene expression level. (b) Description of WGCNA. The most variable 3000 genes were used for generating six co-expression module eigengenes (ME1 to ME11). The members of each ME are described in Supplementary Table 5b. (c) Enrichment of module eigengenes in cell type clusters. Atypical clusters showing similar patterns with a normal cell cluster were classified as the same lineage. We identified 5 different lineages (Ast, OD, ExN, InN, OPC) coded as different colors. Notably, Ast-L1/2/3 and OPC-L1/2 show excessively increased expression of ME6 or ME7, Ast or OPC signature ME, respectively. OPC-L2 shows upregulation of ME4, related to the cell cycle, implying that HME has many over-proliferating OPC-L cells. Excitatory neuronal lineage typically expresses ME5 and ME10, but ExN-L1/2 also shows increased expression of ME9, a signature of inhibitory neurons, compared to ExN1/2/3. OD-L cells are classified as OD lineage because they express excessive ME11, a signature to OD. U cluster, dominant in TSC, does not show a clear signature. The size and color of the dot plot are the Pearson correlation coefficient and corresponding non-adjusted asymptotic p-value derived from a two-sided Student’s t-test, respectively.
Extended Data Fig. 8. The validation of the snRNAseq result from HME-6593 shows that MCD dominant clusters are highly correlated with dysplastic cells in MCD.
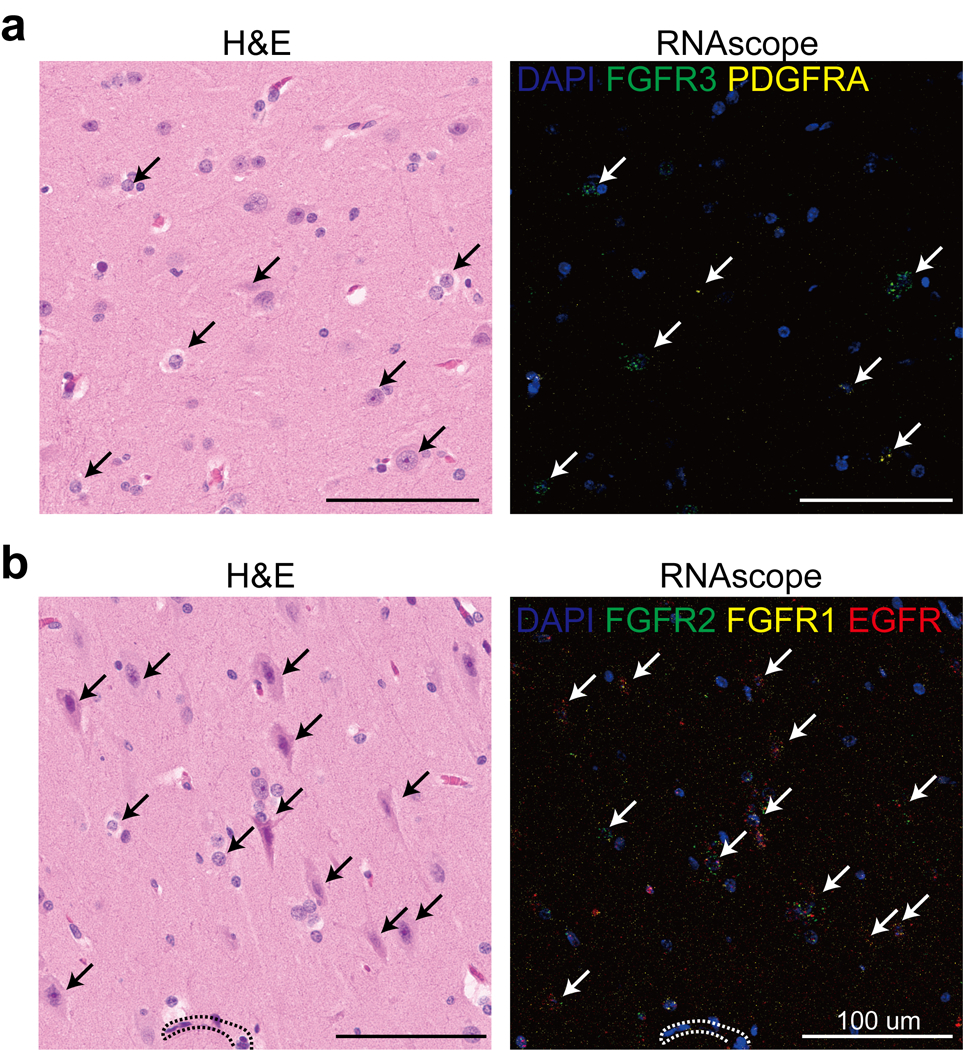
(a-b) H&E (left) and RNAscope (right) for genes expressed highly in MCD brain (FGFR2, FGFR1, EGFR, top) or (FGFR3, PDGFRA bottom). Dashed lines: blood vessels. White/black arrows: dysplastic cells. One representative section is shown for each probe combination.
Extended Data Fig. 9. Expression patterns of individual MCD genes in the MCD snRNAseq dataset.
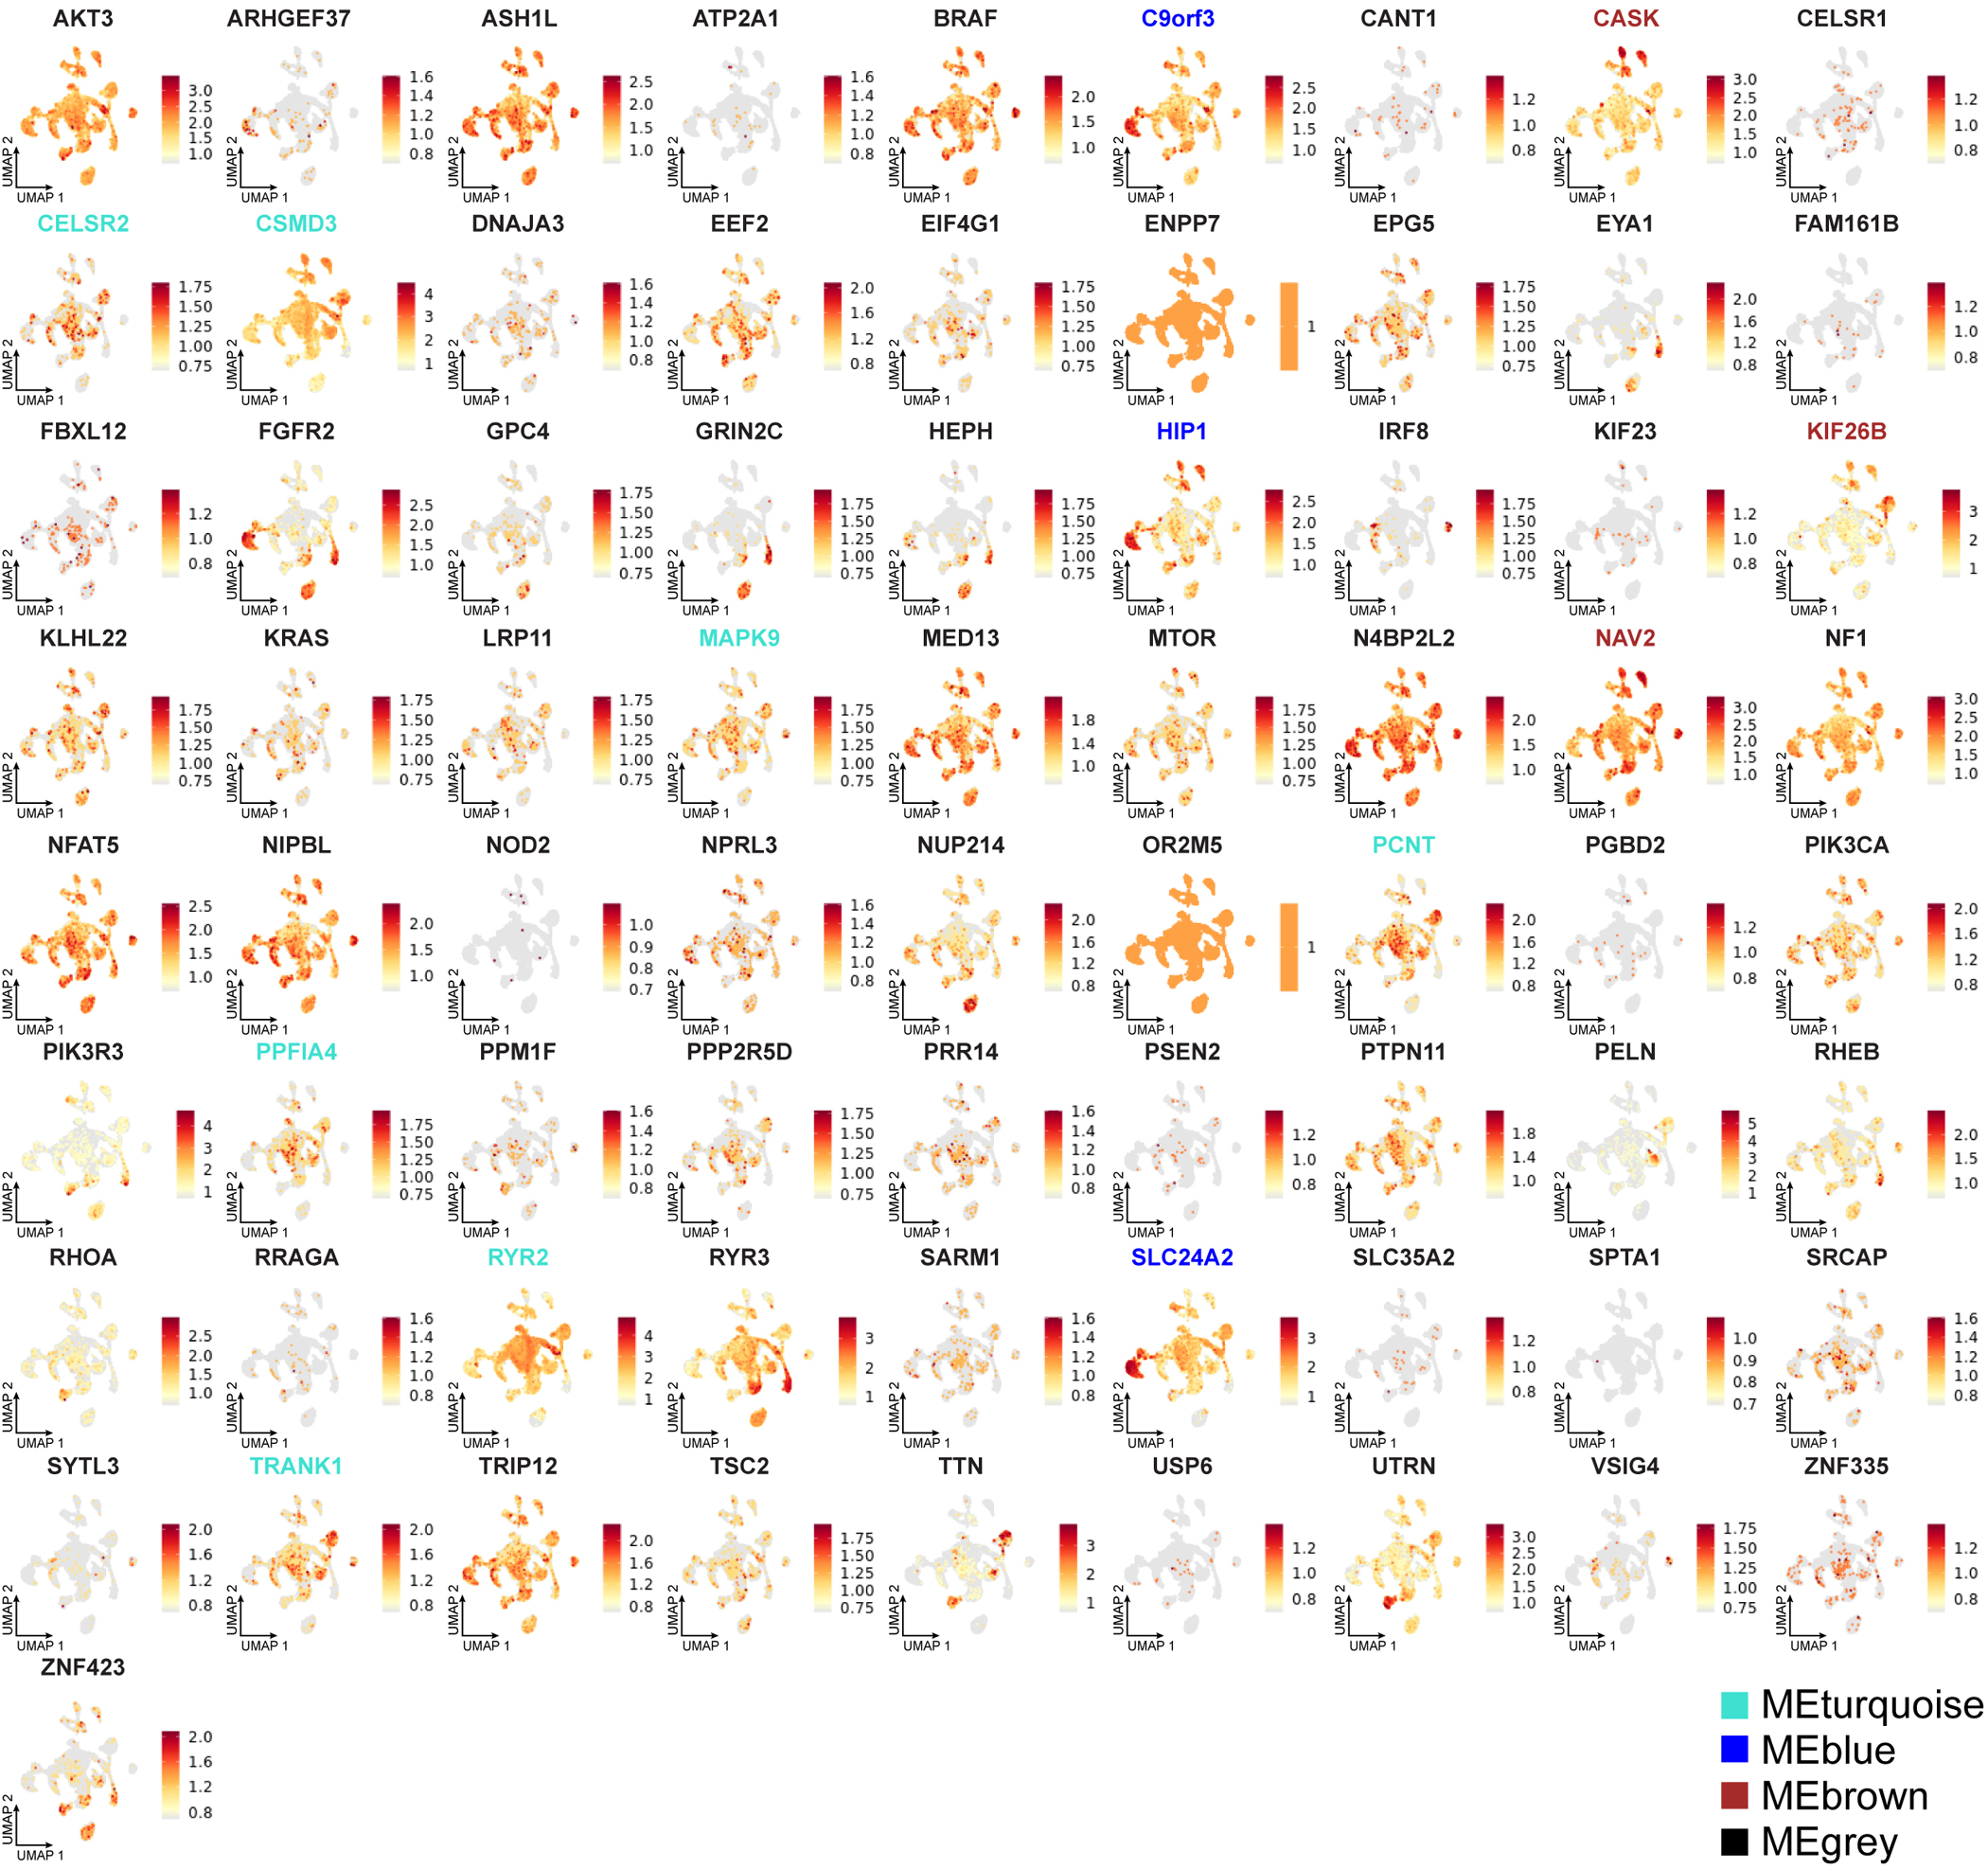
The gene members of each eigen module shown in Fig. 6d were colored according to the name of a given eigengene.
Extended Data Fig. 10. Functional implication of MCD genes in MCD snRNAseq dataset.
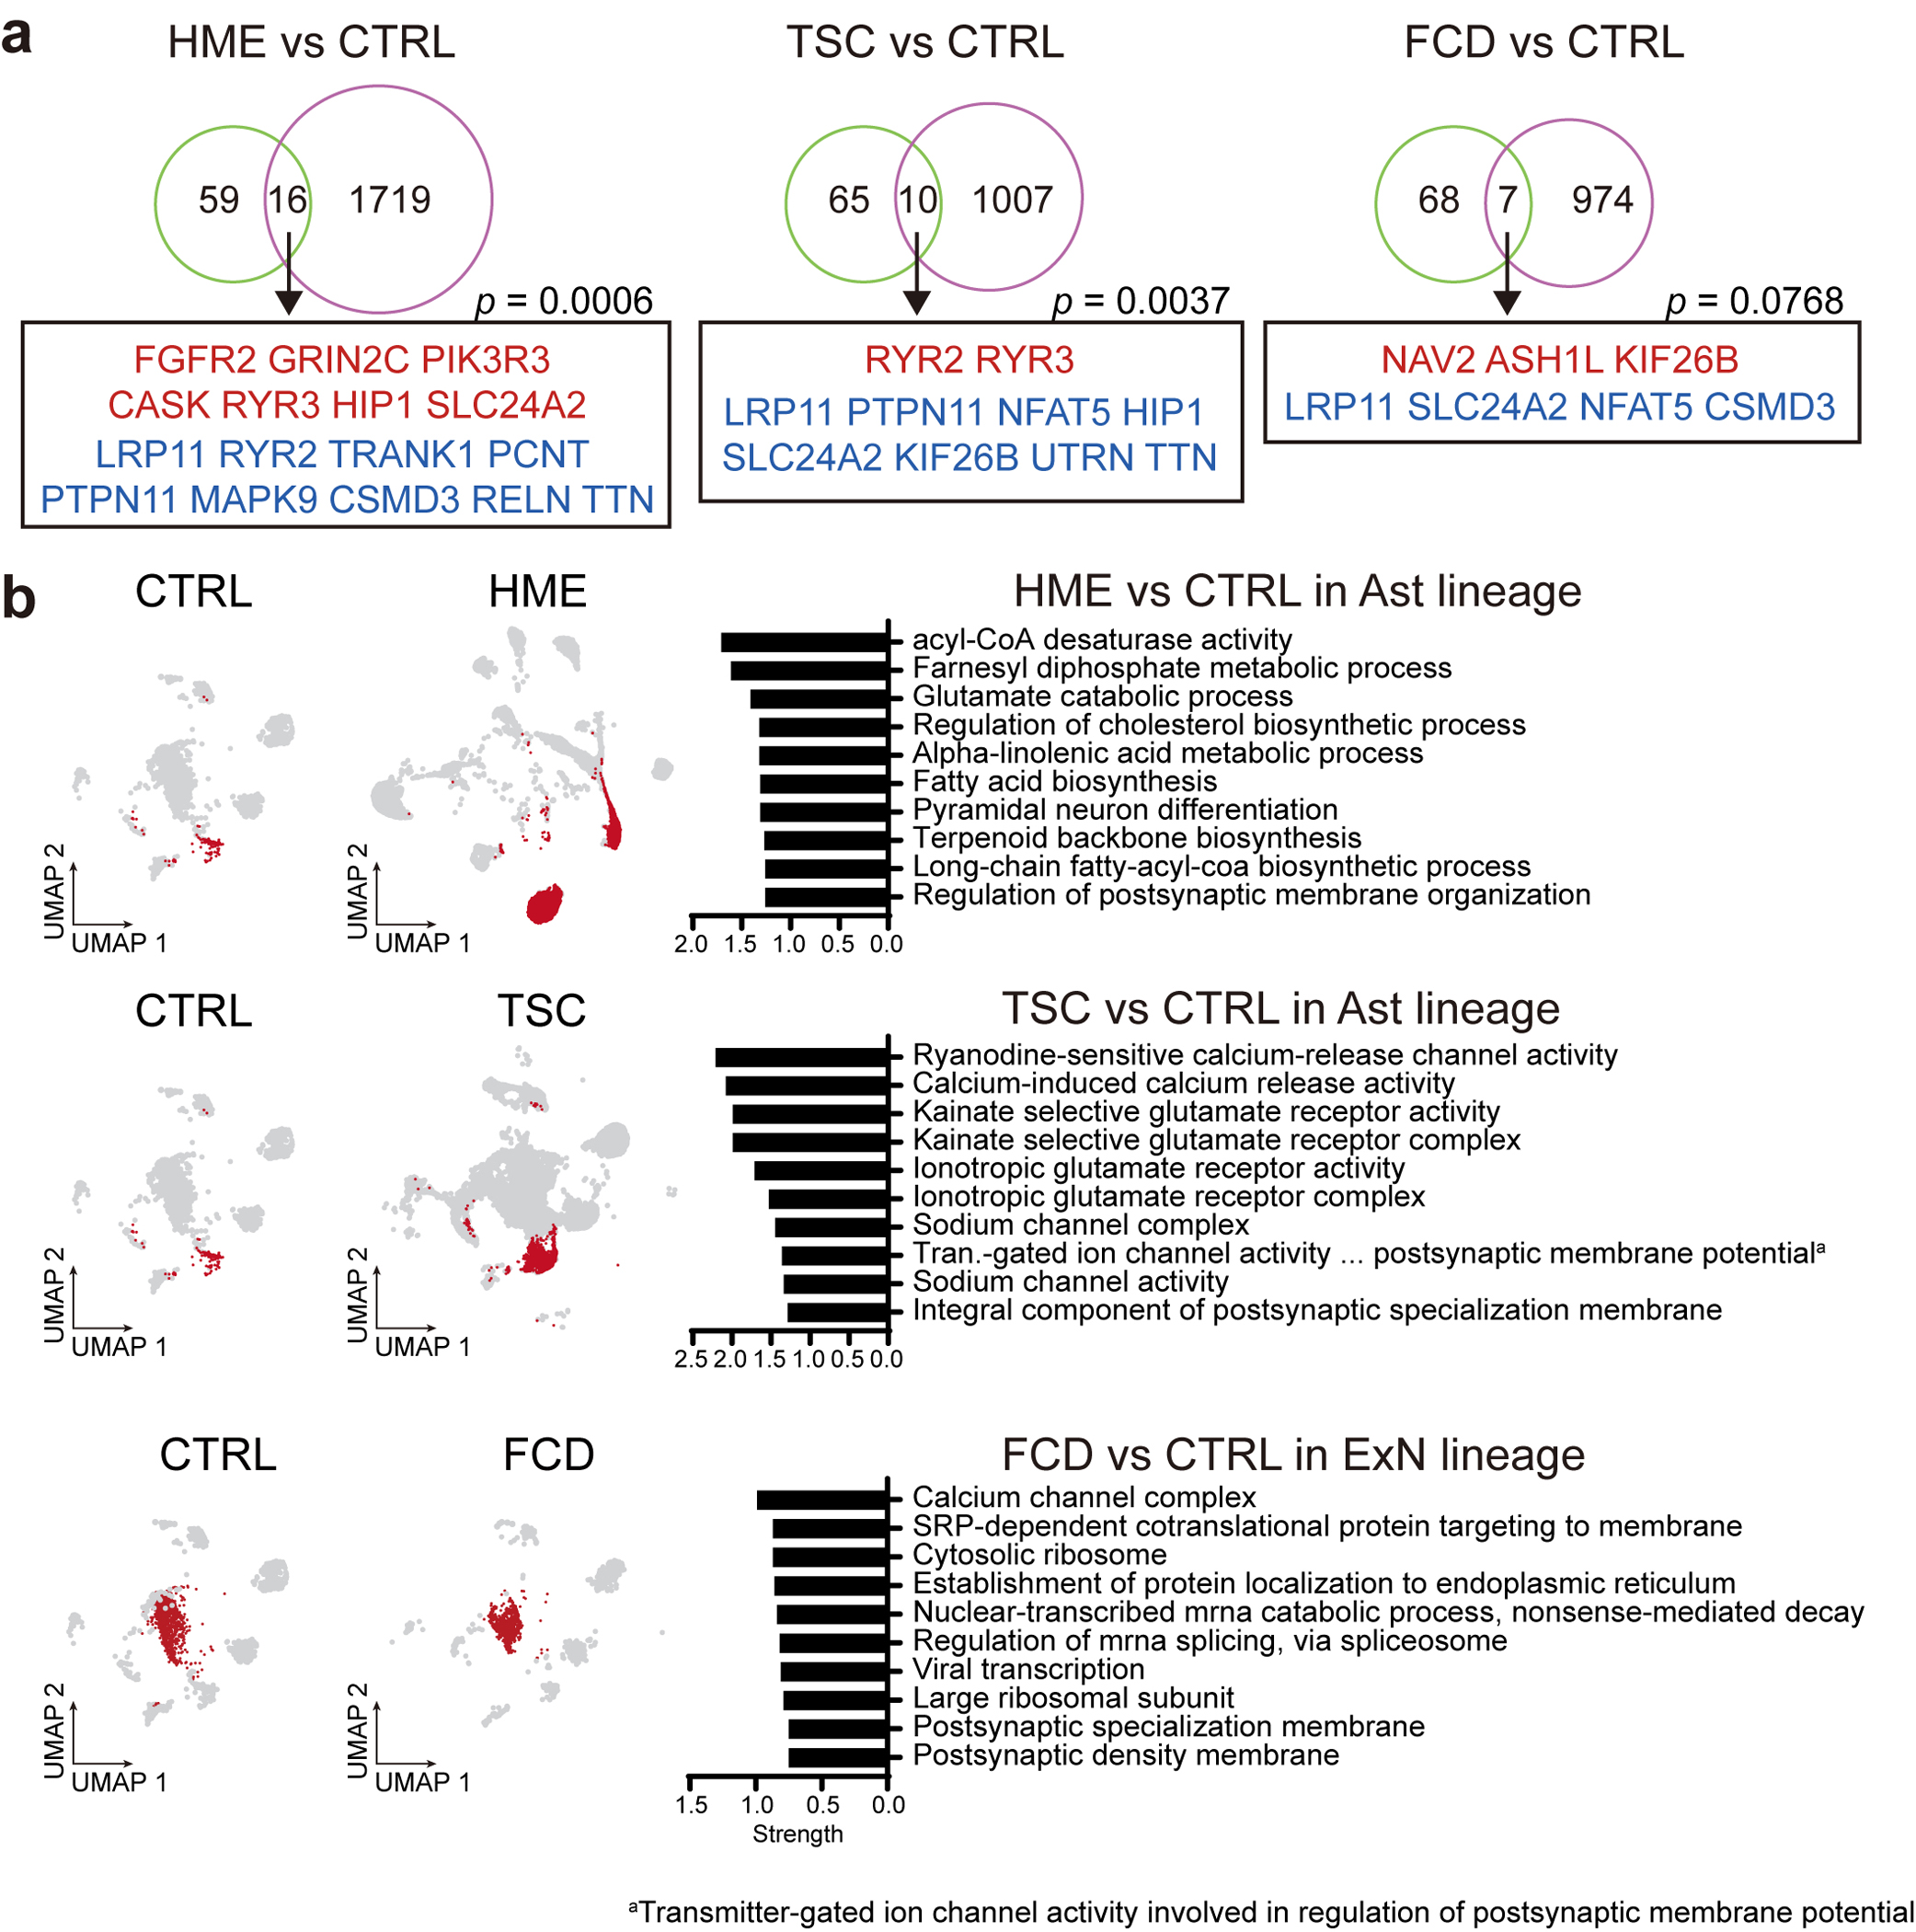
(a) The 75 MCD genes overlap with DEGs of MCDs in contrast to controls. p-values derived from permutation tests (10,000 times) show a chance to show this overlap in a random sampling of DEGs from 19909 protein-coding genes used in these DEGs. Red or blue coloring of gene names indicates upregulated or downregulated DEGs in MCDs compared to CTRLs, respectively. HME and TSC show significant overlap with the MCD genes whereas an FCD case with low VAF did not, which is probably because of low VAF. One-sided permutation test. (b) Cell-lineage specific DEGs compared to the according to normal cell lineage of CTRL represent alterations of mTOR downstream pathways, calcium dynamics, and synaptic functions across. Red dots in UMAPs indicate the cells that participated in the comparison. Top 10 enriched GO or KEGG terms representing lineage-specific DEGs.
Supplementary Material
Supplementary Table 1. The cohort list and corresponding sequencing methods. The 293 cases are listed in each row and corresponding sequencing methods used for a given sample were described.
Supplementary Table 2. AmpliSeq primer pool designs. (a) Ampliseq primer pool design used in phase 1. (b) Highlighting table for the known genes where somatic or germline variants are previously detected in FCD/HMEs and the candidate ones known as PI3K-AKT3-mTOR interactors (c) Ampliseq primer pool design used in phase 3.
Supplementary Table 3. Summary of SNV calls across three phases of genetic discovery. (a) 1811 raw sSNV calls derived from the combination of variant callers described in Extended Data Fig. 1b. (b) Validated 108 brain sSNVs from (a). (c) Annotation table of the genes listed in (b) based on GO terms.
Supplementary Table 4. Summary of phenotype and genotype information for the ‘genetically solved’ cases.
Supplementary Table 5. Summary table for snRNAseq DEG and WGCNA analysis. (a) Cell markers are generated by the FindAllMarkers function in the Seurat v4 package. (b) 11 MEs and their gene members are generated by WGCNA. (c) DEG analysis results include all cell types or in a cell-type-restricted manner. (d) All enriched terms from DEGs.
Supplementary Table 6. Summary table for false discovery estimation.
Supplementary Table 7. Estimation of probability of observing recurrency in mutated genes in MCD.
Supplementary Table 8. Primer sequences used in TASeq for orthogonal validation and quantification of mosaic mutations detected in AmpliSeq and WES sequencing.
Supplementary Table 9. Detailed statistical information on Fig.1d, Fig. 3, Extended Data Fig. 5 and 6.
Acknowledgments
AmpliSeq, TASeq, and snRNAseq were supported by NIH P30CA023100 and S10OD026929 at the UCSD IGM Genomics Center. Rady Children’s Institute for Genomic Medicine, Broad Institute (U54HG003067, UM1HG008900), the Yale Center for Mendelian Disorders (U54HG006504), and the New York Genome Center provided whole-exome sequencing. UCSD Microscopy core (NINDS P30NS047101) provided imaging support. UCSD Tissue Technology Shared Resources Team (National Cancer Institute Cancer Center Support Grant, P30CA23100) supported paraffin sectioning and H&E staining. This study is supported by the 2021 NARSAD Young Investigator Grant from Brain & Behavior Research Foundation (30598 to CC), NIH (NIMH U01MH108898 and R01MH124890 to JGG and GWM, and NIA R21AG070462, NINDS R01NS083823 to JGG), the Regione Toscana under the Call for Health 2018 (DECODE-EE to RG) and Fondazione Cassa di Risparmio di Firenze (to RG). Fig. 1b and Fig. 3a are created with BioRender.com. The funders had no role in the study design, data collection, analysis, decision to publish, or preparation of the manuscript.
Footnotes
Competing Interests Statement
The authors declare no competing interests.
Peer review information:
Nature Genetics thanks Jean-Baptiste Rivière and the other, anonymous, reviewer(s) for their contribution to the peer review of this work.
Code availability
Code to generate the figures and analyze the data are publically available on GitHub73 (https://github.com/shishenyxx/MCD_mosaic).
Focal Cortical Dysplasia Neurogenetics Consortium
Joseph G. Gleeson1, Marilyn Jones1, Diane Masser-Frye1, Shifteh Sattar1, Mark Nespeca1, David D. Gonda1, Katsumi Imai2, Yukitoshi Takahashi2, Hsin-Hung Chen3, Jin-Wu Tsai4, Valerio Conti, Renzo Guerrini5, Orrin Devinsky6, Helio R. Machado7, Camila Araújo Bernardino Garcia7, Wilson A. Silva Jr.7, Se Hoon Kim8, Hoon-Chul Kang8, Yasemin Alanay9, Seema Kapoor10, Carola A. Haas11, Georgia Ramantani12, Thomas Feuerstein12, Ingmar Blumcke13, Robyn Busch13, Zhong Ying13, Vadym Biloshytsky14, Kostiantyn Kostiuk14, Eugene Pedachenko14, Gary W. Mathern15, Christina A. Gurnett16, Matthew D. Smyth16, Ingo Helbig17, Benjamin C. Kennedy17, Judy Liu18, Felix Chan18, Darcy Krueger19, Richard Frye20, Angus Wilfong20, David Adelson20, William Gaillard21, Chima Oluigbo21, Anne Anderson22
1Rady Children’s Hospital, San Diego, CA, USA
2Shizuoka Institute of Epilepsy and Neurological Disorders, Shizuoka, Japan
3Taipei Veterans General Hospital, Taipei City, Taiwan
4National Yang Ming Chiao Tung University, Taipei City, Taiwan
5A. Meyer Children's Hospital, University of Florence, Firenze, Italy
6New York University Langone Health, New York, NY, USA
7University of São Paulo (USP), Ribeirão Preto, Brazil
8Severance Hospital, Yonsei University College of Medicine, Seoul, South Korea
9Acibadem Hospital, Istanbul, Turkey
10Lok Nayak Hospital & Maualana Azad Medical Center, New Delhi, India
11University of Freiburg, Freiburg, Germany
12Albert-Ludwigs University, Freiburg, Germany
13University Hopsital Erlangen, Erlangen, Germany
14Romodanov Institute of Neurosurgery, Kyiv, Ukraine
15University of California at Los Angeles, CA, USA
16St. Louis Children’s Hospital, Washington University St Louis, MO, USA
17Children's Hospital Philadelphia, PA, USA
18Brown University, Providence, RI, USA
19Cincinnati Children's Hospital, Cincinnati, OH, USA
20Barrow Neurological Institute at Phoenix Children's Hospital, University Arizona College of Medicine, Phoenix, AZ, USA
21Children's National Hospital, Washington DC, USA
22Baylor College of Medicine, Texas Children's Hospital, Houston, TX, USA
Brain Somatic Mosaicism Network
Alice Lee1, August Yue Huang1, Alissa D'Gama1, Caroline Dias1, Christopher A. Walsh1, Eduardo Maury1, Javier Ganz1, Michael Lodato1, Michael Miller1, Pengpeng Li1, Rachel Rodin1, Rebeca Borges-Monroy1, Robert Hill1, Sara Bizzotto1, Sattar Khoshkhoo1, Sonia Kim1, Zinan Zhou1, Alice Lee2, Alison Barton2, Alon Galor2, Chong Chu2, Craig Bohrson2, Doga Gulhan2, Eduardo Maury2, Elaine Lim2, Euncheon Lim2, Giorgio Melloni2, Isidro Cortes2, Jake Lee2, Joe Luquette2, Lixing Yang2, Maxwell Sherman2, Michael Coulter2, Minseok Kwon2, Peter J. Park2, Rebeca Borges-Monroy2, Semin Lee2, Sonia Kim2, Soo Lee2, Vinary Viswanadham2, Yanmei Dou2, Andrew J. Chess3, Attila Jones3, Chaggai Rosenbluh3, Schahram Akbarian3, Ben Langmead4, Jeremy Thorpe4, Sean Cho4, Andrew Jaffe5, Apua Paquola5, Daniel Weinberger5, Jennifer Erwin5, Jooheon Shin5, Michael McConnell5, Richard Straub5, Rujuta Narurkar5, Alexej Abyzov6, Taejeong Bae6, Yeongjun Jang6, Yifan Wang6, Anjene Addington7, Geetha Senthil7, Cindy Molitor8, Mette Peters8, Fred H. Gage9, Meiyan Wang9, Patrick Reed9, Sara Linker9, Alexander Urban10, Bo Zhou10, Reenal Pattni10, Xiaowei Zhu10, Aitor Serres Amero11, David Juan11, Inna Povolotskaya11, Irene Lobon11, Manuel Solis Moruno11, Raquel Garcia Perez11, Tomas Marques-Bonet11, Eduardo Soriano12, Gary Mathern13, Danny Antaki14, Dan Averbuj14, Eric Courchesne14, Joseph G. Gleeson14, Laurel L. Ball14, Martin W. Breuss14, Subhojit Roy14, Xiaoxu Yang14, Changuk Chung14, Chen Sun15, Diane A. Flasch15, Trenton J. Frisbie Trenton15, Huira C. Kopera15, Jeffrey M. Kidd15, John B. Moldovan15, John V. Moran15, Kenneth Y. Kwan15, Ryan E. Mills15, Sarah B. Emery15, Weichen Zhou15, Xuefang Zhao15, Aakrosh Ratan16, Adriana Cherskov17, Alexandre Jourdon17, Flora M. Vaccarino17, Liana Fasching17, Nenad Sestan17, Sirisha Pochareddy17, Soraya Scuder17
1Boston Children’s Hospital, Boston, MA, USA
2Harvard University, Boston, MA, USA
3Icahn School of Medicine at Mount Sinai, New York, NY, USA
4Kennedy Krieger Institute, Baltimore, MD, USA
5Lieber Institute for Brain Development, Baltimore, MD, USA
6Mayo Clinic, Rochester, MN, USA
7National Institute of Mental Health (NIMH), Bethesda, MD, USA
8Sage Bionetworks Seattle, WA, USA
9Salk Institute for Biological Studies, La Jolla, CA, USA
10Stanford University CA, USA
11Universitat Pompeu Fabra, Barcelona, Spain
12University of Barcelona, Barcelona, Spain
13University of California, Los Angeles, CA, USA
14University of California, San Diego, La Jolla, CA, USA
15University of Michigan, Ann Arbor, MI, USA
16University of Virginia, Charlottesville, VA, USA
17Yale University, New Haven, CT, USA
Data availability
WES and AmpliSeq data are deployed on NIMH Data Archive under study number 1484 “Comprehensive multi-omic profiling of somatic mutations in malformations of cortical development” and SRA under accession number PRJNA821916: “Comprehensive multi-omic profiling of somatic mutations in malformations of cortical development”. The BSMN neurotypical brain data are available at NIMH Data Archive (NDA study 644, 792 and 919, https://nda.nih.gov/study.html?tab=result&id=644, https://nda.nih.gov/study.html?tab=result&id=792 and https://nda.nih.gov/study.html?tab=result&id=919) and SRA: PRJNA736951. The raw and processed snRNAseq dataset was deposited in Gene Expression Omnibus (GEO) under accession number GSE218022.
gnomAD: https://gnomad.broadinstitute.org/
COSMIC: https://cancer.sanger.ac.uk/cosmic/
STRING: https://string-db.org/
Single-cell RNA-seq data from developing cortex (Nowakowski et al., 2017): https://cells.ucsc.edu/?ds=cortex-dev
GRCh37 genome accession number: PRJNA31257
References
- 1.Leventer RJ, Guerrini R & Dobyns WB Malformations of cortical development and epilepsy. Dialogues Clin Neurosci 10, 47–62 (2008). [DOI] [PMC free article] [PubMed] [Google Scholar]
- 2.Barkovich AJ, Dobyns WB & Guerrini R Malformations of cortical development and epilepsy. Cold Spring Harb Perspect Med 5, a022392 (2015). [DOI] [PMC free article] [PubMed] [Google Scholar]
- 3.Blumcke I et al. The clinicopathologic spectrum of focal cortical dysplasias: a consensus classification proposed by an ad hoc Task Force of the ILAE Diagnostic Methods Commission. Epilepsia 52, 158–74 (2011). [DOI] [PMC free article] [PubMed] [Google Scholar]
- 4.Choi SA & Kim KJ The Surgical and Cognitive Outcomes of Focal Cortical Dysplasia. J Korean Neurosurg Soc 62, 321–327 (2019). [DOI] [PMC free article] [PubMed] [Google Scholar]
- 5.Krsek P et al. Different features of histopathological subtypes of pediatric focal cortical dysplasia. Ann Neurol 63, 758–69 (2008). [DOI] [PubMed] [Google Scholar]
- 6.Bast T, Ramantani G, Seitz A & Rating D Focal cortical dysplasia: prevalence, clinical presentation and epilepsy in children and adults. Acta Neurol Scand 113, 72–81 (2006). [DOI] [PubMed] [Google Scholar]
- 7.Poduri A et al. Somatic activation of AKT3 causes hemispheric developmental brain malformations. Neuron 74, 41–8 (2012). [DOI] [PMC free article] [PubMed] [Google Scholar]
- 8.Lee JH et al. De novo somatic mutations in components of the PI3K-AKT3-mTOR pathway cause hemimegalencephaly. Nat Genet 44, 941–5 (2012). [DOI] [PMC free article] [PubMed] [Google Scholar]
- 9.Baldassari S et al. Dissecting the genetic basis of focal cortical dysplasia: a large cohort study. Acta Neuropathol 138, 885–900 (2019). [DOI] [PMC free article] [PubMed] [Google Scholar]
- 10.Lai D et al. Somatic variants in diverse genes leads to a spectrum of focal cortical malformations. Brain (2022). [DOI] [PMC free article] [PubMed] [Google Scholar]
- 11.Bedrosian TA et al. Detection of brain somatic variation in epilepsy-associated developmental lesions. Epilepsia (2022). [DOI] [PubMed] [Google Scholar]
- 12.Sim NS et al. Precise detection of low-level somatic mutation in resected epilepsy brain tissue. Acta Neuropathol 138, 901–912 (2019). [DOI] [PubMed] [Google Scholar]
- 13.Dou Y et al. Accurate detection of mosaic variants in sequencing data without matched controls. Nat Biotechnol 38, 314–319 (2020). [DOI] [PMC free article] [PubMed] [Google Scholar]
- 14.Yang X et al. Control-independent mosaic single nucleotide variant detection with DeepMosaic. Nat Biotechnol (2022). doi.org/ 10.1038/s41587-022-01559-w [DOI] [PMC free article] [PubMed] [Google Scholar]
- 15.Huang AY et al. MosaicHunter: accurate detection of postzygotic single-nucleotide mosaicism through next-generation sequencing of unpaired, trio, and paired samples. Nucleic Acids Res 45, e76 (2017). [DOI] [PMC free article] [PubMed] [Google Scholar]
- 16.Wang Y et al. Comprehensive identification of somatic nucleotide variants in human brain tissue. Genome Biol 22, 92 (2021). [DOI] [PMC free article] [PubMed] [Google Scholar]
- 17.Breuss MW et al. Autism risk in offspring can be assessed through quantification of male sperm mosaicism. Nat Med 26, 143–150 (2020). [DOI] [PMC free article] [PubMed] [Google Scholar]
- 18.Yang X et al. Developmental and temporal characteristics of clonal sperm mosaicism. Cell 184, 4772–4783 e15 (2021). [DOI] [PMC free article] [PubMed] [Google Scholar]
- 19.Garcia CAB et al. mTOR pathway somatic variants and the molecular pathogenesis of hemimegalencephaly. Epilepsia Open 5, 97–106 (2020). [DOI] [PMC free article] [PubMed] [Google Scholar]
- 20.Pelorosso C et al. Somatic double-hit in MTOR and RPS6 in hemimegalencephaly with intractable epilepsy. Hum Mol Genet 28, 3755–3765 (2019). [DOI] [PMC free article] [PubMed] [Google Scholar]
- 21.Breuss MW et al. Somatic mosaicism in the mature brain reveals clonal cellular distributions during cortical development. Nature (2022). [Google Scholar]
- 22.Lai D et al. Somatic mutation involving diverse genes leads to a spectrum of focal cortical malformations. medRxiv (2021). [DOI] [PMC free article] [PubMed] [Google Scholar]
- 23.Lee WS et al. Gradient of brain mosaic RHEB variants causes a continuum of cortical dysplasia. Ann Clin Transl Neurol 8, 485–490 (2021). [DOI] [PMC free article] [PubMed] [Google Scholar]
- 24.Bae T et al. Somatic mutations reveal hypermutable brains and are associated with neuropsychiatric disorders. medRxiv (2022). [Google Scholar]
- 25.Bozic I et al. Accumulation of driver and passenger mutations during tumor progression. Proc Natl Acad Sci U S A 107, 18545–50 (2010). [DOI] [PMC free article] [PubMed] [Google Scholar]
- 26.Alexandrov LB et al. The repertoire of mutational signatures in human cancer. Nature 578, 94–101 (2020). [DOI] [PMC free article] [PubMed] [Google Scholar]
- 27.Kim M & Costello J DNA methylation: an epigenetic mark of cellular memory. Exp Mol Med 49, e322 (2017). [DOI] [PMC free article] [PubMed] [Google Scholar]
- 28.Szklarczyk D et al. STRING v11: protein-protein association networks with increased coverage, supporting functional discovery in genome-wide experimental datasets. Nucleic Acids Res 47, D607–D613 (2019). [DOI] [PMC free article] [PubMed] [Google Scholar]
- 29.Bedrosian TA et al. Detection of brain somatic variation in epilepsy-associated developmental lesions. medRxiv (2021). [DOI] [PubMed] [Google Scholar]
- 30.Tarabeux J et al. Rare mutations in N-methyl-D-aspartate glutamate receptors in autism spectrum disorders and schizophrenia. Transl Psychiatry 1, e55 (2011). [DOI] [PMC free article] [PubMed] [Google Scholar]
- 31.Bezprozvanny I Calcium signaling and neurodegenerative diseases. Trends Mol Med 15, 89–100 (2009). [DOI] [PMC free article] [PubMed] [Google Scholar]
- 32.van den Berg DLC et al. Nipbl Interacts with Zfp609 and the Integrator Complex to Regulate Cortical Neuron Migration. Neuron 93, 348–361 (2017). [DOI] [PMC free article] [PubMed] [Google Scholar]
- 33.Yang YJ et al. Microcephaly gene links trithorax and REST/NRSF to control neural stem cell proliferation and differentiation. Cell 151, 1097–112 (2012). [DOI] [PMC free article] [PubMed] [Google Scholar]
- 34.Massimino L et al. TBR2 antagonizes retinoic acid dependent neuronal differentiation by repressing Zfp423 during corticogenesis. Dev Biol 434, 231–248 (2018). [DOI] [PMC free article] [PubMed] [Google Scholar]
- 35.Su MY et al. Hybrid Structure of the RagA/C-Ragulator mTORC1 Activation Complex. Mol Cell 68, 835–846 e3 (2017). [DOI] [PMC free article] [PubMed] [Google Scholar]
- 36.Chen J et al. KLHL22 activates amino-acid-dependent mTORC1 signalling to promote tumorigenesis and ageing. Nature 557, 585–589 (2018). [DOI] [PubMed] [Google Scholar]
- 37.Behar TN et al. Glutamate acting at NMDA receptors stimulates embryonic cortical neuronal migration. J Neurosci 19, 4449–61 (1999). [DOI] [PMC free article] [PubMed] [Google Scholar]
- 38.Paoletti P, Bellone C & Zhou Q NMDA receptor subunit diversity: impact on receptor properties, synaptic plasticity and disease. Nat Rev Neurosci 14, 383–400 (2013). [DOI] [PubMed] [Google Scholar]
- 39.Strehlow V et al. GRIN2A-related disorders: genotype and functional consequence predict phenotype. Brain 142, 80–92 (2019). [DOI] [PMC free article] [PubMed] [Google Scholar]
- 40.Prickett TD & Samuels Y Molecular pathways: dysregulated glutamatergic signaling pathways in cancer. Clin Cancer Res 18, 4240–6 (2012). [DOI] [PMC free article] [PubMed] [Google Scholar]
- 41.Tate JG et al. COSMIC: the Catalogue Of Somatic Mutations In Cancer. Nucleic Acids Res 47, D941–D947 (2019). [DOI] [PMC free article] [PubMed] [Google Scholar]
- 42.Ruvinsky I & Meyuhas O Ribosomal protein S6 phosphorylation: from protein synthesis to cell size. Trends Biochem Sci 31, 342–8 (2006). [DOI] [PubMed] [Google Scholar]
- 43.Sumimoto H, Imabayashi F, Iwata T & Kawakami Y The BRAF-MAPK signaling pathway is essential for cancer-immune evasion in human melanoma cells. J Exp Med 203, 1651–6 (2006). [DOI] [PMC free article] [PubMed] [Google Scholar]
- 44.Ornitz DM & Itoh N The Fibroblast Growth Factor signaling pathway. Wiley Interdiscip Rev Dev Biol 4, 215–66 (2015). [DOI] [PMC free article] [PubMed] [Google Scholar]
- 45.Chen X et al. TNF-alpha-Induced NOD2 and RIP2 Contribute to the Up-Regulation of Cytokines Induced by MDP in Monocytic THP-1 Cells. J Cell Biochem 119, 5072–5081 (2018). [DOI] [PubMed] [Google Scholar]
- 46.Yates TM et al. SLC35A2-related congenital disorder of glycosylation: Defining the phenotype. Eur J Paediatr Neurol 22, 1095–1102 (2018). [DOI] [PubMed] [Google Scholar]
- 47.Paganini C et al. Calcium activated nucleotidase 1 (CANT1) is critical for glycosaminoglycan biosynthesis in cartilage and endochondral ossification. Matrix Biol 81, 70–90 (2019). [DOI] [PMC free article] [PubMed] [Google Scholar]
- 48.Lee N et al. Neuronal migration disorders: positron emission tomography correlations. Ann Neurol 35, 290–7 (1994). [DOI] [PubMed] [Google Scholar]
- 49.Kim YH et al. Neuroimaging in identifying focal cortical dysplasia and prognostic factors in pediatric and adolescent epilepsy surgery. Epilepsia 52, 722–7 (2011). [DOI] [PubMed] [Google Scholar]
- 50.Nowakowski TJ et al. Spatiotemporal gene expression trajectories reveal developmental hierarchies of the human cortex. Science 358, 1318–1323 (2017). [DOI] [PMC free article] [PubMed] [Google Scholar]
- 51.Kim JK et al. Brain somatic mutations in MTOR reveal translational dysregulations underlying intractable focal epilepsy. J Clin Invest 129, 4207–4223 (2019). [DOI] [PMC free article] [PubMed] [Google Scholar]
- 52.Li RJ et al. Regulation of mTORC1 by lysosomal calcium and calmodulin. Elife 5(2016). [DOI] [PMC free article] [PubMed] [Google Scholar]
- 53.Hoeffer CA & Klann E mTOR signaling: at the crossroads of plasticity, memory and disease. Trends Neurosci 33, 67–75 (2010). [DOI] [PMC free article] [PubMed] [Google Scholar]
- 54.Laplante M & Sabatini DM Regulation of mTORC1 and its impact on gene expression at a glance. J Cell Sci 126, 1713–9 (2013). [DOI] [PMC free article] [PubMed] [Google Scholar]
- 55.Coe BP et al. Neurodevelopmental disease genes implicated by de novo mutation and copy number variation morbidity. Nat Genet 51, 106–116 (2019). [DOI] [PMC free article] [PubMed] [Google Scholar]
- 56.Ridley AJ et al. Cell migration: integrating signals from front to back. Science 302, 1704–9 (2003). [DOI] [PubMed] [Google Scholar]
- 57.Brini M, Cali T, Ottolini D & Carafoli E Neuronal calcium signaling: function and dysfunction. Cell Mol Life Sci 71, 2787–814 (2014). [DOI] [PMC free article] [PubMed] [Google Scholar]
- 58.Lamparello P et al. Developmental lineage of cell types in cortical dysplasia with balloon cells. Brain 130, 2267–76 (2007). [DOI] [PubMed] [Google Scholar]
- 59.Englund C, Folkerth RD, Born D, Lacy JM & Hevner RF Aberrant neuronal-glial differentiation in Taylor-type focal cortical dysplasia (type IIA/B). Acta Neuropathol 109, 519–33 (2005). [DOI] [PubMed] [Google Scholar]
Method-only references
- 60.Kim S et al. Strelka2: fast and accurate calling of germline and somatic variants. Nat Methods 15, 591–594 (2018). [DOI] [PubMed] [Google Scholar]
- 61.Benjamin D et al. Calling Somatic SNVs and Indels with Mutect2. bioRxiv (2019). [Google Scholar]
- 62.Yang X et al. Genomic mosaicism in paternal sperm and multiple parental tissues in a Dravet syndrome cohort. Sci Rep 7, 15677 (2017). [DOI] [PMC free article] [PubMed] [Google Scholar]
- 63.O'Roak BJ et al. Multiplex targeted sequencing identifies recurrently mutated genes in autism spectrum disorders. Science 338, 1619–22 (2012). [DOI] [PMC free article] [PubMed] [Google Scholar]
- 64.Krumm N et al. Excess of rare, inherited truncating mutations in autism. Nat Genet 47, 582–8 (2015). [DOI] [PMC free article] [PubMed] [Google Scholar]
- 65.Piovesan A et al. Human protein-coding genes and gene feature statistics in 2019. BMC Res Notes 12, 315 (2019). [DOI] [PMC free article] [PubMed] [Google Scholar]
- 66.Untergasser A et al. Primer3Plus, an enhanced web interface to Primer3. Nucleic Acids Res 35, W71–4 (2007). [DOI] [PMC free article] [PubMed] [Google Scholar]
- 67.Untergasser A et al. Primer3--new capabilities and interfaces. Nucleic Acids Res 40, e115 (2012). [DOI] [PMC free article] [PubMed] [Google Scholar]
- 68.Lee J et al. Mutalisk: a web-based somatic MUTation AnaLyIS toolKit for genomic, transcriptional and epigenomic signatures. Nucleic Acids Res 46, W102–W108 (2018). [DOI] [PMC free article] [PubMed] [Google Scholar]
- 69.Bindea G et al. ClueGO: a Cytoscape plug-in to decipher functionally grouped gene ontology and pathway annotation networks. Bioinformatics 25, 1091–3 (2009). [DOI] [PMC free article] [PubMed] [Google Scholar]
- 70.Koizumi H, Tanaka T & Gleeson JG Doublecortin-like kinase functions with doublecortin to mediate fiber tract decussation and neuronal migration. Neuron 49, 55–66 (2006). [DOI] [PubMed] [Google Scholar]
- 71.Langfelder P & Horvath S WGCNA: an R package for weighted correlation network analysis. BMC Bioinformatics 9, 559 (2008). [DOI] [PMC free article] [PubMed] [Google Scholar]
- 72.Wang F et al. RNAscope: a novel in situ RNA analysis platform for formalin-fixed, paraffin-embedded tissues. J Mol Diagn 14, 22–9 (2012). [DOI] [PMC free article] [PubMed] [Google Scholar]
- 73.Yang X & Chung C shishenyxx/MCD_mosaic: MCD mosaic codes v1.0.0. (Zenodo, 2022). doi: 10.5281/ZENODO.7196403. [DOI] [Google Scholar]
Associated Data
This section collects any data citations, data availability statements, or supplementary materials included in this article.
Supplementary Materials
Supplementary Table 1. The cohort list and corresponding sequencing methods. The 293 cases are listed in each row and corresponding sequencing methods used for a given sample were described.
Supplementary Table 2. AmpliSeq primer pool designs. (a) Ampliseq primer pool design used in phase 1. (b) Highlighting table for the known genes where somatic or germline variants are previously detected in FCD/HMEs and the candidate ones known as PI3K-AKT3-mTOR interactors (c) Ampliseq primer pool design used in phase 3.
Supplementary Table 3. Summary of SNV calls across three phases of genetic discovery. (a) 1811 raw sSNV calls derived from the combination of variant callers described in Extended Data Fig. 1b. (b) Validated 108 brain sSNVs from (a). (c) Annotation table of the genes listed in (b) based on GO terms.
Supplementary Table 4. Summary of phenotype and genotype information for the ‘genetically solved’ cases.
Supplementary Table 5. Summary table for snRNAseq DEG and WGCNA analysis. (a) Cell markers are generated by the FindAllMarkers function in the Seurat v4 package. (b) 11 MEs and their gene members are generated by WGCNA. (c) DEG analysis results include all cell types or in a cell-type-restricted manner. (d) All enriched terms from DEGs.
Supplementary Table 6. Summary table for false discovery estimation.
Supplementary Table 7. Estimation of probability of observing recurrency in mutated genes in MCD.
Supplementary Table 8. Primer sequences used in TASeq for orthogonal validation and quantification of mosaic mutations detected in AmpliSeq and WES sequencing.
Supplementary Table 9. Detailed statistical information on Fig.1d, Fig. 3, Extended Data Fig. 5 and 6.
Data Availability Statement
WES and AmpliSeq data are deployed on NIMH Data Archive under study number 1484 “Comprehensive multi-omic profiling of somatic mutations in malformations of cortical development” and SRA under accession number PRJNA821916: “Comprehensive multi-omic profiling of somatic mutations in malformations of cortical development”. The BSMN neurotypical brain data are available at NIMH Data Archive (NDA study 644, 792 and 919, https://nda.nih.gov/study.html?tab=result&id=644, https://nda.nih.gov/study.html?tab=result&id=792 and https://nda.nih.gov/study.html?tab=result&id=919) and SRA: PRJNA736951. The raw and processed snRNAseq dataset was deposited in Gene Expression Omnibus (GEO) under accession number GSE218022.
gnomAD: https://gnomad.broadinstitute.org/
COSMIC: https://cancer.sanger.ac.uk/cosmic/
STRING: https://string-db.org/
Single-cell RNA-seq data from developing cortex (Nowakowski et al., 2017): https://cells.ucsc.edu/?ds=cortex-dev
GRCh37 genome accession number: PRJNA31257


