Abstract
Mast cells undergo cytoskeletal restructuring to allow secretory granules passage through the cortical actomyosin barrier to fuse with the plasma membrane and release inflammatory mediators. Protein phosphorylation is believed to regulate these rearrangements. Although some of the protein kinases implicated in this phosphorylation are known, the relevant protein phosphatases are not. At the peak rate of antigen-induced granule mediator release (2.5 min), protein phosphatases PP1 and PP2A, along with actin and myosin II, are transiently relocated to ruffles on the apical surface and a band at the peripheral edge of the cell. This leaves an area between the nucleus and the peripheral edge significantly depleted (3–5-fold) in these proteins. Phorbol 12-myristate 13-acetate (PMA) plus A23187 induces the same changes, at a time coincident with its slower rate of secretion. Coimmunoprecipitation experiments demonstrated a significantly increased association of myosin with PP1 and PP2A at the time of peak mediator release, with levels of association decreasing by 5 min. Jasplakinolide, an inhibitor of actin assembly, inhibits secretion and the cytoskeletal rearrangements. Surprisingly, jasplakinolide also affects myosin, inducing the formation of short rods throughout the cytoplasm. Inhibition of PP2A inhibited secretion, the cytoskeletal rearrangements, and led to increased phosphorylation of the myosin heavy and light chains at protein kinase C-specific sites. These findings indicate that a dynamic actomyosin cytoskeleton, partially regulated by both PP1 and PP2A, is required for mast cell secretion.
INTRODUCTION
The cross-linking of receptor-bound IgE on the mast cell surface triggers a sequence of intracellular events that culminate in the extracellular release of potent inflammatory mediators, many of which are stored in the secretory granules (Razin et al., 1995; Beaven and Baumgartner, 1996). Conversely, mast cell granule mediators, especially tumor necrosis factor-α have also been shown to play a central role in the defense against bacterial infection (Echtenacher et al., 1996; Malaviya et al., 1996). Therefore, understanding the mechanism through which mast cells release these mediators is of broad physiological importance.
In mast cells, the proteins regulating the heterotypic fusion process between the secretory granules and plasma membrane have been identified as soluble N-ethylmaleimide-sensitive factor attachment protein receptor-related proteins (Guo et al., 1998; Hibi et al., 2000). However, the granules in mast cells are kept apart from their fusion sites on the plasma membrane by a cortical cytoskeletal barrier made up predominantly of actin and myosin. How the granules are moved toward and through this actomyosin barrier to their fusion sites is not understood in any regulated exocytotic cell. Recent studies in a variety of secretory cells, using inhibitors of actin or myosin function, have shown that remodeling of the actomyosin cortex is a prerequisite for regulated exocytosis (Lang et al., 2000; Valentijn et al., 2000).
Exocytosis is accompanied by distinct morphological changes that are believed to facilitate the removal or rearrangement of the cortical barrier (Lang et al., 2000; Oheim and Stuhmer, 2000; Sullivan et al., 2000; Valentijn et al., 2000). In activated mast cells these include the formation of ruffles or lamellae on the apical surface that contain both actin and myosin (Pfeiffer et al., 1985; Sahara et al., 1990; Ludowyke et al., 1994a) and the spreading of the cells upon the underlying substratum (Oliver et al., 1988; Ludowyke et al., 1994a). Correlated with these changes are increased assembly of F-actin (Oliver et al., 1988; Apgar, 1991), the formation of focal adhesions (Kawasugi et al., 1995), and actin- and myosin-containing plaques and filaments on the basal surface (Ludowyke et al., 1994b; Pfeiffer and Oliver, 1994).
The actomyosin cortical web is dynamic; it is rapidly disassembled and assembled in response to extracellular signals, controlled in part by the phosphorylation of myosin at specific sites on the heavy and light chains (Sellers, 1991; Bresnick, 1999). In contrast to smooth muscle, myosin IIA is the only conventional myosin isoform found in RBL-2H3 cells (Choi et al., 1996). In unstimulated cells, the myosin light chain (MLC) is phosphorylated by myosin light chain kinase (MLCK), and the myosin heavy chain (MHC) is phosphorylated at a number of sites by unknown kinases (Ludowyke et al., 1989). Activation of these cells with antigen or calcium ionophore does not affect phosphorylation at these sites, but leads to the phosphorylation of both the heavy chains and light chains by protein kinase C (PKC) at distinct sites (Ludowyke et al., 1989, 1996; Choi et al., 1994). Recent work has shown that the MHC is also phosphorylated by Ca2+/calmodulin-dependent protein kinase II (CaM kinase II) during activation (Buxton and Adelstein, 2000).
The balance of specific kinases and phosphatases dynamically regulates protein phosphorylation. The serine and threonine phosphatases are separated into two main families, defined as PPP and PPM. The predominant members of the PPP family are protein phosphatase type 1 (PP1), PP2A, and PP2B (calcineurin), whereas PP2C is the predominant PPM protein phosphatase. PP1 and PP2A are considered the major intracellular phosphatases, which together account for >90% of all serine/threonine dephosphorylation reactions (Cohen, 1989; Cohen and Cohen, 1989; Mumby and Walter, 1993; Wera and Hemmings, 1995). Although the phosphatases that regulate myosin in mast cells are not known, in muscle cells it is clear that the primary phosphatase affecting the MLC is PP1 (Chisholm and Cohen, 1988; Hartshorne et al., 1998). This phosphatase dephosphorylates the sites phosphorylated by MLCK (Thr-18, Ser-19), but the phosphatases affecting the physiologically important PKC sites on the MLC (Ser-1, Ser-2) or the MHC (Ser-1917) are unknown. There is growing evidence, however, of a role for phosphatases in controlling myosin function in platelets during the massive shape changes that occur during aggregation and secretion (Toyoda et al., 1996; Nakai et al., 1997). Interestingly, in these studies there was a greater association of PP2A with the cytoskeleton after stimulation than PP1, yet the literature suggests that PP1 plays the major role in myosin dephosphorylation. In light of these findings and our recent demonstration of the critical role of PP2A in membrane events during mast cell secretion (Ludowyke et al., 2000), we investigated the association of PP1 and PP2A with the rearranging actomyosin cytoskeleton during mast cell secretion.
MATERIALS AND METHODS
Cell Culture, Activation, and Analysis of Secretion
Tissue culture supplies were obtained from Invitrogen (Carlsbad, CA). Maintenance of monolayer cultures of RBL-2H3 cells was in RPMI with 10% fetal calf serum and carried out as described previously (Ludowyke et al., 1989; Pfeiffer and Oliver, 1994; Kawasugi et al., 1995). Cells (1.5 × 10⁶)/well in six-well culture dishes or 1 × 10⁵ cells/well in eight-well chamber slides (BD Biosciences, Franklin Lakes, NJ) were washed twice and activated at 37°C in buffer A, consisting of 119 mM NaCl, 5 mM KCl, 5.6 mM dextrose, 0.4 mM MgCl2, and 25 mM piperazine-N,N′-bis(2-ethanesulfonic acid); pH 7.2. Buffer A was supplemented with 0.1% bovine serum albumin (BSA) and 1 mM CaCl2 before use. For antigen activation, cells were primed overnight with 75 ng/ml dinitrophenol (DNP)-specific IgE (Sigma Chemical, St. Louis, MO) and activated with 100 ng/ml of the specific antigen DNP24-BSA (24 molecules of DNP conjugated with 1 molecule of BSA, hereafter referred to as DNP-BSA; Calbiochem-Novabiochem, La Jolla, CA). Where required, cells were activated with 50 nM phorbol 12-myristate 13-acetate (PMA) or the combination of 50 nM PMA and 500 nM calcium ionophore A23187 (both from Sigma Chemical). Control samples were incubated with buffer A alone. After the designated time, the reaction was stopped by placing the samples on ice; the supernatant was removed and an aliquot taken for assay of the release of β-hexosaminidase. The total cellular content of β-hexosaminidase was determined after lysis of unstimulated cultures and the activated release was expressed as a percentage of totals. The amount of β-hexosaminidase released was assayed using an absorbance assay with p-nitrophenyl-N-acetyl-β-d-glucosaminide (Sigma Chemical) as the substrate (Ludowyke et al., 2000). When isotopic labeling of cells was required, cells were labeled with 100 μCi/ml of [32P]orthophosphoric acid (Amersham Biosciences AB, Uppsala, Sweden) at 37°C for 2 h in buffer A with the addition of 4 mM glutamine, as previously described (Ludowyke et al., 1989, 1996). The cells were washed three times with buffer A before activation (as described above) or addition of inhibitors. When inhibitors were required, okadaic acid (OA; potassium salt; Calbiochem-Novabiochem) was dissolved in buffer A and jasplakinolide (Molecular Probes, Eugene, OR) was dissolved in dimethyl sulfoxide. The final buffer concentration of dimethyl sulfoxide was no >0.2%, which was added to control cells and had no effects on secretion or morphology (Ludowyke et al., 1998). Cells were preincubated with the inhibitors in activation buffer containing 4 mM glutamine at 37°C for the designated times. Washing the cells free of excess inhibitors had no effect on the inhibitory capacity. Incubation of cells for 45 min or 3 h in buffer alone had no effect on morphology or secretion.
Fluorescence Microscopy
After activation in an eight-well chamber slide as described above, cells were fixed with 200 μl of a solution containing 3% (vol/vol) formaldehyde, 0.1% (vol/vol) gluteraldehyde, and 0.1% Triton X-100 in phosphate-buffered saline (PBS) for 15 min at room temperature. The wells were washed in PBS and nonspecific binding sites were blocked with 5% (wt/vol) skim milk in PBS for 30 min. The wells were incubated for 2 h with specific rabbit polyclonal antibodies raised against peptides derived from the C termini of the catalytic subunits of PP1 or PP2A (as previously defined in Sim et al., 1998), or against nonmuscle myosin (Biomedical Technologies, Stoughton, MA). After washing with PBS the wells were then incubated for 60 min with the fluorescein isothiocyanate (FITC)-labeled secondary antibodies (Amersham Biosciences AB). F-actin was primarily detected using FITC-labeled phalloidin (Sigma Chemical) for 45 min. Alternatively, actin was detected using a monoclonal primary antibody for 2 h followed by an FITC-labeled secondary antibody for 60 min (both from Amersham Biosciences AB). A coverslip was then mounted on top of antiquench reagent (90% glycerol, 10% [vol/vol] PBS, containing 1 mg/ml p-phenylenediamine). Cells were viewed using an Olympus BX60 fluorescence microscope (Olympus, Tokyo, Japan) and Sensicam Imaging (Kelheim, Germany). Images were collected using a 60× oil objective directly into IP Lab Gel before final analysis in Adobe Photoshop (Adobe Systems, Mountain View, CA). Under the same conditions, with any of the primary or secondary antibodies alone, no signal was detected (our unpublished data).
Fluorescence Intensity Measurements
Images of immunostained cells collected directly from the microscope as described above were imported into NIH Image. For single whole cell analysis, a line was marked through the cell, starting outside the periphery at one edge, extending through the nucleus, ending outside the periphery at the opposite edge of the cell. For partial cell analysis, the line was marked from outside the peripheral edge of the cell, 10 μm into the cell (the edge of the nucleus), giving 90 point measurements. Up to three line measurements were taken from at least 10 cells from a number of different experiments, giving a total of 30 measurements. Means and SEs of the data points were used to plot the fluorescence intensity graphs. Intensity graphs show symbol and error bar at every fifth data point. To compare between the control and stimulated cells, 10 points around the peak intensity of the peripheral band or lowest points of the cytoplasmic clearance were compiled and compared with the equivalent points from unstimulated cells or cells 30 min after activation. GraphPad Prism (GraphPad Software, San Diego, CA) was used to analyze the data with a nonparametric paired t test (Wilcoxon signed rank test, two-tailed, confidence interval 95%), giving the significance data shown.
Cell Lysis for Immunoprecipitation and Western Blotting
After activation in a six-well plate as described above, 0.3 ml of ice-cold lysis buffer (buffer B or C; see below) was added and the cells were scraped immediately into microfuge tubes. The immunoprecipitation of myosin was carried out as previously described, using buffer B, containing 250 mM NaCl; 100 mM sodium pyrophosphate; 100 mM sodium fluoride; 10 mM EGTA; 5 mM EDTA; 25 mM Tris-HCl pH 8.5; 0.5% Nonidet P-40; 200 μM pefabloc; 20 μg/ml leupeptin, pepstatin, and aprotinin; 10 μM DNase; and 10 μg/ml RNase (Ludowyke et al., 1989, 1996). Buffer C was used for immunoprecipitation of the phosphatases and contained 100 mM NaCl; 50 mM sodium pyrophosphate; 50 mM sodium fluoride; 2 mM sodium orthovanadate; 20 mM HEPES pH 8.8; 0.5% Nonidet P-40; 200 μM pefabloc; 20 μg/ml leupeptin, pepstatin, and aprotinin; 10 μM DNase; and 10 μg/ml RNase (adapted from Begum, 1995). Monoclonal antibodies against the catalytic subunit of PP1 (Santa Cruz Biotechnology, Santa Cruz, CA) or PP2A (Upstate Biotechnology, Lake Placid, NY), or a polyclonal antibody against myosin (as described above) were prebound for 2 h to protein A-Sepharose CL-4B (Amersham Biosciences AB). Immunoprecipitation results achieved with the commercial anti-myosin antibody were the same as achieved using the well-described anti-human platelet myosin antibody, kindly donated by Dr. Robert S. Adelstein (National Institutes of Health, Bethesda, MD) (our unpublished data), and as previously described (Ludowyke et al., 1989). The cell lysates were rotated at 4°C for 12–16 h with antibody-protein A-Sepharose beads. The lysate/bead slurry was subsequently added to ProbeQuant G-50 microcolumns (prewashed to remove G-50 resin; Amersham Biosciences AB) and centrifuged in screw-capped tubes at 6000 rpm for 20 s to remove unbound proteins. The beads were washed to remove nonspecific proteins in lysis buffer, 50:50 lysis buffer/PBS, and finally PBS. Beads were resuspended in 100 μl of Laemmli's sample buffer and heated at 85°C for 5 min to dissociate proteins from the beads.
Western Blotting
Immunoprecipitated proteins, solubilized in Laemmli's sample buffer, were then separated on 10% SDS-polyacrylamide gels and transferred to polyvinylidene difluoride membranes at 400 mA for 2 h. The membranes were washed and nonspecific binding sites were blocked with 5% (wt/vol) skim milk in PBS. The membranes were incubated for 90 min with the polyclonal or monoclonal PP1 or PP2A primary antibodies or polyclonal myosin primary antibodies (as described above) and 60 min with the horseradish peroxidase-labeled secondary antibodies (Amersham Biosciences AB). The proteins were detected using an enhanced chemiluminescent detection kit (PerkinElmer Life Sciences, Boston, MA) following the manufacturer's instructions. As a control, incubation of the cell lysate with protein A-Sepharose beads alone, under the same conditions as described above, showed no nonspecific binding of myosin, PP1, or PP2A. For quantitation, the bands on the Amersham x-ray film were captured using a laser densitometer and analyzed using ImageQuant (Molecular Dynamics, Sunnyvale, CA). GraphPad Prism (GraphPad Software) was used to analyze the densitometric data, by using a nonparametric paired t test (two-tailed, confidence interval 95%), giving the significance data shown.
One-Dimensional Isoelectric Focusing (IEF) and Tryptic Peptide Mapping
Immunoprecipitated myosin from 32P-labeled cells was separated by SDS-PAGE on either 12.5% gels for the light chain, or 5% gels for the heavy chain. Gels were stained with Coomassie blue (Bio-Rad, Hercules, CA), dried, and subjected to autoradiography. The areas containing the 32P-labeled myosin heavy or light chains were cut from the gel and treated as described previously (Ludowyke et al., 1989). Briefly, gel slices were digested overnight in a solution containing l-1-tosylamido-2-phenylethyl chloromethyl ketone-trypsin in 50 mM NH4HCO3, centrifuged to remove gel slices, lyophilized, and resuspended in a final volume of 22 μl of 50 mM NH4HCO3. Tryptic peptide mapping was conducted using a 0.5-mm-thick urea polyacrylamide one-dimensional IEF system as previously described (Moussavi et al., 1993; Ludowyke et al., 1996). Briefly, the Biolytes (Bio-Rad) used were pH 3–5, 4–6, and 5–8 (1:1:1). The peptides were separated by electrophoresis at 25 W/1350 V at 10°C for 35 min with 1 M NaOH as the cathode buffer and 1 M H3PO4 as the anode buffer. The dried gels were then subjected to autoradiography and analyzed as for Western blotting as described above.
RESULTS
Antigen-induced Rearrangement of Cytoskeletal Proteins and Phosphatases
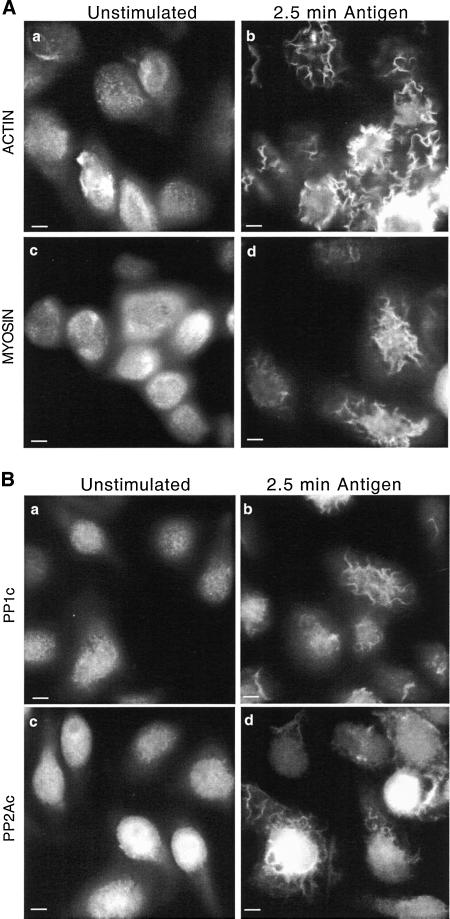
In unstimulated RBL-2H3 cells there are no actomyosin microfilaments evident; however, actin and myosin are distributed throughout the cell and localized to small microvilli on the apical surface. After the addition of antigen to IgE-primed mast cells, large ruffles are formed on the apical surface in which both actin and myosin become concentrated (Figure 1A, b and d). These changes are observed at a time before or coincident with the peak rate of granule mediator release (2.5 min poststimulation for antigen) (Pfeiffer et al., 1985; Sahara et al., 1990; Ludowyke et al., 1994a; Spudich, 1994).
Figure 1.
Redistribution of actin, myosin, PP1, and PP2A to apical ruffles after antigen stimulation. Adherent monolayers of RBL-2H3 cells that had been incubated overnight with DNP-specific IgE were incubated in buffer alone for 2.5 min (unstimulated, a and c) or with antigen (100 ng/ml DNP-BSA) for 2.5 min (b and d), fixed, and proteins on the apical surface detected as detailed in MATERIALS AND METHODS. Actin (A, a and b) was detected using phalloidin-FITC and myosin (A, c and d), PP1c (B, a and b), and PP2Ac (B, c and d) by using specific polyclonal antibodies and FITC-labeled secondary antibodies. The images focus on the apical surface of the cells and are representative of those seen in at least five separate experiments. Bar, 5 μm.
In unstimulated mast cells, PP1 and PP2A are broadly distributed throughout the cytoplasm and nucleus with a similar apical localization as actin and myosin (Figure 1B, a and c). Furthermore, as with myosin and actin, PP1 and PP2A become localized to the apical ruffles within 2.5 min after stimulation by antigen (Figure 1B, b and d). It is also evident that PP1 and PP2A are in the nucleus, but the levels do not change after activation (Scurr, Sewell, and Ludowyke, unpublished observations).
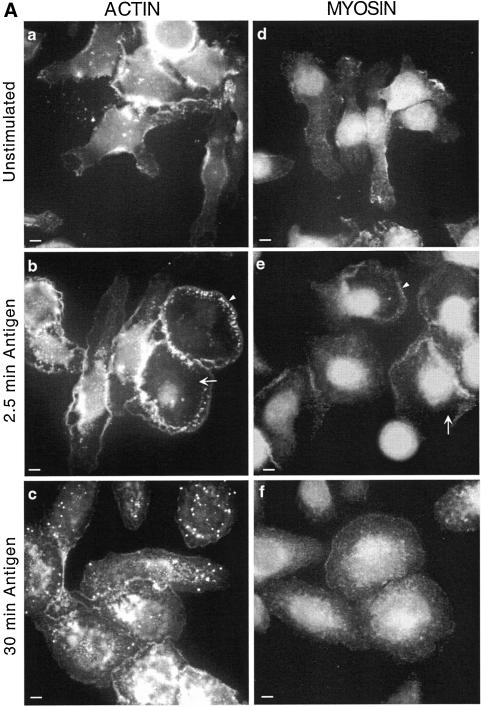
In addition to the formation of these surface ruffles, there are many other changes in the morphology and cytoskeletal structure of mast cells after stimulation. The cells decrease in height by 50% (Ludowyke et al., 1994a,b) and spread out on the substrate, increasing their surface area (Oliver et al., 1988; Ludowyke et al., 1994b). As shown in Figure 2A, these changes correspond to considerable cytoskeletal rearrangements on the basal surface of the cells. Within 2.5 min after addition of antigen, a thick band of actin and myosin has formed at the periphery of the spreading cells, with a corresponding clearance of these proteins from the cytoplasm between the nucleus and cell periphery (Figure 2A, b and e). By 30 min poststimulation, however, myosin and actin have returned to a distribution similar to that seen in unstimulated cells, although the actin plaques are still evident (Figure 2A, c and f).
Figure 2.
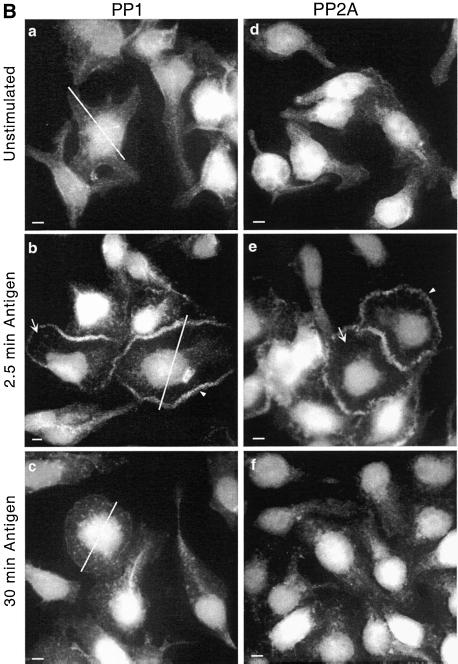
Transient redistribution of actin, myosin, PP1, and PP2A to the periphery of the spreading cell after antigen stimulation. Adherent monolayers of RBL-2H3 cells that had been incubated overnight with DNP-specific IgE were incubated in buffer alone for 2.5 min (unstimulated, a and d), or with antigen (100 ng/ml DNP-BSA) for 2.5 min (b and e) or 30 min (c and f). The cells were then fixed and proteins on the basal cell surface detected as detailed in MATERIALS AND METHODS. Actin (A, a–c) was detected using phalloidin-FITC and myosin (A, d–f), PP1c (B, a–c) and PP2Ac (B, d–f) with specific polyclonal antibodies and FITC-labeled secondary antibodies. Arrows highlight regions where protein has cleared from the cytoplasm and arrowheads highlight the band of protein around the peripheral edge. The lines across the cells immunostained with PP1c were used to generate the fluorescence intensity graphs of Figure 3A. The images focus on the basal surface of the cells and are representative of those seen in at least five separate experiments. Bar, 5 μm.
Figure 2B documents a similar pattern of redistribution of PP1 and PP2A. Within 2.5 min of the addition of antigen, both PP1 and PP2A are cleared from the cytoplasm of the spreading cell and are concentrated in a thick band around the periphery of the cell (Figure 2B, b and e). This band can be seen forming within 1 min after addition of antigen, indicating that these changes do in fact precede the peak rate of granule secretion (our unpublished data). However, within 30 min of stimulation, both PP1 and PP2A have returned to their cytoplasmic locations, with the pattern of distribution being similar to that found in unstimulated cells (Figure 2B, c and f).
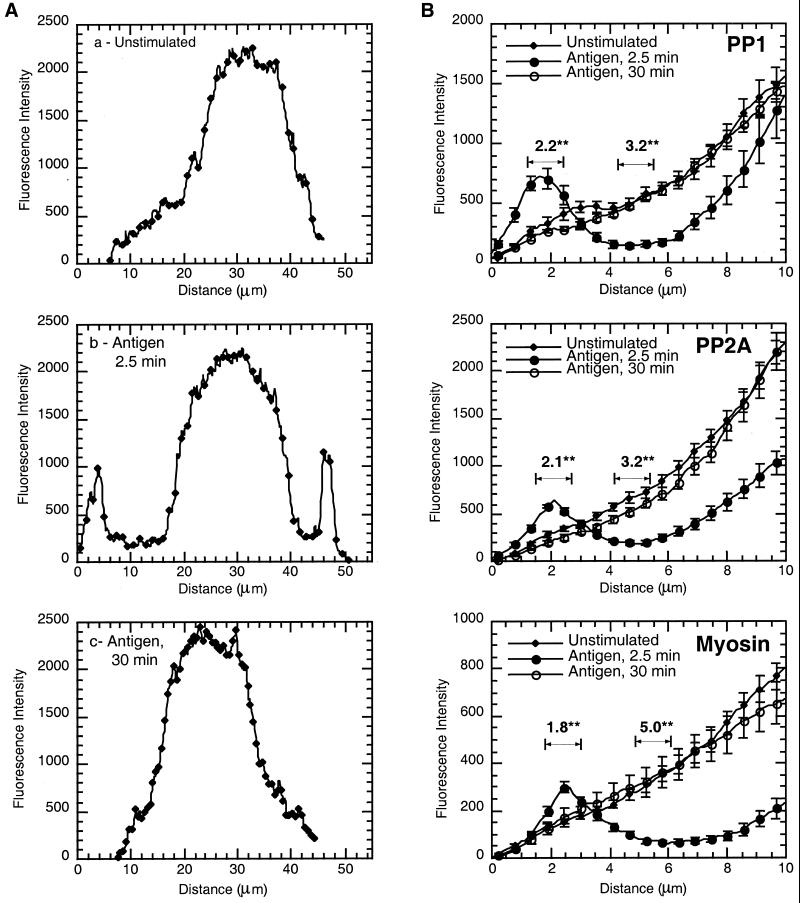
To quantitate the changes in these cells, the fluorescence intensity was analyzed. Initially, cross sections from a single cell were taken, clearly defining the broad band of protein at the periphery of the cell, 2.5 min after activation (Figure 3A, b). The graphs also suggest that by 30 min poststimulation, the pattern of distribution has reverted to that of unstimulated cells (Figure 3A, a and c). To specifically analyze the band at the cell periphery and the clearance from the cytoplasm, fluorescence intensity data were compiled from a point immediately outside the periphery of the cell to the edge of the nucleus in both unstimulated and stimulated cells. These data indicate that antigen stimulation induces a significant (p < 0.002) twofold increase in fluorescence intensity in the band at the cell periphery for PP1, PP2A, and myosin (Figure 3B). There is a corresponding significant (p < 0.002) threefold decrease in intensity approximately midway between the nucleus and cell periphery for PP1 and PP2A and a fivefold decrease in myosin immunostaining (Figure 3B). These data also confirm that by 30 min poststimulation, the distribution of PP1, PP2A, and myosin have returned to that of unstimulated cells. Actin was not analyzed as the staining was more punctate and there was no nuclear staining to orient the line measurements.
Figure 3.
Fluorescence intensity graphs of antigen-stimulated cells. NIH Image was used to generate fluorescence intensity data from immunostained cells as depicted in Figure 2. The line across the cells immunostained with PP1c (Figure 2B, a–c) was used to generate the fluorescence intensity graphs from unstimulated cells and those stimulated with antigen for 2.5 and 30 min (A, a, b, and c, respectively). (B) Area between the edge of the cell and the beginning of the nucleus. Three line measurements were taken from at least 10 cells and the data compiled as described in MATERIALS AND METHODS from cells immunostained with PP1, PP2A, and myosin. The data (mean ± SE) from unstimulated cells and those stimulated with antigen for 2.5 and 30 min are plotted together for comparison. Intensity graphs show symbol and error bar at every fifth data point. Numerical data above the graphs indicate the difference between unstimulated and 2.5-min antigen-stimulated cells at the peripheral band (fold increase) or the clearance (fold decrease). The significance of this difference is indicated (**p < 0.002).
PMA Plus Calcium Ionophore A23187-induced Rearrangement of Cytoskeleton and Phosphatases
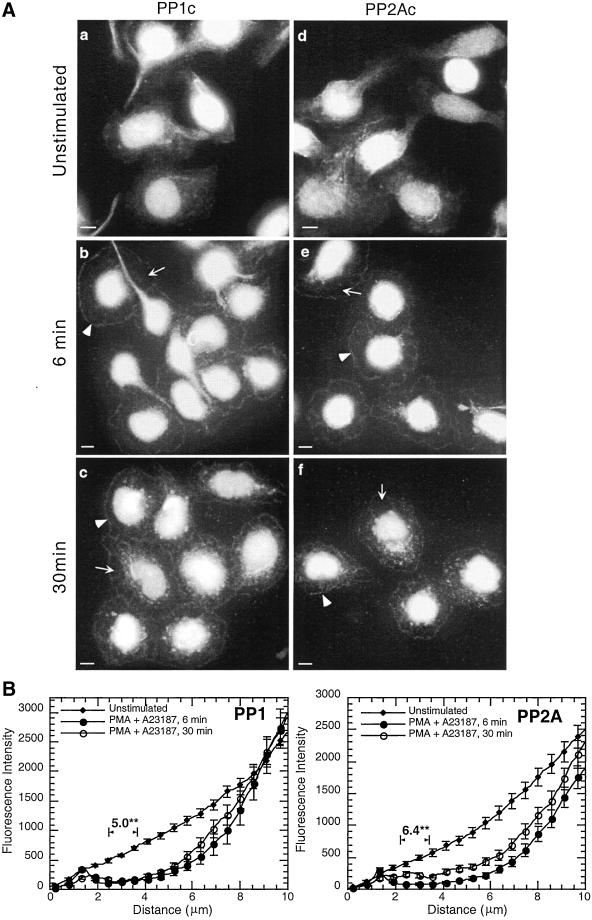
PMA plus A23187 induced secretion with a slower onset and a delayed peak rate of secretion; 4–6 min compared with 2.5 min for antigen (Ludowyke et al., 2000). As seen with antigen stimulation a peripheral accumulation of PP1 and PP2A was also observed at the peak of PMA plus A23187-stimulated secretion (Figure 4A, b and e). The clearance of PP1 and PP2A from the cytoplasm between the nucleus and cell periphery is slightly more pronounced than seen with antigen (Figure 4B; 5–6-fold decrease in fluorescence intensity; p < 0.002). Interestingly, unlike antigen stimulation, the distribution of PP1 and PP2A does not return to unstimulated levels 30 min after addition of PMA plus A23187 (Figure 4A, c and f). At this time, the clearance from the cytoplasm remains significantly different from unstimulated cells (Figure 4B; 3–4-fold; p < 0.002). These results show that two separate secretagogues with different initial modes of action and time course, both induce a similar redistribution of PP1 and PP2A at the time of peak granule secretion. A similar rearrangement of actin and myosin at these time points was observed (our unpublished data).
Figure 4.
Relocation of PP1 and PP2A to the periphery of the spreading cell after PMA plus A23187 stimulation. Adherent monolayers of RBL-2H3 cells were incubated in buffer alone for 6 min (a and d) or with 50 nM PMA plus 500 nM A23187 for 6 min (b and e) or 30 min (c and f), fixed, and proteins detected as detailed in MATERIALS AND METHODS. PP1c (a–c) and PP2Ac (d–f) were detected using specific polyclonal antibodies and FITC-labeled secondary antibodies. Arrowheads highlight the band of protein around the peripheral edges of the cells and arrows highlight regions where protein has cleared from the cytoplasm. The images focus on the basal surface of the cells and are representative of those seen in at least three separate experiments. Bar, 5 μm. A fluorescence intensity graph of compiled line measurements from the edge of the cell to the beginning of the nucleus, as described in the legend to Figure 3, is depicted (B). The data (mean ± SE) from unstimulated cells and those stimulated with PMA plus A23187 for 6 and 30 min are plotted together for comparison. Numerical data above the graphs indicate the difference in the clearance (fold decrease) between unstimulated and 6 min PMA plus A23187-stimulated cells. The significance of this difference is indicated (**p < 0.002).
The addition of PMA alone to RBL-2H3 cells does not induce secretion, yet it does induce many of the intracellular signals generated by antigen, such as activation of PKC and a redistribution of actin and myosin (Choi et al., 1994; Ludowyke et al., 1994b, 1996). PMA alone induces a similar rearrangement of PP1 and PP2A as that seen with PMA plus A23187 (Figure 4A), suggesting that these changes do not require an increase in intracellular calcium (our unpublished data).
Coimmunoprecipitation of Myosin, PP1, and PP2A
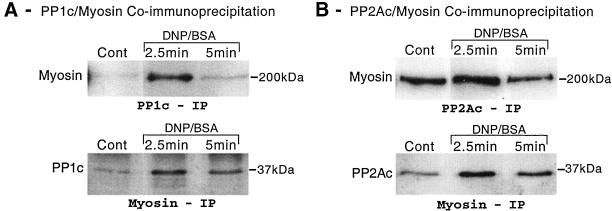
Having established that during the peak rate of granule mediator release, PP1 and PP2A are localized in areas where myosin and actin are also concentrated, we sought to determine whether there was an association between these proteins. Myosin, PP1, and PP2A were immunoprecipitated from unstimulated and antigen-stimulated RBL-2H3 cells as described in MATERIALS AND METHODS (Ludowyke et al., 1989, 1996). The myosin immunocomplex was probed by Western immunoblotting for the presence of PP1c and PP2Ac. In reciprocal analyses, PP1c or PP2Ac immunocomplexes were probed for the presence of myosin. Because these reciprocal immunoprecipitations investigated the association of myosin with the phosphatases, the densitometric analyses of the Western blots were combined. Whether myosin or the phosphatases were immunoprecipitated, relative to unstimulated cells, there was a significant increase in the association of myosin with both PP1c and PP2Ac at the peak rate of secretion (Figure 5). There was a 1.78-fold ± 0.25 (n = 5; p < 0.05) increase in the association of myosin with PP1c and a 1.36-fold ± 0.04 (n = 6; p < 0.05) increase in the association of myosin with PP2Ac. Remarkably, by 5 min poststimulation the amount of myosin associated with both PP1c and PP2Ac had returned to levels similar to that in unstimulated cells (1.05 ± 0.11- and 1.09 ± 0.14-fold, respectively; Figure 5). The level of recovery of PP1, PP2A, and myosin from their respective immunoprecipitates was the same from the control and at each time point (our unpublished data).
Figure 5.
Coimmunoprecipitation of myosin and PP1/PP2A after antigen stimulation. Adherent monolayers of RBL-2H3 cells that had been incubated overnight with DNP-specific IgE were incubated in buffer alone or activated with antigen (100 ng/ml DNP-BSA) for 2.5 or 5 min. Cells were lysed and PP1c, PP2Ac, or myosin immunoprecipitated using specific antibodies as detailed in MATERIALS AND METHODS. PP1c and PP2Ac immunoprecipitates were probed for myosin by Western blotting and myosin immunoprecipitates were probed for PP1c and PP2Ac as described above. The images are representative of those seen in two to three separate experiments.
Inhibition of Mast Cell Secretion by Inhibitors of Actin Assembly and Phosphatase Activity
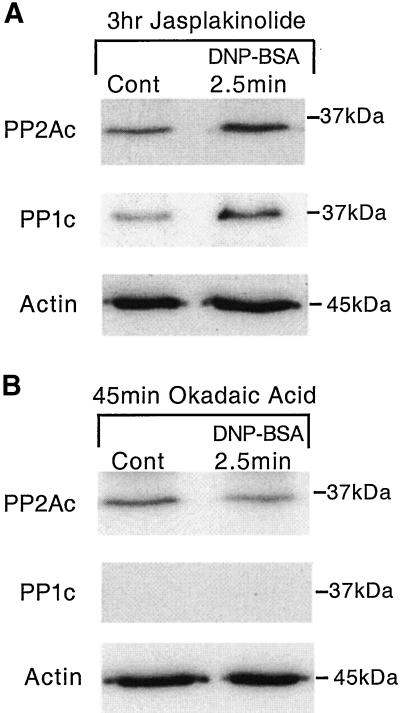
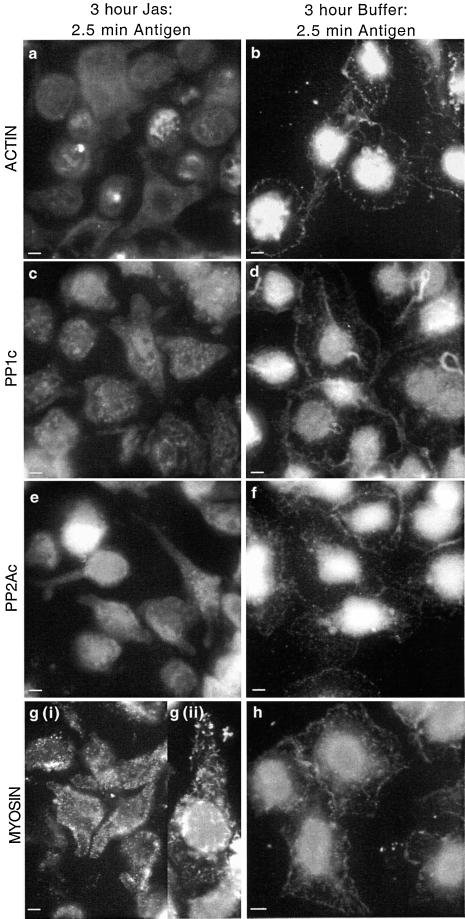
To further investigate the link between cytoskeletal rearrangements, PP1, PP2A, and secretion, we used jasplakinolide, an inhibitor of actin assembly, and OA, an inhibitor of phosphatase activity. Jasplakinolide has been shown to bind to actin, inhibiting polymerization (Bubb et al., 1994). We have recently shown that jasplakinolide can inhibit insulin secretion from RINm5F cells (Wilson et al., 2001). We have found herein that preincubation of RBL-2H3 cells for 3 h with 5 μM jasplakinolide inhibits the antigen-induced secretion of β-hexosaminidase by 73 ± 9.4%. Under these conditions, jasplakinolide does not affect the association of either PP1 or PP2A with myosin in unstimulated cells. Furthermore, although jasplakinolide inhibited secretion, there was no effect on the increased association of myosin with PP1 and PP2A, 2.5 min after antigen stimulation (Figure 6A). In addition, the association of actin with myosin does not appear to be affected by jasplakinolide or to change over this time period (Figure 6A). Nevertheless, in antigen-stimulated cells, jasplakinolide prevented the clearance of actin, PP1, and PP2A from the cytoplasm and the formation of the characteristic band at the periphery of the cells (Figure 7, a, c, and e). However, these cytoskeletal changes are seen in cells preincubated with buffer for 3 h and subsequently stimulated with antigen (Figure 7, b, d, and f). Control cells incubated with jasplakinolide, without subsequent addition of antigen, were similar to those depicted in the presence of antigen (our unpublished data). Jasplakinolide induced some of the cells to become round; however, there were few other effects of jasplakinolide upon the distribution of actin, whether investigated using a monoclonal anti-actin antibody or phalloidin (our unpublished data).
Figure 6.
Effect of jasplakinolide or okadaic acid on coimmunoprecipitation of myosin and PP1/PP2A. Adherent monolayers of RBL-2H3 cells that had been incubated overnight with DNP-specific IgE were incubated in a buffer containing either 5 μM jasplakinolide (A) for 3 h or 1 μM OA (B) for 45 min. Cells were subsequently left in buffer alone or activated with antigen (100 ng/ml DNP-BSA) for 2.5 min, lysed, and myosin immunoprecipitated using the anti-myosin polyclonal antibody as detailed in MATERIALS AND METHODS. Myosin immunoprecipitates were probed for PP1c, PP2Ac, and actin by Western blotting. The images are representative of those seen in two separate experiments.
Figure 7.
Effect of jasplakinolide on relocation of actin, PP1, PP2A, and myosin after antigen stimulation. Adherent monolayers of RBL-2H3 cells that had been incubated overnight with DNP-specific IgE were incubated in a buffer containing 5 μM jasplakinolide for 3 h and activated with antigen (100 ng/ml DNP-BSA) for 2.5 min (a, c, e, and g). A separate set of cells was left for 3 h in buffer alone as a control and activated with antigen (100 ng/ml DNP-BSA) for 2.5 min (b, d, f, and h). All cells were fixed and proteins were detected as detailed in MATERIALS AND METHODS. Actin (a and b) was detected using an anti-actin mAb and FITC-labeled secondary antibody; PP1c (c and d), PP2Ac (e and f), and myosin (g and h) were detected using specific polyclonal antibodies and FITC-labeled secondary antibodies. Panel g (ii) is an enlarged view of jasplakinolide-treated unstimulated cells highlighting the short rods of myosin. The images focus on the basal surface of the cells and are representative of those seen in at least three separate experiments. Bar, 5 μm.
Surprisingly, there was a very clear alteration in the distribution of myosin after the addition of jasplakinolide. Jasplakinolide induced myosin to form short, rod-like structures throughout the cell (highlighted in a magnified view in Figure 7g, ii). These structures remained after antigen stimulation and there was no clearance from the cytoplasm or formation of the peripheral band. Interestingly, jasplakinolide did not affect the association of myosin with PP1, PP2A, or actin, before or after stimulation (Figure 6A). These data suggest that antigen-mediated PP1 and PP2A redistribution is dependent upon an intact actomyosin microfilament system, which is also required for secretion in these cells.
Addition of the PP1 and PP2A inhibitor OA to RBL-2H3 cells inhibited secretion (Kitani et al., 1996; Ludowyke et al., 1998); however, we have shown that the addition of 1 μM OA for 45 min only inhibits the activity of PP2A (Ludowyke et al., 2000). In the present experiments using the same conditions, OA inhibited the antigen-induced secretion of β-hexosaminidase by 74 ± 4%, a similar amount to that of jasplakinolide.
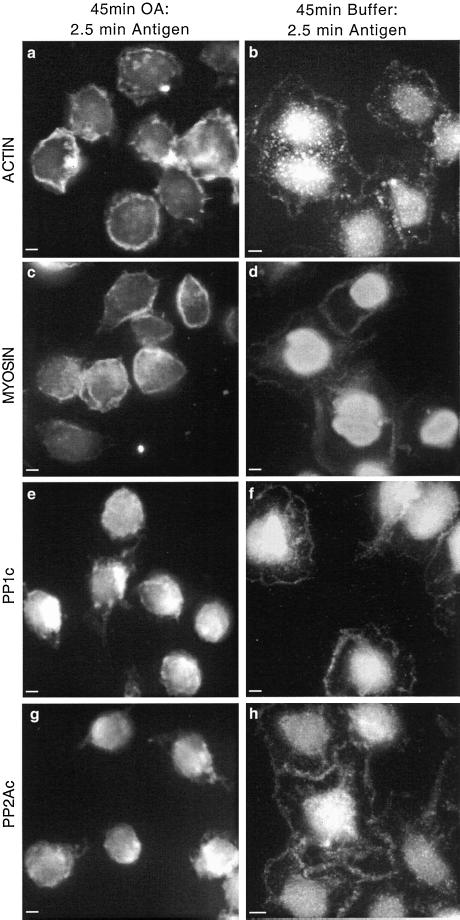
Analysis of myosin immunoprecipitates revealed that the addition of OA inhibited the association of PP1 and PP2A with myosin in unstimulated cells by ∼50% (our unpublished data). Furthermore, where previously the association of PP2A with myosin increased 2.5 min after antigen stimulation (Figure 5B), OA pretreatment led to a decreased association at this time point (Figure 6B). PP1 was not detected in association with myosin after OA pretreatment, although it was clearly evident after immunoblotting the unbound proteins (our unpublished data). There was no apparent change in the amount of actin associated with myosin over this time course (Figure 6B). Consistent with these findings, immunofluorescence images showed that OA clearly disrupts the antigen-stimulated rearrangement of actin and myosin. After preincubation with OA, the cells became round and the addition of antigen did not induce any cytoskeletal alterations. That is, there was no formation of the characteristic band surrounding the periphery of the cells or clearance of actin, myosin, PP1, and PP2A from the cytoplasm (Figure 8, a, c, e, and g). However, these cytoskeletal changes are seen in cells preincubated with buffer and subsequently stimulated with antigen (Figure 8, b, d, f, and h). Control cells preincubated with OA without subsequent addition of antigen were similar to those depicted herein in the presence of antigen (our unpublished data).
Figure 8.
Effect of okadaic acid on relocation of actin, myosin, PP1, and PP2A after antigen stimulation. Adherent monolayers of RBL-2H3 cells that had been incubated overnight with DNP-specific IgE were incubated in a buffer containing 1 μM OA for 45 min and activated with antigen (100 ng/ml DNP-BSA) for 2.5 min (a, c, e, and g). A separate set of cells was left for 45 min in buffer alone as a control and activated with antigen (100 ng/ml DNP-BSA) for 2.5 min (b, d, f, and h). All cells were fixed and proteins were detected as detailed in MATERIALS AND METHODS. Actin (a and b) was detected using an anti-actin mAb and FITC-labeled secondary antibody; myosin (c and d), PP1c (e and f), and PP2Ac (g and h) were detected using specific polyclonal antibodies and FITC-labeled secondary antibodies. The images focus on the basal surface of the cells and are representative of those seen in at least three separate experiments. Bar, 5 μm.
Inhibition of Phosphatase Activity Leads to Increased MHC and MLC Phosphorylation at PKC-specific Sites
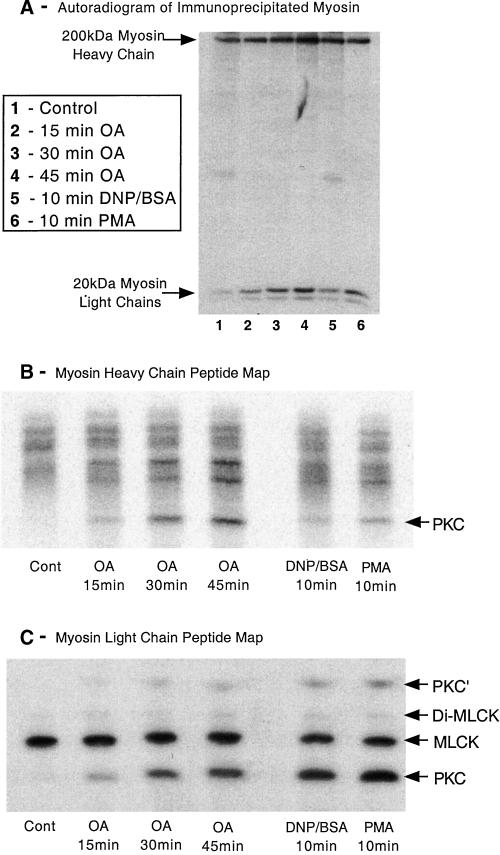
Having previously established that preincubation of RBL-2H3 cells with OA (1 μM for 45 min) inhibited the activity of PP2A and not that of PP1 (Ludowyke et al., 2000), our present data implied that the cytoskeletal changes we observed herein may also be regulated more by PP2A than PP1. To further investigate this, we added 1 μM OA to cells that had been prelabeled with 32P to label intracellular pools of ATP and then immunoprecipitated myosin as described in MATERIALS AND METHODS. Both the 200-kDa MHC and the 20-kDa MLC are phosphorylated in unstimulated cells and the level of phosphorylation increases when the cells are stimulated by antigen or PMA (Figure 9A; Ludowyke et al., 1989, 1996; Choi et al., 1994). We demonstrate herein that the addition of OA also leads to a time-dependent increase in the phosphorylation of the MHCs and MLCs (Figure 9A). The MHCs and MLCs were excised from the gels, trypsinized, lyophilized, and the tryptic peptides separated by one-dimensional IEF as previously described (Ludowyke et al., 1996). The peptide map of the MHC shows a number of phosphopeptides in control cells (Figure 9B). The addition of OA leads to the time-dependent generation of another phosphopeptide separating toward the cathode. Although increased phosphorylation is seen in other peptides, this particular phosphopeptide matches the MHC phosphopeptide generated after the addition of PMA to Jurkat cells and antigen to RBL-2H3 cells (Ludowyke et al., 1989; Moussavi et al., 1993) and is known to contain the PKC phosphorylation site Ser-1917 (Conti et al., 1991).
Figure 9.
Phosphopeptide mapping of myosin heavy and light chains. Adherent monolayers of RBL-2H3 cells that had been incubated for 2 h with 100 μCi/ml [32P]orthophosphoric acid were washed then incubated in a buffer containing 1 μM OA for 15, 30, or 45 min, or activated with antigen (100 ng/ml DNP-BSA) or PMA (50 nM) for 10 min. Cells were lysed and myosin immunoprecipitated using specific antibodies, before being separated on 5 or 12.5% SDS-PAGE and subjected to autoradiography as detailed in MATERIALS AND METHODS. (A) Autoradiogram of a 12.5% gel depicting the changes in phosphorylation of the myosin heavy and light chains. The myosin heavy and light chains were then excised from the gel, digested with trypsin, and the peptides separated on a one-dimensional IEF gel as detailed in MATERIALS AND METHODS. (B and C) Heavy chain and light chain peptide maps, respectively. Direction of the IEF on both peptide maps is toward the anode, which is at the top of B and C. The peptide labeled PKC in the MHC phosphopeptide map corresponds to the peptide in platelet myosin phosphorylated in vitro by PKC (Moussavi et al., 1993). The two MLC peptides that were phosphorylated by PKC (PKC and PKC′) correspond to Ser-1 or Ser-2 and are generated by different tryptic cleavage (Moussavi et al., 1993). MLCK forms peptides monophosphorylated at Ser-19 and diphosphorylated at Thr-18 and Ser-19. The amount of myosin immunoprecipitated was checked by Coomassie blue staining and confirmed there was little difference in loading between samples. The images shown are representative of four separate experiments.
The peptide map of the MLC shows a single phosphopeptide in control cells, previously established as the Ser-19 site that is phosphorylated by MLCK. As we have previously demonstrated, the addition of antigen or PMA leads to the phosphorylation of another site, Ser-1 or Ser-2, that is known to be phosphorylated by PKC (Ludowyke et al., 1989, 1996). The addition of OA induced a time-dependent increase in phosphorylation of these PKC-specific sites (Figure 9C). Although in some experiments there was a small increase in the phosphorylation at the MLCK and Di-MLCK (Thr-18/Ser-19) sites, the predominant effect of the addition of OA was an increased phosphorylation at the PKC sites. The two MLC peptides attributed to phosphorylation by PKC (PKC and PKC′) both correspond to Ser-1 or Ser-2, but the upper band is generated by further tryptic cleavage of the arginine residue from the sequence Ser-Ser-Lys-Arg (Nakabayashi et al., 1991; Moussavi et al., 1993).
Therefore, the addition of OA to RBL-2H3 cells time dependently inhibits the activity of PP2A and leads to increased phosphorylation of the MHC and MLC at sites known to be phosphorylated specifically by PKC.
DISCUSSION
Regulated exocytosis requires the remodeling of the cortical actomyosin barrier, allowing granules access to their fusion sites to release their contents into the extracellular space. In mast cells, the kinetics of this remodeling correlates with the increased phosphorylation of myosin on both its heavy and light chains, at serine and threonine sites. Some of the kinases responsible for this increased phosphorylation are MLCK, PKC, and CaM kinase II. However, increased phosphorylation can also be induced by the altered activity of a phosphatase, yet there is little information about the serine/threonine phosphatases that regulate myosin function during exocytosis in any cell. Herein, we demonstrate for the first time that after mast cell stimulation, both the major serine/threonine phosphatases, PP1 and PP2A, associate with myosin and play a major role in regulating the cytoskeletal remodeling
Our data clearly demonstrate that after activation, PP1 and PP2A are relocated from a diffuse distribution throughout the cytoplasm to regions of the cell where actin and myosin have become concentrated. Recent work has shown that the apical ruffles formed in activated RBL-2H3 cells also contain PLCγ1 (Barker et al., 1998), suggesting that they are a locus of high cellular signaling activity during the secretory process. The dynamic nature of these changes is demonstrated in the time course of the redistribution of PP1 and PP2A after stimulation, which coincides or indeed precedes the time of peak release of granule mediators (Ludowyke et al., 2000). This correlation is also apparent in the slower, more prolonged response to PMA plus A23187, due to the prolonged activation of PKC by phorbol esters. Because actin and myosin are similarly redistributed, it is feasible that PP1 and PP2A contribute to these cytoskeletal rearrangements.
The interaction between actin and myosin is primarily regulated by phosphorylation. It is clear that in vitro or in living cells, PP1 can associate with and dephosphorylate the myosin light chain and affect actin microfilaments (Chisholm and Cohen, 1988; Fernandez et al., 1990). In unstimulated RBL-2H3 cells, both PP1 and PP2A associate with myosin and after stimulation this level of association is significantly increased. Remarkably, this increased association is transient, coinciding with the peak rate of secretion, and as the rate of secretion diminished, so too did the association of the phosphatases with myosin. This suggests there is an active mechanism for attachment and removal of the phosphatases from the myosin complex. In our previous study, we described the transient translocation of phosphatases to the plasma membrane of RBL-2H3 cells, again peaking at 2.5 min (Ludowyke et al., 2000). However, in that instance only PP2A was translocated to the plasma membrane; PP1 was not. Therefore, although both PP1 and PP2A contribute to the cytoskeletal changes required for secretion, only PP2A is involved in the secretory events at the plasma membrane.
Jasplakinolide binds to and stabilizes F-actin, limiting the amount of monomeric actin available for remodeling of stress fibers (Bubb et al., 2000). We have recently demonstrated that jasplakinolide inhibits insulin secretion from RINm5F cells (Wilson et al., 2001). In the present study jasplakinolide inhibited secretion from mast cells and prevented the cytoskeletal rearrangement of actin, PP1, and PP2A seen after antigen stimulation. Surprisingly, jasplakinolide also had a dramatic effect on myosin, inducing the formation of short rods, spread throughout the cytoplasm. This distribution was unaffected by antigen stimulation. To our knowledge, this is the first time such an effect of jasplakinolide on myosin has been described. Interestingly, jasplakinolide did not affect the association of myosin with PP1, PP2A, or actin, before or after stimulation. Therefore, inhibition of secretion by jasplakinolide can be interpreted as evidence of the requirement for a dynamic actomyosin interaction in the secretory process.
Addition of OA to RBL-2H3 cells induced changes in the association of both PP1 and PP2A with myosin and inhibited the activated cytoskeletal changes. However, in RBL-2H3 cells, under these conditions, OA only inhibits the activity of PP2A, suggesting that PP2A has the predominant role in these cytoskeletal changes and may also effect the association of PP1 with myosin. PP2A is the major phosphatase acting on caldesmon, a protein that blocks the interaction of actin with myosin (Ferrigno et al., 1993). Furthermore, in fibroblasts, dephosphorylation of the intermediate filament protein vimentin has been shown to be controlled by PP2A and not PP1 (Turowski et al., 1999) and the addition of OA to RBL-2H3 cells leads to increased vimentin phosphorylation (Ludowyke et al., 1998). Therefore, it is likely that dynamic changes in the phosphorylation state of several cytoskeletal proteins are regulated by PP2A (Sontag, 2001). Our present finding that PP2A associates with myosin during mast cell secretion was, however, surprising, because only PP1 has been implicated in the regulation of myosin through MLC phosphorylation (Chisholm and Cohen, 1988; Hartshorne et al., 1998). However, recent studies in Dictyostelium have implicated PP2A as the regulatory phosphatase controlling myosin heavy chain phosphorylation at sites that regulate myosin filament assembly (Murphy and Egelhoff, 1999). In RBL-2H3 cells, we and others have shown that activation induces the phosphorylation of the MHC by PKC and CaM kinase II. These sites are close to the carboxy terminus at the end of the coiled-coil region and are believed to contribute to the rearrangement of the actomyosin cytoskeleton that occurs during the secretory process (Ludowyke et al., 1989; Buxton and Adelstein, 2000). In unstimulated RBL-2H3 cells the MLC is phosphorylated at a specific site (Ser-19) that is regulated by MLCK and PP1, but phosphorylation at this site does not change after activation. However, activation leads to a significant increased phosphorylation at specific sites (Ser-1/Ser-2) that are the major physiological sites for PKC (Ludowyke et al., 1989, 1996; Choi et al., 1994). The phosphatase that regulates phosphorylation at these PKC sites is unknown, but our present data implies that the major phosphatase involved is PP2A. The addition of OA under conditions that inhibit only PP2A and not PP1 induces little alteration in the phosphorylation of the MLC sites regulated by MLCK and PP1, but a significant increase in the phosphorylation of sites regulated by PKC. Therefore, our findings suggest that PKC and PP2A together may be involved in regulating the phosphorylation of the MHC at Ser-1917 and the MLC at Ser-1/Ser-2 that occurs during mast cell secretion.
Although there is no evidence for OA-mediated activation of PKC, the increased phosphorylation at PKC-specific sites on myosin may occur in a number of ways. The inhibition of PP2A may lead to the stimulation of an upstream activator of PKC or the removal of an inhibitory binding protein. Alternatively, the unstimulated activity of PKC for myosin may always be high, yet the level of MHC or MLC phosphorylation is kept low by a much greater activity of PP2A. Thus, inhibiting the activity of PP2A leads to increased phosphorylation due to the high level of unstimulated PKC activity. Although these are important questions, the major impact of the results presented herein is that PP2A is identified as playing an important role in regulating the phosphorylation and thus the function of myosin during mast cell secretion.
In the larger context, a question arises as to what functional role these changes have in the mast cell exocytotic process. Notably, in the area of the cytoplasm between the nucleus and the cell periphery, there was a significant decrease in the levels of PP1 and PP2A (3.2-fold) and myosin (5-fold). This “clearance” of the actomyosin cytoskeleton from this region may be an important mechanism to allow granules easier access to the plasma membrane. We propose that the formation of the peripheral band pulls at the cortical barrier from one direction (toward the periphery), and the formation of the apical ruffles pulls the barrier back toward the center of the cell or at least in an opposing direction, thus “stretching” the cortical web in the region between the nucleus and cell periphery. As the cells spread out by ∼50% (Ludowyke et al., 1994a,b), this region, which has a smaller distance between the apical and basal surfaces, also has a diminished concentration of actomyosin, which may allow the granules easier access to the plasma membrane, without requiring a major disassembly of the cortical barrier.
In summary, stimulation of RBL-2H3 cells induces a transient association of the serine/threonine phosphatases PP1 and PP2A with myosin, which coincides with the peak rate of granule mediator release. This association is likely to be linked with the transient but significant clearance of actomyosin from the cytoplasm between the cell periphery and the nucleus, into ruffles on the apical surface and a band at the periphery of the cell. This remodeling coincides with or precedes the peak rate of mediator release. Inhibitors of either phosphatase activity or actin assembly inhibit both exocytosis and this cytoskeletal remodeling and give evidence of the interaction of PKC and PP2A in regulating myosin phosphorylation. Overall, our studies indicate that exocytosis does require a dynamic actomyosin microfilament system and that PP1 and PP2A play a stimulatory role in these events.
ACKNOWLEDGMENTS
We thank Prof. Keith Stanley for critical reading of the manuscript and suggestions for data analysis, and Dr. Trevor Biden for critical reading of the manuscript. This work was supported by grants from The Community Health and Anti-Tuberculosis Association, The Asthma Foundation of New South Wales, The National Health and Medical Research Council of Australia, and was partially funded by a New South Wales health research and development infrastructure grant. R.I.L. is supported by the Sternberg Research Fellowship.
Abbreviations used:
- DNP-BSA
antigen containing 24 molecules of dinitrophenol (DNP) conjugated with 1 molecule of bovine serum albumin (BSA)
- FITC
fluorescein isothiocyanate
- IEF
isoelectric focusing
- MHC
myosin heavy chain
- MLC
myosin light chain
- MLCK
myosin light chain kinase
- OA
okadaic acid
- PBS
phosphate-buffered saline
- PKC
protein kinase C
- PMA
phorbol 12-myristate 13-acetate
- PP1 or PP2A
protein phosphatase type 1 or type 2A
Footnotes
Article published online ahead of print. Mol. Biol. Cell 10.1091/mbc.01–12–0587. Article and publication date are at www.molbiolcell.org/cgi/10.1091/mbc.01–12–0587.
REFERENCES
- Apgar JR. Regulation of the antigen-induced F-actin response in rat basophilic leukemia cells by protein kinase C. J Cell Biol. 1991;112:1157–1163. doi: 10.1083/jcb.112.6.1157. [DOI] [PMC free article] [PubMed] [Google Scholar]
- Barker SA, Caldwell KK, Pfeiffer JR, Wilson BS. Wortmannin-sensitive phosphorylation, translocation, and activation of PLCgamma1, but not PLCgamma2, in antigen-stimulated RBL-2H3 mast cells. Mol Biol Cell. 1998;9:483–496. doi: 10.1091/mbc.9.2.483. [DOI] [PMC free article] [PubMed] [Google Scholar]
- Beaven MA, Baumgartner RA. Downstream signals initiated in mast cells by Fc-Epsilon-RI and other receptors [Review] Curr Opin Immunol. 1996;8:766–772. doi: 10.1016/s0952-7915(96)80002-1. [DOI] [PubMed] [Google Scholar]
- Begum N. Stimulation of protein phosphatase-1 activity by insulin in rat adipocytes. Evaluation of the role of mitogen-activated protein kinase pathway. J Biol Chem. 1995;270:709–714. doi: 10.1074/jbc.270.2.709. [DOI] [PubMed] [Google Scholar]
- Bresnick AR. Molecular mechanisms of nonmuscle myosin-II regulation. Curr Opin Cell Biol. 1999;11:26–33. doi: 10.1016/s0955-0674(99)80004-0. [DOI] [PubMed] [Google Scholar]
- Bubb MR, Senderowicz AM, Sausville EA, Duncan KL, Korn ED. Jasplakinolide, a cytotoxic natural product, induces actin polymerization and competitively inhibits the binding of phalloidin to F-actin. J Biol Chem. 1994;269:14869–14871. [PubMed] [Google Scholar]
- Bubb MR, Spector I, Beyer BB, Fosen KM. Effects of jasplakinolide on the kinetics of actin polymerization. An explanation for certain in vivo observations. J Biol Chem. 2000;275:5163–5170. doi: 10.1074/jbc.275.7.5163. [DOI] [PubMed] [Google Scholar]
- Buxton DB, Adelstein RS. Calcium-dependent threonine phosphorylation of nonmuscle myosin in stimulated RBL-2H3 mast cells. J Biol Chem. 2000;275:34772–34779. doi: 10.1074/jbc.M004996200. [DOI] [PubMed] [Google Scholar]
- Chisholm AA, Cohen P. The myosin-bound form of protein phosphatase 1 (PP-1M) is the enzyme that dephosphorylates native myosin in skeletal and cardiac muscles. Biochim Biophys Acta. 1988;971:163–169. doi: 10.1016/0167-4889(88)90188-7. [DOI] [PubMed] [Google Scholar]
- Choi OH, Adelstein RS, Beaven MA. Secretion from rat basophilic RBL-2H3 cells is associated with diphosphorylation of myosin light chains by myosin light chain kinase as well as phosphorylation by protein kinase C. J Biol Chem. 1994;269:536–541. [PubMed] [Google Scholar]
- Choi OH, Park CS, Itoh K, Adelstein RS, Beaven MA. Cloning of the cDNA encoding rat myosin heavy chain-A and evidence for the absence of myosin heavy chain-B in cultured rat mast (RBL-2H3) cells. J Muscle Res Cell Motil. 1996;17:69–77. doi: 10.1007/BF00140325. [DOI] [PubMed] [Google Scholar]
- Cohen P. The structure and regulation of protein phosphatases. Annu Rev Biochem. 1989;58:453–508. doi: 10.1146/annurev.bi.58.070189.002321. [DOI] [PubMed] [Google Scholar]
- Cohen P, Cohen PT. Protein phosphatases come of age. J Biol Chem. 1989;264:21435–21438. [PubMed] [Google Scholar]
- Conti MA, Sellers JR, Adelstein RS, Elzinga M. Identification of the serine residue phosphorylated by protein kinase C in vertebrate nonmuscle myosin heavy chains. Biochemistry. 1991;30:966–970. doi: 10.1021/bi00218a012. [DOI] [PubMed] [Google Scholar]
- Echtenacher B, Mannel DN, Hultner L. Critical protective role of mast cells in a model of acute septic peritonitis. Nature. 1996;381:75–77. doi: 10.1038/381075a0. [DOI] [PubMed] [Google Scholar]
- Fernandez A, Brautigan DL, Mumby M, Lamb NJ. Protein phosphatase type-1, not type-2A, modulates actin microfilament integrity and myosin light chain phosphorylation in living nonmuscle cells. J Cell Biol. 1990;111:103–112. doi: 10.1083/jcb.111.1.103. [DOI] [PMC free article] [PubMed] [Google Scholar]
- Ferrigno P, Langan TA, Cohen P. Protein phosphatase 2A1 is the major enzyme in vertebrate cell extracts that dephosphorylates several physiological substrates for cyclin-dependent protein kinases. Mol Biol Cell. 1993;4:669–677. doi: 10.1091/mbc.4.7.669. [DOI] [PMC free article] [PubMed] [Google Scholar]
- Guo Z, Turner C, Castle D. Relocation of the t-SNARE SNAP-23 from lamellipodia-like cell surface projections regulates compound exocytosis in mast cells. Cell. 1998;94:537–548. doi: 10.1016/s0092-8674(00)81594-9. [DOI] [PubMed] [Google Scholar]
- Hartshorne DJ, Ito M, Erdodi F. Myosin light chain phosphatase: subunit composition, interactions and regulation. J Muscle Res Cell Motil. 1998;19:325–341. doi: 10.1023/a:1005385302064. [DOI] [PubMed] [Google Scholar]
- Hibi T, Hirashima N, Nakanishi M. Rat basophilic leukemia cells express syntaxin-3 and VAMP-7 in granule membranes. Biochem Biophys Res Commun. 2000;271:36–41. doi: 10.1006/bbrc.2000.2591. [DOI] [PubMed] [Google Scholar]
- Kawasugi K, French PW, Penny R, Ludowyke RI. Focal adhesion formation is associated with secretion of allergic mediators. Cell Motil Cytoskeleton. 1995;31:215–224. doi: 10.1002/cm.970310305. [DOI] [PubMed] [Google Scholar]
- Kitani S, Teshima R, Nonomura Y, Morita Y, Ito K. The effect of okadaic acid on histamine release, cell morphology and phosphorylation in rat basophilic leukemia (RBL-2H3) cells, human basophils and rat peritoneal mast cells. Int Arch Allergy Immunol. 1996;110:339–347. doi: 10.1159/000237326. [DOI] [PubMed] [Google Scholar]
- Lang T, Wacker I, Wunderlich I, Rohrbach A, Giese G, Soldati T, Almers W. Role of actin cortex in the subplasmalemmal transport of secretory granules in PC-12 cells. Biophys J. 2000;78:2863–2877. doi: 10.1016/S0006-3495(00)76828-7. [DOI] [PMC free article] [PubMed] [Google Scholar]
- Ludowyke RI, Holst J, Mudge LM, Sim AT. Transient translocation and activation of protein phosphatase 2A during mast cell secretion. J Biol Chem. 2000;275:6144–6152. doi: 10.1074/jbc.275.9.6144. [DOI] [PubMed] [Google Scholar]
- Ludowyke RI, Kawasugi K, French PW. ATP gamma S induces actin and myosin rearrangement during histamine secretion in a rat basophilic leukemia cell line (RBL-2H3) Eur J Cell Biol. 1994a;64:357–367. [PubMed] [Google Scholar]
- Ludowyke RI, Kawasugi K, French PW. PMA and calcium ionophore induce myosin and F-actin rearrangement during histamine secretion from RBL-2H3 cells. Cell Motil Cytoskeleton. 1994b;29:354–365. doi: 10.1002/cm.970290408. [DOI] [PubMed] [Google Scholar]
- Ludowyke RI, Peleg I, Beaven MA, Adelstein RS. Antigen-induced secretion of histamine and the phosphorylation of myosin by protein kinase C in rat basophilic leukemia cells. J Biol Chem. 1989;264:12492–12501. [PubMed] [Google Scholar]
- Ludowyke RI, Scurr LL, McNally CM. Calcium ionophore-induced secretion from mast cells correlates with myosin light chain phosphorylation by protein kinase C. J Immunol. 1996;157:5130–5138. [PubMed] [Google Scholar]
- Ludowyke RI, Warton K, Scurr LL. Inhibition of antigen and calcium ionophore induced secretion from Rbl-2h3 cells by phosphatase inhibitors. Cell Biol Int. 1998;22:855–865. doi: 10.1006/cbir.1998.0332. [DOI] [PubMed] [Google Scholar]
- Malaviya R, Ikeda T, Ross E, Abraham SN. Mast cell modulation of neutrophil influx and bacterial clearance at sites of infection through TNF-alpha. Nature. 1996;381:77–80. doi: 10.1038/381077a0. [DOI] [PubMed] [Google Scholar]
- Moussavi RS, Kelley CA, Adelstein RS. Phosphorylation of vertebrate nonmuscle and smooth muscle myosin heavy chains and light chains. Mol Cell Biochem. 1993;127–128:219–227. doi: 10.1007/BF01076773. [DOI] [PubMed] [Google Scholar]
- Mumby MC, Walter G. Protein serine/threonine phosphatases: structure, regulation, and functions in cell growth. Physiol Rev. 1993;73:673–699. doi: 10.1152/physrev.1993.73.4.673. [DOI] [PubMed] [Google Scholar]
- Murphy MB, Egelhoff TT. Biochemical characterization of a Dictyostelium myosin II heavy-chain phosphatase that promotes filament assembly. Eur J Biochem. 1999;264:582–590. doi: 10.1046/j.1432-1327.1999.00670.x. [DOI] [PubMed] [Google Scholar]
- Nakabayashi H, Sellers JR, Huang KP. Catalytic fragment of protein kinase C exhibits altered substrate specificity toward smooth muscle myosin light chain. FEBS Lett. 1991;294:144–148. doi: 10.1016/0014-5793(91)81362-c. [DOI] [PubMed] [Google Scholar]
- Nakai K, Hayashi T, Nagaya S, Toyoda H, Yamamoto M, Shiku H, Ikeda Y, Nishikawa M. Shear stress-induced myosin association with cytoskeleton and phosphorylation in human platelets. Life Sci. 1997;60:L181–L191. doi: 10.1016/s0024-3205(97)00017-9. [DOI] [PubMed] [Google Scholar]
- Oheim M, Stuhmer W. Tracking chromaffin granules on their way through the actin cortex. Eur Biophys J. 2000;29:67–89. doi: 10.1007/s002490050253. [DOI] [PubMed] [Google Scholar]
- Oliver JM, Seagrave J, Stump RF, Pfeiffer JR, Deanin GG. Signal transduction and cellular response in RBL-2H3 mast cells. Prog Allergy. 1988;42:185–245. [PubMed] [Google Scholar]
- Pfeiffer JR, Oliver JM. Tyrosine kinase-dependent assembly of actin plaques linking Fc epsilon R1 cross-linking to increased cell substrate adhesion in RBL-2H3 tumor mast cells. J Immunol. 1994;152:270–279. [PubMed] [Google Scholar]
- Pfeiffer JR, Seagrave JC, Davis BH, Deanin GG, Oliver JM. Membrane and cytoskeletal changes associated with IgE-mediated serotonin release from rat basophilic leukemia cells. J Cell Biol. 1985;101:2145–2155. doi: 10.1083/jcb.101.6.2145. [DOI] [PMC free article] [PubMed] [Google Scholar]
- Razin E, Pecht I, Rivera J. Signal transduction in the activation of mast cells and basophils. Immunol Today. 1995;16:370–373. doi: 10.1016/0167-5699(95)80003-4. [DOI] [PubMed] [Google Scholar]
- Sahara N, Siraganian RP, Oliver C. Morphological changes induced by the calcium ionophore A23187 in rat basophilic leukemia (2H3) cells. J Histochem Cytochem. 1990;38:975–983. doi: 10.1177/38.7.1693935. [DOI] [PubMed] [Google Scholar]
- Sellers JR. Regulation of cytoplasmic and smooth muscle myosin. Curr Opin Cell Biol. 1991;3:98–104. doi: 10.1016/0955-0674(91)90171-t. [DOI] [PubMed] [Google Scholar]
- Sim AT, Collins E, Mudge LM, Rostas JA. Developmental regulation of protein phosphatase types 1 and 2A in post-hatch chicken brain. Neurochem Res. 1998;23:487–491. doi: 10.1023/a:1022422332404. [DOI] [PubMed] [Google Scholar]
- Sontag E. Protein phosphatase 2A: the Trojan Horse of cellular signaling. Cell Signal. 2001;13:7–16. doi: 10.1016/s0898-6568(00)00123-6. [DOI] [PubMed] [Google Scholar]
- Spudich A. Myosin reorganization in activated RBL cells correlates temporally with stimulated secretion. Cell Motil Cytoskeleton. 1994;29:345–353. doi: 10.1002/cm.970290407. [DOI] [PubMed] [Google Scholar]
- Sullivan R, Burnham M, Torok K, Koffer A. Calmodulin regulates the disassembly of cortical F-actin in mast cells but is not required for secretion. Cell Calcium. 2000;28:33–46. doi: 10.1054/ceca.2000.0127. [DOI] [PubMed] [Google Scholar]
- Toyoda H, Nakai K, Omay SB, Shima H, Nagao M, Shiku H, Nishikawa M. Differential association of protein Ser/Thr phosphatase types 1 and 2a with the cytoskeleton upon platelet activation. Thromb Hemost. 1996;76:1053–1062. [PubMed] [Google Scholar]
- Turowski P, Myles T, Hemmings BA, Fernandez A, Lamb NJ. Vimentin dephosphorylation by protein phosphatase 2A is modulated by the targeting subunit B55. Mol Biol Cell. 1999;10:1997–2015. doi: 10.1091/mbc.10.6.1997. [DOI] [PMC free article] [PubMed] [Google Scholar]
- Valentijn JA, Valentijn K, Pastore LM, Jamieson JD. Actin coating of secretory granules during regulated exocytosis correlates with the release of rab3D. Proc Natl Acad Sci USA. 2000;97:1091–1095. doi: 10.1073/pnas.97.3.1091. [DOI] [PMC free article] [PubMed] [Google Scholar]
- Wera S, Hemmings BA. Serine/threonine protein phosphatases. Biochem J. 1995;311:17–29. doi: 10.1042/bj3110017. [DOI] [PMC free article] [PubMed] [Google Scholar]
- Wilson JR, Ludowyke RI, Biden TJ. A redistribution of actin and myosin IIA accompanies Ca(2+)-dependent insulin secretion. FEBS Lett. 2001;492:101–106. doi: 10.1016/s0014-5793(01)02241-4. [DOI] [PubMed] [Google Scholar]


