

Abstract
Conventional biventricular (BiV) pacing cardiac resynchronization therapy (CRT) is an established treatment for heart failure patients. Recently, multiple novel CRT delivering technologies such as His-Bundle pacing have been investigated as alternative pacing strategies for optimal treatment benefit. Electromechanical Wave Imaging (EWI), a high frame-rate echocardiography-based modality, is capable of visualizing the change from dyssynchronous activation to resynchronized BiV-paced ventricles in 3D. This proof-of-concept study introduces a new EWI-based dispersion metric to further characterize ventricular activation. Patients with His-Bundle device implantation (n=4), left-bundle branch block (n=10), right-ventricular (RV) pacing (n=10), or BiV pacing (n=15) were imaged, as well as four volunteers in normal sinus rhythm (NSR). EWI successfully mapped the ventricular activation resulting from His-Bundle pacing. Additionally, very similar activation patterns were obtained in the NSR subjects, confirming recovery of physiological activation with His pacing. The dispersion metric was the most sensitive EWI-based metric that identified His pacing as the most efficient treatment (lowest activation time spread), followed by BiV and RV pacing. More specifically, the dispersion metric significantly (p<0.005) distinguished His pacing from the other two pacing schemes as well as LBBB. The initial findings presented herein indicate that EWI and its new dispersion metric may provide a useful resynchronization evaluation clinical tool in CRT patients under both novel His-Bundle pacing and more conventional BiV pacing strategies.
Keywords: Activation time dispersion, Cardiac Resynchronization Therapy, Electromechanical Wave Imaging, His-Bundle pacing
I. Introduction
CARDIAC resynchronization therapy (CRT) through conventional biventricular (BiV) pacing is an established treatment for heart failure patients who have left-bundle branch block (LBBB) as well as a reduced left-ventricular ejection fraction (LVEF) below 35% [1], [2]. CRT is designed to achieve resynchronization of the left ventricle (LV) with the right ventricle (RV) in order to restore the heart’s optimal systolic function by simultaneously pacing both ventricles.
His-Bundle pacing is a relatively novel method for delivering CRT [3]– [5]; contrary to traditional BiV pacing for which the lead is placed epicardially through the coronary sinus on the free lateral wall of the LV, the main pacing lead in this case is placed against the RV septum on the bundle of His for direct stimulation of the His-Bundle fibers [6], [7]. This novel pacing therapy can not only be used in patients with heart failure (HF) and LBBB, but also in right-bundle branch block patients with normal LVEF, or even for atrial fibrillation (AFib) and bradycardic cases to regulate the heart rate [8]–[10].
Computational modeling simulation studies have investigated in the past the use of cumulative activation indexes to optimize pacing therapies for improved CRT response [11], [12]. Similarly, non-invasive imaging techniques such as electrocardiographic imaging (ECGi) have established mean activation and activation time dispersion within the left and right walls to be complementary metrics and demonstrated their usefulness for CRT response assessment [13], [14], particularly in right-bundle branch block (RBBB) [15] and LBBB patients [16].
Over the past decade, our group has developed Electromechanical Wave Imaging (EWI), a non-invasive high frame-rate echocardiography-based technique that relies on the radiofrequency signals for motion estimation and tracking of the transient myocardial deformation propagation following electrical activation [17], [18]. EWI has been validated against 3D electroanatomic maps in the past and were shown to be highly correlated with electrical activation [19], [20], while more recently, in large animal models using other echocardiography-based sequences [21], for electrical activation isochrone generation and pacing identification [22]. In addition, we have proven EWI to be capable of significantly differentiating biventricular pacing conditions in LBBB patients, successfully assessing the mean change in ventricular dyssynchrony from before to after CRT [23]– [26], and, more recently, quantifying the amount of ventricular resynchrony within 24 hours of CRT implant for response prediction [25], [26].
The study presented herein thus aims to harness on prior findings to assess initial feasibility and utility of a newly defined metric for the assessment of ventricular activation synchronization in response to different CRT pacing schemes. We were inspired by the ”LVAT-95” variable [16], which represents the ”left-ventricular activation time spanning 95% of activations”, and the left ventricular electrical dyssynchrony (ED) index [27], a measure of the spatial dispersion of activation times across the LV. Dispersion was expected to constitute a more sensitive metric in characterizing immediate and transient changes in ventricular activation patterns in response to pacing. In short, the hypothesis behind the study is that the dispersion metric is sensitive enough to detect electromechanical response at distinct pacing schemes. The objectives are thus to employ the dispersion metric to (i) assess response to His-Bundle pacing; (ii) differentiate dispersion from LBBB or other chronic pacing activation schemes, and most importantly, (iii) identify and compare the synchronicity of the activation achieved in His-Bundle pacing against conventional BiV CRT pacing, and healthy volunteers for a reference of true physiological activation.
II. Materials and Methods
A. Patient Population and Study Design
The human subject study was approved by the Institutional Review Board (IRB) of Columbia University and all methods were performed in accordance with IRB guidelines and regulations. Informed consent was obtained from all participants prior to scanning.
Forty-three (N=43) subjects were imaged by a trained sonographer transthoracically in four standard apical views with EWI in the left lateral decubitus position. The patient population subdivision and the corresponding clinical demographics can be found in Table I. Four subjects (n=4) were scanned while being under His pacing during one of their follow-up visits within 3 months to one year after their His pacing device implantation procedures. Underlying rhythms at their clinical baseline varied from congestive HF with LBBB and RBBB to AFib or even atrial flutter with non-reversible sinus bradycardia (heart rate < 60 beats/min); not all of them received His-Bundle pacing for the purpose of CRT. Additionally, ten subjects (n=10) in LBBB with no pacing, ten (n=10) chronic RV apex pacing cases, and fifteen patients (n=15) in conventional BiV pacing CRT were considered. These 35 cases were scanned within 24 hours of CRT device implantation in the post-procedural area and were selected from the HF patient cohort with reduced LVEF of a previous study [25], [26]. Baseline scans for LBBB (sinus rhythm) and RV pacing rhythms were acquired with the CRT device temporarily turned off. All EWI scans were performed during a 100% paced rhythm for patients with RV apex, BiV and His pacing. Finally, four (n=4) healthy adult volunteers imaged in normal sinus rhythm (NSR) were included as a true physiological activation reference.
TABLE I.
Demographics and clinical characteristics of the patient population
| Healthy (n=4) | LBBB (n=10) | RV pacing (n=10) | BiV pacing (n=15) | His-Bundle (n=4) | ||
|---|---|---|---|---|---|---|
| Age (yrs) | Range | 22-39 | 56-83 | 46-89 | 53-89 | 79-87 |
| Median | 24 | 76 | 71 | 76 | 84.5 | |
| Gender | Male | 3 (75%) | 5 (50%) | 8 (80%) | 14 (93%) | 3 (75%) |
| Female | 1 (25%) | 5 (50%) | 2 (20%) | 1 (7%) | 1 (25%) | |
| QRS (ms) | 93±8 | 154±17 | 159±20 | 149±19 | 112±29 |
B. Electromechanical Wave Imaging
A 2.5 MHz single diverging wave at 2000 Hz emitted by a P4-2 phased array (ATL/Philips, Andover, MA, USA) connected to a Vantage Research system (Verasonics Inc., Kirkland, WA, USA) was used to acquire four two-dimensional apical echocardiographic views at a depth of 20 cm with a 90-degree wide field of view (Fig. 1-a). Simultaneous ECG recording was obtained and automatically synchronized with the EWI sequence with the use of a signal triggered by the scanner upon ultrasound acquisition. These ECG recordings were later used for temporal co-registration across EWI views by manually selecting the QRS onset as the time origin (t=0ms). The same heartbeat morphology was always selected on the separate multi-2D view ECGs to maintain consistent starting times across all four isochrones. Besides, axial displacements and strains were computed throughout systole with 1D axial cross-correlation on the beamformed radiofrequency ultrasound signals with a window size of 6.2 mm and 90% overlap [28], followed by a 5-mm-kernel least-squares estimator (Fig. 1-b) [29]. Electromechanical activation times (tact) were defined and manually selected as the timings of the first sign change (from relaxation to contraction) on the incremental axial strain curves after the QRS onset (Fig. 1-c). The ventricular activation timings (in ms) were then color-coded on 2D maps or isochrones, with red illustrating early activation and blue late (Fig. 1–d). 3D-rendered isochrones can then be generated by co-registering the multi-2D views around the LV longitudinal median axis (black dotted line on Fig. 1-d) and performing a linear interpolation on the activation times around the circumference (Fig. 1-e) [30]. All processing steps were performed in Matlab (Mathworks Inc., Natick, MA, USA) and the resulting 3D-rendered volumes were imported and visualized in Amira (Thermo Fisher Scientific, Waltham, MA, USA). Further details on the imaging sequence, EWI processing steps and parameters can be found in previous publications from our group [26], [31], [32].
Fig. 1.
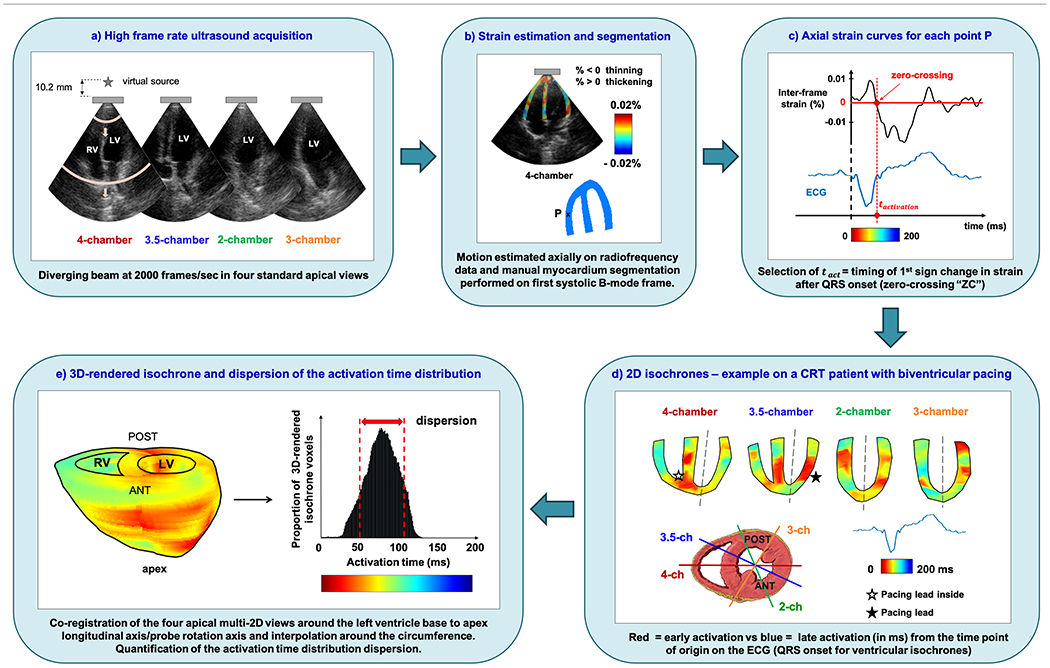
Electromechanical Wave Imaging workflow. This figure illustrates the entire EWI processing pipeline on the cardiac ventricles of a 69-year old male CRT patient in conventional biventricular pacing.
C. Evaluation Metrics
In prior studies, assessment of synchronous activation was achieved through the mean right/left wall activation time metrics on the EWI isochrones (RWAT/LWAT [24]– [26]), and through calculating the percentage of resynchronized myocardium values (%RM [25], [26]). However, the stochastic nature of the ventricular activation times was not previously taken into account. In order to overcome this limitation, in this study, we computed the histograms of the activation time distribution derived from the 3D-rendered isochrones voxels and quantified the dispersion of the histogram’s distribution (Fig. 1-e).
The measure of statistical dispersion was equal to the standard deviation (std) of the ventricular activation time distribution, expressed in milliseconds:
| (1) |
with tact1 corresponding to the 1st voxel’s activation time, tactm representing the mean activation time of all ventricular voxels, tactn corresponding to the nth voxel’s activation time and n being the total number of voxels in the 3D-rendered isochrone. Physiologically, a high dispersion would illustrate heterogeneity in the heart’s activation, which could be a sign of conduction disorder and heart failure, while a low dispersion would indicate a more cohesive and thus, healthy synchronized activation pattern. To confirm that the accuracy of dispersion calculations was not impacted by the 3D-rendered interpolation, we also computed the activation times dispersion derived from the four individual 2D cardiac views per subject, referred to as 2D-dispersion.
D. Statistical Analysis
The data presented in this study are expressed as mean ± standard deviation. To investigate whether 3D-rendered EWI could differentiate His-Bundle pacing from LBBB, chronic RV pacing and conventional biventricular pacing, we performed one-way ANOVA on the dispersion of activation time distributions across the different rhythms and pacing conditions. All statistical analyses were executed using Prism 8 and the null hypothesis was rejected at the 0.05 level. When one-way ANOVA showed significant differences, pair-wise comparisons between means followed, with post-hoc analysis by Tukey’s multiple comparisons testing.
III. Results
2D and 3D-rendered isochrones were generated for all subjects. A representative example of 3D-rendered ventricular isochrones resulting from His-Bundle pacing is shown in Fig. 2–a. The earliest activated region in red lies in the septal area as expected, close to where the His-Bundle fibers are located and supposedly being directly stimulated. We also note that a homogeneous activation pattern is present, with a predominance of dark orange in both ventricles. The His pacing parameters are in excellent agreement with that of a healthy volunteer (Fig. 2-b). The normal sinus rhythm activation depicts the earliest red activated spot at the septum, with both ventricles activating showing almost simultaneous activation. More quantitatively, RWAT and LWAT values, listed in the table of Fig. 2, were very similar within each subject, with average activation time differences between the two ventricles < 3 ms. %RMtot was nearly at 100% for both subjects, i.e., both their ventricles activated within 120 ms. Hence, 3D-rendered EWI was proven feasible and capable of visualizing and characterizing ventricular activation resulting from His-Bundle pacing for the first time. Representative images of 3D-rendered EWI isochrones for patients in LBBB, RV apex and conventional BiV pacing can be found in previous reports by our group [25], [26]. RWAT, LWAT and %RM values on our entire patient population are listed in Table II and Supplemental Material (Figures S1 through S3). The previously introduced %RM metric failed to distinguish conventional BiV from His-Bundle pacing, as both patient groups lead to high percentage of resynchronized myocardium values between 95 and 100% (Table II, Supplemental Figure S3). RWAT and LWAT (Supplemental Figures S1, S2) both successfully differentiated His-Bundle and standard BiV CRT from LBBB and RV pacing, but failed however to significantly distinguish conventional BiV from His CRT.
Fig. 2.

3D-rendered ventricular isochrones on a) an 87-year-old male with His-Bundle pacing and b) a 26-year-old healthy male volunteer in normal sinus rhythm (NSR). LWAT = mean LV lateral wall activation time, RWAT = mean RV free wall activation time.
TABLE II.
EWI-based metrics measured on the patient population
| Healthy (n=4) | LBBB (n=10) | RV pacing (n=10) | BiV pacing (n=15) | His-Bundle (n=4) | |
|---|---|---|---|---|---|
| RWAT (ms) | 75.3±13.4 | 74.0±11.8 | 82.0±15.4 | 63.5±16.8 | 58.9±15.2 |
| LWAT (ms) | 67.5±11.7 | 109.7±11.7 | 115.2±18.1 | 71.3±8.1 | 63.1±16.2 |
| %RMtot (%) | 99.7±0.4 | 71.3±7.6 | 69.6±14.0 | 95.2±4.3 | 98.6±2.9 |
| Dispersion (ms) | 16.7±3.3 | 36.5±4.3 | 29.5±4.9 | 26.0±3.9 | 17.0±2.7 |
The corresponding bar graphs and statistical test results for RWAT, LWAT and %RMtot can be found in the Supplemental Material (Figures S1 through S3).
In an effort to therefore better quantify the spread of the activation times on our 3D-rendered isochrones, the newly introduced dispersion metric was employed (Table II). Fig. 3 displays the histograms of the activation time distributions and associated dispersion values for a His-Bundle pacing case, an LBBB subject, a conventional BiV pacing CRT case, a chronic RV apex pacing patient and a healthy volunteer in normal sinus rhythm. It is evident that the LBBB histogram with no pacing is the widest with activation times spanning from 25 to approximately 175 ms and the highest dispersion value lying at 35.9 ms. On the other hand, the His-Bundle pacing histogram is the closest in shape to the healthy volunteer’s, with dispersion values at 16.1 ms and 14.4 ms, respectively (Fig. 2). Otherwise, the five histograms exhibit increased narrowing in the following order: no pacing in LBBB, chronic RV apex pacing, conventional BiV pacing in CRT, His-Bundle pacing, and lastly normal physiological sinus rhythm. Three other histogram examples as well as zero-crossing selections are included in the Supplemental Material (Figures S6 through S11).
Fig. 3.

Histograms of the activation time distributions and associated dispersion values for an atrial flutter patient under His-Bundle pacing, an LBBB case, a conventional BiV pacing CRT, a chronic RV apex pacing patient and a healthy volunteer in NSR. In the His Bundle pacing case, the ventricular activation time distribution may have been impacted by the underlying atrial arrhythmia, contrary to the four other subjects who all had sinus rhythm present at baseline with 1:1 AV synchrony. Std = standard deviation, NSR = normal sinus rhythm, AV = atrioventricular.
The activation time dispersion trend across the five rhythms and pacing conditions was further quantified, and the entire patient population was included in the statistical analysis. Fig. 4 depicts the dispersion of activation time distributions for the five rhythms and pacing conditions studied. This graph confirms the trend established in the 5 cases in Fig. 3 and generalizes it to the entire patient population in this study. One-way ANOVA analysis confirmed significant differences in activation time dispersions across the 5 groups (p<0.0001) (Fig. 4). Finally, the dispersion metric could not distinguish His-Bundle pacing from normal true human physiological conduction in the healthy NSR volunteers, confirmed by additional 2D-dispersion values between different groups (Supplemental Table II, Supplemental Figures S4, S5).
Fig. 4.
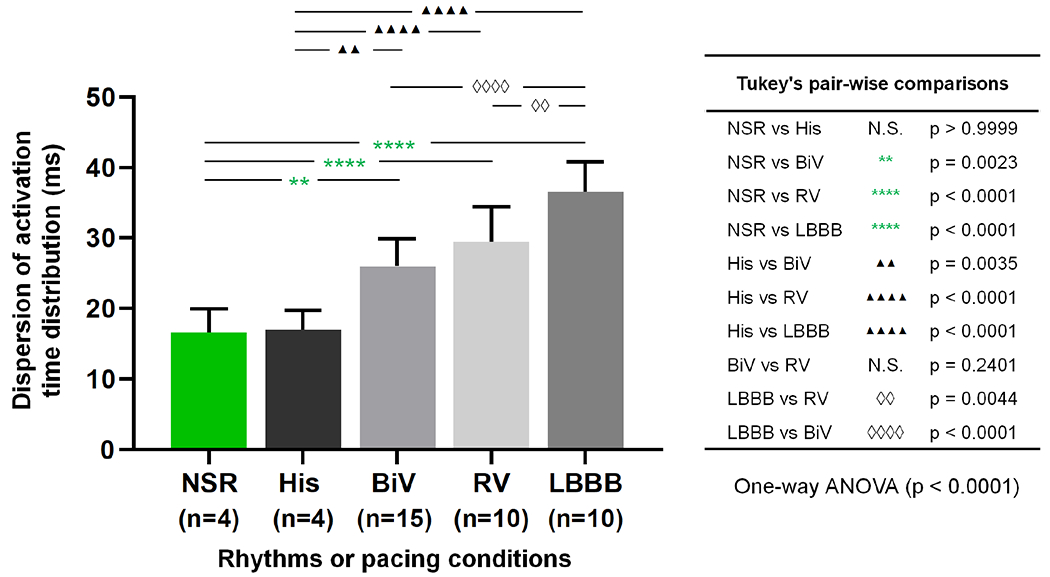
Dispersion of the activation time distributions across the different rhythms and pacing conditions. One-way ANOVA followed by post-hoc analysis with Tukey’s multiple comparisons. All tested pairs and associated p-values are listed in the table on the right of the plot. Significance was achieved for all pair-wise comparisons, except for the two following: i) NSR vs His pacing; and ii) BiV vs RV pacing (despite BiV performing slightly better than RV overall with shorter dispersion values). N.S. = non-significant.
IV. Discussion
Recently, several studies and randomized controlled trials have gained interest in assessing the clinical outcomes and comparing the effects of His pacing in achieving synchronous cardiac activation against other more standard pacing configurations [33]– [37]. In this study, we introduced the EWI-based dispersion metric for a more sensitive differentiation between pacing schemes.
First, 3D-rendered EWI was shown capable of characterizing the ventricular activation resulting from the novel His-Bundle pacing therapy. Second, we obtained highly similar activation patterns to healthy volunteers in normal sinus rhythm on the electromechanical maps (Fig. 2). The histograms indicated a hierarchy across activation time dispersions (from the narrowest to the widest): normal physiological sinus rhythm and His-Bundle pacing, followed by conventional BiV pacing in CRT and chronic RV apex pacing, and lastly, no pacing in LBBB (Fig. 3 and Supplemental figures S6 through S10). This dispersion trend indicated that His-Bundle pacing can perform more efficiently than BiV pacing by addressing the LBBB dyssynchrony directly at the source and recruiting the healthy remnants of the patient’s own conduction system [6], [7]. In this study, we did not find any statistical significance in the mean QRS duration nor mean dispersion that would differentiate male from female subjects (Supplemental Table I). It would thus be warranted to investigate whether differences in heart size and/or QRS gender disparities could be potential confounding factors leading to differences in ventricular activation dispersion, not resulting from the effect of the different pacing conditions themselves (e.g., His vs BiV).
Further statistical analysis demonstrated significant differences (one-way ANOVA, p<0.0001) in activation time dispersion across the 5 groups (Fig. 4). In fact, the dispersion metric was proven to significantly (p<0.005) distinguish His-Bundle pacing from conventional biventricular CRT, chronic RV apex pacing and LBBB rhythm (Fig. 4). More particularly, the significant difference (p=0.0034) found between His and BiV pacing on the dispersion graph supported the hypothesis that His-Bundle pacing, when successful, may provide superior ventricular resynchronization than the CRT gold standard of BiV pacing [16].
Initial feasibility of 3D-rendered EWI with its subsequent dispersion metric quantification was hereby successfully used for the first time to identify and characterize the synchronization of the ventricular activation in various pacing schemes, against LBBB heart failure subjects and healthy volunteers, the most asynchronous and synchronous activation patterns respectively. Comparison between 2D-dispersion (Fig.S5) and 3D-derived dispersion values yielded very similar findings. The slightly lower 3D-derived dispersion values (Table II) could potentially have been affected by the averaging of activation times across ventricular volume leading to excessive activation time smoothing. In addition, the dispersion of the activation time distribution metric can be advantageous compared to mean activation times quantified so far, as it might reduce confounding factors from intra- and/or inter-observer variability that may be present in absolute activation time derivation. Our group also recently conducted efforts to ensure that EWI processing, and more particularly the isochrone generation step, became an automated and less operator dependent process by relying on machine learning [38].
Finally, the study design entails some inherent limitations. We reported initial, albeit promising, results on a very small number of His-Bundle pacing patients. Relevant future work should include investigating the usefulness of 3D-rendered EWI in a larger population, and further validating the value of the new dispersion metric. In fact, performing a direct comparison of EWI-based metrics to indices derived from other non-invasive approaches such as 12-lead ECG, echocardiography and ECGi, and evaluating their capability of predicting CRT response should be examined in a similar way to our previous clinical study [25]. Additional prospective blinded studies are also warranted to establish validity and clinical utility of the technique. More specifically, the novel EWI dispersion metric could play a key clinical role in elucidating synchrony and differentiating long-term CRT responders from non-responders. Combination with more novel CRT delivering methods, such as multipoint and wireless pacing [39] could lead to identification of the most successful CRT novel method for long-term response for each subject.
Another limitation lies in the heterogeneous nature of our small His Bundle patient population. Therefore, the findings might not be generalizable to all heart failure patients undergoing His pacing CRT. However, the findings presented herein confirm those of other successful His-Bundle CRT pacing studies in LBBB patients that report QRS complexes indistinguishable from those with normal QRS [40], such as in atrial fibrillation [41] or sinus bradycardia [6]. Lastly, although QRS duration values have been found stable across different age groups of healthy populations [42], [43], age-matched control subjects will be recruited in future studies.
V. Conclusion
In this proof-of-concept study, we introduced and assessed initial feasibility of a new 3D-rendered EWI-based dispersion metric for non-invasively characterizing ventricular activation in different CRT pacing schemes, with the use of echocardiography. This new metric was found to be most sensitive in the assessment of the success of His-bundle pacing and differentiating its patterns from conventional biventricular pacing CRT, chronic RV apex pacing and baseline LBBB. This study thus yielded a novel, sensitive and accurate tool to characterize synchronization of cardiac activation under various pacing schemes in a clinical setting.
Supplementary Material
Acknowledgements
The authors express their gratitude to Julien Grondin, PhD and Vincent Sayseng, PhD, in the Ultrasound Elasticity and Imaging group for their helpful discussions and suggestions.
This work was supported in part by the National Institutes of Health under grants R01 HL-114358 and R01 HL-140646.
Contributor Information
Lea Melki, Department of Biomedical Engineering, Columbia University.
Melina Tourni, Department of Biomedical Engineering, Columbia University.
Daniel Y. Wang, Department of Medicine, Division of Cardiology, Columbia University
Rachel Weber, Department of Biomedical Engineering, Columbia University.
Elaine Y. Wan, Department of Medicine, Division of Cardiology, Columbia University
Elisa E. Konofagou, Biomedical Engineering and Radiology Departments, Columbia University, New York, NY 10032 USA
References
- [1].Abraham WT et al. “Cardiac resynchronization in chronic heart failure”, New England Journal of Medicine, vol. 346, no. 24, pp. 1845–1853, Jun. 2002. [DOI] [PubMed] [Google Scholar]
- [2].Cleland JGF et al. “The effect of cardiac resynchronization on morbidity and mortality in heart failure”, New England Journal of Medicine, vol. 352, no. 15, pp. 1539–1549, Apr. 2005. [DOI] [PubMed] [Google Scholar]
- [3].Ali H et al. “Para-hisian pacing: new insights of an old pacing maneuver”, JACC: Clinical Electrophysiology, vol. 5, no. 11, pp. 1233–1252, Nov. 2019. [DOI] [PubMed] [Google Scholar]
- [4].Beer D et al. “Clinical outcomes of selective versus nonselective His bundle pacing”, JACC: Clinical Electrophysiology, vol. 5, no. 7, pp. 766–774, Jul. 2019. [DOI] [PubMed] [Google Scholar]
- [5].Lewis AJ et al. “His bundle pacing: a new strategy for physiological ventricular activation”, Journal of the American Heart Association, vol. 8, no. 6, e010972, Mar. 2019. [DOI] [PMC free article] [PubMed] [Google Scholar]
- [6].Ali N et al. “His bundle pacing: a new frontier in the treatment of heart failure”, Arrhythmia & electrophysiology review, vol. 7, no. 2, pp. 103–110, Jun. 2018. [DOI] [PMC free article] [PubMed] [Google Scholar]
- [7].Vijayaraman P et al. “His bundle pacing”, Journal of the American College of Cardiology, vol. 72, no, 8, pp. 927–947, Aug. 2018. [DOI] [PubMed] [Google Scholar]
- [8].Ellenbogen KA and Vijayaraman P, “His bundle pacing. A new promise in heart failure therapy?”, JACC: Clinical Electrophysiology, vol. 1, no. 6, pp. 592–595, Dec. 2015. [DOI] [PubMed] [Google Scholar]
- [9].Lustgarten DL et al. “His-bundle pacing versus biventricular pacing in cardiac resynchronization therapy patients: a crossover design comparison”, Heart rhythm, vol. 12, no. 7, pp. 1548–1557, Jul. 2015. [DOI] [PubMed] [Google Scholar]
- [10].Sharma PS et al. “Permanent His-bundle pacing as an alternative to biventricular pacing for cardiac resynchronization therapy: a multicenter experience”, Heart Rhythm, vol. 15, no. 3, pp. 413–420, Mar. 2018. [DOI] [PubMed] [Google Scholar]
- [11].Niederer SA et al. “Biophysical modeling to simulate the response to multisite left ventricular stimulation using a quadripolar pacing lead”, Pacing and Clinical Electrophysiology, vol. 35, no. 2, pp. 204–214, Feb. 2012. [DOI] [PMC free article] [PubMed] [Google Scholar]
- [12].Pluijmert M et al. ”New insights from a computational model on the relation between pacing site and CRT response”, EP Europace, vol. 18, no. Suppl. 4, pp. iv94–iv103, Dec. 2016. [DOI] [PubMed] [Google Scholar]
- [13].Jackson T et al. ”Noninvasive electrocardiographic assessment of ventricular activation and remodeling response to cardiac resynchronization therapy”, Heart Rhythm, vol. 2, no. 1, pp. 12–18, Feb. 2021. [DOI] [PMC free article] [PubMed] [Google Scholar]
- [14].Zweerink A et al. ”His-optimized cardiac resynchronization therapy with ventricular fusion pacing for electrical resynchronization in heart failure”, JACC: Clinical Electrophysiology, vol. 7, no. 7, pp. 881–892, Jul. 2021. [DOI] [PubMed] [Google Scholar]
- [15].Sharma PS et al. ”Permanent His bundle pacing for cardiac resynchronization therapy in patients with heart failure and right bundle branch block”, Circulation: Arrhythmia and Electrophysiology, vol. 11, no. 9, pp. e006613, Sep. 2018. [DOI] [PubMed] [Google Scholar]
- [16].Arnold AD et al. “His resynchronization versus biventricular pacing in patients with heart failure and left bundle branch block”, Journal of the American College of Cardiology, vol. 72, no. 24, pp. 3112–3122, Dec. 2018. [DOI] [PMC free article] [PubMed] [Google Scholar]
- [17].Provost J et al. “Electromechanical wave imaging for arrhythmias”, Physics in Medicine & Biology, vol. 56, no. 22, pp. L1–11, Nov. 2011. [DOI] [PMC free article] [PubMed] [Google Scholar]
- [18].Provost J et al. “Imaging the electromechanical activity of the heart in vivo”, Proceedings of the National Academy of Sciences, vol. 108, no. 21, pp. 8565–8570, May 2011. [DOI] [PMC free article] [PubMed] [Google Scholar]
- [19].Grondin J et al. “Validation of electromechanical wave imaging in a canine model during pacing and sinus rhythm”, Heart Rhythm, vol. 13, no. 11, pp. 2221–2227, Nov. 2016. [DOI] [PMC free article] [PubMed] [Google Scholar]
- [20].Costet A et al. “Electromechanical wave imaging (EWI) validation in all four cardiac chambers with 3D electroanatomic mapping in canines in vivo”, Physics in Medicine & Biology, vol. 61, no. 22, pp. 8105–8119, Nov. 2016. [DOI] [PMC free article] [PubMed] [Google Scholar]
- [21].Kvale KF et al. “Detection of Regional Mechanical Activation of the Left Ventricular Myocardium Using High Frame Rate Ultrasound Imaging”, IEEE Transactions on Medical Imaging, vol. 38, no. 11, pp. 2665–2675, Nov. 2019. [DOI] [PubMed] [Google Scholar]
- [22].Bessiere F et al. ”High frame rate Ultrasound for Electromechanical Wave Imaging to Differentiate Endocardial From Epicardial Myocardial Activation”, Ultrasound in Medicine & Biology, vol. 46, no. 2, pp. 405–414, Feb. 2020. [DOI] [PubMed] [Google Scholar]
- [23].Provost J et al. “A clinical feasibility study of atrial and ventricular electromechanical wave imaging”, Heart Rhythm, vol. 10, no. 6, pp. 856–862, Jun. 2013. [DOI] [PMC free article] [PubMed] [Google Scholar]
- [24].Bunting E et al. “Imaging the propagation of the electromechanical wave in heart failure patients with cardiac resynchronization therapy”, Pacing and Clinical Electrophysiology, vol. 40, no. 1, pp. 35–45, Jan. 2017. [DOI] [PMC free article] [PubMed] [Google Scholar]
- [25].Melki L et al. “Electromechanical activation mapping can inform cardiac resynchronization therapy response within 24 hours of device implantation”, Journal of the American Society of Echocardiography, Mar. 2021 [DOI] [PMC free article] [PubMed] [Google Scholar]
- [26].Melki L, “Electromechanical wave imaging in the clinic: localization of atrial and ventricular arrhythmias and quantification of cardiac resynchronization therapy response”, Doctoral dissertation Columbia University, 2020, 10.7916/d8-nxy6-ks03. [DOI] [Google Scholar]
- [27].Ghosh S et al. “Electrophysiological substrate and intraventricular LV dyssynchrony in non-ischemic heart failure patients undergoing cardiac resynchronization therapy”, Heart Rhythm, vol. 8, no. 5, pp. 692–699, May 2011. [DOI] [PMC free article] [PubMed] [Google Scholar]
- [28].Luo J and Konofagou EE, ”A fast normalized cross-correlation calculation method for motion estimation”, IEEE Transactions on Ultrasonics, Ferroelectrics, and Frequency Control, vol. 57, no. 6, pp.1347–1357, Jun. 2010. [DOI] [PMC free article] [PubMed] [Google Scholar]
- [29].Kallel F and Ophir J, ”A least-squares strain estimator for elastography”, Ultrasonic imaging, vol. 19, no 3, pp. 195–208, Jul. 1997. [DOI] [PubMed] [Google Scholar]
- [30].Nauleau P et al. “A 3-D rendering algorithm for electromechanical wave imaging of a beating heart”, Medical physics, vol. 44, no. 9, pp. 4766–4772, Sep. 2017. [DOI] [PMC free article] [PubMed] [Google Scholar]
- [31].Melki L et al. “Localization of accessory pathways in pediatric patients with Wolff-Parkinson-White syndrome using 3D-rendered electromechanical wave imaging”, JACC: Clinical Electrophysiology, vol. 5, no. 4, pp. 427–437, Apr. 2019. [DOI] [PMC free article] [PubMed] [Google Scholar]
- [32].Grubb CS et al. “Noninvasive localization of cardiac arrhythmias using electromechanical wave imaging”, Science Translational Medicine, vol. 12, no. 536, eaax6111, Mar. 2020. [DOI] [PMC free article] [PubMed] [Google Scholar]
- [33].Zhuang L et al. “Effects of right ventricular septum or His-bundle pacing versus right ventricular apical pacing on cardiac function: a systematic review and meta-analysis of randomized controlled trials”, Journal of International Medical Research, vol. 46, no. 9, pp. 3848–3860, Sep. 2018. [DOI] [PMC free article] [PubMed] [Google Scholar]
- [34].Shan P et al. “Beneficial effects of upgrading to His bundle pacing in chronically paced patients with left ventricular ejection fraction< 50%”, Heart Rhythm, vol. 15, no. 3, pp. 405–412, Mar. 2018. [DOI] [PubMed] [Google Scholar]
- [35].Ajijola OA et al. “Permanent His-bundle pacing for cardiac resynchronization therapy: initial feasibility study in lieu of left ventricular lead”, Heart Rhythm, vol. 14, no. 9, pp. 1353–1361, Sep. 2017. [DOI] [PubMed] [Google Scholar]
- [36].Upadhyay GA et al. “His corrective pacing or biventricular pacing for cardiac resynchronization in heart failure”, Journal of the American College of Cardiology, vol. 74, no. 1, pp. 157–159, Jul. 2019. [DOI] [PubMed] [Google Scholar]
- [37].Upadhyay GA et al. “On-treatment comparison between corrective His bundle pacing and biventricular pacing for cardiac resynchronization: a secondary analysis of the His-SYNC Pilot Trial”, Heart Rhythm, vol. 16, no. 12, pp. 1797–1807, Dec. 2019. [DOI] [PubMed] [Google Scholar]
- [38].Melki L, Tourni M, and Konofagou EE, “Electromechanical wave imaging with machine learning for automated isochrone generation”, IEEE Transactions on Medical Imaging, Apr. 2021 [DOI] [PMC free article] [PubMed] [Google Scholar]
- [39].Reddy VY et al. “Cardiac resynchronization therapy with wireless left ventricular endocardial pacing: the select-lv study”, Journal of the American College of Cardiology, vol. 69, no. 17, pp. 2119–2129, May 2017. [DOI] [PubMed] [Google Scholar]
- [40].Keene D et al. “Pacing supplement: His-bundle pacing–UK experience and HOPE for the future”, The British Journal of Cardiology, vol. 25, suppl 3, pp. S25–S29, Oct. 2018. [Google Scholar]
- [41].Wang S et al. “Feasibility and efficacy of His bundle pacing or left bundle pacing combined with atrioventricular node ablation in patients with persistent atrial fibrillation and implantable cardioverter-defibrillator therapy”, Journal of the American Heart Association, vol. 8, no. 24, e014253, Dec. 2019. [DOI] [PMC free article] [PubMed] [Google Scholar]
- [42].Rijnbeek PR et al. “Normal values of the electrocardiogram for ages 16-90 years”, Journal of electrocardiology, vol. 47, no. 6, pp. 914–21, Nov. 2014. [DOI] [PubMed] [Google Scholar]
- [43].Mason JW et al. “Electrocardiographic reference ranges derived from 79,743 ambulatory subjects”, Journal of electrocardiology, vol. 40, no. 3, pp. 228–234, May 2007. [DOI] [PubMed] [Google Scholar]
Associated Data
This section collects any data citations, data availability statements, or supplementary materials included in this article.