

Abstract
Auxetic materials are the materials that can display negative Poisson’s ratio that describes the degree to which a material contracts (or expands) transversally when axially strained. Human stem cells sense the mechanical properties of the microenvironment, including material surface properties, stiffness, and Poisson’s ratio. In this study, six different auxetic polyurethane (PU) foams with different elastic modulus (0.7-1.8 kPa) and Poisson’s ratio (−0.1 to −0.5) were used to investigate lineage specification of human induced pluripotent stem cells (hiPSCs). The surfaces of the foams were modified with chitosan or heparin to enhance the adhesion and proliferation of hiPSCs. Then, the vascular and neural differentiation of hiPSCs were investigated on different foams with distinct elastic modulus and Poisson’s ratio. With different auxetic foams, cells showed differential adherent density and differentiation capacity. Chitosan and heparin surface functionalization promoted the hindbrain and hippocampal markers, but not forebrain markers during neural patterning of hiPSCs. Properly surface engineered auxetic scaffolds can also promote vascular differentiation of hiPSCs. This study represents a versatile and multifunctional scaffold fabrication approach and could lead to a suitable system for establishing hiPSC culture models in applications of neurovascular disease modeling and drug screening.
Keywords: human pluripotent stem cells, auxetic scaffolds, elastic modulus, Poisson’s ratio, neural differentiation, vascular differentiation
1. Introduction
Engineered auxetic metamaterials are materials with negative Poisson’s ratio. They have been investigated for more than three decades [1]. Efforts have also been extended toward development of molecular auxetics, such as crystalline materials, carbon allotropes and other high-performance materials [2]. Auxetic scaffolds have unique properties such as high energy absorption, improved fracture resistance and high indentation resistance. Furthermore, the mechanical properties of auxetic materials [3–5] can be tuned to provide materials with different modulus, Poisson’s ratio, or viscoelasticity. They have found applications in sport protective equipment [6], electromagnetic devices [7], and vascular and cartilage implants etc.[8]
The cellular microenvironment is important for maintaining the physiologic function of tissues and stem cells [9, 10]. The biological and chemical components as well as the organized microstructure of the extracellular matrix (ECM) are key factors that drive specific cellular behaviors [11]. Additionally, stem cells also sense and respond to mechanical forces [10]. The mechano-sensitivity of stem cells has been investigated for over two decades. The details of stem cell behavior on 2D substrates have been comprehensively studied [12]. However, there are a few reports on the biophysical behaviors of pluripotent stem cells (PSCs) in 3D culture systems [10]. Previously it was shown that a 3D culture environment more efficiently drives PSC differentiation compared to 2D systems [13]. The 3D culture environment more closely mimics the in vivo stem cell niche and provides better regulatory cues to the PSCs. For example, PSCs display improved growth, proliferation, and differentiation in 3D poly(3-hyroxybutyrate-co-3-hydoxyhexanoate) membranes, a member of polyhydroxy fatty acid family [14]. Matrix stiffness is also an important variable that can be tuned with various gel and polymer systems [15].
Another important aspect of the 3D culture environment is its deformation characteristics in the three-dimensional space. This is reflected in the system’s Poison’s ratio, which is the ratio of the deformation in the transverse direction over that of the principal stress direction. While materials stiffness/modulus span over a broad range, Poisson’s ratio for nearly all materials (nature or man-made) is within a small, positive range, typically 0.3~0.5 [16]. Auxetic materials on the other hand, display inverted mechanical deformations under stretching or compression compared with positive Poisson’s ratio materials [16]. They expand when stretched and contract when compressed, providing a fundamentally different mechanical environment for 3D culture.
Meanwhile, the Poisson’s ratio of the materials is a less studied biophysical factor that is likely to influence stem cell fate [4]. It was recently found that embryonic stem cells at the pluripotent state have auxetic nuclei [17]. Human brain tissue was reported to have Poisson’s ratio of nearly zero [18]. Auxetic materials with tunable Poisson’s ratio have been reported to influence cell division [19] and stem cell fate decisions [20]. Auxetic materials have also been used for bioprostheses and artery stents due to their enhanced compressive strength and shear stiffness [21]. These studies suggested that the unique biophysical characteristics of auxetic materials could provide a novel approach for regulating the fate of stem cells.
Polyurethane (PU) materials are widely used in tissue engineering and medical implant applications, due to the tunable mechanical properties, good biocompatibility and controlled biodegradability [22]. In our previous work auxetic PU foams [23] were used to investigate the differentiation of human induced PSCs (hiPSCs) to neural progenitor cells (iNPCs) [20] and vascular cells [24]. The influence of pore structure, Poisson’s ratio, and elastic modulus on iPSC differentiation was evaluated. Our results showed better neural and vascular differentiation of iPSCs within auxetic foams compared to regular PU foams. The Poisson’s ratio of the scaffolds can confound the effect of the elastic modulus on stem cell lineage-specification. In addition, the activation of the Hippo/Yes-associated protein (YAP) pathway and the nuclear/cytoplasmic localization of YAP, was shown to be affected by the Poisson’s ratio of the scaffolds [24] and other biophysical parameters such as nanotopography [25].
These previous studies only investigated the auxetic (AU) scaffolds with a limited range of modulus and without any surface functionalization for cell – scaffold interaction. Therefore, this study expanded the modulus range with six different AU scaffolds, and modified their surface with two biomolecules to regulate cellular interaction with the material, i.e., chitosan to promote stem cell adhesion [26] and heparin to promote the retention of heparin-binding growth factors and regulate neural patterning [27, 28]. hiPSCs were seeded in various auxetic foams with surface modification and the influence of different auxetic scaffolds on neural and endothelial differentiation from hiPSCs was evaluated. The goals of this study were to design the proper auxetic foam for neural or vessel tissue development in order to construct better in vitro neurovascular models for testing potential treatments of neurological diseases.
2. Materials and Methods
2.1. Auxetic scaffolds fabrication
Auxetic PU (AU) foams were fabricated using previously developed processes [29]. In brief, the process involves isotropic compression of the starting materials followed by structure fixation. By careful selection of the starting materials and control of the fabrication conditions, different auxetic foams can be fabricated. Six AU foams were used in the current study. They were denoted as AU-1, AU-2, AU-3, AU-4, AU-5, and AU-6. The AU foams were subjected to the following further modifications: no modification or pristine (P), extended after heat treatment (130°C for two hours) (Ex), chitosan modified (C), and heparin modified (H).
2.2. Elastic modulus and Poisson’s ratio measurements
The elastic modulus and Poisson’s ratio of the auxetic foams were measured using a video extensometer system (Shimadzu DV-201). For elastic modulus: The auxetic foams were cut into a dumbbell shape and clamped into the machine. Samples were extended at a 6 mm/min stretching rate, the force generating from the foams were recorded. For Poisson’s ratio: The measurement was extracted from cycling tensile tests without breaking the foams. In tensile test the strain rate was set at 6 mm/min and maximum strain of 10%. Sample deformations were captured by a camera. For the calculation of Poisson’s ratio, the video data were first transformed into image data using MATLAB 2021b. The length (L) and width (W) of the sample for every image were measured using ImageJ software. These measurements were used to calculate the transverse strain (εx) and longitudinal strain (εy) using the following equations:
\ where ΔL and ΔW are the change of the length and width, L0 and W0 are the original length and width of the foams. Finally, the average Poisson’s ratio (ν) was calculated from the strain–strain curve based on the classical definition of Poisson’s ratio, where y is the stretch direction:
2.3. Surface modification
In this study, the classic poly(acrylic acid) (PAA, Sigma) modification method was used [30]. First, the auxetic foam surface was cleaned by ethanol with ultrasonication followed by washing with deionized water three times. The foams were then dried overnight at room temperature. The following day, the dried foams were put into a Plasma generator and processed under 90 W with 50 sccm O2 for 8 min. 10%, 30%, 50%, 70%, and 90% AA aqueous (ν/ν) were made. 50 mL AA solution with 250 μL of 0.015 M FeSO4 (Sigma)/0.005 M H2SO4 was added in a glass container and then degassed with ultra-pure N2 at 60°C for 30 min. Afterwards, the auxetic foams were immersed in the solution to allow the graft polymerization for two hours. The foams then were washed with deionized water for 5 min to remove the unreacted monomer and homopolymers.
The foams were then incubated in 20 mL of 0.01 M (1-ethyl-3-(3-dimethylaminopropyl) carbodiimide hydrochloride (EDC, TCI)/0.01 M N-Hydroxysuccinimide (NHS, VWR) of pH4 buffer at 4°C overnight, followed by soaking in 1 mg/mL heparin or 1 mg/mL chitosan in phosphate-buffered saline (PBS) solution at 4°C for 4 h. Afterwards, the foams were washed with sterile PBS and then soaked in 70% (ν/ν) ethanol for sterilization. Finally, the foams were washed with sterile PBS five times to remove the ethanol prior to cell culture.
2.4. ATR-FTIR characterization, contact angle measurement, and BSA-FITC labeling
The surface modification of PAA was tested by Fourier Transform Infrared Spectroscopy (FTIR). The original auxetic foams and the PAA-modified foams were tested by FTIR Nicolet iS50 Spectrometer and the Attenuated Total Reflection (ATR) part is a Smart Orbit ATR Diamond Crystal with SPA-2 Tower (Thermo Scientific, Pittsburg, PA). For contact angle measurement, after dropping 10 μL deionized water on the foams, pictures were taken using the camera. The contact angle of the water was analyzed using ImageJ. For BSA-FITC labeling, the activated, PAA modified and the original auxetic foams were incubated in the 1 mg/mL of bovine serum albumin (BSA)-fluorescein conjugate, i.e., BSA-FITC, aqueous solution at 4°C for three hours. These foams were then washed with PBS to remove the unreacted BSA-FITC.
2.5. Scanning electron microscopy (SEM)
To assess scaffolds, samples without cells were cut using a razor blade and the exposed surface was sputter-coated with a thin layer of gold before observation. For hiPSCs grown in the scaffolds, the samples were washed with PBS, fixed in 2.5% glutaraldehyde (Alfa Aesar) for 30–60 min, and dehydrated in graded ethanol solutions. The samples were dried by hexamethyldisilazane (HMDS) evaporation, mounted, and sputter-coated with gold. Observations were made using a FEI Dual Beam Focused Ion Beam/Field Emission Scanning Electron Microscope (Thermo Fisher Scientific, Pittsburgh, PA) under low-vacuum conditions.
2.6. hiPSC culture and seeding on auxetic scaffolds
Human iPSK3 cells were maintained as described in our previous publications [31]. Prior to seeding, the sterilized foams were cut into proper sizes for different culture conditions (10 mm × 10 mm × 1.5 mm for 24-well tissue culture plate and 4 mm × 4 mm × 1 mm for 96-well plate). In 24-well plate, about 5×10⁵ cells in DMEM/F-12 (Thermo Fisher) plus 2% B27 serum-free (Thermo Fisher) medium were seeded into each scaffold in the presence of 1 μM Rho-associated protein kinase (ROCK) inhibitor Y27632 (Sigma) for 24 hours. In 96-well plate, about 1×10⁵ cells in DMEM/F-12 plus 2% B27 serum-free medium or mTeSR™ medium (STEMCELL Technologies Inc.) were seeded into each scaffold.
2.7. Neural and vascular differentiation
For neural differentiation, 0.5×10⁶ hiPSCs in DMEM/F-12 plus 2% B27 serum-free medium containing 1 μM ROCK inhibitor Y27632 were seeded to the sterilized scaffolds at day 0. Then, during day 1-7, the culture medium was changed every two days to treat cells with dual SMAD inhibitors, 10 μM SB 431542 (Sigma) and 100 nM LDN 193189 (Sigma). During day 8-14, the culture was fed every two days with DMEM/F-12 plus 2% B27 serum-free medium with 10 ng/mL fibroblast growth factor (FGF2) (Peprotech) and 5 μM retinoic acid (RA, Sigma). At day 15, the harvested cell aggregates were seeded onto the 24-well plates (Corning Incorporated, Corning, NY) coated with growth factor-reduced Matrigel for one hour at 37°C. The derived cells were referred as iNPCs.
For vascular differentiation of hiPSCs, 0.5×10⁶ hiPSCs in DMEM/F-12 plus 2% B27 serum-free medium containing 1 μM Y27632 were seeded to the scaffolds at day 0. Then, the Wnt activator CHIR99021 (12 μM, STEMCELL Technologies Inc.) was added to the culture medium at day 3. At day 5, 7, and 9, the media (DMEM/F-12 with 2% B27) were changed to treat the aggregates with bone morphogenetic protein (BMP) 4 (Peprotech) (20 ng/mL), vascular endothelial growth factor (VEGF)-A (Peprotech) (20 ng/mL), and FGF2 (20 ng/mL). At day 11, cells are switched to the medium containing VEGF-A (20 ng/mL), and FGF2 (20 ng/mL), SB431542 (10 μM) to promote endothelial cell (EC) differentiation and suppress pericyte differentiation. At day 13, the cell aggregates were embedded in Matrigel and overlaid with differentiation medium containing 15% fetal bovine serum (FBS), 20 ng/mL VEGF-A, and 20 ng/mL FGF-2. Medium was changed every two or three days. At day 18, vascular networks were observed and analyzed. The derived cells were referred as iECs.
2.8. 2,5-diphenyl-2H-tetrazolium bromide (MTT) assay and DNA assay
After overnight incubation, the scaffolds with cells were transferred into new wells with 1 mL of culture media. The cells within scaffolds grew for 1, 3, 5 and 7 days and were characterized by MTT assay and DNA assay (for cell number determination). For MTT assay, the cells were incubated with 5 mg/mL MTT solution for three hours. Then, the formazan crystals were centrifuged and hydrolyzed by dimethyl sulfoxide. Afterwards, the pink solution was read at 570 nm by the microplate reader (BioRad Laboratories, Hercules, CA). For DNA assay, the cells were harvested and lysed with 0.1 mg/mL proteinase K (Fisher Scientific, Pittsburgh, PA) at 50°C overnight. The lysates (100 μL) were mixed with 100 μL of Picogreen (Molecular Probes, Eugene, OR) in a 96-well plate. The plate was incubated for 5 min in the dark and then read on a fluorescent plate reader with 485ex/528em (BioRad Laboratories, Hercules, CA).
2.9. Immunocytochemistry
For neural differentiation, the samples were fixed with 4% paraformaldehyde and permeabilized with cold methanol for staining intracellular markers. The samples were then blocked (5% FBS) and incubated with various mouse or rabbit primary antibodies (Supplementary Table S1). Beta III Tubulin (mouse IgG1), Nestin (rabbit IgG), PAX6 (mouse IgG1), FOXG1 (rabbit IgG) were stained with the secondary antibodies Alexa Fluor® 488 goat anti-mouse IgG1 (for beta III Tubulin and PAX6) or Alexa Fluor® 488 goat anti-rabbit IgG (for FOXG1 and Nestin). The cell nuclei were stained with Hoechst 33342 (blue), and the images were taken under a fluorescence microscope (Olympus IX70). For vascular differentiation, all the tested markers are surface markers, including kinase insert domain receptor (KDR) (mouse IgG1), Zonula occludens protein 1 (ZO-1) (Mouse IgG1), CD31 (mouse IgG1), and VE-Cadherin (goat IgG). No permeabilization was performed after fixation. The secondary antibodies were Alexa Fluor® 488 goat anti-mouse IgG1 or Alexa Fluor® 594 donkey anti-goat IgG. For YAP staining, all the iNPCs and iECs were incubated with rabbit primary antibody YAP, rabbit IgG (Santa Cruz), followed by Alexa Fluor® 488 goat anti-rabbit IgG. The samples were stained with Hoechst 33342 and visualized using a fluorescent microscope (Olympus IX70, Melville, NY). The images from five independent fields were analyzed using ImageJ for the number of cells with nuclear or cytoplasmic YAP localization.
2.10. Flow cytometry
Briefly, 1×10⁶ cells per sample were fixed with 4% paraformaldehyde and washed with staining buffer (2% FBS in PBS). The iNPCs were permeabilized with 100% cold methanol for intracellular markers, blocked, and then incubated with primary antibodies against Nestin or Beta-tubulin III followed by the corresponding secondary antibody (Supplementary Table S1). For surface markers of iECs, the cells were blocked and then incubated with primary antibodies against ZO-1 or CD31 followed by the Alexa Fluor® 488 goat anti-mouse IgG1 (for CD31 and ZO-1). The cells were acquired with BD FACSCanto™ II flow cytometer (Becton Dickinson) and analyzed against isotype controls using FlowJo software.
2.11. Reverse transcription-polymerase chain reaction (RT-PCR)
Total RNA was isolated from the cell samples using the RNeasy Mini Kit (Qiagen, Valencia, CA) according to the manufacture’s protocol, followed by treatment with the DNA-Free RNA Kit (Zymo, Irvine, CA). Reverse Transcription was carried out using 2 μg of total RNA, anchored oligo-dT primers, and Superscript III (Invitrogen, Carlsbad, CA), according to the manufacturer’s protocol. Primers were specific to the targeted gene (Supplementary Table S2). The primers were designed using the software Primer-BLAST (NIH Database). The gene β-actin was used as an endogenous control for the normalization of expression levels. RT-PCR reactions were performed on an ABI7500 instrument (Applied Biosystems, Foster City, CA), using SYBRI Green PCR Master Mix (Applied Biosystems). The amplification reactions were performed as follows: 2 minutes at 50°C; 10 minutes at 95°C; and 40 cycles of 95°C for 15 seconds; 55°C for 30 seconds; and 68°C for 30 seconds. The Ct values of the target genes were firstly normalized to the Ct values of the endogenous control β-actin. The corrected Ct values were then compared for the treatment conditions to the untreated control. Fold changes in gene expression was calculated using the comparative Ct method: 2−(ΔCt treatment−ΔCt control) to obtain the relative expression.
2.12. Statistical Analysis
All statistical analyses were conducted with OriginPro 2021 9.8.0.200. Each experiment was carried out at least three times. The representative experiments were presented, and the results were expressed as mean ± standard deviation. To assess the statistical significance, one-way analysis of variance (ANOVA) was conducted. All groups were compared between each other with Tukey’s multiple comparisons test. A p-value <0.05 was considered statistically significant.
3. Results
3.1. Auxetic scaffold characterizations and surface engineering
The re-entrant structure of the auxetic materials and an illustration of their unique properties under stretch are shown in Figure 1A. This kind of structure is generated after tri-axial compression from the reticulate structure. The SAN particles inside the scaffolds have changed and can hold the new dimension of the auxetic scaffolds. The generation of re-entrant structure is necessary for conversion from positive Poisson’s ratio scaffolds to auxetic (zero or negative Poisson’s ratio scaffolds. The mechanical properties of six different auxetic scaffolds were characterized (Figure 1B and Table 1). The Young’s modulus of the AU-1 to AU-6 foams were 1400±78 Pa, 700±28 Pa, 2700±56 Pa, 700±43 Pa, 1800±69 Pa, and 365±50 Pa respectively. Poisson’s ratios of different scaffolds were −0.297, −0.508, −0.347, −0.322, −0.348, and −0.196 respectively. AU-2 and AU-4 scaffolds have the same modulus but different Poisson’s ratio. AU-3 and AU-5 have the same Poisson’s ratio but different modulus. This provides independent control of the two material properties. The SEM images demonstrate the prevalence of the re-entrant structure in the auxetic foams (Figure 1C).
Figure 1. Characterization of physical properties of different auxetic PU foams.
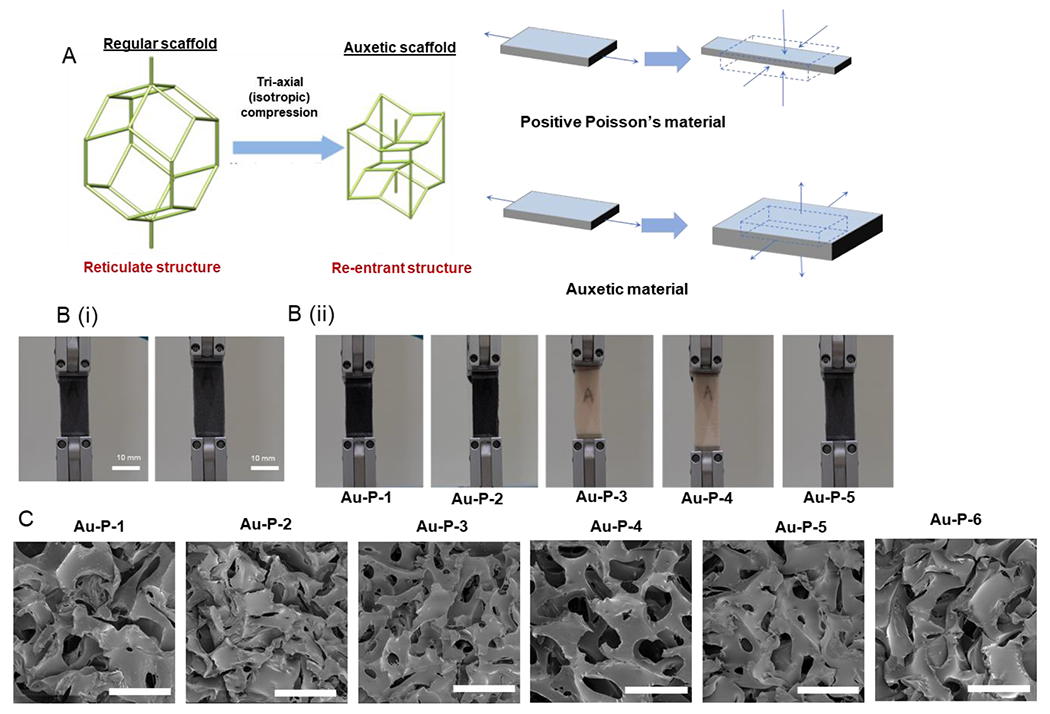
(A) Schematics of auxetic foam fabrication and the deformation behavior; (B) Photographs illustrating the auxetic behavior of the AU foam under tension; (C) Scanning electron microscopy (SEM) images of the porous structure of the auxetic foams. Scale bar = 500 μm
Table 1.
Modulus and Poisson’s ratio of seven AU scaffold samples.
| Sample ID | AU-P-1 | AU-P-2 | AU-P-3 | AU-P-4 | AU-P-5 | AU-P-6 | AU-Ex-6 |
|---|---|---|---|---|---|---|---|
| E(Pa) | 1400±78 | 700±28 | 2700±56 | 700±43 | 1800±69 | 365±50 | 465±64 |
| Poisson’s ratio | −0.297 | −0.508 | −0.347 | −0.322 | −0.348 | −0.196 | −0.147 |
The scaffolds can be modified by biomolecules to change the surface property and to regulate cell adhesion or proliferation (Figure 2A). In this study, the PAA was used as the mediate polymer to introduce carboxylic acid group on the PU surface. Then, the -COOH groups were activated by EDC/NHS for further modification. Afterwards, the biomolecules containing primary amine can be grafted on the PU scaffolds. The increase of 3300 cm−1 from O-H stretching vibration and the increase of 1720 cm−1 due to the stretching vibration of C=O groups were observed (Supplementary Figure S1). In addition, water contact angle on the surface of the scaffolds was changed during the graft step from 112±5° to 99±3° (Figure 2B). Finally, the fluorescent biomolecule BSA-FITC was used for testing the modification efficiency. The activated -COOH group can be conjugated with BSA-FITC and the concentration of the AA influences modification density of the biomolecules (Figure 2C). The results present a feasible strategy for surface modification of PU scaffolds. After modification and the heat-extending step, four types of scaffolds were obtained from the original auxetic foams, the pristine auxetic scaffolds (P), the extended scaffold (Ex), the chitosan modified scaffold (C), and the heparin modified scaffold (H).
Figure 2. Surface modification and characterization of the modified surfaces.
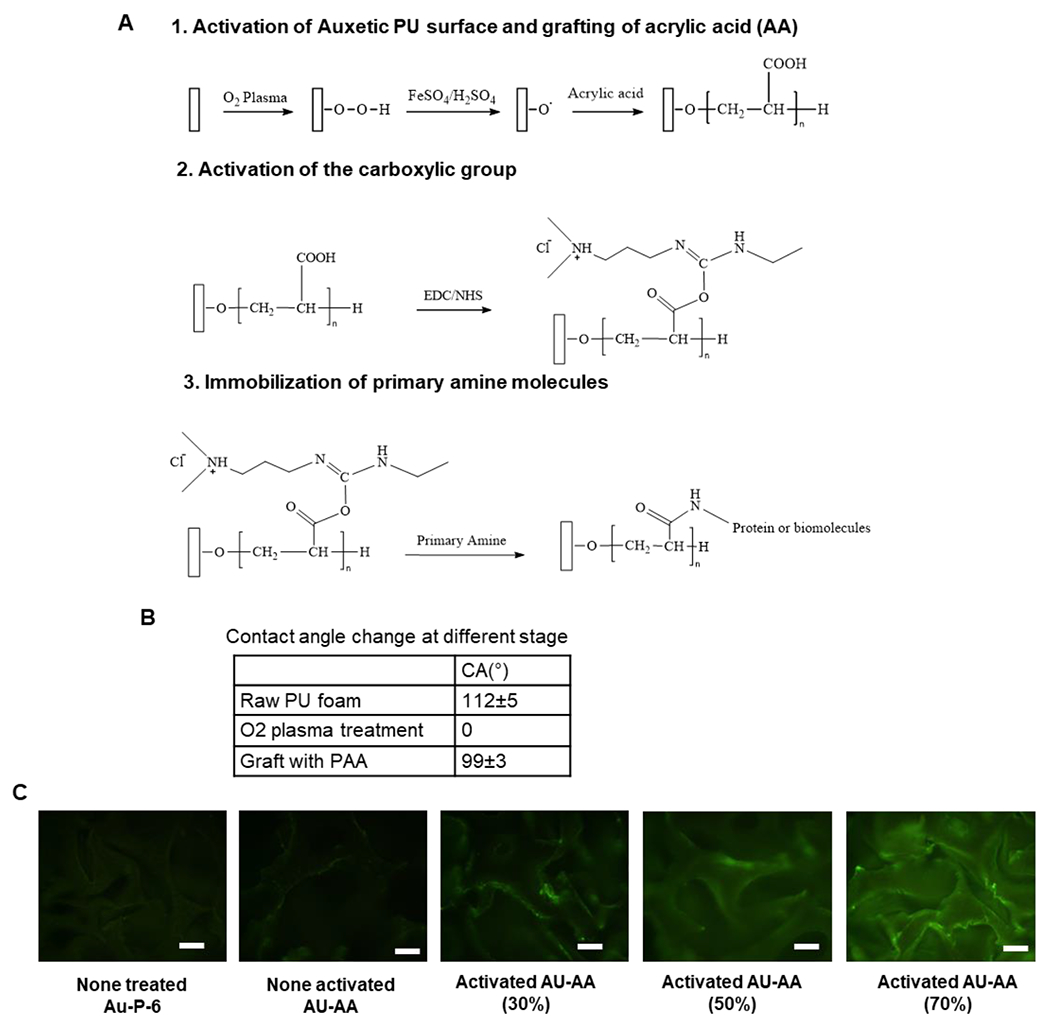
(A) Schematic illustration of PU auxetic foam modification. (B) Contact angle of the surface of the foam at different stages. (C) Fluorescence test for BSA-FITC conjugated with activated carboxylic group. Scale bar = 100 μm.
3.2. Biocompatibility and cell proliferation in surface engineered auxetic scaffolds
For cell morphology evaluation, hiPSCs were seeded into different scaffolds and organized into undifferentiated cell aggregates in mTeSR medium and the cell aggregates without scaffolds were set as the control group. The AU-6 scaffolds (the softest group as shown in Table 1) with four types of modifications (i.e., P, Ex, C, and H) were firstly tested. After 7 days, the SEM images reveal the morphology of cell aggregates in the scaffolds (Figure 3A). Some of the aggregates attached on the surface of the scaffolds and started to spread. Figure 3B shows the cell aggregate morphology in the scaffolds after staining with Hoechst 33342. Consistently, there were some small aggregates adhered to the scaffolds. To assess biocompatibility, DNA content shows cell proliferation, and MTT activity shows cell viability and metabolic activity of the cells in the scaffolds (Figure 3C, 3D, and Supplementary Figure S2). MTT results after 7-day culture show that the 30% and 50% AA conditions can maintain higher cell metabolic activity compared to 10%, 70%, and 90% AA conditions (Figure 3C). Therefore, 30% AA was selected as the modification concentration in the subsequent experiments. Based on DNA content, the cell only group showed the most cells after 7-day culture, possibly because some cells in the scaffolds were lost during medium change. In addition, the condition of the AU-Ex-6 scaffold had higher cell number at day 1, but the cells did not proliferate well with increased culture time. Cells cultured on the other three types of scaffolds (P, C, and H) demonstrated proliferation during the culture period (Figure 3D).
Figure 3. Biocompatibility with the extended foam under different surface modifications.
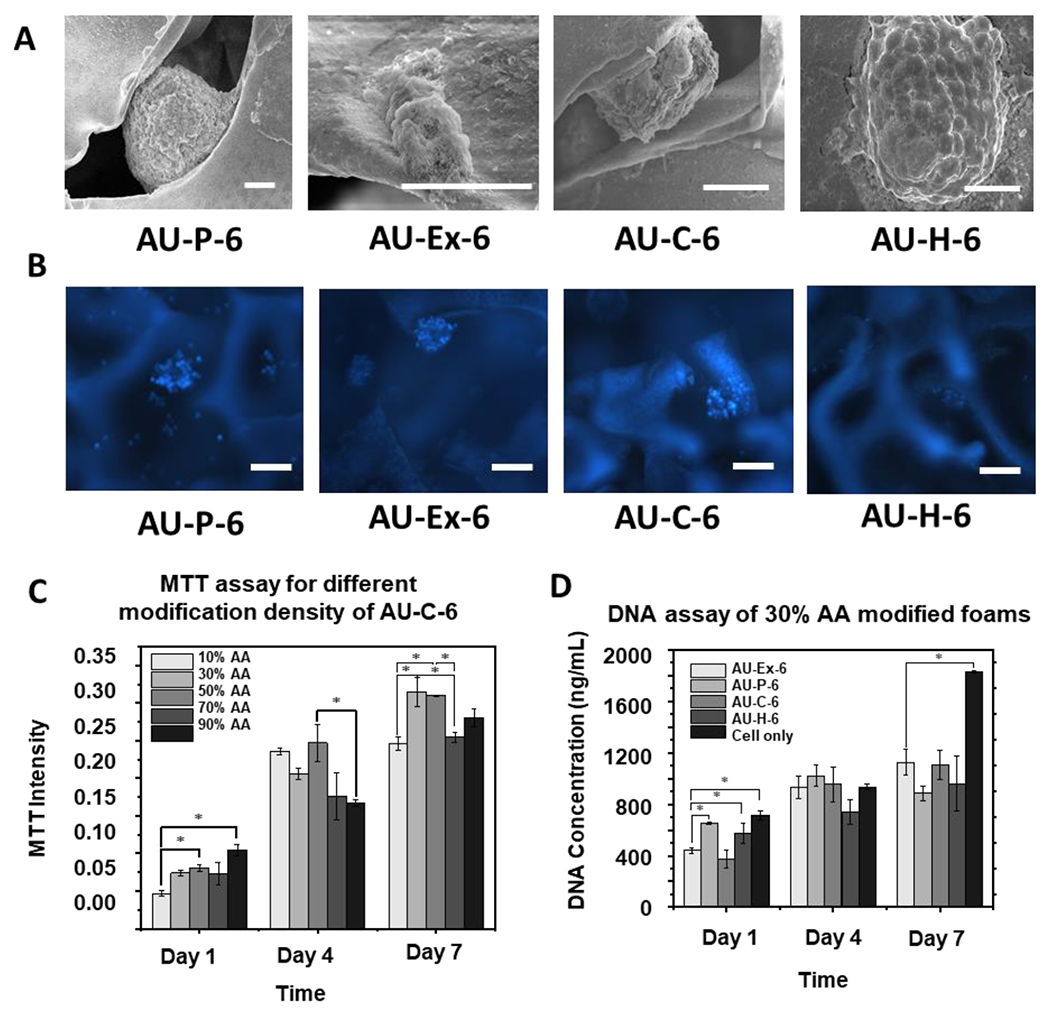
(A) Scanning electron microscopy (SEM) images of the hiPSC aggregates (day 7) in the AU foams. (B) Images of auxetic foam and extended foam. Scale bar: 100 μm; (C) MTT assay of different AA concentrations with chitosan modified foams. Scale bar: 100 μm; (D) DNA assay of 30% AA modified foams. n =3. * indicates p <0.05. AU-P: pristine auxetic scaffolds; AU-Ex: extended auxetic scaffolds; AU-C: Chitosan modified auxetic scaffolds; AU-H: heparin modified auxetic scaffolds.
Subsequently, the biocompatibility of AU-1 to AU-5 scaffolds with different elastic modulus and Poisson’s ratio were investigated by MTT assay (Figure 4A) and DNA assay (Figure 4B). The MTT results showed that in all groups the chitosan-modified scaffolds have the highest cell viability and metabolic activities in general. From DNA assay, at day 1 and day 4, the chitosan- and heparin-modified scaffolds showed better cell proliferation compared to the pristine scaffolds. At day 7, the DNA contents of all the groups had similar expression levels, possibly because the cell number reached the plateau, except that the AU-5 group showed a slightly lower level.
Figure 4. Metabolic activity and DNA content for hiPSCs grown in different AU scaffolds.
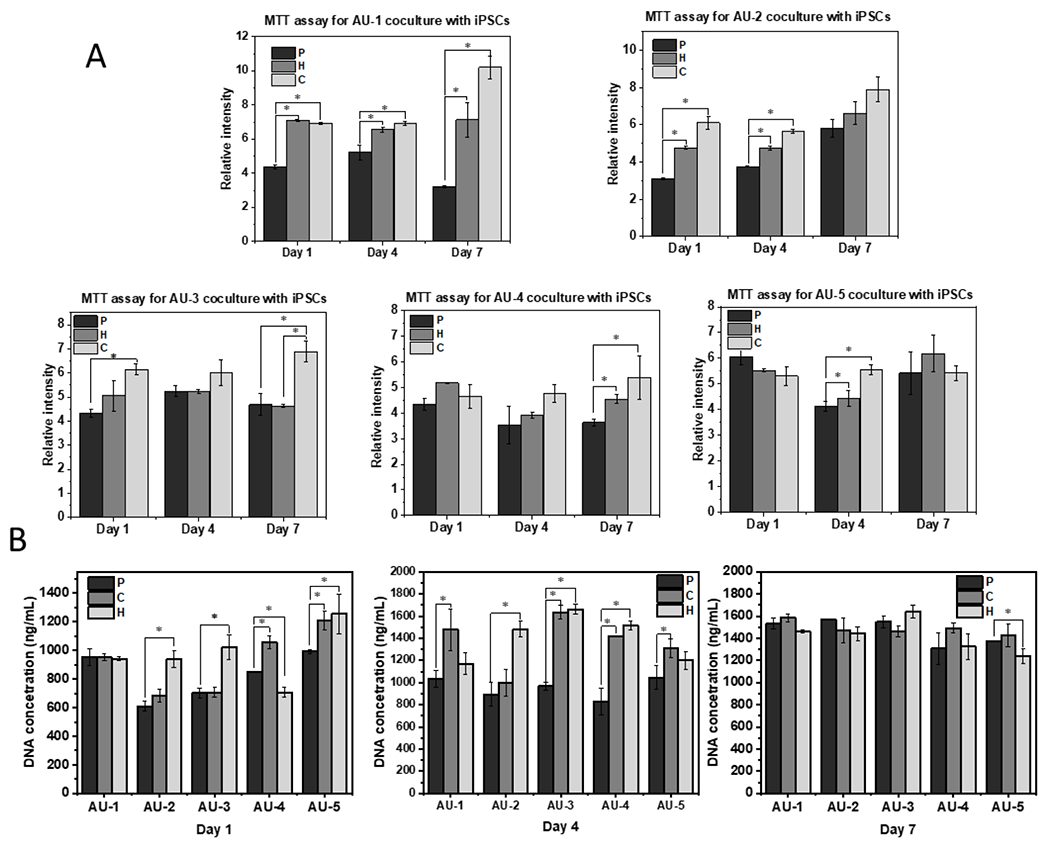
(A) MTT activity of hiPSCs grown in AU-1 to AU-5 scaffolds with heparin and chitosan modifications; (B) DNA assay of hiPSCs grown in AU-1 to AU-5 scaffolds with heparin and chitosan modifications for 1, 4, and 7-day culture. n=3. * indicates p<0.05. P: pristine auxetic scaffolds; C: Chitosan-modified auxetic scaffolds; H: heparin-modified auxetic scaffolds.
3.3. Effects of surface engineering on vascular differentiation of hiPSCs
The AU scaffolds were then evaluated for lineage-specific differentiations. hiPSCs were seeded into different AU scaffolds and self-organized into cell aggregates following vascular differentiation protocols (Figure 5A and Supplementary Figure S3). The differentiation of iECs were initially investigated with AU-6 scaffolds (with the lowest elastic modulus) before testing the other five AU scaffolds with different elastic modulus and Poisson’s ratio. After 18-day culture of iECs, the expression of the iEC marker CD31 was observed in the immunostaining images (Figure 5B). The CD31 intensity was similar for the cells from the pristine, chitosan modified, and heparin modified scaffolds, while the cells of the extended scaffolds indicated the lowest expression. However, from flow cytometry data, CD31 was expressed at a slightly higher level for the cells in AU-H scaffolds (84.7%) than the other three modifications (P, Ex, and C, with 66.6%, 77.7%, and 75.5% respectively) (Figure 5C).
Figure 5. iEC differentiation of hiPSCs grown in AU-6 scaffolds with different surface modifications.
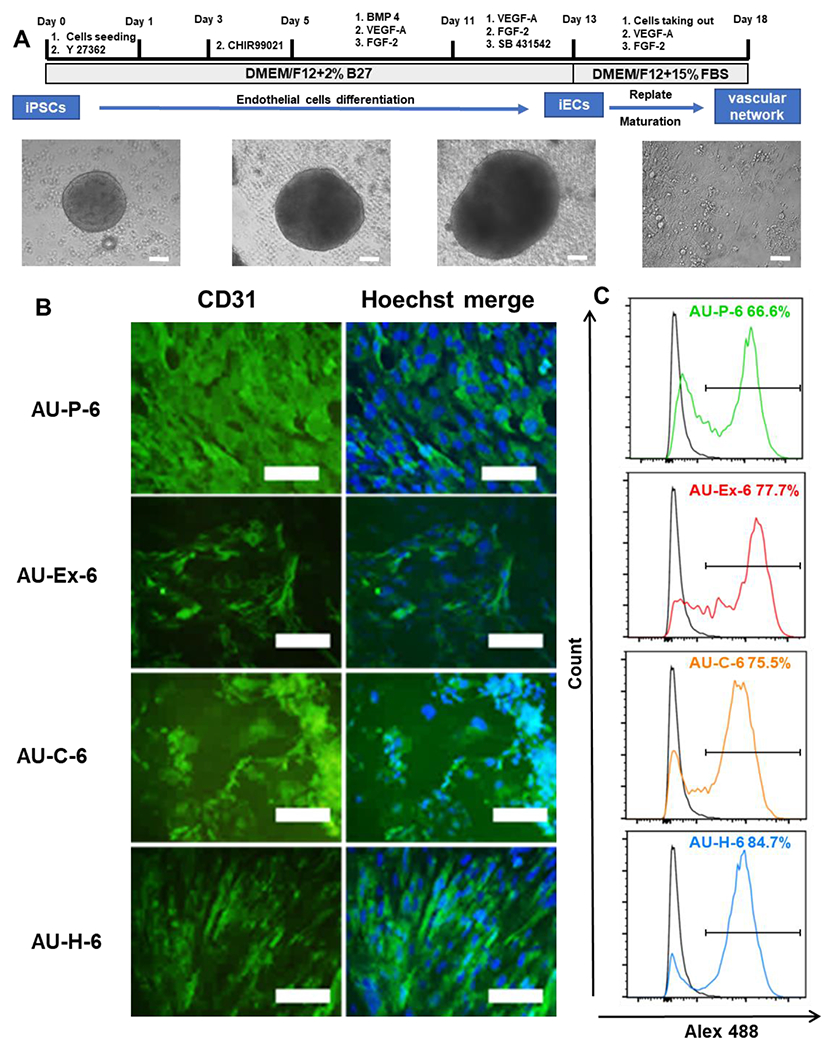
(A) Schematic illustration and images of differentiation of hiPSCs into endothelial cells (hiPSC-ECs), or vascular organoids. Scale bar: 100 μm. (B) Fluorescent images of the markers expression of the replated cells from different scaffold were taken. Vascular maker, CD31 (green, day 20). Scale bar = 100 μm. (C) Flow cytometry histograms of CD31 expression. Black line: negative control. Color line: CD31 expression. AU-P: pristine auxetic scaffolds; AU-Ex: extended auxetic scaffolds; AU-C: Chitosan modified auxetic scaffolds; AU-H: heparin modified auxetic scaffolds.
Afterwards, iEC differentiation was evaluated for the AU-1 to AU-5 scaffolds with three different modifications (P, C, H). The localized expression of vascular marker CD31 was shown by immunocytochemistry, represented by the AU-H conditions (Figure 6A). Then, the quantification of vascular markers CD31 and ZO-1 was performed by flow cytometry (Figure 6B, 6C). The CD31 and ZO-1 expression for all the five heparin-modified conditions (AU-H) was lower than the corresponding pristine (AU-P) and chitosan (AU-C) modifications. The AU-P groups showed similar or slightly higher ZO-1 expression compared to the corresponding AU-C conditions, for example, 80.1% vs. 78.7% for the AU-3 scaffolds. For CD31, the AU-P groups had comparable expression to the AU-C groups except for AU-2 and AU-3. CD31 was higher for the chitosan-modified AU-2 group (60.8% vs 35.6%) and AU-3 group (56.3% vs. 39.8%) compared to the pristine-modified AU-2 and AU-3 groups. Taken together, for the AU-1 to AU-5 scaffolds, chitosan modification showed better vascular differentiation than other modifications, indicating the synergistic effects of surface modification and the scaffold biophysical properties.
Figure 6. Characterization of endothelial differentiation in AU scaffolds with different elastic modulus and Poisson’s ratio.
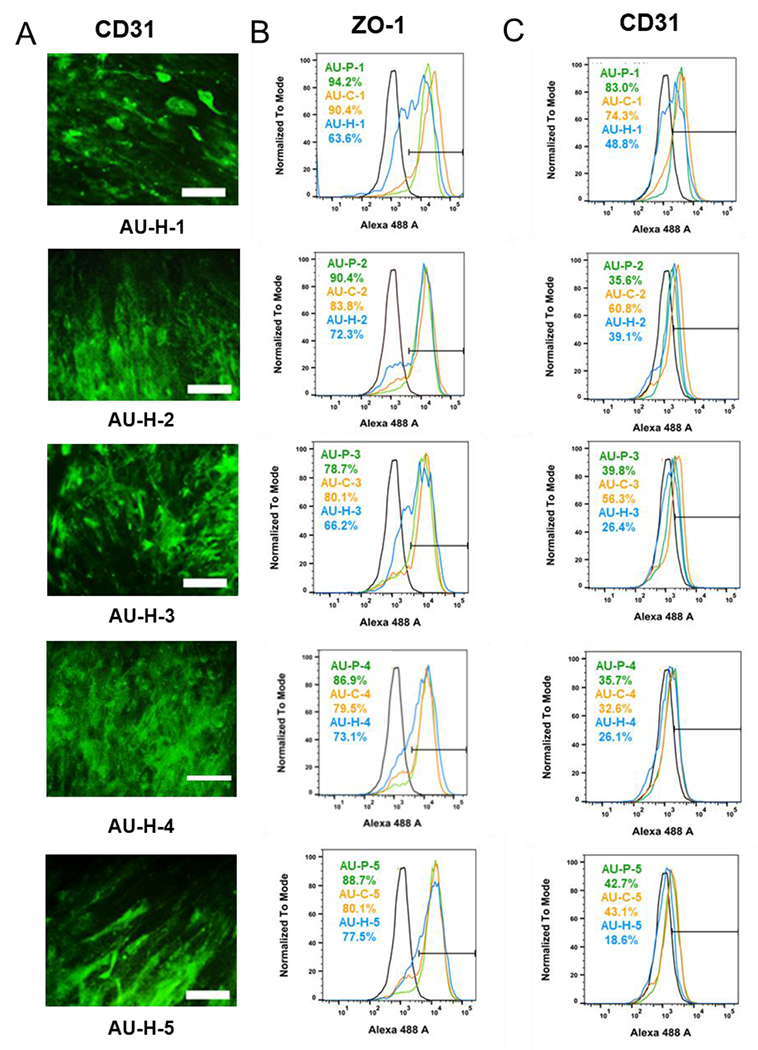
(A) Representative CD31 expression for cells grown in different AU foams modified by heparin. Scale bar = 100 μm. Flow cytometry histograms for (B) ZO-1 and (C) CD31 expression of cells grown in AU-1 to AU-5 scaffolds with different surface modifications. The blank line is the negative control. AU-P: pristine auxetic scaffolds; AU-Ex: extended auxetic scaffolds; AU-C: Chitosan modified auxetic scaffolds; AU-H: heparin modified auxetic scaffolds.
3.4. Effects of surface engineering on neural differentiation of hiPSCs
Again, the neural differentiation (iNPCs) was investigated with AU-6 scaffolds (with the lowest elastic modulus) before testing the other five AU scaffolds. The expression of beta III Tubulin (a marker for neurons) and Nestin (a neural progenitor marker) was observed by immunohistochemistry, which was comparable for the pristine, chitosan-modified, and heparin modified groups (Figure 7A, 7B). However, flow cytometry quantification shows that the beta III Tubulin expression was slightly higher for the AU-H-6 group (85% vs. 78-81%) than the other three modifications (Figure 7C). The Nestin expression was slightly higher for AU-C-6 (49%) and AU-P-6 (47%) than AU-Ex-6 and AU-H-6 scaffolds (~42%). RT-PCR was used to evaluate the expression of neural patterning genes (Figure 7D). The mRNA expression of HOXB4 (a hindbrain marker), Nkx2.1 (a ventral forebrain marker), PROX1 (a hippocampal marker), and TBR1 (a dorsal forebrain marker, cortical layer VI) was determined at day 20, which was at relatively early neural differentiation stage. TBR1 was expressed at the similar level in all samples. The gene expression of AU-Ex-6 group showed the similar levels of HOXB4, PROX1, and lower level of Nkx2.1 compared to the AU-P-6 group. By contrast to lower Nkx2.1 expression, the AU-C-6 group showed the upregulation of HOXB4 (3-fold) and PROX1 (13-fold) compared to the AU-P-6 and AU-Ex-6 groups. In addition, the AU-H-6 group showed the similar levels of HOXB4, Nkx2.1, and TBR1 compared to the AU-P-6 groups, while the expression of PROX1 was 20-fold higher than the AU-P-6 and AU-Ex-6 groups. These results indicate that chitosan and heparin surface modification promoted the hindbrain and hippocampal markers, but not forebrain markers.
Figure 7. iNPC marker expression in auxetic foams with different surface modifications.
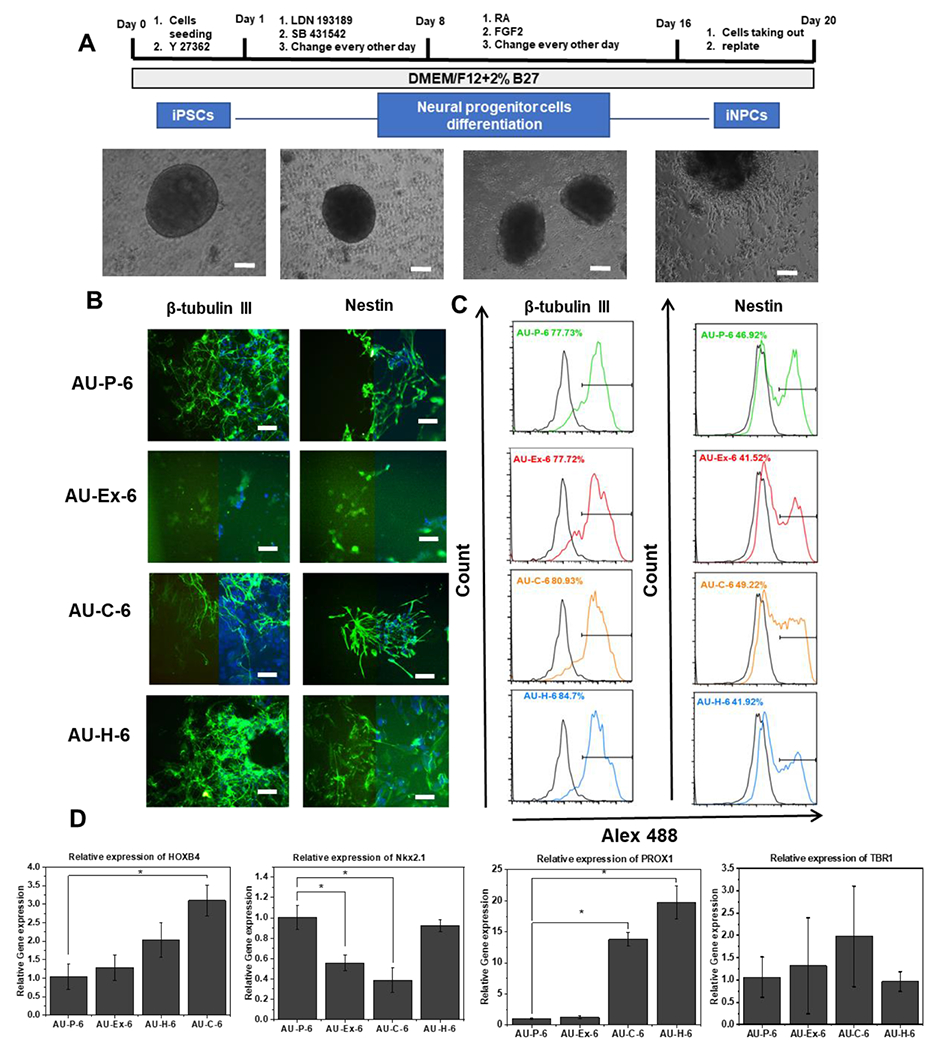
(A) Schematic illustration and images of differentiation of hiPSCs into neural progenitor cells (hiPSC-NPCs), or forebrain cortical organoids. Scale bar: 100 μm. (B) Fluorescent images of the marker expression of the replated cells from different scaffolds ay day 21. Left side: marker of interest only; right side: overlay with nuclear images. Beta III Tubulin (green) and nestin (green). Blue: Hoechst 33342. Scale bar: 100 μm. Flow cytometry histograms of the two markers (C) Beta III Tubulin and Nestin. The black line is the negative control. (D) mRNA expression determined by RT-PCR for brain regional identity markers. * indicates p<0.05. AU-P: pristine auxetic scaffolds; AU-Ex: extended auxetic scaffolds; AU-C: Chitosan modified auxetic scaffolds; AU-H: heparin modified auxetic scaffolds.
Next, the iNPC differentiation of cells in the AU-1 to AU-5 scaffolds with three different modifications (P, C, H) was assessed. The expression of beta III Tubulin and Nestin was determined by immunocytochemistry and flow cytometry (Figure 8A and 8B). The heparin-modified groups showed higher expression of beta III Tubulin (70-78% vs. 55-62%) than chitosan-modified groups for AU-1 to AU-5 conditions. For AU-3 and AU-4, heparin-modified groups showed similar expression of beta III Tubulin compared to AU-P-3 and AU-P-4 groups. But higher beta III Tubulin expression was observed for AU-H-1, H-2, and H-5 than AU-P-1, P-2, and P-5 conditions (74.6% vs. 61.3%, 78.1% vs. 67.2%, and 65.1% vs. 55.2% respectively). For Nestin, both chitosan and heparin modifications (87-92%) promoted the expression for AU-2, 3, and 5 than AU-P groups (42-72%). Similar Nestin expression for AU-P-1 and AU-P-4 was observed compared to AU-H-1 and AU-H-4 (82-89%) groups. Beta III Tubulin and Nestin were expressed at the lowest levels in AU-P-5 (55.2% and 56.81% respectively) and the modification by chitosan (72.2% and 88.71% respectively) and heparin (65.1% and 87.4% respectively) both can improve the marker expression.
Figure 8. Characterization of iNPC differentiation in AU scaffolds with different elastic modulus and Poisson’s ratio.
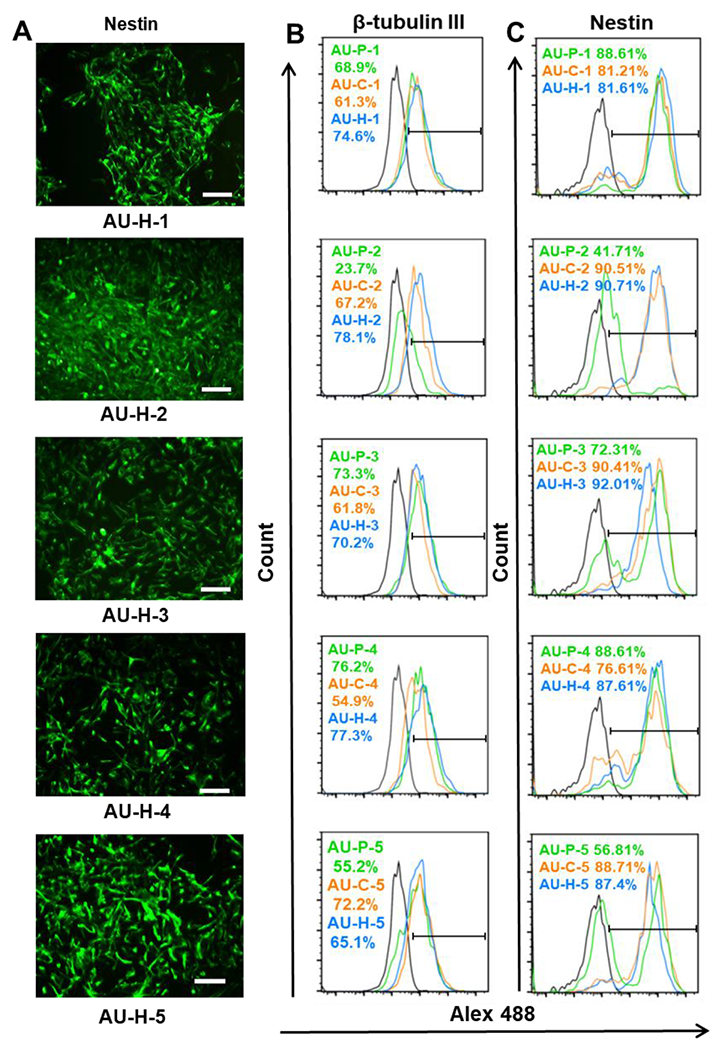
(A) Representative Nestin expression for cells grown in different AU foams modified by heparin. Scale bar = 100 μm. Flow cytometry histograms for (B) Beta III Tubulin and (C) Nestin expression of cells grown in AU-1 to AU-5 scaffolds with different surface modifications. The blank line is the negative control. AU-P: pristine auxetic scaffolds; AU-Ex: extended auxetic scaffolds; AU-C: Chitosan modified auxetic scaffolds; AU-H: heparin modified auxetic scaffolds.
To provide the possible mechanism for the influence of surface modification of the AU scaffolds, YAP expression and localization was evaluated (Figure 9A). After iNPC (day 16) and the iECs (day 13) were replated, fluorescent signals of YAP were determined at day 20. Less nuclear YAP localization (52.6±8.9% vs. 66.1±2.0%) was shown in the AU-H-6 group compared to the AU-P-6 group for iNPCs (Figure 9B). More cytoplasmic YAP localization (63.4±6.9% vs 42.1±4.3%) in the iECs from the AU-Ex-6 scaffolds was observed compared with the AU-P-6 group. Furthermore, iECs from the AU-C-6 group expressed the highest level of nuclear YAP (77.1±5.4%). The expression of iEC and iNPC differentiation markers was plot against the AU-1 to AU-5 scaffolds (Figure 9C and 9D), and the plots were also made for marker expression versus modulus and Poisson’ ratio (Supplementary Figure S4). The neural progenitor marker expression was similar for the scaffolds with modulus between 700 and 2700 Pa and the trends were similar for both Nestin and beta III Tubulin. Only the scaffolds with −0.5 Poisson’s ratio (AU-2) showed the decreased beta III tubulin and Nestin expression. For iEC differentiation, the levels of ZO-1 expression in all samples were similar. But the scaffolds with 1400 Pa and Poisson’s ratio at −0.297 showed the highest CD31 expression (68.7%).
Figure 9. Effects of different modified AU scaffolds on YAP nuclear localization with hiPSC differentiation into iECs and iNPCs.
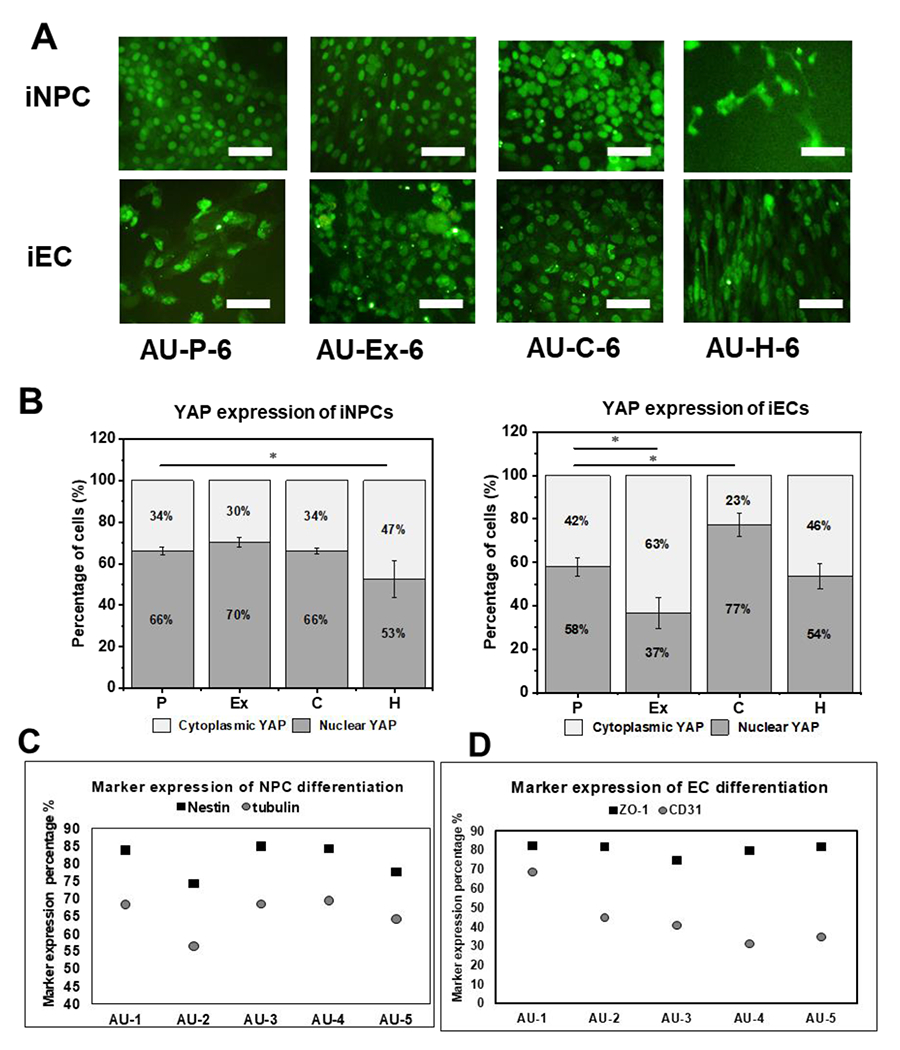
(A) Fluorescent images of YAP expression (day 20) of cells from different scaffolds. Scale bar: 100 μm. (B) Quantification of cytoplasmic YAP and nuclear YAP localization for cells from different scaffolds. (n=3). (C) Level of iNPC marker expression for cells from different scaffolds. (D) Level of iEC marker expression for cells from different scaffolds. * indicates p<0.05.
4. Discussion
The unique properties of auxetic materials can affect stem cell lineage commitment and tissue maturation [5]. In addition, the surface properties of the auxetic scaffolds also play a critical role in regulating stem cell fate decisions. Auxetic scaffolds as synthetic ECM mimics can provide a range of different moduli and negative Poisson’s ratios, which are two important biophysical factors that influence stem cell behaviors [5]. Due to their unique properties, auxetic materials have promising potential in biomedical applications, such as cardiovascular stents and vascular repair [3–5, 32]. In our previous work, the influence of auxetic scaffolds on vascular differentiation and neural construct formation was reported [20, 24]. Taking this one step further, this study investigated a wider range of elastic modulus and negative Poisson’s ratio auxetic scaffolds, using more recent forebrain organoid and vascular organoid differentiation protocols. In particular, the surface modification of the auxetic scaffolds was performed to promote cell-matrix interactions and matrix-growth factor interactions.
4.1. AU scaffold fabrication with surface modification
From our results, six different PU auxetic foams were chosen to provide scaffolds with various physical parameters: (1) modulus; (2) Poisson’s ratio; and (3) porous size. With these parameters, the effects of different combinations of mechanical properties of the auxetic scaffolds on neural and vascular differentiation of hiPSCs can be investigated [33]. hiPSCs did not adhere well on the surface without any gels or chemical coatings [34]. Therefore, material surface modifications for hiPSCs need to be rationally designed. In this study, the surfaces of auxetic PU scaffolds were modified with chitosan and heparin to promote lineage-specific differentiation. Growth factors include FGFs, VEGF, and heparin-binding epidermal growth factor have receptor binding capacity potently modulated by heparin [35, 36]. Heparin also can regulate Wnt signaling and affect neural patterning as shown in our previous study [37]. Moreover, neuronal development has been reported to be promoted by a porous chitosan scaffold and neural growth factor and chitosan can stabilize platelet growth factors for vascular differentiation [38, 39]. Therefore, the combination of these two biomolecules has been used for vascular regeneration [40]. However, chitosan and heparin have not been conjugated with the auxetic scaffolds to date. In this study, the PAA was chosen as the bridge for further grafting, which linked the chitosan and heparin biomolecules to the PU scaffolds. After modification and the heat-extending step, four types of scaffolds were obtained from the original foams, including the pristine auxetic scaffolds (P), the extended AU scaffolds (Ex), the chitosan-modified AU scaffolds (C), and the heparin-modified AU scaffolds (H).
4.2. Effects on metabolic activity and cell proliferation
The AU-6 group (the softest scaffolds) was used to determine the optimal concentration of AA solution, which may influence the further graft density of heparin or chitosan and the concentration of these two molecules can affect stem cell behaviors [41]. The proliferation and metabolic activity results show that heparin or chitosan modification was not the best at the highest AA concentration. The scaffolds modified with 30-50% (v/v) AA supported the highest metabolic activity after further linking with heparin or chitosan. Since MTT assay has chemical dependency on the efficiency of metabolic enzymes [42], the DNA assay was conducted to indirectly determine cell number, which indicates cell proliferation. Surface modification did not significantly affect cell proliferation at day 7 for AU-6 scaffolds, and the AU-6-Ex group showed lower proliferation compared to other modifications. Therefore, the AU-1 to AU-5 scaffolds were tested for P, C, and H, not Ex modifications. The chitosan-modified scaffolds (C groups) supported better metabolic activities than the other two modifications (P and H). Moreover, higher initial cell proliferation occurred in the AU-C and AU-H scaffolds than the AU-P scaffolds in general, which means that the modifications can enhance initial cell growth. However, by day 7, all groups reached similar levels of DNA content, indicating that all the scaffolds are biocompatible for further studies.
4.3. The influence on neural and vascular differentiation of hiPSCs
To date, heparin and chitosan substrate modifications for hiPSC differentiation have been only investigated in a limited number of studies [37, 43, 44]. Differentiation of iNPCs [20] and iECs [24] from hiPSCs in auxetic scaffolds were investigated in our previous studies, using different differentiation protocols. Furthermore, the relationship between hiPSC differentiation and surface modified auxetic scaffolds has not been investigated. This study modified auxetic scaffolds with heparin and chitosan to investigate iEC and iNPC differentiation from hiPSCs as well as brain-like tissue patterning revealed by the gene expression of the brain region-specific markers. The iEC differentiation within AU-6 scaffolds (the lowest elastic modulus) showed that CD31 expression was the highest for the AU-H-6 condition, possibly due to the combination of heparin modification and the biophysical properties of the scaffolds. The AU-C-6 and AU-Ex-6 conditions also upregulated CD31 expression compared with the AU-P-6 group. For neural differentiation, the highest β-tubulin III and Nestin expression was found in heparin and chitosan modified scaffolds, which can promote more mature neural cells and primitive neural cell differentiation respectively. There was no significant enhancement of endothelial and neural differentiation in AU-Ex-6 scaffolds. Therefore, this condition was not tested for the AU-1 to AU-5 scaffolds. In our study, AU-H-6 and AU-C-6 scaffolds also upregulated the expression of HOXB4 and PROX1, not Nkx2.1 and TBR1. Therefore, chitosan and heparin surface modifications promoted the hindbrain and hippocampal markers, but not forebrain markers during neural patterning of hiPSCs.
The iEC and iNPC differentiations were then extended to AU-1 to 5 scaffolds with different elastic modulus and Poisson’s ratio. The chitosan hydrogels have been widely used to enhance neovascularization from MSC-derived endothelial cells [39, 45]. In addition, heparin can promote proliferation and neovessel formation of hiPSC-derived endothelial cells [43]. For endothelial differentiation, the differentiated hiPSCs in AU-C scaffolds had higher expression of CD31 and ZO-1 than those in AU-H and some AU-P scaffolds. Our results suggest that chitosan modification for AU-1 to -5 scaffolds can provide a better environment for vascular differentiation. With the heparin modification, the neural marker β-tubulin III was promoted especially in AU-1, 2, 5 scaffolds, and most heparin-modified scaffolds upregulated Nestin expression, except AU-1 and -4. However, chitosan modification showed little enhancement for neural differentiation in general, indicating the confounding interactions between biochemical properties, such as surface modifications, and biophysical properties, such as elastic modulus and Poisson’s ratio.
The mechanism for the heparin effect is consistent with previous studies [36] using heparin-binding hyaluronic acid hydrogel [46]. Combined with our previous work [37], the heparin may act as the “catcher” which retains growth factors to improve iNPC differentiation from hiPSCs [27, 47]. The neural patterning effect of heparin may be related to the modulation of Wnt signaling [48]. The potential mechanism for chitosan modification may rely on cell-matrix interactions and growth factor stabilizations [39]. The hiPSC pluripotency may be affected by morphology and adhesion of the cells while interacting with the matrix [49]. Furthermore, the presence of chitosan can assist the formation of 3D hiPSC spheroids and support higher proliferation rate [50]. Additionally, chitosan and its derivatives have been implicated in the prevention of neurological disorders such as Alzheimer’s and Parkinson’s diseases, multiple sclerosis, and stroke as well as serving as neuroprotective modulators [51]. Chitosan’s natural capacity to form insoluble complexes with glycosaminoglycans, such as hyaluronates and heparan sulfates [52], is thought to be a potential mechanism for its ability to enhance angiogenic progenitor phenotypes in vivo [53].
4.4. The roles of biomechanical properties of the scaffolds and the YAP localization
In this study, more cytoplasmic YAP localization in the cells within the AU-6 scaffolds was observed, indicating that the scaffolds can promote the aggregate organization for lineage-specific differentiation [24]. The YAP/TAZ pathway is mediated by both cellular mechanical forces and by cell-cell contact [54]. The ratio of nuclear to cytoplasmic YAP localization can be used to predict cellular response [55]. During iNPC differentiation, surface modifications of the AU scaffolds did not significantly influence the YAP localization, while different biophysical properties of various AU scaffolds lead to different cellular mechanoresponses. Nuclear YAP was decreased for hiPSCs in the AU-H-6 group, which is consistent with the observation that the depression of nuclear YAP can promote neuronal differentiation and inhibit long-term self-renewal of hiPSCs [56]. For iEC differentiation, the change of stiffness in AU-Ex-6 reduced the cytoplasmic YAP levels. These two observations are consistent with the previous conclusion that the auxetic scaffolds can enhance neural and endothelial differentiation compared to regular scaffolds [20, 24].
5. Conclusions
This study evaluated vascular and neural differentiation of hiPSCs in auxetic scaffolds with different elastic modulus and Poisson’s ratio as well as different surface modifications. Heparin modified auxetic scaffolds can promote neural differentiation of hiPSCs, possible as a growth factor catcher. The iEC differentiation can be promoted by chitosan modification. The elastic modulus and the Poisson’s ratio were also evaluated as a factor during hiPSC differentiation, confounding the effects of surface modification. The cytoplasmic retention of YAP in iECs and iNPCs promotes the endothelial and neural differentiation in the auxetic scaffolds. This study provides a new approach to enhance the differentiation efficiency of hiPSCs in 3D cultures, which may have potential for tissue engineering, drug screening, and disease modeling, especially for building in vitro brain-like tissue or blood-brain barrier models from hiPSCs.
Supplementary Material
Acknowledgements
The authors would like to thank Dr. Brian K. Washburn in Florida state university (FSU) Department of Biological Sciences for their help with RT-PCR analysis. The authors would also thank for the support by FSU Flow Cytometry Core facility and High-Performance Materials Institute (HPMI). This work is mainly supported by National Science Foundation (CBET-1917618 and CMMI-2100987). Research reported in this publication was also partially supported by the National Institutes of Health (USA) under Award Number R01NS125016. The content is solely the responsibility of the authors and does not necessarily represent the official views of the National Institutes of Health.
Footnotes
Supporting Information
Supporting Information is available from the Wiley Online Library or from the author.
Conflict of Interest:
There is no conflict of interest.
Data availability statement:
The datasets generated during and/or analyzed during the current study are available from the corresponding authors on reasonable request.
References:
- [1].Lakes R, Science 1987, 235, 1038. [DOI] [PubMed] [Google Scholar]
- [2].He C, Liu P, McMullan PJ, Griffin AC, physica status solidi (b) 2005, 242, 576 [Google Scholar]; Nkansah M, Evans K, Hutchinson I, Modelling and Simulation in Materials Science and Engineering 1994, 2, 337 [Google Scholar]; Gatt R, Zammit V, Caruana C, Grima JN, physica status solidi (b) 2008, 245, 502. [Google Scholar]
- [3].Lee JJ, Ng HY, Lin YH, Lin TJ, Kao CT, Shie MY, Cells 2022, 11. [DOI] [PMC free article] [PubMed] [Google Scholar]
- [4].Kim Y, Son KH, Lee JW, Materials (Basel) 2021, 14. [DOI] [PMC free article] [PubMed] [Google Scholar]
- [5].Brazhkina O, Park JH, Park HJ, Bheri S, Maxwell JT, Hollister SJ, Davis ME, J Cardiovasc Dev Dis 2021, 8. [DOI] [PMC free article] [PubMed] [Google Scholar]
- [6].Sanami M, Ravirala N, Alderson K, Alderson A, Procedia Engineering 2014, 72, 453 [Google Scholar]; Lisiecki J, Błażejewicz T, Kłysz S, Gmurczyk G, Reymer P, Mikułowski G, physica status solidi (b) 2013, 250, 1988. [Google Scholar]
- [7].Shin D, Urzhumov Y, Lim D, Kim K, Smith DR, Scientific Reports 2014, 4, 1. [DOI] [PMC free article] [PubMed] [Google Scholar]; Scarpa F, Smith F, Journal of intelligent material systems and structures 2004, 15, 973. [Google Scholar]
- [8].Kapnisi M, Mansfield C, Marijon C, Guex AG, Perbellini F, Bardi I, Humphrey EJ, Puetzer JL, Mawad D, Koutsogeorgis DC, Advanced functional materials 2018, 28, 1800618. [DOI] [PMC free article] [PubMed] [Google Scholar]; Park YJ, Kim JK, Advances in Materials Science and Engineering 2013, 2013. [Google Scholar]
- [9].Murphy WL, McDevitt TC, Engler AJ, Nature materials 2014, 13, 547. [DOI] [PMC free article] [PubMed] [Google Scholar]
- [10].Sun Y, Chen CS, Fu J, Annual review of biophysics 2012, 41, 519. [DOI] [PMC free article] [PubMed] [Google Scholar]
- [11].Watt FM, Huck WT, Nat Rev Mol Cell Biol 2013, 14, 467. [DOI] [PubMed] [Google Scholar]
- [12].Park JS, Huang NF, Kurpinski KT, Patel S, Hsu S, Li S, Front Biosci 2007, 12, 5098. [DOI] [PubMed] [Google Scholar]
- [13].Earls JK, Jin S, Ye K, Tissue Engineering Part B: Reviews 2013, 19, 420. [DOI] [PMC free article] [PubMed] [Google Scholar]
- [14].Shijun X, Junsheng M, Jianqun Z, Ping B, Journal of biomaterials applications 2016, 30, 1273. [DOI] [PubMed] [Google Scholar]
- [15].Bertucci TB, Dai G, Stem cells international 2018, 2018. [DOI] [PMC free article] [PubMed] [Google Scholar]
- [16].Fung Y, Inc, New Jersey 1965 [Google Scholar]; Greaves GN, Greer AL, Lakes RS, Rouxel T, Nature materials 2011, 10, 823. [DOI] [PubMed] [Google Scholar]; Rothenburg L, Berlin A, Bathurst RJ, Nature 1991, 354, 470 [Google Scholar]; Critchley R, Corni I, Wharton JA, Walsh FC, Wood RJ, Stokes KR, physica status solidi (b) 2013, 250, 1963 [Google Scholar]; Saxena KK, Das R, Calius EP, Advanced Engineering Materials 2016, 18, 1847. [Google Scholar]
- [17].Pagliara S, Franze K, McClain CR, Wylde GW, Fisher CL, Franklin RJ, Kabla AJ, Keyser UF, Chalut KJ, Nature materials 2014, 13, 638. [DOI] [PMC free article] [PubMed] [Google Scholar]
- [18].Soman P, Fozdar DY, Lee JW, Phadke A, Varghese S, Chen S, Soft Matter 2012, 8, 4946. [DOI] [PMC free article] [PubMed] [Google Scholar]; Kyriacou SK, Mohamed A, Miller K, Neff S, Biomech Model Mechanobiol 2002, 1, 151. [DOI] [PubMed] [Google Scholar]
- [19].Soman P, Lee JW, Phadke A, Varghese S, Chen S, Acta Biomater 2012, 8, 2587. [DOI] [PMC free article] [PubMed] [Google Scholar]; Zhang W, Soman P, Meggs K, Qu X, Chen S, Advanced Functional Materials 2013, 23, 3226. [DOI] [PMC free article] [PubMed] [Google Scholar]
- [20].Yan Y, Li Y, Song L, Zeng C, Li Y, Acta Biomater 2017, 49, 192. [DOI] [PubMed] [Google Scholar]
- [21].Scarpa F, IEEE Signal Processing Magazine 2008, 25, 126. [DOI] [PMC free article] [PubMed] [Google Scholar]
- [22].Kanyanta V, Ivankovic A, Journal of the mechanical behavior of biomedical materials 2010, 3, 51. [DOI] [PubMed] [Google Scholar]; Boretos JW, Pierce WS, Science 1967, 158, 1481. [DOI] [PubMed] [Google Scholar]; Desai SD, Patel JV, Sinha VK, International Journal of Adhesion and Adhesives 2003, 23, 393 [Google Scholar]; Xu LC, Siedlecki CA, Journal of Biomedical Materials Research Part B: Applied Biomaterials 2017, 105, 668. [DOI] [PubMed] [Google Scholar]
- [23].Li Y, Zeng C, Polymer 2016, 87, 98 [Google Scholar]; Li Y, Zeng C, Adv Mater 2016, 28, 2822. [DOI] [PubMed] [Google Scholar]
- [24].Song L, Ahmed MF, Li Y, Zeng C, Li Y, Journal of tissue engineering and regenerative medicine 2018, 12, 1679. [DOI] [PubMed] [Google Scholar]
- [25].Song L, Wang K, Li Y, Yang Y, Colloids and Surfaces B: Biointerfaces 2016, 148, 49. [DOI] [PubMed] [Google Scholar]
- [26].Han HW, Hsu SH, Colloids Surf B Biointerfaces 2017, 158, 527. [DOI] [PubMed] [Google Scholar]
- [27].Colombres M, Henriquez JP, Reig GF, Scheu J, Calderon R, Alvarez A, Brandan E, Inestrosa NC, J Cell Physiol 2008, 216, 805. [DOI] [PubMed] [Google Scholar]
- [28].Yousef H, Conboy MJ, Li J, Zeiderman M, Vazin T, Schlesinger C, Schaffer DV, Conboy IM, Aging (Albany NY) 2013, 5, 357. [DOI] [PMC free article] [PubMed] [Google Scholar]
- [29].Zeng C, Li Y, 2014, WO2016/014782A1. [Google Scholar]
- [30].Lin WC, Tseng CH, Yang MC, Macromol Biosci 2005, 5, 1013. [DOI] [PubMed] [Google Scholar]
- [31].Song L, Yuan X, Jones Z, Griffin K, Zhou Y, Ma T, Li Y, Sci Rep 2019, 9, 5977. [DOI] [PMC free article] [PubMed] [Google Scholar]; Song L, Yuan X, Jones Z, Vied C, Miao Y, Marzano M, Hua T, Sang QX, Guan J, Ma T, Zhou Y, Li Y, Sci Rep 2019, 9, 11055. [DOI] [PMC free article] [PubMed] [Google Scholar]
- [32].Xue H, Luo Z, Brown T, Beier S, Frontiers in bioengineering and biotechnology 2020, 736. [DOI] [PMC free article] [PubMed] [Google Scholar]
- [33].Lenzini S, Devine D, Shin J-W, Frontiers in bioengineering and biotechnology 2019, 260. [DOI] [PMC free article] [PubMed] [Google Scholar]
- [34].Ireland RG, Kibschull M, Audet J, Ezzo M, Hinz B, Lye SJ, Simmons CA, Biomaterials 2020, 248, 120017. [DOI] [PubMed] [Google Scholar]
- [35].Levine A, Kenet G, Bruck R, Avni Y, Avinoach I, Aeed H, Matas Z, David M, Yayon A, Pediatric research 2002, 51, 635. [DOI] [PubMed] [Google Scholar]
- [36].Banik N, Yang SB, Kang TB, Lim JH, Park J, Int J Mol Sci 2021, 22. [DOI] [PMC free article] [PubMed] [Google Scholar]
- [37].Bejoy J, Song L, Wang Z, Sang QX, Zhou Y, Li Y, ACS Biomaterials Science & Engineering 2018, 4, 2922. [DOI] [PMC free article] [PubMed] [Google Scholar]
- [38].Yi X, Jin G, Tian M, Mao W, Qin J, Neuroendocrinol. Lett 2011, 32, 705. [PubMed] [Google Scholar]
- [39].Busilacchi A, Gigante A, Mattioli-Belmonte M, Manzotti S, Muzzarelli RA, Carbohydr Polym 2013, 98, 665. [DOI] [PubMed] [Google Scholar]
- [40].Sun G, Li Y, Liu C, Jiang X, Yang L, He L, Song S, Zhang J, Shen J, Qiao T, ACS Applied Bio Materials 2022. [DOI] [PubMed] [Google Scholar]
- [41].Hemeda H, Kalz J, Walenda G, Lohmann M, Wagner W, Cytotherapy 2013, 15, 1174. [DOI] [PubMed] [Google Scholar]
- [42].Quent VM, Loessner D, Friis T, Reichert JC, Hutmacher DW, Journal of cellular and molecular medicine 2010, 14, 1003. [DOI] [PMC free article] [PubMed] [Google Scholar]
- [43].Munarin F, Kabelac C, Coulombe KL, Journal of Biomedical Materials Research Part A 2021, 109, 1726. [DOI] [PMC free article] [PubMed] [Google Scholar]
- [44].Li Y, Liu M, Yan Y, Yang S-T, World journal of stem cells 2014, 6, 11. [DOI] [PMC free article] [PubMed] [Google Scholar]; Pagani I, Ottoboni L, Podini P, Ghezzi S, Brambilla E, Bezukladova S, Corti D, Bianchi ME, Capobianchi MR, Yates EA, bioRxiv 2021. [DOI] [PMC free article] [PubMed] [Google Scholar]
- [45].Lee S, Valmikinathan CM, Byun J, Kim S, Lee G, Mokarram N, Pai SB, Um E, Bellamkonda RV, Yoon Y.-s., Biomaterials 2015, 63, 158. [DOI] [PMC free article] [PubMed] [Google Scholar]
- [46].Levinson C, Lee M, Applegate LA, Zenobi-Wong M, Acta biomaterialia 2019, 99, 168. [DOI] [PubMed] [Google Scholar]
- [47].Tae G, Kim YJ, Choi WI, Kim M, Stayton PS, Hoffman AS, Biomacromolecules 2007, 8, 1979. [DOI] [PubMed] [Google Scholar]
- [48].Berendsen AD, Fisher LW, Kilts TM, Owens RT, Robey PG, Gutkind JS, Young MF, Proceedings of the National Academy of Sciences 2011, 108, 17022. [DOI] [PMC free article] [PubMed] [Google Scholar]; Ling L, Dombrowski C, Foong KM, Haupt LM, Stein GS, Nurcombe V, Van Wijnen AJ, Cool SM, Journal of Biological Chemistry 2010, 285, 26233. [DOI] [PMC free article] [PubMed] [Google Scholar]
- [49].Yu L, Li J, Hong J, Takashima Y, Fujimoto N, Nakajima M, Yamamoto A, Dong X, Dang Y, Hou Y, Stem cell reports 2018, 11, 142. [DOI] [PMC free article] [PubMed] [Google Scholar]
- [50].Chang P-H, Chao H-M, Chern E, Hsu S.-h., Biomaterials 2021, 268, 120575. [DOI] [PubMed] [Google Scholar]
- [51].Pangestuti R, Kim S-K, Marine Drugs 2010, 8, 2117. [DOI] [PMC free article] [PubMed] [Google Scholar]
- [52].Denuziere A, Ferrier D, Damour O, Domard A, Biomaterials 1998, 19, 1275. [DOI] [PubMed] [Google Scholar]
- [53].Deng C, Zhang P, Vulesevic B, Kuraitis D, Li F, Yang AF, Griffith M, Ruel M, Suuronen EJ, Tissue Engineering Part A 2010, 16, 3099. [DOI] [PubMed] [Google Scholar]
- [54].Dupont S, Morsut L, Aragona M, Enzo E, Giulitti S, Cordenonsi M, Zanconato F, Le Digabel J, Forcato M, Bicciato S, Nature 2011, 474, 179. [DOI] [PubMed] [Google Scholar]
- [55].Das A, Fischer RS, Pan D, Waterman CM, Journal of Biological Chemistry 2016, 291, 6096. [DOI] [PMC free article] [PubMed] [Google Scholar]
- [56].Musah S, Wrighton PJ, Zaltsman Y, Zhong X, Zorn S, Parlato MB, Hsiao C, Palecek SP, Chang Q, Murphy WL, Proceedings of the National Academy of Sciences 2014, 111, 13805. [DOI] [PMC free article] [PubMed] [Google Scholar]
Associated Data
This section collects any data citations, data availability statements, or supplementary materials included in this article.
Supplementary Materials
Data Availability Statement
The datasets generated during and/or analyzed during the current study are available from the corresponding authors on reasonable request.