HapMap scanning of novel human minor histocompatibility antigens
Supplemental materials for: Kamei et al
Files in this Data Supplement:
- Table S1. Previously known autosomal mHags (PDF, 239 KB)
- Table S2. SNPs showing significant association (genome-wide P<0.01) with mHag status (PDF, 1.29 MB)
- Table S3. Summary of the significant SNPs, genotypes of individuals registered to the HapMap project, and χ2 values for individual SNPs in association with susceptibility to CTL-4B† (PDF, 123 KB)
- Table S4. Summary of the significant SNPs, genotypes of individuals registered to the HapMap project, and χ2 values for individual SNPs in association with susceptibility to CTL-3B6† (PDF, 239 KB)
- Table S5. Summary of the significant SNPs, genotypes of individuals registered to the HapMap project, and χ2 values for individual SNPs in association with susceptibility to CTL-1B2† (PDF, 118 KB)
- Figure S1. Empirical estimations of r2max sizes of based on the Phase II HapMap data (JPG, 55.4 KB) -
The fractions of SNPs best proxied by nearby SNPs with indicated sizes of r2 are plotted in 1% MAF bins for each HapMap population panel.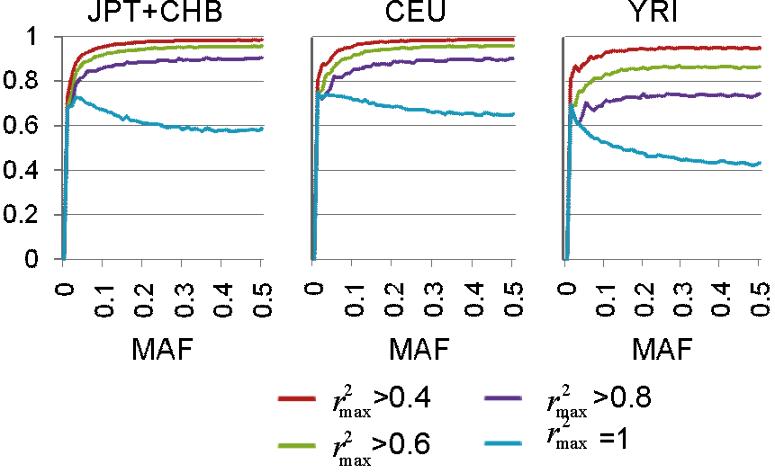
- Figure S2. LD structures around 12 known autosomal mHag loci (JPG, 248 KB) -
LD structures of 12 known HLA class I-restricted autosomal mHag loci are shown by plotting pairwise |D′| of the Phase II HapMap SNPs using HaploView 4.0 software (also see Table S1).1�15 The size of each LD block and the number of known genes therein are also indicated. All the known mHags belong to discrete LD blocks consisting of the Phase II HapMap SNPs. Each LD block typically contains only a few known genes.
- Figure S3. Distributions of percent specific lysis values of individual CTL clones against HapMap LCLs assayed by standard chromium release cytotoxicity assays (CRAs) (JPG, 54.6 KB) -
HapMap LCLs were transduced with relevant HLA cDNA for individual CTL clones and assayed for their mHag status by standard 4-h 51Cr release assays at a predetermined E:T ratio. Assays were performed at least in duplicate and the obtained percent specific lysis values were then normalized by division with that obtained for the positive control recipient LCL to compensate for �inter-experiment� differences. Results of the immunophenotyping for (A) CTL-4B1, (B) CTL-3B6 and (C) CTL-1B2 are shown. The thresholds for our CRAs were empirically determined as >51% for mHag+ LCLs and <11% for mHag� LCLs.
REFERENCES
ScienceScienceJ Exp MedEur J ImmunolJ Exp MedBloodJ Exp MedJ Exp MedBloodJ Clin InvestBloodBr J HaematolBloodScienceBloodHMSD generates a novel minor histocompatibility antigen. Blood