Abstract
The rooting zone water storage capacity – the amount of water accessible to plants – controls the sensitivity of land-atmosphere exchange of water and carbon during dry periods. How the rooting zone water storage capacity varies spatially is largely unknown and not directly observable. Here we estimate rooting zone water storage capacity globally from the relationship between remotely-sensed vegetation activity, measured by combining evapotranspiration, sun-induced fluorescence, and radiation estimates, and the cumulative water deficit calculated from daily time series of precipitation and evapotranspiration. Our findings indicate plant-available water stores that exceed the storage capacity of 2 m deep soils across 37% of the Earth’s vegetated surface. We find that biome-level variations of rooting zone water storage capacities correlate with observed rooting zone depth distributions and reflect the influence of hydroclimate, as measured by the magnitude of annual cumulative water deficit extremes. Smaller-scale variations are linked to topography and land use. Our findings document large spatial variations in the effective root zone water storage capacity and illustrate a tight link between the climatology of water deficits, rooting depth of vegetation and its sensitivity to water stress.
Introduction
To sustain activity during dry periods and resist impacts of droughts, plants rely on water stored below the surface. The larger the rooting zone water storage capacity (S0), the longer plants can withstand soil moisture limitation1. S0 is therefore a key factor determining drought impacts, land-atmosphere exchanges, and runoff regimes, particularly in climates with a seasonal asynchrony in radiation and precipitation (P)2–4. In models, S0 is commonly conceived as a function of the soil texture and the plants’ rooting depth (zr), limited to the depth of the soil3, 5. Recent research has revealed a substantial component of S0 and contributions to evapotranspiration (ET) by water stored beneath the soil, in weathered and fractured bedrock and groundwater6–11. Plant access to such deep moisture plays an important role in controlling near-surface climate12–14, runoff regimes4, global patterns of vegetation cover15, and mitigating impacts of droughts16.
However, S0 is impossible to observe directly across large scales and its spatial variations are poorly understood17. Global compilations of local plant rooting depth (zr) measurements18, 19 yield information related to S0, but have resolved this observational challenge only partly because of their limited size, and large documented variations in zr across multiple scales7, 18, 18–21. Empirical approaches for estimating the global zr distribution made use of relationships between in-situ observations and climatic factors22. Modelling approaches for predicting zr have conceived their spatial variations as the result of optimal adaptation to the prevailing hydro-climate23–25, or as being adapted to just buffer water demand to sustain ET during dry periods2, 26. Such mass-balance approaches make use of the maximum cumulative water deficit (CWD) during dry periods as an indication of the effective S0. An additional hypothesis posits that it would not be beneficial for plants to root even deeper and thus size their S0 even larger26. However, a link between the magnitude of CWD extremes, the sensitivity of vegetation activity to an increasing CWD, and local zr observations remains to be shown, and the prevalence of plant access to water stored at depth (here taken as >2 m) across the globe remains to be quantified.
Despite its crucial role in controlling water and carbon fluxes and the scarcity of observations, virtually all models simulating water and carbon exchange between the land surface and the atmosphere rely on a specification of S0 either directly as the depth of a “water bucket”, or indirectly through prescribed rooting depths zr and soil texture across the profile. Typically, water stored at depth and along the entire Critical Zone (including weathered bedrock) is not fully represented in models8, 9, and the evident plasticity of zr and variations S0 within plant types and along climatic and topographic gradients are often ignored. Implications of this simplification may be substantial for the simulation of land-atmosphere coupling and drought impacts8, 12, 13.
Here, we present a method for diagnosing S0 from the relationship between vegetation activity and CWD. By fusing multiple time series of Earth observation data streams with global coverage, we estimate the global distribution of S0 at a resolution of 0.05° (∼5 km). Using a mass-balance approach2, 26 and field observations of zr from a globally distributed dataset, we then show that the sensitivity of vegetation to water stress across the globe is strongly related to the magnitude of CWD extremes and reflects the rooting depth of plants.
Estimating S0 from Earth observations
We started by estimating S0 as the CWD at which vegetation “activity” ceases. Our approach accounts for the constraint of the rooting zone water availability on ET and photosynthesis and relates S0 to the sensitivity of vegetation activity to water stress. The parallel information of ET, P, and the modelled snow mass balance enables a quantification of CWD over time. Vegetation activity was estimated from two alternative observations: from the evaporative fraction (EF, defined as ET divided by net radiation), and from sun-induced fluorescence (SIF, normalised by incident shortwave radiation, see also Methods).
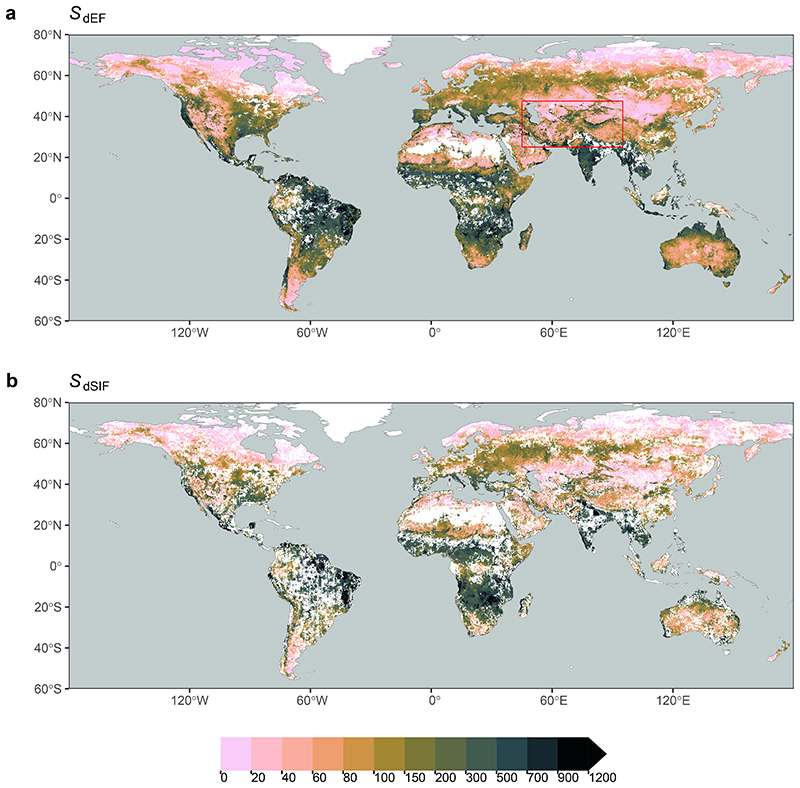
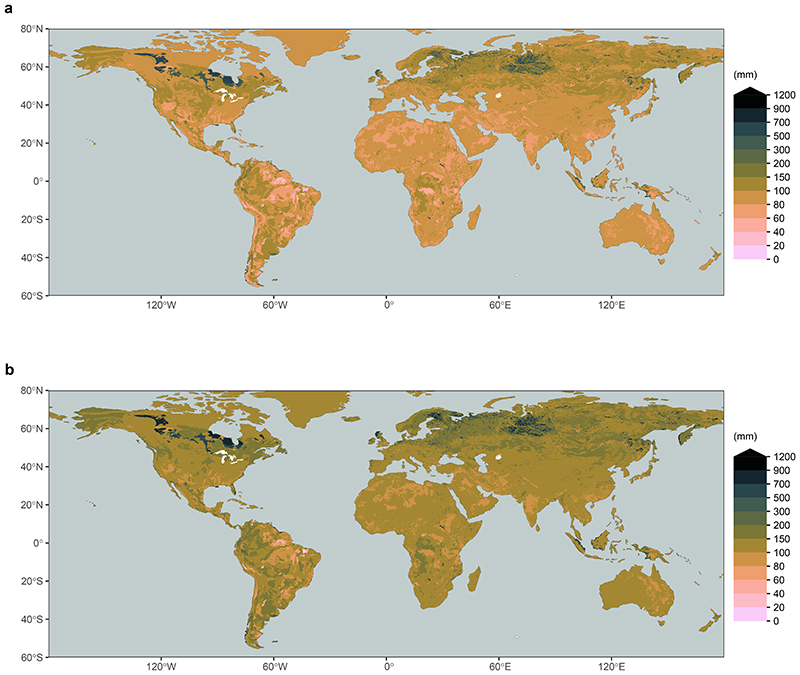
Fig. 1 reveals large global variations in S0. Estimates based on EF and SIF correlate closely and agree in magnitude (R2 = 0.78, Supplementary Fig. S1). The lowest sensitivity of vegetation activity to an increasing CWD, and thus the largest apparent S0, is found in regions with a strong seasonality in radiation and water availability and substantial vegetation cover - particularly in monsoonal climates. In contrast, the lowest S0 values appear not only in regions where seasonal water deficits are limited due to short inter-storm duration (e.g., western Amazon and Congo basin) and/or low levels of potential ET (e.g., high latitudes), but also in deserts and arid grasslands. This likely reflects the limited water storage accumulating during rain events from which vegetation can draw during dry periods. In these regions, a rapid decline of ET and SIF with an increasing CWD is related to vegetation cover dynamics, governed by greening after rain pulses and browning during dry periods27.
Figure 1.
Rooting zone water storage capacity (mm) estimated from the sensitivity of the evaporative fraction (SdEF, top panel a) and sun-induced fluorescence (SdSIF, bottom panel b) to the cumulative water deficit (CWD). The red box in (a) shows the outline of the magnified map provided in Fig. 2. Data shown is aggregated to 0.1° resolution. Blank cells (white) mark areas where all underlying cells at the original 0.05° resolution did not exhibit a significant and single, linearly declining relationship with increasing CWD.
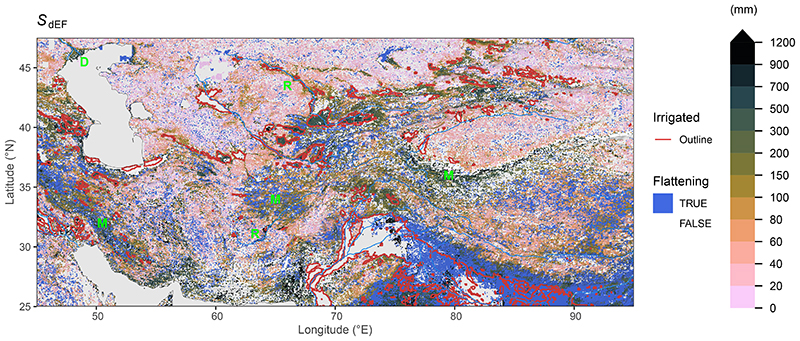
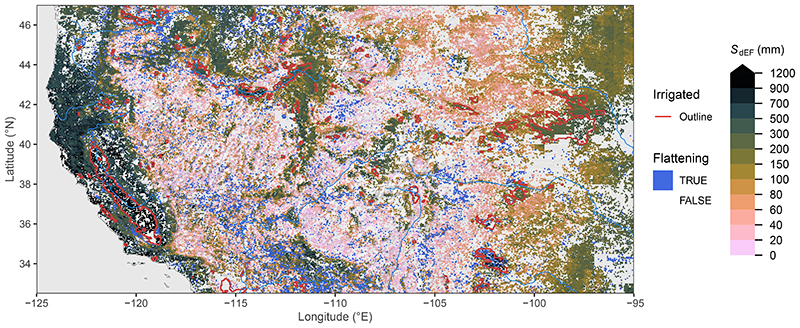
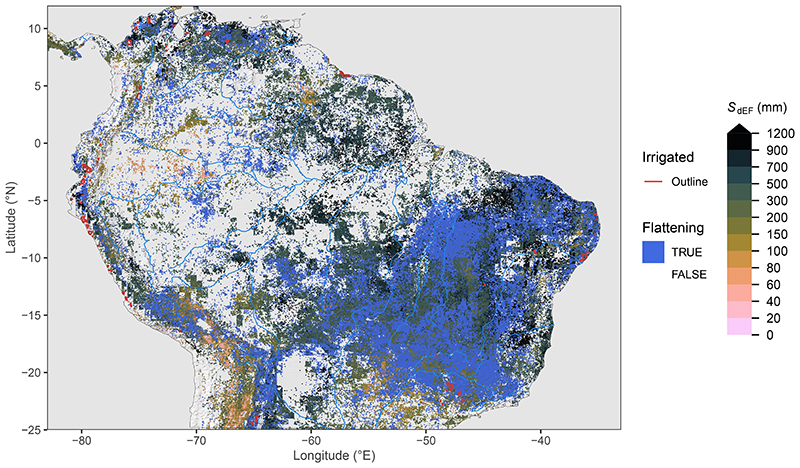
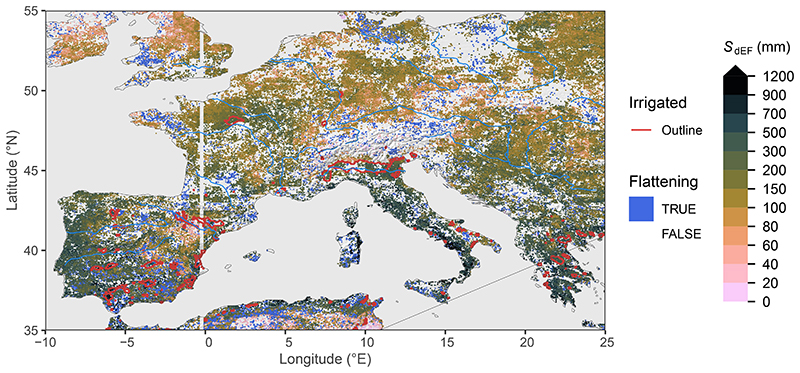
Clear patterns emerge also at smaller scales (Fig. 2, Extended Data Fig. 1-3). SdSIF and SdEF consistently (see Supplementary Fig. S1) reveal how the sensitivity of photosynthesis and transpiration to drought stress varies across different topographical settings, indicating generally larger S0 in mountain regions (’M’ in Fig. 2) and along rivers (’R’) and deltas (’D’). We note however, that ET estimates from the product used here (ALEXI28, 29) may be biased high over mountainous terrain where low incident net radiation and surface temperatures are caused not by high evaporative fractions but rather by topography effects and local shading. The maps of SdSIF and SdEF also bear strong imprints of human land use. Major irrigated cropland areas are congruent with some of the highest apparent S0 values. In these areas, our analysis yields particularly high CWD values and a low sensitivity of SIF and EF to CWD - without using information about the location and magnitude of irrigation. Other major irrigated areas appear as blank cells in Fig. 2 because the algorithm used to calculate CWD (see Methods) fails due to a long-term imbalance between P and ET and a “runaway CWD”. This indicates a sustained over-use of water resources, caused by lateral water redistribution at scales beyond ∼5 km via streamflow diversion or groundwater flow and extraction (or bias in P and ET estimates).
Figure 2.
Rooting zone water storage capacity in Central Asia, estimated from the evaporative fraction (SdEF). Blue areas (“flattening”) show grid cells where a significant reduction in the slope in EF vs. CWD was identified beyond a certain threshold. SdEF values are not calculated for gridcells classified as “Flattening”. Red lines show outlines of major irrigated areas, i.e. where the irrigated land area fraction is above 30%41. Information about irrigated areas was used only for mapping here, but is not used for other parts of the analysis. Blank grid cells (white) indicate areas with a sustained imbalance of ET being greater than P. Green letters indicate locations of mountains (’M’), rivers (’R’), and delta (’D’), referred to in the main text. Additional regional maps are provided by Extended Data Figs. 1-3.
Regressing vegetation activity against CWD also identifies locations where a decoupling of the two variables appears, i.e., where the sensitivity of EF or SIF significantly decreases beyond a certain CWD threshold (“Flattening” in Fig. 2, see Methods). Such areas are particularly common in the vicinity of mountain regions, in areas with irrigated croplands, and in savannahs (Supplementary Fig. S2). Related mechanisms may be at play. A flattening of the EF (SIF) vs. CWD relationship is likely due to different portions of the vegetation having access to distinct water resources and respective storage capacities. In areas with large topographic gradients, this may be due to within-gridcell heterogeneity in plant access to the saturated zone. Although relevant for land-atmosphere coupling12, land surface models typically do not account for such effects. This has potential implications for simulations of ET during prolonged dry periods in these regions. In savannahs, a shift in ET contributions from grasses and trees and a related shift in transpiration occurs as grasses, which are often more shallow-rooted than trees30, senesce. In irrigated cropland areas, the flattening likely reflects land use heterogeneity within ∼5 km grid cells and the persistent water access on irrigated fields while EF and SIF are reduced more rapidly in surrounding vegetation.
What controls spatial variations in S0 and zr and the sensitivity of vegetation activity to water stress? Following ref.2, we hypothesized that annual CWD maxima reflect the total amount of plant-accessible water. That is, zr and S0 are sized to just maintain transpiration and photosynthesis under extreme water deficits, commonly experienced over the course of a plant’s lifetime (recurring with a return period of T years). Hence, a correlation between the magnitude of CWD extremes and the sensitivity of vegetation activity to an increasing CWD should emerge. For estimating CWD extremes, we started by using T = 80 years and assessed other choices as described in Supplementary Text S1, and see Extended Data Fig. 4.
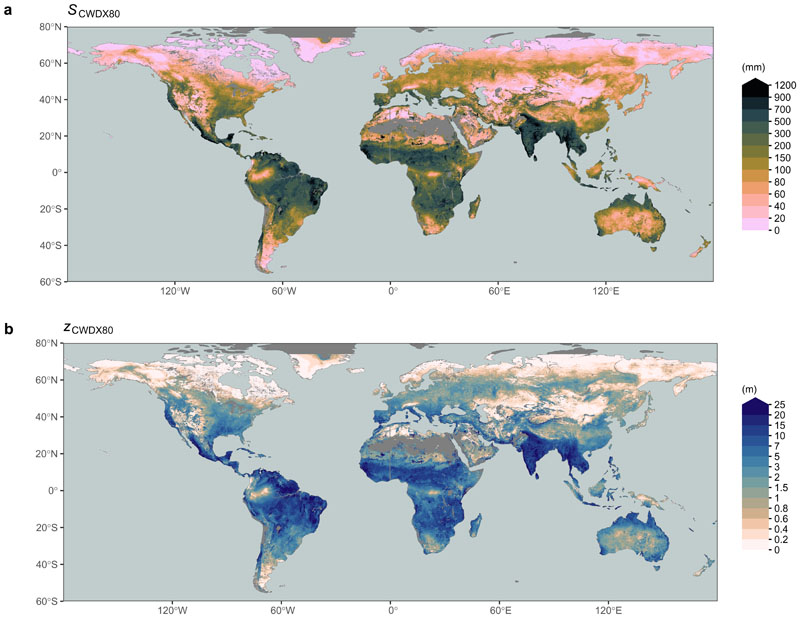
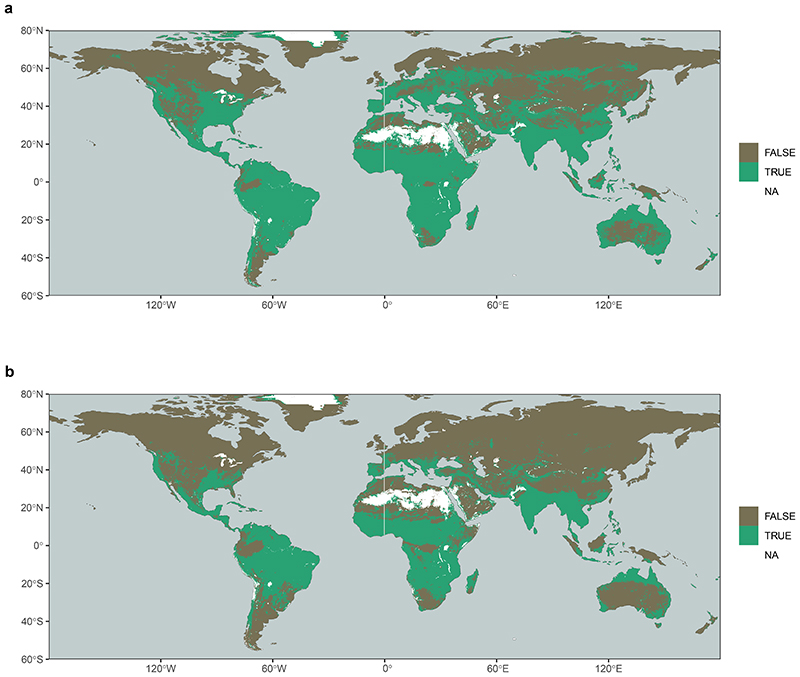
Fig. 3a shows the global distribution of SCWDX80 and reveals patterns across multiple scales - in close agreement with SdSIF and SdEF (R2 = 0.76 and R2 = 0.83, respectively, Supplementary Fig. S3). This indicates that the sensitivity of vegetation activity to an increasing CWD (measured by SdSIF and SdEF) is strongly controlled by hydroclimate (as measured by SCWDX80). The agreement between S0 estimates based on water mass balance approaches2, 26 and vegetation activity suggests that plants tend to size their roots no deeper, and S0 no larger, than what is suggested by observed CWD extremes. Magnitudes of SCWDX80 inferred for 55% (37%) of the Earth’s vegetated regions indicate plant access to water stored beyond 1 (2) m soil, assuming texture-dependent water holding capacity31–33 (Extended Data Figs. 5, 6).
Figure 3.
Spatial variations of (a) the rooting zone water storage capacity, estimated by SCWDX80 (mm), and (b) the apparent plant rooting depth zCWDX80 (m). Values are remapped to a 0.1° resolution. Blank grid cells (grey) are either permanent inland water bodies and ocean, or locations with long-term accumulation of water deficits. Values are removed in gridcells where more than 99% is non-vegetation surface based on MODIS Landcover42.
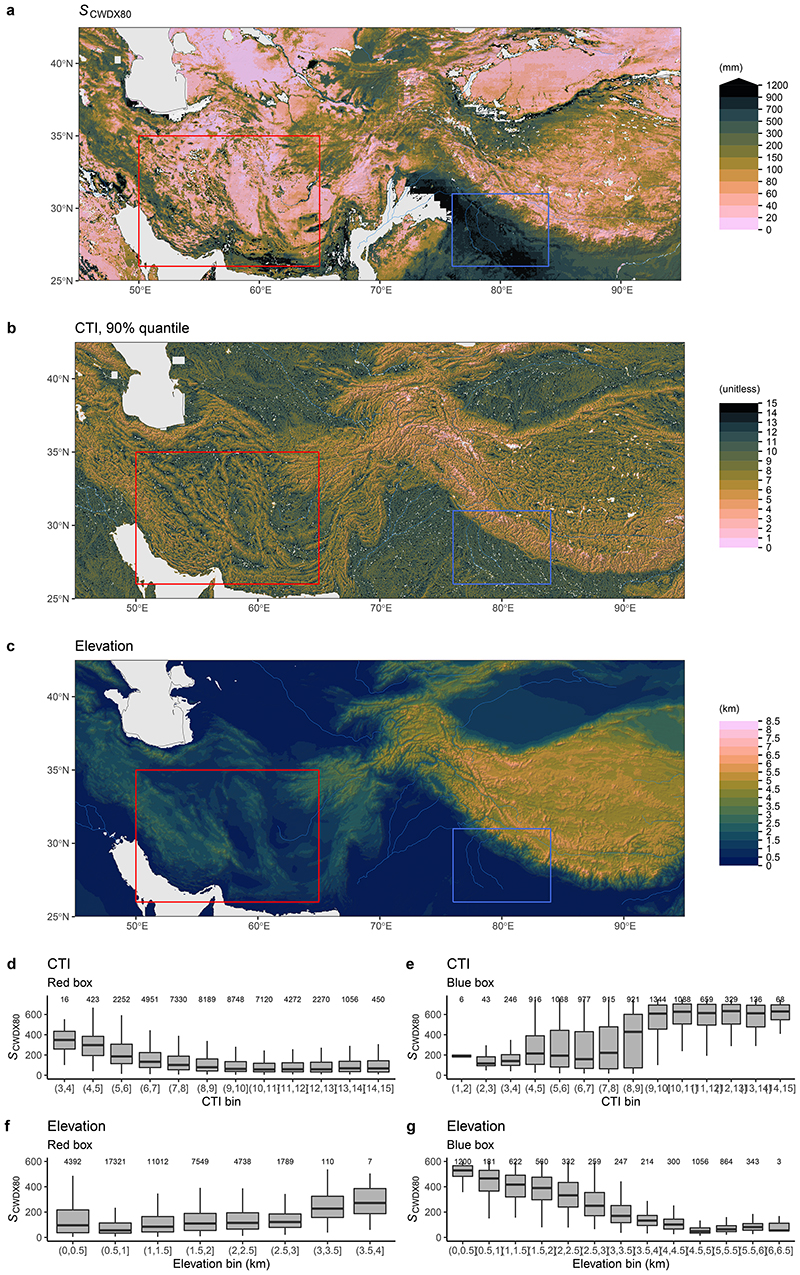
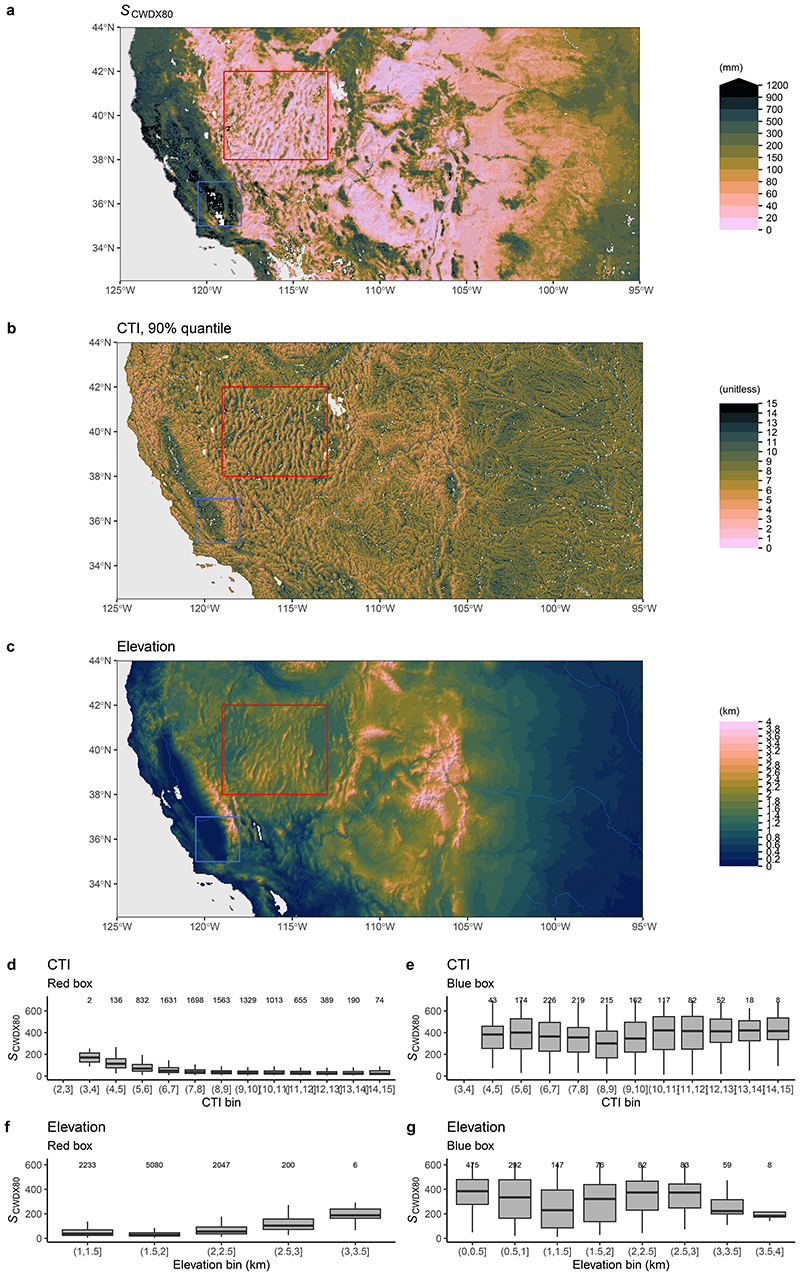
Fine granularity and large spatial heterogeneity of SCWDX80 at regional scales reveal the importance of land use and the local topographical setting for determining plant-available water storage capacities (Extended Data Figs. 7, 8). Complex patterns emerge. Mountainous areas feature higher SCWDX80 than their surrounding lowlands. In other regions, lowlands feature some of the highest recorded SCWDX80. In these regions, irrigated agriculture is wide-spread (Fig. 2 and Extended Data Fig. 1). Variations are likely to extend to even smaller scales along the hillslope topography7 and within individual forest stands34. These scales lie beyond the resolution of the satellite remote sensing data used here to calculate CWD.
Evaluation with rooting depth observations
S0 provides an estimate of the effective total plant-available water, independent of assumptions about physical constraint (limited soil depth, shallow bedrock, or groundwater), and independent of uncertain soil texture and water holding capacity (WHC). Due to the absence of direct observational constraints on S0, we converted S0 to a corresponding apparent plant rooting depth (zr), enabling an evaluation of S0 estimates against fully independent observations. We focused on comparing biome-level distributions of inferred apparent rooting depth (zCWDX80) with a dataset30 containing 5524 individual field observations of plant rooting depth from 1705 globally distributed sites (Supplementary Fig. S4). We thus tested the link between hydroclimate and belowground vegetation structure across large climatic gradients.
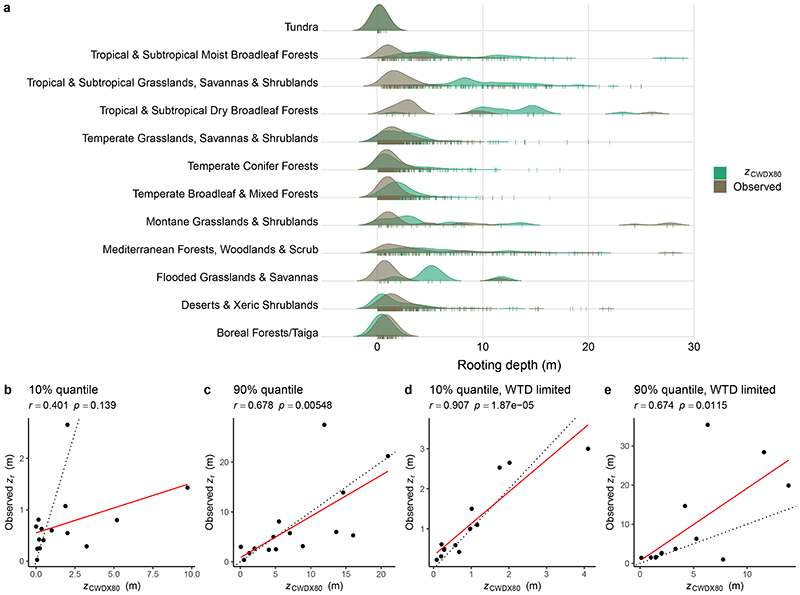
Predicted and observed biome-level maximum rooting depth (90% quantiles) are correlated (Pearson’s r = 0.68, Fig. 4c), while the lower (10%) quantiles appear to be overestimated by zCWDX80 (Fig. 4b). Using a subset of the data where information about the water table depth (WTD) is provided (489 entries from 359 sites), we limited values of zCWDX80 to the value of the observed local WTD (53% of all observations). This yields a strongly improved correlation of observed and estimated the biome-level 10% rooting depth quantiles (Pearson’s r = 0.91, Fig. 4d) compared to estimates that are not capped at the observed WTD (Fig. 4b). This suggests that inferred zr overestimates values where roots access the groundwater and indicates that groundwater access is relevant across more than half of the globally distributed sites in our dataset. While acting as a constraint on the rooting depth7, plant access to groundwater or a perched water table implies sustained transpiration during dry periods, correspondingly large CWDs and, by implication of the model design, large SCWDX80 and (apparent) zCWDX80.
Figure 4. Modelled and observed rooting depth by biomes.
(a) Kernel density estimates of observed and predicted (zCWDX80) rooting depth by biomes, based on data aggregated by sites, shown by vertical colored tick marks. 10% and 90% quantiles of observed vs. predicted (zCWDX80) rooting depth by biome of all data (b,c), and of a subset of the data where the water table depth (WTD) was measured along with rooting depth (d,e). Classification of sites into biomes was done based on43. Dotted lines in b-e represent the 1:1 line. In subtitles of panels (b-e), r is the Pearson’s correlation coefficient, and p is the test statistic based on Pearson’s product moment correlation coefficient.
Influence of biotic and abiotic factors
Using first-principles modelling and integrating multiple data streams, we diagnosed a hydrologically effective ecosystem-level S0 from the sensitivity of vegetation activity to CWD. We found that large-scale variations in S0 are driven by the hydroclimate and that global patterns of seasonal water deficits are reflected in the rooting depth of plants. More fine-grained variations in S0 within regions and biomes are linked to land use and irrigation of agricultural land (Fig. 2), and to topography (Extended Data Fig. 7, 8), and to the water table depth, as indicated by the comparison to plant-level rooting depth observations. The method applied here makes use of the sensitivity of remotely sensed ET to an increasing CWD and thus provides estimates of S0 even if belowground water stores are never fully depleted during the observational period. Additional analyses, where S0 was diagnosed from a simple water balance model with prescribed S0, confirmed the reliability of the method across a broad range of hydroclimates (Supplementary Text S2 and Supplementary Fig. S5).
S0 reflects a combination of biotic and abiotic factors. Biotic factors that determine the total plant-available water are, i.a., the rooting depth of the vegetation and plant hydraulic properties. Abiotic factors include the hydroclimate and physical constraints to the rooting depth, related to the texture and depth of the soil and the weathered bedrock7. Similarly, human management activities such as irrigation and tile drainage can impact ET, and thus S0 in agricultural systems. Physical constraints to roots are largely unknown across large scales. Our estimation of S0 makes no assumptions about such constraints. Instead, the magnitude of the water storage capacity is inferred from mass balance considerations. The CWD we derive from the balances of ET and P imply that the corresponding amount of water is supplied by local storage or supplied from lateral subsurface water convergence - likely a smaller contributor at the ∼5 km spatial resolution of the data analysed here35.
Diagnosed values of S0 implicitly include water intercepted by leaf and branch surfaces, internal plant water storage, and moisture stored in the topsoil and supplied to soil evaporation. These components are generally smaller in magnitude compared to moisture storage supplied to transpiration36, and their contribution to ET declines rapidly as CWD increases. Hence, spatial variations in S0 primarily reflect variations mediated by moisture stored across the root zone.
Particularly in regions with pronounced dry seasons, our estimates of S0 greatly exceed typical values of the total soil water holding capacity when considering the top 1 or 2 meters of the soil column and texture information from global databases (31, Extended Data Fig. 5). The discrepancy in magnitude and spatial patterns of total 1 (2) m soil water holding capacity and S0 diagnosed here hints at a critical role of plant access to deep water and the need to extend the focus beyond moisture in the top 1-2 m of soil for understanding and simulating land-atmosphere exchange10, 11. Indications of widespread plant-access to deep water stores are consistent with observations of bedrock-penetrating roots7, 37 and with evidence for dry-season moisture withdrawal from the weathered bedrock9, 11. We note that using the global map of SCWDX80 (zCWDX80) for directly parameterizing S0 (zr) in models may be misleading in areas with particularly small maximum CWDs and consequently small SCWDX80. Scaling relationships of above and belowground plant architecture30 and additional effects of how zr determines access to belowground resources and function (e.g., nutrients, mechanical stability) should be considered.
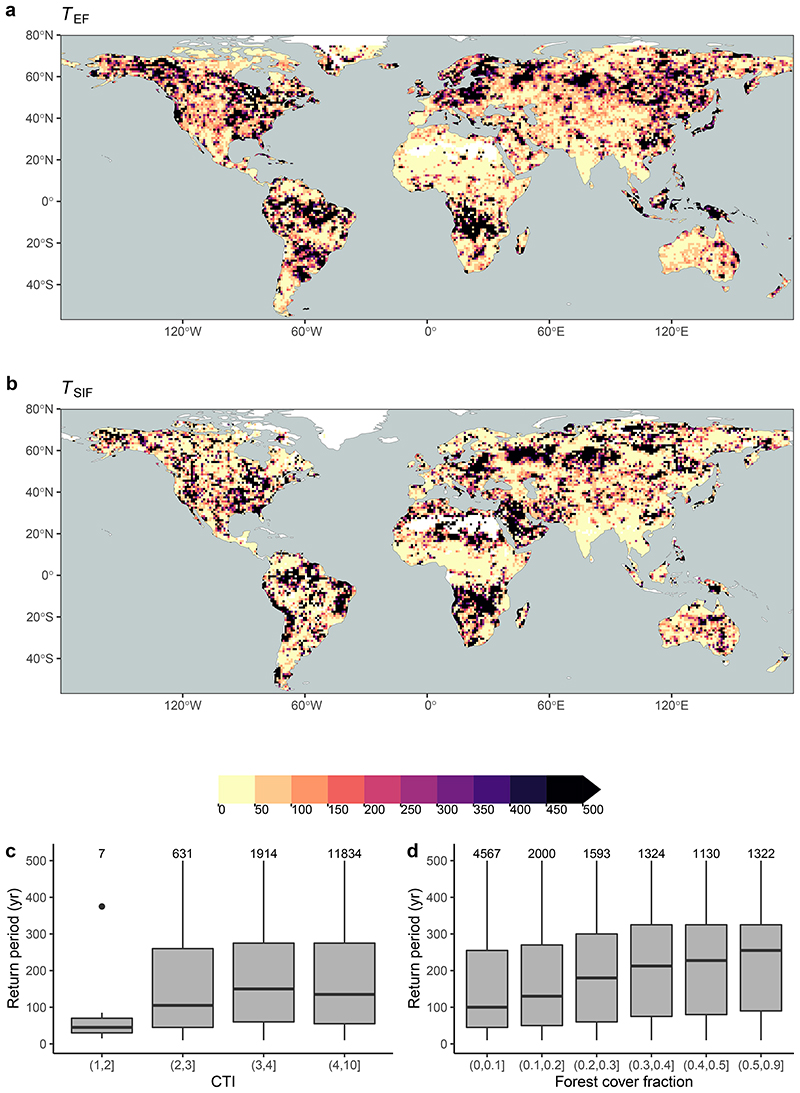
Underlying the estimates of SCWDX80 is the assumption that plant rooting strategies are reflected by CWD extremes with a return period T = 80 years. SdSIF and SdEF provide an independent constraint to test this assumption. Extended Data Fig. 4 suggests that T is not a global constant. A tendency towards higher T emerges with an increasing gridcell average forest cover fraction.
Our analysis identified mountain regions as being characterised by particularly high S0, in spite of shallow soil and regolith depths38. This could be due to hillslope-scale variations in groundwater depth, enabling sustained transpiration during prolonged rain-free periods. Lateral subsurface flow at scales beyond the resolution of the data used here (∼5 km) may additionally supply water for ET and thus contribute to large inferred S0 in valley bottoms of large drainage basins. Local convergence (divergence) acts to supply (remove) subsurface moisture and sustain (reduce) ET, leading to larger (smaller) CWD values. Without relying on a priori assumptions regarding S0 or functional dependencies of water stress effect on ET, thermal infrared (TIR)-based remote sensing data (as is used here) offers an opportunity to detect such effects8. Our analysis yielded strong contrasts in diagnosed S0 along topographic gradients (Extended Data Fig. 7, 8). However, further research should assess the accuracy of spatial variations in annual mean ET and potential effects of terrain, where land surface temperature signals on shaded slopes may be mis-interpreted by the ALEXI algorithm as signatures of higher ET.
Our global S0 estimates are a “snapshot” in time. Regional to continental-scale variations in average tree ages may be associated with changes in rooting depth and S0. Furthermore, environmental change may trigger changes in vegetation composition and structure39, with consequences for S0. Similarly, deforestation implies changes in rooting depth18, S0, and the surface energy balance14. Such temporal changes are not considered here due to the limited length of available time series of satellite observations (16 years). It remains to be seen whether plasticity in zr is sufficiently rapid to keep pace with a changing climate with strong and wide-spread increases in rainfall variability40, and to what degree rising CO2 alters plant water use and their carbon economy and thereby the costs and benefits of deep roots.
Taken together, constraints available from local zr observations and from global remote sensing of vegetation activity reveal consistent patterns across multiple spatial scales and suggest widespread plant access to deep water storage, including the weathered bedrock and groundwater, or to other ancillary sources of water, such as irrigation. Our study revealed a tight link of the climatology of water deficits and vegetation sensitivity to drought stress. We demonstrated how land-atmosphere interactions and the Critical Zone water storage capacity are linked with the rooting depth of vegetation and how belowground vegetation structure is influenced by the hydroclimate and topography across the globe.
Methods
Estimating ET
Unbiased estimates of ET during rain-free periods are essential for determining CWD and estimating S0 and implied zr. We tested different remote sensing-based ET products and found that the ALEXI-TIR product, which is based on thermal infrared remote sensing28, 29, exhibits no systematic bias during progressing droughts (Supplementary Text S3 and Supplementary Fig. S6) - in contrast to other ET estimates assessed here. The stability in ET estimates from ALEXI-TIR during drought are enabled by its effective use of information about the surface energy partitioning, allowing inference of ET rates without reliance on a priori specified and inherently uncertain surface conductances44 or shapes of empirical water stress functions45, and without assumptions of rooting depth or effective S0. ALEXI-TIR is thus well-suited for estimating actual ET behaviour during drought without introducing circularity in inferring S0.
Cumulative water deficit estimation
The cumulative water deficit (CWD) is determined here from the cumulative difference of actual ET and the liquid water infiltration to the soil (Pin). ET is based on thermal infrared remote sensing, provided by the global ALEXI data product at daily and 0.05° resolution, covering years 2003-2018. Values in energy units of the latent heat flux are converted to mass units accounting for the temperature and air pressure dependence of the latent heat of vaporization following ref.46. Pin is based on daily reanalysis data of P in the form of rain and snow from WATCH-WFDEI47. A simple snow accumulation and melt model48 is applied to account for the effect of snowpack as a temporary water storage that supplies Pin during spring and early summer. Snow melt is assumed to occur above 1°C and with a rate of 1 mm d−1 (°C)−1. The CWD is derived by applying a running sum of (ET - Pin), initiating on the first day when (ET - Pin) is positive (net water loss from the soil), and terminating the summation after rain has reduced the running sum to zero (Supplementary Fig. S7). This yields a continuous CWD time series of daily values. In general, P > ET for annual totals. This implies that the CWD summation is initiated at zero each year. In very rare cases, the CWD accumulates over more than one year, and data were discarded if the accumulation extends over five years (“runaway CWD”). All P and snowmelt (Pin) is assumed to contribute to reducing the CWD. This implicitly assumes that no runoff occurs while the CWD is above zero. The period between the start and end of accumulation is referred to as a CWD event. Within each event, co-varying data, used for analysis, are removed after rain has reduced the CWD to below 90% of its maximum value within the same event. This concerns the analysis of SIF and EF (see below) and avoids effects of relieved water stress by re-wetting topsoil layers before the CWD is fully compensated. The algorithm to determine daily CWD values and events is implemented by the R package cwd49.
Diagnosing S0 from vegetation activity
By employing first principles for the constraint of the rooting zone water availability on vegetation activity1, we developed a method to derive how the sensitivity of these fluxes to water stress relates to S0 and how this sensitivity can be used to reveal effects of access to extensive deep water stores. Two methodologically independent sources of information on vegetation activity were used: the evaporative fraction (EF, defined as ET divided by net radiation), and sun-induced fluorescence (SIF, normalised by incident shortwave radiation). SIF is a proxy for ecosystem photosynthesis50 and is taken here from a spatially downscaled data product51 based on GOME-2 data52, 53. Since net radiation and shortwave radiation are first-order controls on ET and SIF, respectively, and to avoid effects by seasonally varying radiation inputs, we used EF instead of ET, and considered the ecosystem-level fluorescence yield, quantified as SIF divided by shortwave radiation (henceforth referred to as ‘SIF’) for all analyses. The resulting estimates for S0 are referred to as SdEF and SdSIF, respectively.
The principles for relating vegetation activity to the rooting zone water availability were considered as follows. As the ecosystem-level CWD increases, both gross primary production (GPP, ecosystem-level photosynthesis) and ET are limited by the availability of water to plants. Below, we refer to GPP and ET as a generic “vegetation activity” variable X(t). This principle can be formulated, in its simplest form, as a model of X(t) being a linear function of the remaining water stored along the rooting zone S(t), expressed as a fraction of the total rooting zone water storage capacity S0:
| (1) |
Following Eq. 1, S0 can be interpreted as the total rooting zone water storage capacity, or the depth of a “water bucket” that supplies moisture for ET. Following ref.1 and with X(t) representing ET, the temporal dynamics during rain-free periods (where runoff can be neglected) are described by the differential equation
| (2) |
and solved by an exponential function with a characteristic decay time scale λ:
| (3) |
λ is related to S0 as S0 = λ X0, where X0 is the initial ET at S(t0) = S0. In other words, the apparent observed exponential ET decay time scale λ, together with X0, reflects the total rooting zone water storage capacity S0.
Fitting exponentials from observational data is subject to assumptions regarding stomatal responses to declines in S(t) and is relatively sensitive to data scatter. Hence, resulting estimates of S0 may not be robust. With CWD(t) = S0 − S(t) and Eq. 1, the relationship of X(t) and CWD(t) can be expressed as a linear function
| (4) |
and observational data for X(t) can be used to fit a linear regression model. Its intercept a and slope b can then be used as an alternative, and potentially more robust estimate for S0:
| (5) |
This has the further advantage that estimates for S0 can be derived using any observable quantity of vegetation activity X(t) (not just ET as in ref.1) under the assumption that activity attains zero at the point when the CWD reaches the total rooting zone water storage capacity; i.e., X(t*) = 0 for CWD(t*) = S0.
Here, we use a spatially downscaled product of sun-induced fluorescence (SIF51), normalised by incident shortwave radiation (WATCH-WFDEI data47), and the evaporative fraction (EF), defined as the ratio of ET (ALEXI-ET data29) over net radiation (GLASS data54), as two alternative, normalised proxies for water-constrained vegetation activity, termed X′. Normalisation by net radiation and incident shortwave radiation respectively removes effects by seasonally varying energy available for vegetation activity. X′0 is thus assumed to be stationary over time and the relationship of X′(t) and CWD(t) is interpreted here as a reflection of effects by belowground water availability and used to derive SdSIF and SdEF. All data used for X′0 are provided at 0.05° and daily resolution.
SdSIF and SdEF were then derived based on the relationship of EF and normalised SIF versus CWD, guided by Eq. 5. The relationship was analysed for each pixel with pooled data belonging to the single largest CWD event of each year, and using the 90% quantile of EF and normalised SIF within 50 evenly spaced bins along the CWD axis. Binning and considering percentiles were chosen to reduce effects of vegetation activity reduction due to factors other than water stress (CWD). We then tested for each pixel whether the data support the model of a single linear decline of SIF (EF) with increasing CWD (Eq. 5), or, alternatively, a segmented regression model with one or two change points, using the R package segmented55. The model with the lowest Bayesian Information Criterion (BIC) was chosen and SdSIF and SdEF were quantified only for pixels where no significant change point was detected and where the regression of EF (SIF) vs. CWD had a significantly negative slope. “Flattening” EF (SIF) vs. CWD relationships were identified where a significant change point was detected and where the slope of the second regression segment was significantly less negative (p = 0.05 of t-test) compared to the slope of the first segment. Examples, visualising the diagnosing of S0 from EF, are given in Supplementary Fig. S8. We performed additional tests of the method’s reliability in estimating S0 by deriving SdEF from simulations of the ecosystem water balance and ET, where S0 was prescribed, using the SPLASH model46. This demonstrates that the method applied for SdSIF and SdEF yields accurate estimates of S0 across all climatic conditions and independent of the size of S0 (Supplementary Text S2 and Supplementary Fig. S5).
Diagnosing S0 from cumulative water deficits
Following ref.2, the rooting zone water storage capacity S0 is estimated based on CWD extremes occurring with a return period of T years. Magnitudes of extremes with a given return period T (SCWDXT) are estimated by fitting an extreme value distribution (Gumbel) to the annual maximum CWD values for each pixel separately, using the extRemes R package56. Values SCWDXT. SCWDXT are translated into an effective depth zCWDXT using estimates of the plant-available soil water holding capacity, based on soil texture data from a gridded version of the Harmonized World Soil Database31, 32 and pedo-transfer functions derived by ref.33. Associations of SCWDXT and topography were analysed considering the Compound Topography Index57 and elevation from ETOPO158. The Compound Topography Index is a measure for subsurface flow convergence and the water table depth based on the topographical setting59.
Estimating return periods
Diagnosed values of SdSIF and SdEF provide a constraint on the return period T. To yield stable estimates of T and avoid effects of the strong non-linearity of the function to derive T from the fitted extreme value distributions and magnitudes estimated by SdSIF and SdEF, we pooled estimates SdSIF (SdEF) and SCWDXT values within 1° pixels (≤400 values). A range of discrete values T was screened (10, 20, 30, 40, 50, 60, 70, 80, 90, 100, 150, 200, 250, 300, 350, 400, 450, 500 years) and the best estimate T was chosen based on comparison to SdSIF (TSIF) and to SdEF (TEF), i.e., where the absolute value of the median of the logarithm of the bias was minimal. Relationships of best matching T with topography (measured by the Compound Topography Index57) and with the forest cover fraction (MODIS MOD44B60) were analysed.
Rooting depth estimation and observations
We converted root zone water storage capacity estimates, SCWDX80, to a corresponding apparent rooting depth (zCWDX80) using a global soil texture map31, 32. The conversion of SCWDX80 into a corresponding depth zCWDX80 accounts for topsoil and subsoil texture and water holding capacity (WHC) along the rooting profile (see Methods, Fig. 3b), and - in view of lacking information with global coverage about the WHC of the weathered bedrock - assuming uniform subsoil texture extending below 30 cm depth. The comparison of biome-level quantities (instead of a direct point-by-point comparison) avoids the inevitable scale mismatch between in situ plant-level observations and global remote sensing data.
The observational rooting depth data set (N = 5524) was compiled by30 by combining and complementing published datasets from refs.22 and7. The data include observations of the maximum rooting depth of plants taken from 361 published studies plus additional environmental and climate data. zr was taken as the plant’s maximum rooting depth. Data were aggregated by sites (N = 1705) based on longitude and latitude information. Sites were classified into biomes using maps of terrestrial ecoregions43. Quantiles (10%, 90%) were determined for each biome. For a subset of the data (359 sites) where parallel measurements of the water table depth (WTD) was available, we conducted the same analysis, but took the minimum of WTD and zr.
Extended Data
Supplementary Material
Acknowledgements
B.D.S was funded by the Swiss National Science Foundation grant no. PCEFP2_181115. This work is a contribution to the LEMONTREE (Land Ecosystem Models based On New Theory, obseRvations and ExperimEnts) project, funded through the generosity of Eric and Wendy Schmidt by recommendation of the Schmidt Futures program (BDS). We acknowledge ICDC, CEN, University of Hamburg for data support. S.J.T.D. was funded by the NSF GRFP and LTER, and the NASEM Ford Foundation Fellowship Program. A.G.K. was supported by NSF DEB-1942133.
Footnotes
Author contributions statement
B.D.S developed the methods, conducted the analysis and wrote the paper. S.J.T.D. compiled the rooting depth dataset and guided its analysis. A.G.K. helped design the analysis and manuscript. M.B.A. developed the algorithm for thermal infrared remote sensing of evapotranspiration. C.H. generated the evapotranspiration dataset. R.B.J. initiated the study and guided the analysis. All authors contributed to writing the manuscript.
Competing Interests Statement
Authors declare no competing interests.
Data availability
Global datasets of SCWDX80 and zCWDX80 are available on Zenodo61. The rooting depth data are published separately30.
Code availability
The CWD calculation from ET and Pin time series is implemented by the R package cwd49. All code for this analysis is published on Zenodo62.
References
- 1.Teuling AJ, Seneviratne SI, Williams C, Troch PA. Observed timescales of evapotranspiration response to soil moisture. Geophys. Res Lett. 2006;33 [Google Scholar]
- 2.Gao H, et al. Climate controls how ecosystems size the root zone storage capacity at catchment scale. Geophys Res Lett. 2014;41:7916–7923. [Google Scholar]
- 3.Milly PCD. Climate, soil water storage, and the average annual water balance. Water Resour Res. 1994;30:2143–2156. [Google Scholar]
- 4.Hahm WJ, et al. Low subsurface water storage capacity relative to annual rainfall decouples mediterranean plant productivity and water use from rainfall variability. Geophys Res Lett. 2019;46:6544–6553. [Google Scholar]
- 5.Seneviratne SI, et al. Investigating soil moisture-climate interactions in a changing climate: A review. Earth Science Rev. 2010;99:125–161. [Google Scholar]
- 6.Thompson SE, et al. Comparative hydrology across AmeriFlux sites: The variable roles of climate, vegetation, and groundwater. Water Resour Res. 2011;47 [Google Scholar]
- 7.Fan Y, Miguez-Macho G, Jobbágy EG, Jackson RB, Otero-Casal C. Hydrologic regulation of plant rooting depth. Proc Natl Acad Sci U S A. 2017;114:10572–10577. doi: 10.1073/pnas.1712381114. [DOI] [PMC free article] [PubMed] [Google Scholar]
- 8.Hain CR, Crow WT, Anderson MC, Tugrul Yilmaz M. Diagnosing neglected soil moisture source-sink processes via a thermal infrared-based two-source energy balance model. J Hydrometeorol. 2015;16:1070–1086. [Google Scholar]
- 9.Rempe DM, Dietrich WE. Direct observations of rock moisture, a hidden component of the hydrologic cycle. Proc Natl Acad Sci U S A. 2018;115:2664–2669. doi: 10.1073/pnas.1800141115. [DOI] [PMC free article] [PubMed] [Google Scholar]
- 10.Dawson TE, Jesse Hahm W, Crutchfield-Peters K. Digging deeper: what the critical zone perspective adds to the study of plant ecophysiology. New Phytol. 2020;226:666–671. doi: 10.1111/nph.16410. [DOI] [PubMed] [Google Scholar]
- 11.McCormick EL, et al. Widespread woody plant use of water stored in bedrock. Nature. 2021;597:225–229. doi: 10.1038/s41586-021-03761-3. [DOI] [PubMed] [Google Scholar]
- 12.Maxwell RM, Condon LE. Connections between groundwater flow and transpiration partitioning. Science. 2016;353:377–380. doi: 10.1126/science.aaf7891. [DOI] [PubMed] [Google Scholar]
- 13.Schlemmer L, Schär C, Lüthi D, Strebel L. A groundwater and runoff formulation for weather and climate models. J Adv Model Earth Syst. 2018;10:1809–1832. [Google Scholar]
- 14.Teuling AJ, et al. Contrasting response of european forest and grassland energy exchange to heatwaves. Nat Geosci. 2010;3:722–727. [Google Scholar]
- 15.Koirala S, et al. Global distribution of groundwater-vegetation spatial covariation. Geophys Res Lett. 2017;44:4134–4142. [Google Scholar]
- 16.Esteban EJL, Castilho CV, Melgaço KL, Costa FRC. The other side of droughts: wet extremes and topography as buffers of negative drought effects in an amazonian forest. New Phytol. 2021;229:1995–2006. doi: 10.1111/nph.17005. [DOI] [PubMed] [Google Scholar]
- 17.Liu Y, Konings AG, Kennedy D, Gentine P. Global coordination in plant physiological and rooting strategies in response to water stress. Glob Biogeochem Cycles. 2021;35 doi: 10.1029/2020GB006758. NA https://agupubs.onlinelibrary.wiley.com/doi/pdf/10.1029/2020GB006758. [DOI] [Google Scholar]
- 18.Schenk HJ, Jackson RB. The global biogeography of roots. Ecol Monogr. 2002;72:311–328. [Google Scholar]
- 19.Canadell J, et al. Maximum rooting depth of vegetation types at the global scale. Oecologia. 1996;108:583–595. doi: 10.1007/BF00329030. [DOI] [PubMed] [Google Scholar]
- 20.Weaver JE, Darland RW. Soil-Root relationships of certain native grasses in various soil types. Ecol Monogr. 1949;19:303–338. [Google Scholar]
- 21.Chitra-Tarak R, et al. Hydraulically-vulnerable trees survive on deep-water access during droughts in a tropical forest. New Phytol. 2021;231:1798–1813. doi: 10.1111/nph.17464. https://nph.onlinelibrary.wiley.com/doi/pdf/10.1111/nph.17464 . [DOI] [PMC free article] [PubMed] [Google Scholar]
- 22.Schenk HJ, Jackson RB. Mapping the global distribution of deep roots in relation to climate and soil characteristics. Geoderma. 2005;126:129–140. [Google Scholar]
- 23.Franklin O, et al. Organizing principles for vegetation dynamics. Nat Plants. 2020;6:444–453. doi: 10.1038/s41477-020-0655-x. [DOI] [PubMed] [Google Scholar]
- 24.Kleidon A, Heimann M. A method of determining rooting depth from a terrestrial biosphere model and its impacts on the global water and carbon cycle. Glob Chang Biol. 1998;4:275–286. [Google Scholar]
- 25.Schymanski SJ, Sivapalan M, Roderick ML, Hutley LB, Beringer J. An optimality-based model of the dynamic feedbacks between natural vegetation and the water balance. Water Resour Res. 2009;45 [Google Scholar]
- 26.Wang-Erlandsson L, et al. Global root zone storage capacity from satellite-based evaporation. Hydrol Earth Syst Sci. 2016;20:1459–1481. doi: 10.5194/hess-20-1459-2016. [DOI] [Google Scholar]
- 27.Knapp AK, Smith MD. Variation among biomes in temporal dynamics of aboveground primary production. Science. 2001;291:481–484. doi: 10.1126/science.291.5503.481. [DOI] [PubMed] [Google Scholar]
- 28.Anderson M. A Two-Source Time-Integrated model for estimating surface fluxes using thermal infrared remote sensing. Remote Sens Environ. 1997;60:195–216. [Google Scholar]
- 29.Hain CR, Anderson MC. Estimating morning change in land surface temperature from MODIS Day/Night observations: Applications for surface energy balance modeling. Geophys Res Lett. 2017;44:9723–9733. doi: 10.1002/2017GL074952. [DOI] [PMC free article] [PubMed] [Google Scholar]
- 30.Tumber-Dávila SJ, Schenk HJ, Du E, Jackson RB. Plant sizes and shapes above-and belowground and their interactions with climate. New Phytol. 2022 doi: 10.1111/nph.18031. https://nph.onlinelibrary.wiley.com/doi/pdf/10.1111/nph.18031 . [DOI] [PMC free article] [PubMed] [Google Scholar]
- 31.Food and Agriculture Organization of the United Nations. Harmonized World Soil Database: Fao/Iiasa/isric/isscas/jrc (Version 10) Food Agriculture Org; 2008. [Google Scholar]
- 32.Wieder W. Regridded harmonized world soil database v1.2. 2014. [DOI]
- 33.Balland V, Pollacco JAP, Arp PA. Modeling soil hydraulic properties for a wide range of soil conditions. Ecol Model. 2008;219:300–316. [Google Scholar]
- 34.Agee E, et al. Root lateral interactions drive water uptake patterns under water limitation. Adv Water Resour. 2021;151:103896 [Google Scholar]
- 35.Krakauer NY, Li H, Fan Y. Groundwater flow across spatial scales: importance for climate modeling. Environ Res Lett. 2014;9:034003. doi: 10.1088/1748-9326/9/3/034003. [DOI] [Google Scholar]
- 36.Stoy PC, et al. Reviews and syntheses: Turning the challenges of partitioning ecosystem evaporation and transpiration into opportunities. Biogeosciences. 2019;16:3747–3775. [Google Scholar]
- 37.Jackson RB, Moore LA, Hoffmann WA, Pockman WT, Linder CR. Ecosystem rooting depth determined with caves and dna. Proc Natl Acad Sci United States Am. 1999;96:11387–11392. doi: 10.1073/pnas.96.20.11387. [DOI] [PMC free article] [PubMed] [Google Scholar]
- 38.Pelletier JD, et al. A gridded global data set of soil, intact regolith, and sedimentary deposit thicknesses for regional and global land surface modeling. J Adv Model Earth Syst. 2016;8:41–65. [Google Scholar]
- 39.Parmesan C, Hanley ME. Plants and climate change: complexities and surprises. Annals Bot. 2015;116:849–864. doi: 10.1093/aob/mcv169. https://academic.oup.com/aob/article-pdf/116/6/849/17637271/mcv169.pdf . [DOI] [PMC free article] [PubMed] [Google Scholar]
- 40.Pendergrass AG, Knutti R, Lehner F, Deser C, Sanderson BM. Precipitation variability increases in a warmer climate. Sci Reports. 2017;7 doi: 10.1038/s41598-017-17966-y. [DOI] [PMC free article] [PubMed] [Google Scholar]
- 41.Siebert S, et al. Development and validation of the global map of irrigation areas. Hydrol Earth Syst Sci. 2005;9:535–547. [Google Scholar]
- 42.Friedl MA, et al. MODIS collection 5 global land cover: Algorithm refinements and characterization of new datasets. Remote Sens Environ. 2010;114:168–182. [Google Scholar]
- 43.Olson DM, et al. Terrestrial ecoregions of the world: A new map of life on earth. BioScience. 2001;51:933. [Google Scholar]
- 44.Mu Q, Heinsch FA, Zhao M, Running SW. Development of a global evapotranspiration algorithm based on MODIS and global meteorology data. Remote Sens Environ. 2007;111:519–536. [Google Scholar]
- 45.Fisher JB, et al. ECOSTRESS: NASA’s next generation mission to measure evapotranspiration from the international space station. Water Resour Res. 2020;56:e2019WR026058 [Google Scholar]
- 46.Davis TW, et al. Simple process-led algorithms for simulating habitats (SPLASH v.1.0): robust indices of radiation, evapotranspiration and plant-available moisture. Geosci Model Dev. 2017;10:689–708. [Google Scholar]
- 47.Weedon GP, et al. The WFDEI meteorological forcing data set: WATCH forcing data methodology applied to ERA-Interim reanalysis data. Water Resour Res. 2014;50:7505–7514. [Google Scholar]
- 48.Orth R, Koster RD, Seneviratne SI. Inferring soil moisture memory from streamflow observations using a simple water balance model. J Hydrometeorol. 2013;14:1773–1790. [Google Scholar]
- 49.Stocker B. cwd v1.0: R package for cumulative water deficit calculation. 2021. [DOI] [Google Scholar]
- 50.Zhang Y, et al. Model-based analysis of the relationship between sun-induced chlorophyll fluorescence and gross primary production for remote sensing applications. Remote Sens Environ. 2016;187:145–155. [Google Scholar]
- 51.Duveiller G, et al. A spatially downscaled sun-induced fluorescence global product for enhanced monitoring of vegetation productivity. Earth Syst Sci Data. 2020;12:1101–1116. [Google Scholar]
- 52.Joiner J, et al. Global monitoring of terrestrial chlorophyll fluorescence from moderate-spectral-resolution near infrared satellite measurements: methodology, simulations, and application to GOME-2. Atmospheric Meas Tech. 2013;6:2803–2823. [Google Scholar]
- 53.Köhler P, Guanter L, Joiner J. A linear method for the retrieval of sun-induced chlorophyll fluorescence from GOME-2 and SCIAMACHY data. Atmospheric Meas Tech. 2015;8:2589–2608. [Google Scholar]
- 54.Jiang B, et al. Validation of the surface daytime net radiation product from version 4.0 GLASS product suite. IEEE Geosci Remote Sens Lett. 2019;16:509–513. [Google Scholar]
- 55.Muggeo VMR. Estimating regression models with unknown break-points. Stat Med. 2003;22:3055–3071. doi: 10.1002/sim.1545. [DOI] [PubMed] [Google Scholar]
- 56.Gilleland E, Katz RW. extremes2.0: An extreme value analysis package inr. J Stat Softw. 2016;72 [Google Scholar]
- 57.Marthews TR, Dadson SJ, Lehner B, Abele S, Gedney N. High-resolution global topographic index values for use in large-scale hydrological modelling. Hydrol Earth Syst Sci. 2015;19:91–104. doi: 10.5194/hess-19-91-2015. [DOI] [Google Scholar]
- 58.National Geophysical Data Center, NESDIS, NOAA, U.S. Department of Commerce. Etopo1, global 1 arc-minute ocean depth and land elevation from the us national geophysical data center (ngdc) 2011.
- 59.Beven KJ, Kirkby MJ. A physically based, variable con-tributing area model of basin hydrology. Hydrol Sci J. 1979;24:43–69. doi: 10.1080/02626667909491834. [DOI] [Google Scholar]
- 60.Hansen MC, Townshend JRG, DeFries RS, Carroll M. Estimation of tree cover using MODIS data at global, continental and regional/local scales. Int J Remote Sens. 2005;26:4359–4380. [Google Scholar]
- 61.Stocker BD. Scwdx80 and zcwdx80. 2021. [DOI]
- 62.Stocker B. stineb/mct: v3.0: re-submission to Nature Geoscience. 2022. [DOI]
Associated Data
This section collects any data citations, data availability statements, or supplementary materials included in this article.
Supplementary Materials
Data Availability Statement
Global datasets of SCWDX80 and zCWDX80 are available on Zenodo61. The rooting depth data are published separately30.
The CWD calculation from ET and Pin time series is implemented by the R package cwd49. All code for this analysis is published on Zenodo62.


