

Abstract
A correlation between the degree of specialization for food hoarding and the volume of the hippocampal formation in passerine birds has been accepted for over a decade. The relationship was first demonstrated in family-level comparisons, and subsequently in species comparisons within two families containing a large number of hoarding species, the Corvidae and the Paridae. Recently, this approach has been criticized as invalid and excessively adaptationist. A recent test of the predicted trends with data pooled from previous studies found no evidence for such a correlation in either of these two families. This result has been interpreted as support for the critique. Here we reanalyse the original dataset and also include additional new data on several parid species. Our results show a surprising difference between continents, with North American species possessing significantly smaller hippocampi than Eurasian ones. Controlling for the continent effect makes the hoarding capacity/hippocampal formation correlation clearly significant in both families. We discuss possible reasons for the continent effect.
Keywords: hippocampus, hippocampal formation, neuroecology, Paridae, Corvidae
1. INTRODUCTION
Two seminal papers published in 1989 (Krebs et al. 1989; Sherry et al. 1989) established a relationship between the relative size of the hippocampal formation (hereafter HF) typical of an avian species and the degree of specialization for food hoarding shown in that species. The relationship has subsequently been supported by a number of studies (Healy & Krebs 1992, 1996; Healy et al. 1994; Hampton et al. 1995; Basil et al. 1996). The importance of this topic to the field is reflected in the number of times the original papers have been cited (as of 16 May 2004: Krebs et al. (1989): 229 times; Sherry et al. 1989: 151 times; citation figures come from ISI Web of Science web page).
Several recent papers have raised questions about the validity of these observations. Bolhuis & Macphail (2001) criticized the basic finding and, indeed, criticized the entire approach embodied in the search for correlations between brain structure and function (the field of ‘neuroecology’, defined as ‘the study of the neural mechanisms of behaviour guided by functional and evolutionary principles’). Brodin & Lundborg (2003; hereafter B&L) assembled data relating to the HF/hoarding relationship from all published studies of birds in the families Corvidae and Paridae, and they also supplemented the dataset with some of their own measurements. They did not find a significant correlation between HF volume and hoarding specialization in either family. This result held regardless of whether HF volume was taken relative to body mass or to telencephalon volume (without the hippocampus). The result also held when all the data from both families were combined in the analysis. While B&L offered several alternative hypotheses for the lack of a significant correlation (e.g. low sample size), one possible conclusion is that the contentions of Bolhuis & Macphail (2001) are supported.
One inexplicable trend is obvious on inspection of the figures included in B&L: birds representing North American species are different from those representing Eurasian species. For example, with regard to the current dataset, all Eurasian corvids are larger than any of the North American corvids. By contrast, the body sizes of the Eurasian parids broadly overlap with those of the North American parids, but HF sizes of the Eurasian species are predominantly larger than those of the North American species. We contend that these continental differences could result in different scaling properties of HF volume. If the HF does scale with size differently in the datasets from North America and Eurasia, then ignoring these differences will falsely inflate the probability of finding no significant difference in HF volume between species that vary in the degree of hoarding specialization. We explore this issue here. We also consider two additional statistical points. For each species included in their paper, B&L used a single mean value of hippocampal size, body mass and telencephalon size. The use of species-level means has two problems. First, the analysis implicitly assumes that each mean value is measured without variance, an assumption that is obviously violated. In addition, using the mean for each species essentially discards data. Here we expand the dataset used by B&L and use a repeated-measures statistical design that allows us to include all individual data while not over-inflating the degrees of freedom.
Finally, the B&L analyses are presented without reference to the power of their tests. While their Abstract correctly states that ‘a correlation between food-hoarding specialization and hippocampal volume cannot be claimed on the basis of present data in these families…,’ a reader could misinterpret the statement by concluding that B&L provide evidence for no correlation, particularly given the publicity surrounding the critique of Bolhuis & Macphail (2002) (see Dwyer & Clayton 2002; Hampton et al. 2002). To clarify the statement, a caveat should be added that a lack of correlation cannot be claimed either if the power of their tests was low. We provide these power estimates.
2. MATERIAL AND METHODS
We expanded the dataset described in B&L by collecting the raw data from authors of several of the cited publications (see table 1). We also include new data on relative HF sizes in a sample of Carolina chickadees Poecile carolinensis.
Table 1.
List of sources for HF volume estimates.
(n is total sample size. If more than one source is listed, the number of samples from that study is given in parentheses. ‘Days in captivity’ represent mean values derived from the original sources. Some birds were kept an unknown length of time, but longer than 1 year. ‘Days in captivity’ for these individuals was taken as 365. See B&L for information on hoarding category.)
| family | continent | species | hoarding category | days in captivity | n | source |
|---|---|---|---|---|---|---|
| Corvidae | n.a. | scrub jay (Aphelocoma coerulescens) | 2 | 365 | 2 | Basil et al. 1996 |
| grey-breasted jay (A. ultramarina) | 2 | 365 | 2 | Basil et al. 1996 | ||
| pinyon jay (Gymnorhinus cyanocephalus) | 3 | 365 | 2 | Basil et al. 1996 | ||
| Clark’s nutcracker (Nucifraga columbiana) | 3 | 365 | 4 | Basil et al. 1996 | ||
| blue jay (Cyanocitta cristata) | 3 | 0 | 1 | Sherry et al. 1989 | ||
| Eurasia | alpine chough (Pyrrhocorax graculus) | 1 | 365 | 1 | Healy & Krebs (1996) | |
| carrion crow (Corvus corone) | 2 | 0 | 2 | Healy & Krebs (1996) | ||
| jackdaw (Corvus monedula) | 1 | 0 | 14 | Healy & Krebs (1996) | ||
| Eurasian jay (Garrulus glandarius) | 3 | 0 | 5 | Healy & Krebs (1996) (2), Brodin & Lundborg (2003) (3) | ||
| magpie (Pica pica) | 2 | 0 | 13 | Healy & Krebs (1996) | ||
| red-billed blue magpie (Cissa erythrorhynca) | 2 | 365 | 1 | Healy & Krebs (1996) | ||
| rook (C. fugilegus) | 2 | 0 | 1 | Healy & Krebs (1996) | ||
| Paridae | n. a. | Mexican chickadee (Poecile sclateri) | 2 | 60 | 2 | Hampton et al. 1995 |
| bridled titmouse (Baeolophus wollweberi) | 2 | 60 | 3 | Hampton et al. 1995 | ||
| Carolina chickadee (P. carolinensis) | 2 | 40 | 20 | N.S. Clayton, T.M. Freeberg and J.R. Lucas (unpublished data) | ||
| black-capped chickadee (P. atricapillus) | 3 | 26 | 34 | Pravosudov & Clayton (2002) (25), Healy & Krebs (1996) (1), Hampton et al. 1995 (5), Sherry et al. 1989 (3) | ||
| mountain chickadee (P. gambeli) | 3 | 67 | 46 | Pravosudov & Omanska (2005) (24), Pravosudov et al. 2002a (22) | ||
| Eurasia | willow tit (Parus montanus) | 3 | 0 | 10 | Healy & Krebs (1996) (2), Brodin & Lundborg (2003) (8) | |
| marsh tit (P. palustris) | 2 | 0 | 18 | Healy & Krebs (1996)b | ||
| blue tit (P. caeruleus) | 1 | 0 | 22 | Healy & Krebs (1996)b | ||
| coal tit (P. ater) | 2 | 0 | 2 | Healy & Krebs (1996)b | ||
| great tit (P. major) | 1 | 0 | 4 | Healy & Krebs (1996)b |
No body mass data available.
Dataset includes only mean mass for sample.
(a) Hippocampal measurements
Twenty adult male Carolina chickadees were captured near West Lafayette, Indiana, for study of energy regulation patterns under aviary conditions. Four birds were captured in each of the following months: January, March, May, August and November. The birds were then kept in aviaries under a L : D regime that matched natural L : D cycles for six weeks. Grit and water with vitamins were available ad libitum throughout the study. After one week of ad libitum access to food (sunflower seeds, carrot, crushed peanuts, canary food), food availability was decreased to an average of 4.8 min h−1 (in 12 min blocks of continuous access to food) for three weeks. The birds were then given two weeks of continuous access to food, interspersed with a deprivation period of 4 h and a second period of 2 h (this feeding schedule was associated with memory tests). The birds were then sacrificed, and the brains were processed as described in Clayton & Krebs (1994). Sections of 40 μm thickness were mounted onto slides and stained with cresyl violet acetate. The brain sections from each bird were coded so that the experimenters were blind to the treatment group, and the codes were not broken until the analyses had been completed. The boundaries of the HF and telencephalon of coded brain sections were digitized using a Sprintscan 35 mm scanner following the methods reported in Clayton (2001). Using NIH Image software, the area of the HF (parahippocampus and hippocampus proper) and the remainder of the telencephalon (i.e. minus the HF and septum) were measured for each digitized section by tracing the outlines of the HF and remainder of the telencephalon directly with the pen tool. Following Clayton & Krebs (1994), the volume of the HF and the remainder of the telencephalon was then calculated for each bird using the formula for a truncated cone. As in previous studies (e.g. Krebs et al. 1989), the estimated observer error in tracing and measuring these brain area boundaries was less than 4%.
(b) Statistical analyses
Two sets of analyses were performed. We reanalysed the B&L dataset and additionally calculated power for the non-significant results. The power analyses were conducted following techniques described in Cohen (1988) for complex ANCOVA designs. We also ran ANCOVA models on these data adding an additional term representing the continent from which the species was taken. Following B&L and all other similar studies published to date, this ANCOVA was performed only on mean values for each species. B&L performed their statistics on residuals from linear regression models of hippocampal size taken as a function of mean size (either HF volume or mass). By contrast, our results are reported for the entire ANCOVA model (see Darlington & Smulders (2001) for a discussion of the use of residuals).
The second analysis was performed on our complete dataset, including data on most individuals from the original papers and new data on Carolina chickadees. We treated the analysis as a repeated-measures problem, with each individual a repeated measure of the subject ‘species’. All analyses were conducted with Proc Mixed (SAS Institute 1994), using a simple variance matrix. Where caching intensity was significant, we compared means between categories of caching specialization using t-tests with a Tukey–Kramer adjustment for multiple tests (SAS Institute 1994). Note that this approach is a better representation of the data compared to the use of means, because the variability of measures within species is accounted for. However, the degrees of freedom of the resulting F-test reflect the number of species analysed, not the total number of individuals measured, thus avoiding the problem of pseudoreplication.
Log hippocampal volume was used as the dependent variable in all but one model. HF volume was not transformed for the complete parid dataset because a log transformation decreased the fit of the model residuals to a normal distribution. Independent variables included size, continent of origin, and degree of caching specialization (see table 1). Following B&L, we used two measures of size: telencephalon volume and body mass. These were log transformed whenever the dependent variable was log transformed.
We characterized species based on caching specialization with a three-point scale: 1 = non-hoarders, 2 = non-specialized hoarders, 3 = specialized hoarders. The levels of caching specialization are the same as those in table 1 in B&L, except black-capped chickadees P. atricapilla were considered specialized hoarders because most of the individuals used in the present analysis (Pravosudov & Clayton 2002) were taken from Alaska. In the northern parts of their range black-capped chickadees cache prodigiously (A. Brodin, unpublished data; also Hampton et al. 1995), and in the laboratory the Alaskan birds cached large amounts of seeds (Pravosudov & Clayton 2002).
3. RESULTS
We provide separate analyses for corvids and parids because we see no a priori reason for the families to show the same scaling between HF volume and body size or telencephalon volume.
(a) Corvidae
B&L found no significant effect of caching specialization on HF volume among the corvids. Not surprisingly, our results support this finding (using log(mass) as a covariate: HF volume increases with body mass, F1,8 = 79.8, p < 0.0001, but there is no significant effect of cache specialization, F2,8 = 1.4, p = 0.30; using log(telencephalon) as a covariate: HF volume increases with telencephalon volume, F1,8 = 25.8, p = 0.0012, but there is no significant effect of cache specialization, F2,8 = 0.7, p = 0.53). However, the power of this test is quite low ( f = 0.8, α = 0.05, n′ = 4, power = 0.54). This means that even if caching intensity had a strong effect on HF volume ( f = 0.8 corresponds to an r2 = 0.39—essentially 39% of variance accounted for with the independent variable), this is likely to be detected only 54% of the time. In short, there is little we can say about these data; we can conclude neither that there is an effect nor that there is no effect.
If we add ‘continent’ to the model, both continent and caching specialization are significantly correlated with HF volume (table 2). The pattern holds whether hippocampal size is taken relative to telencephalon volume (figure 1a) or relative to body mass (figure 1b). In both cases, Eurasian HF volumes are higher than North American HF volumes (table 3). In addition, the species showing the weakest caching behaviours had the smallest HF volumes (significantly smaller than category 2 or 3), but species with an intermediate caching specialization were not significantly different than the most specialized species (table 3).
Table 2.
ANCOVA table testing for an effect of continent (North America versus Eurasia) and caching specialization on hippocampal size.
(Caching specialization was 1 for species that do not hoard or rarely hoard; 2 for species with ‘intermediate’ hoarding propensity; and 3 for species that hoard extensively. ‘Means’ dataset includes only species means; ‘full’ dataset includes individual values (see § 2). HF size, mass and telencephalon size were log transformed for the corvid data and parid mean data. No transformation was used for the parid full dataset. Note that two sets of ANCOVA models were run for each combination of family and dataset: one with body mass as a covariate and a second with telencephalon volume as a covariate.)
| family | dataset | mass | p | telencephalon | p | continent | p | caching specialization | p |
|---|---|---|---|---|---|---|---|---|---|
| Corvidae | means | 1,7 = 26.7 | 0.001 | 1,7 = 11.1 | 0.013 | 2,7 = 7.5 | 0.019 | ||
| means | 1,7 = 12.8 | 0.009 | 1,7 = 20.3 | 0.003 | 2,7 = 6.9 | 0.022 | |||
| full | 1,7 = 19.6 | 0.003 | 1,8 = 14.5 | 0.005 | 2,8 = 11.9 | 0.004 | |||
| full | 1,7 = 37.1 | 0.001 | 1,8 = 48.4 | <0.001 | 2,8 = 15.2 | 0.002 | |||
| Paridae | means | 1,5 = 0.1 | 0.740 | 1,5 = 11.5 | 0.020 | 2,5 = 5.9 | 0.048 | ||
| means | 1,5 = 0.0 | 0.900 | 1,5 = 11.0 | 0.021 | 2,5 = 5.7 | 0.051 | |||
| full | 1,6 = 0.9 | 0.130 | 1,6 = 6.2 | 0.025 | 2,6 = 7.3 | 0.048 | |||
| full | 1,9 = 147.9 | <0.001 | 1,6 = 9.7 | 0.021 | 2,6 = 5.2 | 0.049 |
Figure 1.
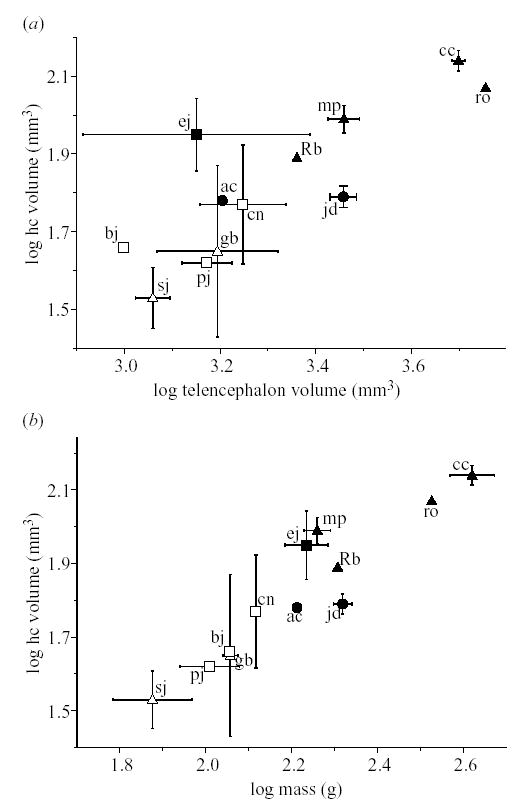
Log(HF volume) in corvids plotted against (a) log(telencephalon volume) and (b) log(body mass). Sj = scrub jay; pj = pinyon jay; gb = grey-breasted jay; bj = blue jay; ac = alpine chough; cn = Clark’s nutcracker; jd = jackdaw; mp = magpie; ej = Eurasian jay; ro = rook; rb = red-billed blue magpie; cc = carrion crow. Open symbols represent species from North America; filled symbols are species from Eurasia. Symbol type represents caching specialization: circle: non-hoarders; triangle: non-specialized hoarders; square: specialized hoarders.
Table 3.
Least squares means (±s.e.m.) estimates of HF volume between continents and between species that vary in caching specialization.
(See table 2 for ANCOVA statistics. Numbers with the same superscripts are not significantly different at α = 0.05. ‘tel’= telencephalon volume. Two datasets are represented: ‘means’ includes only means per species, and ‘full’ includes all individual values. N.A., North America.)
| family | dataset | covariate | hoarding category | log10(HF) | continent | log10(HF) |
|---|---|---|---|---|---|---|
| Corvidae | means | log10(mass) | 1 | 1.67 ± 0.04A | Eurasia | 1.86 ± 0.02A |
| 2 | 1.81 ± 0.02B | N.A. | 1.69 ± 0.04B | |||
| 3 | 1.85 ± 0.02B | |||||
| log10(tel) | 1 | 1.65 ± 0.05A | Eurasia | 1.90 ± 0.03A | ||
| 2 | 1.79 ± 0.03B | N.A. | 1.65 ± 0.04B | |||
| 3 | 1.88 ± 0.03B | |||||
| full | log10(mass) | 1 | 1.67 ± 0.04A | Eurasia | 1.70 ± 0.04A | |
| 2 | 1.85± 0.02B | N.A. | 1.89 ± 0.02B | |||
| 3 | 1.87 ± 0.03B | |||||
| log10(tel) | 1 | 1.66 ± 0.04A | Eurasia | 1.67 ± 0.03A | ||
| 2 | 1.82 ± 0.02B | N.A. | 1.92 ± 0.02B | |||
| 3 | 1.91 ± 0.03C | |||||
| Paridae | means | log10(mass) | 1 | 1.07 ± 0.05A | Eurasia | 1.05 ± 0.04A |
| 2 | 1.08 ± 0.06A;B | N.A. | 1.22 ± 0.04B | |||
| 3 | 1.25 ± 0.04B | |||||
| log10(tel) | 1 | 1.08 ± 0.05A | Eurasia | 1.05 ± 0.04A | ||
| 2 | 1.08 ± 0.26B | N.A. | 1.22 ± 0.04B | |||
| 3 | 1.25 ± 0.04B | |||||
| full | body mass | 1 | 10.51 ± 2.77A | Eurasia | 17.48 ± 1.54A | |
| 2 | 13.11 ± 1.53A | N.A. | 11.78 ± 1.69B | |||
| 3 | 29.27 ± 1.71B | |||||
| tel volume | 1 | 8.42 ± 2.76A | Eurasia | 18.64 ± 1.59A | ||
| 2 | 15.67 ± 1.61A,B | N.A. | 10.70 ± 1.88B | |||
| 3 | 19.93 ± 2.00B |
Similar results come from an analysis of the full dataset (table 2). Multiple comparisons tests show that the weakest caching species are outliers when HF volume is corrected for body mass (table 3). When HF is corrected for telencephalon volume, all of the comparisons (1 versus 2, 1 versus 3, 2 versus 3) are significant at α = 0.05 (table 3).
(b) Paridae
As with the corvids, no significant effect of caching specialization is indicated in the original B&L dataset (using log(mass) as a covariate: mass effect, F1,6 = 0.12, p = 0.74, cache specialization effect, F2,6 = 1.48, p = 0.30; using log(telencephalon volume) as a covariate: telencephalon effect, F1,6 = 0.16, p = 0.71, caching specialization effect, F2,16 = 1.51, p = 0.29). The power of this test was quite low ( f = 0.8, α = 0.05, n′ = 3, power = 0.37). The dataset with this statistical model is insufficient to support either positive or negative conclusions about the relationship between hippocampal size and cache specialization.
If ‘continent’ is added to the model, both the continent effect and cache specialization effects are significantly correlated with HF volume (table 2). Generally, HF volume is larger in Eurasia than in North America (table 3). Also, birds with the strongest cache specialization have significantly larger HF volumes than those with intermediate or no caching behaviour (table 3).
Our analyses of the full dataset for the Paridae generate similar conclusions. For this dataset, both the continent effect and the caching specialization effect are a significant contributor to variance in HF size (table 2; Figure 2a,b). Eurasian HF volumes are significantly larger than North American volumes and birds with the strongest cache specialization have significantly larger HF volumes than those with intermediate (only using body mass as a covariate) and no caching behaviour (using either body mass or telencephalon as a covariate; table 3).
Figure 2.
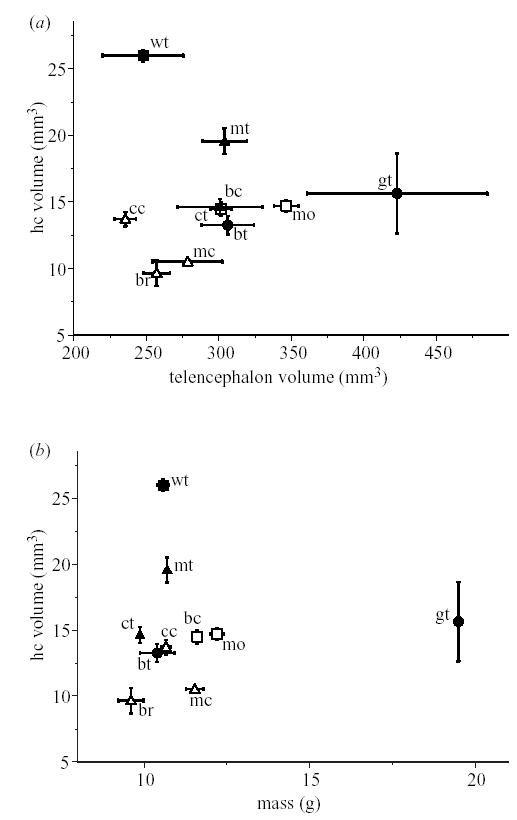
HF volume in parids plotted against (a) telencephalon volume and (b) body mass. Wt = willow tit; mt = marsh tit; ct = coal tit; bt = blue tit; gt = great tit; cc = Carolina chickadee; mc = Mexican chickadee; bc = black-capped chickadee; mo = mountain chickadee; br = bridled titmouse. Open symbols represent species from North America; filled symbols are species from Eurasia. Symbol type represents caching specialization: circle: non-hoarders; triangle: non-specialized hoarders; square: specialized hoarders.
(c) Is the ‘continent‘ effect caused by differences in time in captivity?
Our results beg the question, exactly what is the ‘continent’ effect? We discuss two alternatives, true continent effects and laboratory effects in § 4. We consider a third alternative, that there is some bias in the data set related to time in captivity—a factor that has been suggested to affect HF volume in previous studies (e.g. Smulders et al. 1995; Barnea & Nottebohm 1996; but see Cristol 1996; Pravosudov et al. 2002). We tested this with the B&L dataset, deriving estimates of time in captivity from the original papers. Adding captivity time to the model had no effect on our conclusions, and captivity time was not significant for any of the models (corvids with log(mass) covariate: F1,6 = 0.13, p = 0.73, with log(telencephalon) covariate: F1,6 = 0.20, p = 0.67; parids with log(mass) covariate: F1,4 = 0.32, p = 0.60, with log(telencephalon) covariate: F1,4 = 0.42, p = 0.55). In short, the amount of time the birds were held in captivity is not a contributor to the ‘continent’ effect.
4. DISCUSSION
Statistically, the answer to the question posed in our title is ‘yes’. In both families, our analyses suggest that HF volume does indeed strongly correlate with the degree of caching specialization exhibited in a species, with one caveat. This trend holds whether we use species means or individual values, and it holds whether we treat body mass or telencephalon volume as a covariate against which to scale HF volume. The caveat is that both the corvids and parids in this sample from North America appear to differ from Eurasian birds of the same family. This trend is not the result of a systematic bias in time-in-captivity, a factor that may have some quantitative effect on HF volume (Smulders et al. 1995; Barnea & Nottebohm 1996), although attempts to manipulate adult HF volume through experience in laboratory settings have been unsuccessful (Cristol 1996; Pravosudov et al. 2002).
Why then did we find a ‘continent’ effect? We offer three alternative hypotheses, although none seem to be particularly strongly supported given what we currently know about these two families. One is that there is variation between laboratories in how the brain samples were analysed or in how the brains were measured. With the exception of one study (Basil et al. 1996), the techniques used in each of the laboratories are similar, in large part because many of the main contributors in this field have collaborated at some point. However, the samples vary in the number of laboratories contributing to the dataset. A single laboratory contributed virtually all of the corvid data from North America and another laboratory contributed virtually all the data from Eurasia. By contrast, the North American parid data come from a larger number of laboratories than any other sample. Yet all four datasets (two continents and two families) follow the predicted trends. Given this fact, it seems unlikely that the trends are derived from a systematic laboratory bias, but we cannot rule this out unequivocally.
Another possibility is that there is truly some continent-wide difference in the scaling of the brains of these birds. Two not mutually exclusive factors may contribute to this effect. The first factor is ecological. In these samples, the range of caching specialization is greater in Eurasia than it is in North America. No North American species fails to cache, whereas several Eurasian species in both the Corvidae and the Paridae have been deemed not to cache at all. Given that caching tendencies are related to both ecological and social factors (Ekman 1989), differences in the range of caching intensities may indicate fundamental differences in ecological relationships between continents. Several ecological trends are consistent with this interpretation. For example, the North American avifauna is more diverse (Mönkkönen 1994), has a lower percentage of migrating species (Newton 1995), and has populations that are more strongly affected by habitat area (Bender et al. 1998) compared to the Eurasian avifauna. The implication of these results is that a longer history of anthropogenic disturbance in the Eastern Hemisphere has had an impact on the species found there; the implication for the results we report here is that there are indeed fundamental differences in ecological relationships between continents. Continent-wide differences in body mass of birds in our sample, at least in the corvids, underscores the possibility that these ecological differences could result in continent-wide variation in caching.
Second, the current analysis fails to consider the phylogenetic relationships between the species. This factor is particularly problematic for the corvids, where phylogeny may explain the ‘continent’ effect observed in this analysis. The separation into American and Eurasian Corvidae in this study coincides closely with a phylogenetic distinction (Hope 1989). The American species are all closely related to each other compared to the Eurasian species and vice versa. The only exception is the Clark’s nutcracker, which is an American species but is more closely related to the Eurasian corvids, especially the Eurasian nutcracker. It is noteworthy that this is also the only American species that is similar in relative HF volume (using body mass as a covariate) to the Eurasian species. Basil et al. 1996 have already pointed out that the difference in relative HF volume between Clark’s nutcrackers and the American jay species might be the result of phylogenetic factors. Unfortunately, the available information for the phylogenetic relationships among corvids still does not allow an analysis that controls for phylogeny. In addition, given that the American and Eurasian corvid species are two distinct groups, one would not necessarily expect them to scale similarly for HF volume in relation to body size. By contrast, there are no clear taxonomic groups associated with either continent for the parid species (Sheldon et al. 1992). Some of the American chickadees are closely related to the Eurasian willow and marsh tit, and less so to the other Eurasian species.
A final consideration that may create considerable noise in the data concerns the sampling location of the specimens involved. Geographically separated populations of one species may differ in cache propensity and correspondingly in relative HF size. Classification of species into hoarding categories may fail to reflect individual hoarding categories. For instance, black-capped chickadees from Alaska have larger hippocampi than their counterparts from Colorado (Pravosudov & Clayton 2002). Alaskan black-capped chickadees should probably be categorized as specialized hoarders, while birds from Colorado could be categorized as non-specialized hoarders. Correspondingly, Eurasian jays from Sweden have a larger HF relative to telencephalon than their counterparts from the UK.
The analyses we provide here are not meant to address a central point in the controversy related to the utility of the ‘neuroecological approach’ (Bolhuis & Macphail 2001, 2002; Dwyer & Clayton 2002; Hampton et al. 2002)—whether function gives us any insight into neurological mechanisms. Nonetheless, B&L suggested that a lack of correlation might support the contention of Bolhuis & Macphail (2001) that ‘natural variation in morphology cannot be used to understand the cognitive functioning of the brain’. This conclusion is premature. However, we clearly need better estimates of HF volume, with at least as many species as we report here, all processed in the same laboratory. This is the only means we know of that will address the simplest alternative hypothesis related to the basis of the ‘continent’ effect. Given the clear relevance of the relationship between HF volume and caching specialization, the effort needed to replicate these data seems warranted.
Acknowledgments
The authors thank Sue Healy, Rob Hampton and Vladimir Pravosudov for sending the additional data on individual brain volumes, and Claire Borton and Lauren Broom for their help in cutting, staining and measuring the brains. Thanks to Adam Boyko, Ben and Kerry Fanson, and Denise Zielinski for comments on a previous draft. Measurements of the Carolina chickadee brain volumes were funded by an NIMH grant to J.R.L., N.S.C. and Hubert Schwabl. N.S.C. was additionally supported by BBSRC grant S16565 and the University of Cambridge. S.d.K. was funded by the BBSRC grant S16565 and Schlumberger Interdisciplinary Research Fellowship at Darwin College, Cambridge. A.B. was supported by grant 621-2003-2484 from the Swedish Research Council.
References
- Barnea A, Nottebohm F. Recruitment and replacement of hippocampal neurons in young and adult chickadees: an addition to the theory of hippocampal learning. Proc Natl Acad Sci USA. 1996;93:714–718. doi: 10.1073/pnas.93.2.714. [DOI] [PMC free article] [PubMed] [Google Scholar]
- Basil JA, Kamil AC, Balda RB, Fite KV. Difference in hippocampal volume among food storing corvids. Brain Behav Evol. 1996;47:156–164. doi: 10.1159/000113235. [DOI] [PubMed] [Google Scholar]
- Bender DJ, Contreras TA, Fahrig L. Habitat loss and population decline: a meta-analysis of the patch size effect. Ecology. 1998;79:517–533. [Google Scholar]
- Bolhuis JJ, Macphail EM. A critique of the neuroecology of learning and memory. Trends Cogn Sci. 2001;5:426–433. doi: 10.1016/s1364-6613(00)01753-8. [DOI] [PubMed] [Google Scholar]
- Bolhuis JJ, Macphail EM. Everything in neuroecology makes sense in the light of evolution. Trends Cogn Sci. 2002;6:7–8. doi: 10.1016/s1364-6613(00)01829-5. [DOI] [PubMed] [Google Scholar]
- Brodin A, Lundborg K. Is hippocampus volume affected by specialization for food hoarding in birds? Proc R Soc Lond. 2003;B 270:1555–1563. doi: 10.1098/rspb.2003.2413. (doi:10.1098/rspb.2003.2413) [DOI] [PMC free article] [PubMed] [Google Scholar]
- Clayton NS. Hippocampal growth and maintenance depends on food-caching experience in juvenile mountain chickadees (Poecile gambeli) Behav Neurosci. 2001;115:614–625. doi: 10.1037//0735-7044.115.3.614. [DOI] [PubMed] [Google Scholar]
- Clayton NS, Krebs JR. Hippocampal growth and attrition in birds affected by experience. Proc Natl Acad Sci USA. 1994;91:7410–7414. doi: 10.1073/pnas.91.16.7410. [DOI] [PMC free article] [PubMed] [Google Scholar]
- Cohen, J. 1988 Statistical power analysis for the behavioral sciences, 2nd edn. Hillsdale, NJ: Lawrence Ehrlbaum.
- Cristol DA. Food storing does not affect hippocampal volume in experienced adult willow tits. Behav Brain Res. 1996;81:233–236. doi: 10.1016/s0166-4328(96)89083-8. [DOI] [PubMed] [Google Scholar]
- Darlington RB, Smulders TV. Problems with residual analysis. Anim Behav. 2001;62:599–602. [Google Scholar]
- Dwyer DM, Clayton NS. A reply to the defenders of the faith. Trends Cogn Sci. 2002;6:109–111. doi: 10.1016/s1364-6613(00)01857-x. [DOI] [PubMed] [Google Scholar]
- Ekman J. Ecology of non-breeding social systems of Parus. Wilson Bull. 1989;101:263–288. [Google Scholar]
- Hampton RR, Sherry DF, Shettleworth SJ, Khurgel M, Ivy G. Hippocampal volume and food-storing behavior are related in parids. Brain Behav Evol. 1995;45:54–61. doi: 10.1159/000113385. [DOI] [PubMed] [Google Scholar]
- Hampton RR, Healy SD, Shettleworth SJ, Kamil AC. ‘Neuroecologists’ are not made of straw. Trends Cogn Sci. 2002;6:6–7. doi: 10.1016/s1364-6613(00)01821-0. [DOI] [PubMed] [Google Scholar]
- Healy SD, Krebs JR. Food storing and the hippocampus in corvids: amount and volume are correlated. Proc R Soc Lond B. 1992;248:241–245. [Google Scholar]
- Healy SD, Krebs JR. Food storing and the hippocampus in Paridae. Brain Behav Evol. 1996;47:195–199. doi: 10.1159/000113239. [DOI] [PubMed] [Google Scholar]
- Healy SD, Clayton NS, Krebs JR. Development of hippocampal specialisation in two species of tit (Parus spp) Behav Brain Res. 1994;61:23–28. doi: 10.1016/0166-4328(94)90004-3. [DOI] [PubMed] [Google Scholar]
- Hope, S. 1989 Phylogeny of the avian family Corvidae City University of New York.
- Krebs JR, Sherry DF, Healy SD, Perry H, Vaccarino AL. Hippocampal specialization of food-storing birds. Proc Natl Acad Sci USA. 1989;86:1388–1392. doi: 10.1073/pnas.86.4.1388. [DOI] [PMC free article] [PubMed] [Google Scholar]
- Mönkkönen M. Diversity patterns in Palearctic and Nearctic forest bird assemblages. J Biogeogr. 1994;21:183–195. [Google Scholar]
- Newton I. The contribution of some recent research on birds to ecological understanding. J Anim Ecol. 1995;64:675–696. [Google Scholar]
- Pravosudov VV, Clayton NS. A test of the adaptive specialization hypothesis: population differences in caching, memory and the hippocampus in black-capped chickadees (Poecile atricapilla) Behav Neurosci. 2002;116:515–522. [PubMed] [Google Scholar]
- Pravosudov VV, Lavenex P, Clayton NC. Changes in spatial memory mediated by experimental variation in food supply do not affect hippocampal anatomy in mountain chickadees (Poecile gambeli) J Neurobiol. 2002;51:142–148. doi: 10.1002/neu.10045. [DOI] [PubMed] [Google Scholar]
- Pravosudov, V. V. & Omanska, A. 2005 Dominance-related changes in spatial memory are associated with changes in hippocampal cell proliferation rates in mountain chickadees. J. Neurobiol (In the press.) [DOI] [PubMed]
- SAS Institute 1994 SAS/STAT software. Release 6.09 and release 6.08 maintenance enhancements for Proc Mixed Cary, NC: SAS Institute, Inc.
- Sheldon FH, Slikas B, Kinnarney M, Gill FB, Zhao E, Silverin B. DNA–DNA hybridization evidence of phylogenetic relationships among major lineages of Parus. Auk. 1992;109:173–185. [Google Scholar]
- Sherry DF, Vaccarino AL, Buckenham K, Herz RS. The hippocampal complex of food-storing birds. Brain Behav Evol. 1989;34:308–317. doi: 10.1159/000116516. [DOI] [PubMed] [Google Scholar]
- Smulders TV, Sasson AD, DeVoogd TJ. Seasonal variation in hippocampal volume in a food-storing bird, the black-capped chickadee. J Neurobiol. 1995;27:15–25. doi: 10.1002/neu.480270103. [DOI] [PubMed] [Google Scholar]