

Abstract
We have discovered quantitative optical biomarkers unique to cancer by developing a double-differential spectroscopic analysis method for near-infrared (NIR, 650-1000nm) spectra acquired non-invasively from breast tumors. These biomarkers are characterized by specific NIR absorption bands. The double-differential method removes patient specific variations in molecular composition which are not related to cancer, and reveals these specific cancer biomarkers. Based on the spectral regions of absorption, we identify these biomarkers with lipids that are present in tumors either in different abundance than in the normal breast or new lipid components that are generated by tumor metabolism. Furthermore, the O-H overtone regions (980-1000 nm) show distinct variations in the tumor as compared to the normal breast. To quantify spectral variation in the absorption bands, we constructed the Specific Tumor Component (STC) index. In a pilot study of 12 cancer patients we found 100% sensitivity and 100% specificity for lesion identification. The STC index, combined with other previously described tissue optical indices, further improves the diagnostic power of NIR for breast cancer detection.
Keywords: Breast Cancer, Optical Spectra, Near Infrared Spectroscopy (NIRS) Lipids, Lipid Spectroscopy
1. Introduction
Do intrinsic quantitative optical biomarkers exist for malignant tumors that can be measured non-invasively? If this will be found, then optical biopsy using non-invasive methods could be performed with great advantages in terms of cost, number of procedures, speed and availability upon existing methods. Optical spectroscopy is not invasive and offers a unique view of tissue because it is sensitive to compositional and functional characteristics. Spectroscopic methods have employed absorption, scattering, and fluorescent contrast (endogenous and exogenous) to detect tumors in breast, cervix, skin, and esophagus over wavelengths ranging from the ultraviolet through the infrared. Depending upon the optical wavelengths, light can interrogate superficial to cm-thick tissues.[1] Although the penetration of light in tissues is strongly wavelength dependent, light may be delivered to most tissues either non-invasively (topical application) or by the use of intra-operative or minimally invasive probes (i.e., endoscopy). Our contribution will deal exclusively with breast tissues exposed to NIR light, but the general principles of our method could be applied to any cancer type.
Within the NIR spectral region (650-1000 nm), light penetrates deeply enough to transilluminate cm-thick tissues such as the breast. NIR is sensitive to the four major absorbing components in breast tissues: oxyhemoglobin, deoxyhemoglobin, water, and bulk lipids.[2, 3]
The main hypothesis of NIR cancer detection has been that malignant transformation changes the balance of hemoglobin (oxygenation state), water, and bulk lipids in tissue. Differences in optical signatures between tissues are manifestations of multiple physiological changes associated with factors such as vascularization, cellularity, oxygen consumption, edema, fibrosis, and remodeling. [8] Several groups have employed NIR optical methods to measure subtle physiological alterations in healthy breast tissue,[7, 9-12] cancerous breast tissues,[8, 13-20] and malignant tumors treated with neoadjuvant chemotherapy.[21-23]
The transport of NIR light in tissues is dominated by multiple-scattering, which complicates the quantitative recovery of the amounts of these four components from the absorption spectra from tissues. Light transport can be modeled as a diffusive process where photons behave as stochastic particles much like the bulk movement of molecules or heat. The most accurate tissue optical absorption spectra can only be obtained by separating light absorption from scattering, which can be performed using a model-based approach alongside time- or frequency-domain measurements.[4-6] These absorption spectra are then translated into hemoglobin, water, and bulk lipids, using the Beer-Lambert law along with known component extinction coefficients (Figure 1) (for a detailed description see [7]).
Figure 1.

Basis spectra set used to describe the major tissue components in the breast. Each component is identified in the figure legend.
After many years of research it is realized that although changes in NIR measured components are altered significantly by tumors, they are not specific for cancer; the same components are found in both normal and malignant tissues. Thus the detection of cancer is based upon crossing a threshold in hemoglobin, and sometimes water, and bulk lipids. Complications can arise in separating malignant from benign lesions, since benign lesions are also known to change water, hemoglobin, and bulk lipids in a similar fashion to malignant lesions.[7, 19] Exogenous contrast agents have been developed for both absorption and fluorescence contrast, in order to increase sensitivity and specificity.[24]
However, it is known that tumors alter the composition of tissues in other ways that are not accounted for in traditional NIR spectroscopic models. Alterations in protein expression, lipid and water states, and the presence of hemoglobin breakdown products can occur in malignant transformation.[25-28] These biochemical state alterations, or additional biochemical components, are likely to be small contributions to the overall tumor absorption spectrum. Even if smaller, these contributions should be unique to tumor tissues, and provide an endogenous spectroscopic signature that is specific of the lesion. To summarize: our hypothesis is that the optical absorption spectra of malignant tissues differ from normal spectra not only due to bulk absorber concentration differences, but also due to small changes of as yet unknown components.
In order to discern these subtle alterations in tumor absorption spectra that are not accounted for in traditional NIR component models of breast tissues, we have developed a double-differential method. The method nulls the effect of the four basis components to reveal the small spectral changes unique to cancer. Note that this method only works because we have two independent controls as will be discussed later. The results of our analysis will show only intrinsic, unique quantitative biomarkers of cancers which are not included in the basis spectra of the four components (hemoglobin, water and bulk lipids). We hypothesize the biochemical/physical origin of these spectral bands to reside in tumor specific changes in types and abundance of lipid components and changes in the O-H overtone region. Future work will determine the chemical origin of these spectral changes and improve breast cancer diagnostics by using these specific endogenous molecular markers to improve understanding of molecular changes in cancerous tissue.
2. Materials and Methods
A. Instrumentation
The detection and quantitation of subtle spectral shifts to fingerprint disease requires accurate reconstruction of tissue absorption spectra uncontaminated by the effects of scattering. For this purpose we have employed a technique known as Diffuse Optical Spectroscopy (DOS), more specifically we use the well established method of Steady State Frequency Domain Photon Migration (SSFDPM) which can quantitatively measure scattering and absorption independently from each other. [29-31] The particular instrument used was the Laser Breast Scanner (LBS), which is a bedside-capable instrument that has been used in several clinical trials for breast cancer detection [32, 33] and monitoring response to neoadjuvant chemotherapy.[21, 22] The LBS employs a handpiece similar to an ultrasound probe which was placed on the surface of the breast to recover tissue optical spectra from 650 to 1000 nm. Typically DOS samples a low number of spatial locations with a large spectral bandwidth.
B. Data Processing
Data were analyzed in three stages: (1) calculation of absorption and scattering spectra, (2) calculation of absorber concentrations, and (3) calculation of unique tumor spectra by the double differential method. Stages 1 & 2 have been detailed in the literature and are only summarized here.[32] A diffusive model constructed within the semi-infinite geometry is used to translate measured optical signals into absorption and scattering coefficients for each measured wavelength. Using independently measured molar extinction coefficients, the concentrations of the dominant absorbers found in breast tissue can be obtained: oxygenated [O2Hb] and deoxygenated hemoglobin [HHb], water [H2O], and bulk lipids. (Figure 1). The concentrations of these chromophores are then used to diagnose the presence of disease; this approach was outlined in a previous review article in this journal.[34] All data processing was performed using custom software designed in the MATLAB platform.
The unique spectral components were calculated using a double-differential technique applied to the measured absorption spectra, which is described in the Results and Discussion section. The absorbance data were analyzed by the Elantest program (available at ftp://ftp.lfd.uci.edu/lfd/egratton/elantest/elantest.exe
C. Measurement Procedure
We employed a measurement procedure which has been detailed in the literature.[32] Briefly, optical linescans were generated by moving the handheld probe to a set of discrete positions on the breast surface in 10 mm steps (Figure 2a). Tumor locations were known a priori from mammography, ultrasound, and palpation. Absorption and reduced scattering spectra were measured at each grid location (Figure 2b). A complete measurement of tissue absorption and reduced scattering spectra required approximately 25 seconds at each linescan location. Linescans were repeated twice at each grid location to evaluate placement variations. The fraction of tumor to normal tissue sampled by the light depended upon the tissue optical properties and the lesion depth.
Figure 2.
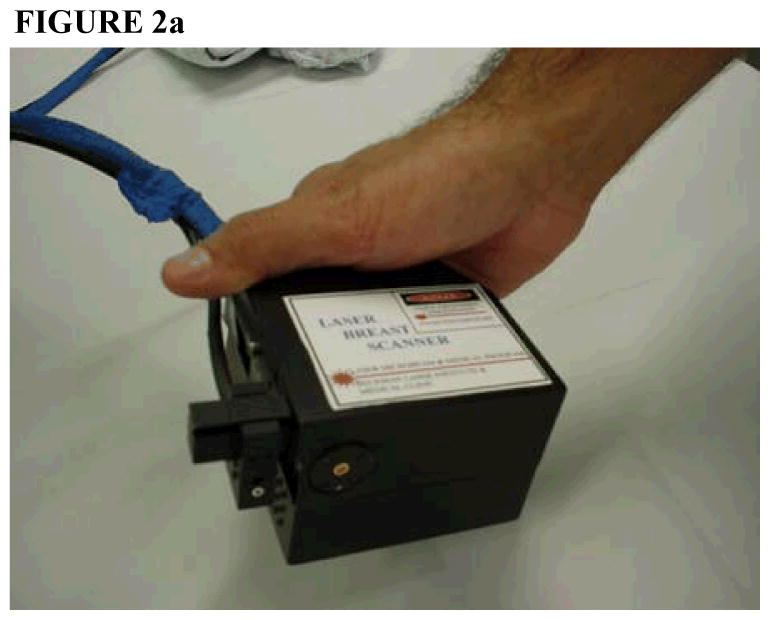

(a) Handheld probe from Laser Breast Scanner placed in contact with the breast during data acquisition. (b) Measurement setup. Points across linescan indicate positions measured.
D. Patient Characteristics
All subjects were informed and provided written informed consent to participate in the studies under a protocol approved by the Internal Review Board of the University of California at Irvine (#95-563 and #02-2306). Ultrasound and surgical pathology reports were utilized to determine type, localization, and tumor lesion extent. In this pilot study patients ranged in age from 32-57 years, 6 pre- and 6 post-menopausal, with pathologically confirmed diagnosis of invasive ductal carcinoma with one patient diagnosed with adenocarcinoma with lobular features.
3. Results and Discussion
A. Breast tissue spectra
Typical NIR diffuse optical spectra of normal and tumor-containing tissues are provided for a Patient 30, a 45-year old pre-menopausal patient with a 29 mm invasive ductal carcinoma in the right breast.
In Figure 3 we show representative spectra for the measured wavelength dependence of scattering and absorption from 650 to 990 nm. These spectra correspond to a single spatial location over the tumor, and the equivalent tissue region on the contra lateral breast which is considered normal, having no known lesion. Repeat measurements over the years of data acquisition have shown that the spectral shape of tumor and normal tissue is well conserved. Variation in the magnitude of the absorption values due to probe handling is on the order of 3-5%. [32] The wavelength dependence of the tissue scattering (i.e., the scatter power, SP) differs substantially between tumor and normal tissue suggesting differences in the density and size of scattering centers between tumor and normal tissue regions (Figure 2a).[32, 35, 36]
Figure 3.

Representative tumor spectra from Patient 30 at one position on tumor-containing breast; normal spectra from equivalent position on contra lateral breast. (a) Wavelength dependence of scattering for tumor and normal tissues (b) Absorption spectrum for tumor and normal tissues.
The measured NIR spectra demonstrate distinctive differences between tumor and normal tissues. Briefly, the spectra over tumor-containing tissue exhibits higher overall absorption along with notable spectral differences in the region above 900 nm. The distinctive peak in the normal absorption spectrum at 930 nm is representative of the vibrational overtones of lipid C-H bonds. Higher lipid absorption is typically seen in normal and postmenopausal breast tissue as compared to tumor-containing breast tissue and pre-menopausal breast tissue, respectively. This prominent lipid peak results from the higher concentration of bulk lipid in normal adipose tissues relative to tumor tissues.[32]
By applying the results of the four component basis spectra fit we determined concentrations for these components, and we calculated the Tissue Optical Index (TOI), which has been discussed in a previous manuscript in this journal[34]. Table 1.
Table 1.
Patient Information. Table outlining patient history and lesion information as found in clinical reports. DC for Ductal Carcinoma, AC for Adenocacinoma, L.F for Lobular Features, and L.N.M for Lymph Node Metastasis. Size given for longest dimension of lesion. Pre- and Post- indicate menopausal status. STC and TOI given for maximum value for on tumor side and contra lateral normal breast side.
| Age (years) | Menopausal Status | Tumor classification | Size (mm) | STC Tumor | STC Normal | TOI Tumor | TOI Normal |
|---|---|---|---|---|---|---|---|
| 47 | PRE | DC | 24 | 120.1 | 15.0 | 3.2 | 1.2 |
| 38 | PRE | DC | 24 | 100.2 | 9.7 | 4.9 | 1.4 |
| 50 | POST | AC with L.F | 54 | 216.9 | 4.4 | 6.2 | 0.6 |
| 32 | PRE | DC | 29 | 422.9 | 51.5 | 9.1 | 3.9 |
| 57 | POST | DC w/ L.N.M | 32 | 115.5 | 20.0 | 1.2 | 0.5 |
| 47 | POST | DC | 17 | 609.3 | 8.4 | 20.0 | 1.1 |
| 45 | PRE | DC | 29 | 162.5 | 7.8 | 20.5 | 1.0 |
| 44 | PRE | DC | 16 | 62.7 | 12.9 | 12.0 | 4.0 |
| 49 | POST | DC | 70 | 148.3 | 9.3 | 3.4 | 0.8 |
| 41 | PRE | DC | 40 | 86.1 | 4.2 | 14.4 | 1.8 |
| 53 | POST | DC | 24 | 132.3 | 6.3 | 10.2 | 4.5 |
| 57 | POST | DC | 31 | 135.2 | 4.1 | 4.5 | 0.6 |
| Equation 1 |
Briefly the TOI is a contrast function empirically designed using the traditional components (recovered concentrations of deoxyhemoglobin, water, and bulk lipids) to accentuate the differences between tumor and normal tissue. While the TOI has been shown to identify some types of tumors, the TOI index is not highly specific. In fact for our set of 12 patients the TOI Index showed a sensitivity of 75% and specificity of 75% based on a threshold of 3.5 that gives three false positives and three false negatives. This makes differential diagnosis solely based on the four traditional components problematic. Thus, using this approach, we had no unique “marker” or “signature” of cancer.
B. Double differential method
In the double-differential method we want to determine if there are other spectral differences that cannot be accounted for by the different amounts of the four basis components. We first calculate the average spectrum of the normal breast. Then we calculate the differences between this average spectrum and the spectrum at each location (including the normal breast). If the only components present are the ones included in the four basis spectra, then the difference spectrum (at each location) could be completely fitted by the using these four components. The coefficient of the fit will provide us with the different amounts of the four components at each location (the same as for the TOI described in the previous paragraph). However, if the fit is not perfect, the residual of the fit (if highly correlated) will provide the additional spectra which are not included in the four basis components. This residual is the Specific Tumor Component (STC).
The double-differential method has two major advantages over the conventional spectroscopic modeling approach. Firstly, the method uses each patient as their own control, so that variations in the “known” extinction spectra are effectively cancelled out. Thus the double-differential method is insensitive to intra-subject variations that arise due to the four component spectroscopic model. Secondly, the method accounts for concentration changes within subjects between normal and tumor tissue if the only differences are in the abundance of the four components. The residual spectrum for different locations of the unaffected breast should essentially be a flat line with values close to zero. If the tumor differs from normal tissues only in concentration changes of the four components, again the residual spectrum should be essentially zero. However, if spectral components are not accounted for in the four component fit, they should appear only in the tumor regions.
C. Double differential method applied to breast spectra
Here we outline the double-differential method applied to Patient 30, the same patient presented in Figure 3. In Figure 4a we show residual spectra for all of the positions on the normal breast. In Figure 4b we show residual spectra over a tumor containing position and positions over normal tissue surrounding the lesion in the tumor-containing breast.
Figure 4.


(a) STC spectra of all positions on normal contra lateral breast tissue for Patient 30. (b) STC spectra over tumor region and surrounding normal tissue on both sides along the linescan for Patient 30.
As stated earlier, we have two internal controls, contra lateral normal breast tissue and the normal breast tissue surrounding the lesion on the tumor containing breast. Note that all of the residual spectra over normal breast tissue are essentially featureless and provide random values around zero. This control is important in that it proves that variations in normal breast tissue are due only to the natural compositional differences from oxyhemoglobin, deoxyhemoglobin, water and bulk lipids.
D. STC spectra in 12 cancer patients
In Figure 5, we show the STC spectra for 12 cancer patients of this pilot study at the location displaying the largest variation. These residual spectra have small amplitudes (about 1% of original spectra). Clearly, the STC spectra are highly reproducible across all patients in this pilot study. There are patient dependent variations in several wavelength regions (Figure 5), however all tumor STC spectra display a similar spectral shape. Figure 6 displays a comparison of the average of the 12 tumor spectra presented in Figure 5, along with average of normal spectra obtained from the equivalent position on the unaffected breast for each patient. From Figure 6 it is clear that these residual spectra are not random, unlike the residuals for the normal breast tissue which are featureless.
Figure 5.

STC spectra for 12 patients at the position exhibiting the largest variation in comparison to surrounding normal tissue on tumor-containing breast.
Figure 6.

Average STC spectra for 12 patients for tumor at the location exhibiting the largest variation in comparison to surrounding normal tissue on tumor-containing breast, and for normal tissue at the equivalent position on normal contra lateral breast. Standard error of mean bars placed every 20 nm indicate STC spectral variation in the population. Regions where systematic differences have been observed are labeled as Region 1 (650-665nm), Region 2 (730-800nm), Region 3 (875-930nm), Region 4 (930-960nm), and Region 5 (980-1000nm).
From inspection of the average STC spectra, we find there are roughly 5 spectral regions where systematic differences are observed. We have labeled these to be Region 1: 650-665nm; Region 2: 730-800nm; Region 3: 875-930nm; Region 4: 930-960nm; and Region 5: 980-990nm. (Figure 6). To quantify the amount of STC spectra, which should indicate the amount of biomarker, we calculate the local residual variance for each spectral region, defined by:
| Equation 2 |
The local variance, Lk is a function of position on the breast given by x and y coordinates. The index k indicates a given spectral region and Nk indicates the total number of wavelengths in a particular region. STCi(λi,x,y) is the value of the STC spectra at a given wavelength. The STC index is the sum of all local variance Lk. Across the 12 patients in this pilot study, the STC index displays the maximum value over the tumor regions. This STC index value can be significantly greater than the value over the surrounding normal tissue as well as the normal contra lateral breast tissue (Table 1).
For this pilot study of 12 patients we were able to obtain 100% sensitivity and 100% specificity using the STC index. We set the threshold above 51.5 which separates the two groups. We emphasize that these sensitivity and specificity values are only provided for general reference. Data on a larger subject pool will be reported in another manuscript, thereby providing more significant values. We note that the double-differential method assumes that normal and diseased tissues coexist in the same patient. Furthermore, this method it is not required that a priori knowledge of the lesion location be available.
E. Origins of STC
We are investigating the biochemical/physical origin of the STC spectral signature, which will be the subject of a future manuscript. We believe Region 1 (650-665nm) is mainly affected by the changes in hemoglobin absorption. Perhaps there may be other types of hemoglobins or breakdown products in tumors. With regards to Region 2 (730-800nm), we see a distinct negative peak in the STC spectra. According to the definition of STC, a negative peak indicates absence of a component or a broadening of the NIR band. Changes in this region may be indicative of lipid metabolism changes, as lipids absorb in this region (Figure 1). In Region 3 (875-930nm) and Region 4 (930-960nm), we observe a negative peak immediately followed by a positive peak. This may be indicative of a spectral shift toward longer wavelengths. This is also the spectral region in which lipids have characteristic absorption spectra (Figure 1). Thus if there are differences in lipid composition in the tumor with respect to the normal tissue, this spectral region is likely to be affected. In Region 5 (980-1000nm) we only have a few points available. However we do observe changes which may be due to differences in the O-H overtones. In this region there are two possible candidates: the O-H of water and lipid oxidation products.
4. Conclusion
We have developed a double-differential method to analyze the near infrared absorption spectra of breast tumors. In this method we consider only the spectral differences between normal and diseased tissue by fitting the difference spectra using the basis components spectra and then analyzing the residuals of this fit. This differential approach can be performed by comparison of regions of normal and tumor breast tissue. With this method we show intrinsic spectroscopic markers of breast tumors in the NIR. These are unique signatures related to the biochemical/physical properties of each type of lesion, as the changes in natural tissue components (oxyhemoglobin, deoxyhemoglobin, water and bulk lipid) as well as the individual physiological variation have already been accounted for. Furthermore, these spectral signatures are biomarkers revealing characteristic absorption bands in the lipid region of 760 and 930nm region that were unnoticed before. The O-H overtone band in the 980nm region also shows distinct variations in the tumor region compared to the normal breast. By quantifying this information, we constructed the STC index which gives 100% sensitivity and 100% specificity for lesion identification for the 12 patients investigated and has the potential to distinguish tumors on the basis of the lipid composition and /or bound water or lipid oxidation products.
In this paper our focus was to describe the discovery of an intrinsic NIR spectroscopic marker of breast cancer. While here we only provide a description of the double-differential method, in a future manuscript we will describe the mathematical operations for obtaining the STC residual spectra beginning with scatter corrected absorption spectra of breast tissue obtained non-invasively using the SSFDPM method. In the future we will also discuss the difference between the residual spectra for benign and malignant lesions, opening up a new approach for differential diagnosis using optical methods. While this discovery was based on a pilot study of 12 cancer patients, we are analyzing STC residual spectra for a larger population, and comparing subjects who either have lesions which are malignant or benign to normal, having no known lesion.
Acknowledgments
This work was made possible by the NIH NCRR biomedical technology center, XPhoton migration grant, the Laser Microbeam and Medical Program (LAMMP, P41RR01192), the NCI network for translational research in optical imaging (U54CA105480) and the California Breast Cancer Research Program. Beckman Laser Institute programmatic support is provided by the AFOSR and the Beckman Foundation. The authors wish to thank Montana Compton, Natasha Shah, Tran Du, Debbi Gordon, and Amanda F. Durkin for their assistance as well as the patients who generously volunteered for these studies.
References
- 1.Wilson BC, Patterson MS, Flock ST, Wyman DR. Tissue optical properties in relation to light propagation models and in vivo dosimetry. B Chance. 1988:25–42. [Google Scholar]
- 2.Ertefai S, Profio AE. Spectral transmittance and contrast in breast diaphanography. Medical Physics. 1985;12:393–400. doi: 10.1118/1.595701. [DOI] [PubMed] [Google Scholar]
- 3.Quaresima V, Matcher SJ, Ferrari M. Identification and quantification of intrinsic optical contrast for near-infrared mammography. Photochemistry and Photobiology. 1998;67:4–14. [PubMed] [Google Scholar]
- 4.Patterson MS, Chance B, Wilson BC. Time resolved reflectance and transmittance for the non-invasive measurement of tissue optical properties. Applied Optics. 1989;28:2331–2336. doi: 10.1364/AO.28.002331. [DOI] [PubMed] [Google Scholar]
- 5.Patterson MS, Moulton JD, Wilson BC, Berndt KW, Lakowicz JR. Frequency-domain reflectance for the determination of the scattering and absorption properties of tissue. Applied Optics. 1991;30:4474–4476. doi: 10.1364/AO.30.004474. [DOI] [PubMed] [Google Scholar]
- 6.Fishkin JB, Gratton E. Propagation of photon-density waves in strongly scattering media containing an absorbing semi-infinite plane bounded by a straight edge. Journal of the Optical Society of America A (Optics and Image Science) 1993;10:127–140. doi: 10.1364/josaa.10.000127. [DOI] [PubMed] [Google Scholar]
- 7.Cerussi AE, Jakubowski D, Shah N, Bevilacqua F, Lanning R, Berger AJ, Hsiang D, Butler J, Holcombe RF, Tromberg BJ. Spectroscopy enhances the information content of optical mammography. J Biomed Opt. 2002;7:60–71. doi: 10.1117/1.1427050. [DOI] [PubMed] [Google Scholar]
- 8.Tromberg BJ, Shah N, Lanning R, Cerussi A, Espinoza J, Pham T, Svaasand L, Butler J. Non-invasive in vivo characterization of breast tumors using photon migration spectroscopy. Neoplasia. 2000;2:26–40. doi: 10.1038/sj.neo.7900082. [DOI] [PMC free article] [PubMed] [Google Scholar]
- 9.Cubeddu R, D'Andrea C, Pifferi A, Taroni P, Torricelli A, Valentini G. Effects of the menstrual cycle on the red and near-infrared optical properties of the human breast. Photochemistry and Photobiology. 2000;72:383–391. [PubMed] [Google Scholar]
- 10.Simick MK, Jong R, Wilson B, Lilge L. Non-ionizing near-infrared radiation transillumination spectroscopy for breast tissue density and assessment of breast cancer risk. J Biomed Opt. 2004;9:794–803. doi: 10.1117/1.1758269. [DOI] [PubMed] [Google Scholar]
- 11.Durduran T, Choe R, Culver JP, Zubkov L, Holboke MJ, Giammarco J, Chance B, Yodh AG. Bulk optical properties of healthy female breast tissue. Phys Med Biol. 2002;47:2847–2861. doi: 10.1088/0031-9155/47/16/302. [DOI] [PubMed] [Google Scholar]
- 12.Pogue BW, Jiang S, Dehghani H, Kogel C, Soho S, Srinivasan S, Song X, Tosteson TD, Poplack SP, Paulsen KD. Characterization of hemoglobin, water, and nir scattering in breast tissue: Analysis of intersubject variability and menstrual cycle changes. J Biomed Opt. 2004;9:541–552. doi: 10.1117/1.1691028. [DOI] [PubMed] [Google Scholar]
- 13.Fantini S, Walker SA, Franceschini MA, Kaschke M, Schlag PM, Moesta KT. Assessment of the size, position, and optical properties of breast tumors in vivo by noninvasive optical methods. Applied Optics. 1998;37:1982–1989. doi: 10.1364/ao.37.001982. [DOI] [PubMed] [Google Scholar]
- 14.Franceschini MA, Moesta KT, Fantini S, Gaida G, Gratton E, Jess H, Mantulin WW, Seeber M, Schlag PM, Kaschke M. Frequency-domain techniques enhance optical mammography: Initial clinical results. Proceedings of the National Academy of Sciences of the United States of America. 1997;94:6468–6473. doi: 10.1073/pnas.94.12.6468. [DOI] [PMC free article] [PubMed] [Google Scholar]
- 15.Tromberg BJ, Coquoz O, Fishkin JB, Phan T, Anderson ER, Butler J, Cahn M, Gross JD, Venugopalan V, Pham D. Non-invasive measurements of breast tissue optical properties using frequency-domain photon migration. Philosophical Transactions of the Royal Society of London B Biological Sciences. 1997;352:661–668. doi: 10.1098/rstb.1997.0047. [DOI] [PMC free article] [PubMed] [Google Scholar]
- 16.Ntziachristos V, Yodh AG, Schnall M, Chance B. Concurrent mri and diffuse optical tomography of breast after indocyanine green enhancement. Proceedings of the National Academy of Sciences of the United States of America. 2000;97:2767–2772. doi: 10.1073/pnas.040570597. [DOI] [PMC free article] [PubMed] [Google Scholar]
- 17.Pogue BW, Poplack SP, McBride TO, Wells WA, Osterman KS, Osterberg UL, Paulsen KD. Quantitative hemoglobin tomography with diffuse near-infrared spectroscopy: Pilot results in the breast. Radiology. 2001;218:261–266. doi: 10.1148/radiology.218.1.r01ja51261. [DOI] [PubMed] [Google Scholar]
- 18.Zhu Q, Huang M, Chen N, Zarfos K, Jagjivan B, Kane M, Hedge P, Kurtzman SH. Ultrasound-guided optical tomographic imaging of malignant and benign breast lesions: Initial clinical results of 19 cases. Neoplasia. 2003;5:379–388. doi: 10.1016/s1476-5586(03)80040-4. [DOI] [PMC free article] [PubMed] [Google Scholar]
- 19.Taroni P, Danesini G, Torricelli A, Pifferi A, Spinelli L, Cubeddu R. Clinical trial of time-resolved scanning optical mammography at 4 wavelengths between 683 and 975 nm. J Biomed Opt. 2004;9:464–473. doi: 10.1117/1.1695561. [DOI] [PubMed] [Google Scholar]
- 20.Yates T, Hebden JC, Gibson A, Everdell N, Arridge SR, Douek M. Optical tomography of the breast using a multi-channel time-resolved imager. Phys Med Biol. 2005;50:2503–2517. doi: 10.1088/0031-9155/50/11/005. [DOI] [PubMed] [Google Scholar]
- 21.Jakubowski DB, Cerussi AE, Bevilacqua F, Shah N, Hsiang D, Butler J, Tromberg BJ. Monitoring neoadjuvant chemotherapy in breast cancer using quantitative diffuse optical spectroscopy: A case study. J Biomed Opt. 2004;9:230–238. doi: 10.1117/1.1629681. [DOI] [PubMed] [Google Scholar]
- 22.Shah N, Gibbs J, Wolverton D, Cerussi A, Hylton N, Tromberg BJ. Combined diffuse optical spectroscopy and contrast-enhanced magnetic resonance imaging for monitoring breast cancer neoadjuvant chemotherapy: A case study. J Biomed Opt. 2005;10:51503. doi: 10.1117/1.2070147. [DOI] [PubMed] [Google Scholar]
- 23.Zhu Q, Kurtzma SH, Hegde P, Tannenbaum S, Kane M, Huang M, Chen NG, Jagjivan B, Zarfos K. Utilizing optical tomography with ultrasound localization to image heterogeneous hemoglobin distribution in large breast cancers. Neoplasia. 2005;7:263–270. doi: 10.1593/neo.04526. [DOI] [PMC free article] [PubMed] [Google Scholar]
- 24.Hawrysz DJ, Sevick-Muraca EM. Developments toward diagnostic breast cancer imaging using near-infrared optical measurements and fluorescent contrast agents. Neoplasia. 2000;2:388–417. doi: 10.1038/sj.neo.7900118. [DOI] [PMC free article] [PubMed] [Google Scholar]
- 25.Djuric Z, Visscher DW, Heilbrun LK, Chen G, Atkins M, Covington CY. Influence of lactation history on breast nipple aspirate fluid yields and fluid composition. Breast J. 2005;11:92–99. doi: 10.1111/j.1075-122X.2005.21553.x. [DOI] [PubMed] [Google Scholar]
- 26.Chow LW, Cheng CW, Wong JL, Toi M. Serum lipid profiles in patients receiving endocrine treatment for breast cancer--the results from the celecoxib anti-aromatase neoadjuvant (caan) trial. Biomed Pharmacother. 2005;59 2:S302–305. doi: 10.1016/s0753-3322(05)80051-4. [DOI] [PubMed] [Google Scholar]
- 27.Katz-Brull R, Lavin PT, Lenkinski RE. Clinical utility of proton magnetic resonance spectroscopy in characterizing breast lesions. J Natl Cancer Inst. 2002;94:1197–1203. doi: 10.1093/jnci/94.16.1197. [DOI] [PubMed] [Google Scholar]
- 28.Kleinfeld AM, Okada C. Free fatty acid release from human breast cancer tissue inhibits cytotoxic t-lymphocyte-mediated killing. J Lipid Res. 2005;46:1983–1990. doi: 10.1194/jlr.M500151-JLR200. [DOI] [PubMed] [Google Scholar]
- 29.Tromberg BJ, Cerussi A, Shah N, Compton M, Durkin A, Hsiang D, Butler J, Mehta R. Imaging in breast cancer: Diffuse optics in breast cancer: Detecting tumors in pre-menopausal women and monitoring neoadjuvant chemotherapy. Breast Cancer Res. 2005;7:279–285. doi: 10.1186/bcr1358. [DOI] [PMC free article] [PubMed] [Google Scholar]
- 30.Pham TH, Coquoz O, Fishkin JB, Anderson E, Tromberg BJ. Broad bandwidth frequency domain instrument for quantitative tissue optical spectroscopy. Review of Scientific Instruments. 2000;71:2500–2513. [Google Scholar]
- 31.Bevilacqua F, Berger AJ, Cerussi AE, Jakubowski D, Tromberg BJ. Broadband absorption spectroscopy in turbid media by combined frequency-domain and steady-state methods. Applied Optics. 2000;39:6498–6507. doi: 10.1364/ao.39.006498. [DOI] [PubMed] [Google Scholar]
- 32.Cerussi A, Shah N, Hsiang D, Compton M, Tromberg B. In vivo absorption, scattering and physiologic properties of 58 malignant breast tumors determined by broadband diffuse optical spectroscopy. Journal of Biomedical Optics. 2006 doi: 10.1117/1.2337546. in press. [DOI] [PubMed] [Google Scholar]
- 33.Hsiang D, Shah N, Yu H, Su MY, Cerussi A, Butler J, Baick C, Mehta R, Nalcioglu O, Tromberg B. Coregistration of dynamic contrast enhanced mri and broadband diffuse optical spectroscopy for characterizing breast cancer. Technol Cancer Res Treat. 2005;4:549–558. doi: 10.1177/153303460500400508. [DOI] [PubMed] [Google Scholar]
- 34.Shah N, Cerussi AE, Jakubowski D, Hsiang D, Butler J, Tromberg BJ. The role of diffuse optical spectroscopy in the clinical management of breast cancer. Dis Markers. 2003;19:95–105. doi: 10.1155/2004/460797. [DOI] [PMC free article] [PubMed] [Google Scholar]
- 35.Mourant JR, Fuselier T, Boyer J, Johnson TM, Bigio IJ. Predictions and measurements of scattering and absorption over broad wavelength ranges in tissue phantoms. Applied Optics. 1997;36:949–957. doi: 10.1364/ao.36.000949. [DOI] [PubMed] [Google Scholar]
- 36.Nilsson AMK, Sturesson C, Liu DL, Andersson-Engels S. Changes in spectral shape of tissue optical properties in conjunction with laser-induced thermotherapy. Applied Optics. 1998;37:1256–1267. doi: 10.1364/ao.37.001256. [DOI] [PubMed] [Google Scholar]