Abstract
A chimera is a genetic composite containing a unique mix of cells derived from more than one zygote. This mouse model allows one to learn how cells of contrasting genotype functionally interact in vivo. Here we investigate the effect that different proportions of prestin-containing outer hair cells (OHC) have on cochlear amplification. In order to address this issue, we developed a prestin chimeric mouse in which both ROSA26 wildtype (WT) and prestin knockout (KO) genotypes are present in a single cochlea. The WT ROSA26 mice express a cell marker, allowing one to identify cells originating from the WT genome. Examination of cochlear tissue indicated that prestin chimeric mice demonstrate a mosaic in which mutant and normal OHCs interleave along the cochlear partition, similar to all other chimeric mouse models. The anatomical distribution of prestin-containing OHCs was compared with physiological data including thresholds and tuning curves for the compound action potential (CAP) recorded in anesthetized mice. Analysis of these measures did not reveal mixed phenotypes in which the distribution of prestin-containing OHCs impacted sensitivity and frequency selectivity to different degrees. However, by reducing the number of prestin-containing OHCs, phenotypes intermediate between WT and KO response patterns were obtained. Accordingly, we demonstrate a proportional reduction in sensitivity and in the tip length of CAP tuning curves as the number of OHCs derived from the KO genome increases, i.e., genotype ratio and phenotype are closely related.
Keywords: Auditory, Cochlea, Hair Cell, Hearing Loss, knockout mice, Motility, Phenotype
Introduction
The sensitivity and frequency selectivity of the auditory system is established in the cochlea and specifically at the mechanical level, which is apparently controlled by the outer hair cells (OHC). This knowledge is based on results showing that removal of OHCs results in threshold shift and loss of tuning (Ryan and Dallos, 1975; Dallos and Harris, 1978). This phenotype is also observed in mice lacking the prestin gene (Liberman et al., 2002; Cheatham et al., 2004) whose protein product is the OHC motor protein (Zheng et al., 2000), which is normally localized to the OHC's lateral membrane (Zheng et al., 2003). In order to further study cochlear amplification, the process underlying sensitivity and frequency selectivity has been characterized in various prestin mouse models. To date this includes the prestin knockout (KO) mouse, as well as a knockin (KI) with mutated prestin that successfully targets the plasma membrane. All reports indicate that prestin is required for normal cochlear function. When prestin is removed (Liberman et al., 2002; Cheatham et al., 2004) or when it is not functioning properly (Dallos et al., 2008), there is a substantial loss in cochlear sensitivity and an absence of tuning, two of the hallmarks of cochlear feedback amplification. Unfortunately, none of the currently available mouse models is adequate to fully address the question of the functional significance of OHC electromotility because OHCs in KO mice are much shorter and less stiff than in wildtype controls and because both KI and KO models suffer OHC death.
In this report, we describe a chimera analysis of prestin function. A chimera is a genetic composite. It contains a unique mix of cells derived from more than one zygote. Although first reported in the early 1960s (Tarkowski, 1961; Mintz, 1962), current interest relates to the availability of transgenic cell-marker strains (Friedrich and Soriano, 1991; Zambrowicz et al., 1997) and the profusion of new mouse mutants (Brown et al., 2008). This approach is important because it allows one to learn how cells of contrasting genotype functionally interact in vivo in a single cochlea. Because of differences in the specific contribution of each genome to a given tissue, the number of cells originating from either genome varies from animal to animal. As a result, each chimera is a unique individual where the distribution of the two cell populations can vary between 0% and 100% (Mullen and Whitten, 1971; Falconer and Avery, 1978). It is, therefore, possible to document the effect of differing numbers of prestin-containing OHCs on cochlear amplification and to determine dose relationships. In order to obtain this information, we created prestin chimeric mice by combining ROSA26 wildtype (WT) embryos with prestin KO embryos, allowing us to study prestin's contribution to cochlear amplification at the cellular level. Because ROSA26 mice contain a cell marker, it is possible to document the distribution of normal and mutant OHCs in a single cochlea and to correlate this distribution with cochlear physiology.
Materials and Methods
Generation of chimeras and controls
Separate breeding colonies were established for prestin KO and ROSA26 WT mice. Prestin mutant mice were obtained from the Mouse Mutant Regional Resource Center in North Carolina and displayed a KO phenotype (Anderson et al., unpublished observations). The ROSA26 mice are essentially C57BL6 while the prestin KOs are on a mixed 129/BL6 genetic background.
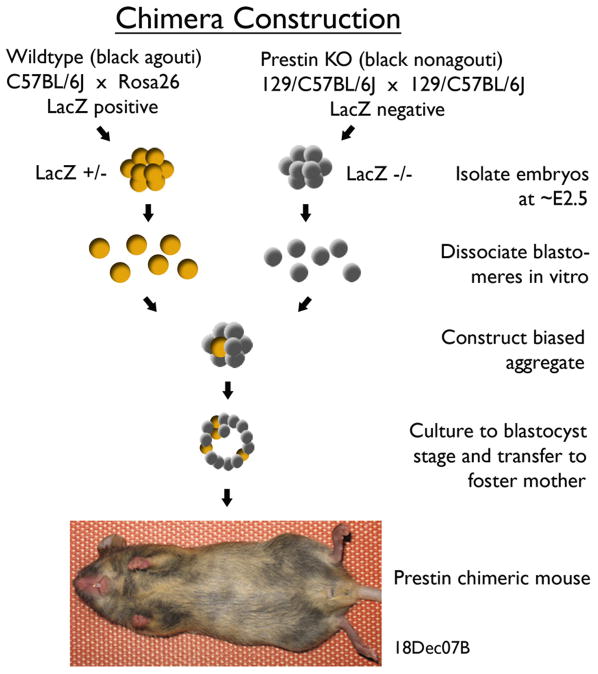
Because chimeras cannot be produced by breeding alone, the procedure used to construct a prestin chimera is shown in Fig. 1. The prestin KO was black nonagouti or for simplicity black in color. The other parental strain was a ROSA26 heterozygote (het), i.e., a ROSA26 homozygote was originally crossed with a C57BL6 mouse. This mouse was WT at the prestin locus and black agouti or brown in coat color. It carries the cell marker, β-galactosidase, which is an enzyme produced by the lacZ transgene. These 2 parental strains were used to form embryo groups that differ in the expression of prestin and the cell marker. In other words, the WT mouse was brown and expressed both prestin and lacZ genes; the KO was black and negative for these two genes. Embryos were harvested from each group at E2.5 when cells are totipotent (Kelly, 1977). Eight-cell blastomeres were aggregated (Hogan et al., 1994) and cultured to the blastocyst stage. Composite or chimeric blastocysts were then transferred into a foster mother. In any given litter, chimeric pups were identified by their variegated or mottled coat color. Although nonchimeric mice served as controls, we also developed an additional control group by mating a homozygous ROSA26 male with a prestin KO female. These controls, as well as all of the chimeric mice, were hemizygous for the lacZ transgene.
Figure 1.
Construction of prestin chimeras. Parental strains with contrasting coat color were used to form two embryo groups differing in the expression of prestin and lacZ genes. After fusion of contrasting embryos, a chimeric blastocyst is transferred to a pseudopregnant female. Prestin chimeric mice are easily distinguished in any given litter by their variegated coat color.
Measurement of CAP thresholds and tuning curves
All procedures were approved by Northwestern's Institutional Animal Care and Use Committee, as well as by The National Institutes of Health. Gross cochlear potentials were acquired at the round window membrane using a silver wire ball electrode in anesthetized mice (80mg/kg Sodium Pentobarbital IP) between P27 and P44. Compound action potential (CAP) thresholds were obtained for a 10 μV N1/P1 criterion voltage. CAP tuning curves were acquired at 12 kHz using the simultaneous tone-on-tone masking technique (Dallos and Cheatham, 1976). For each individual tuning curve, the 12 kHz probe tone was adjusted in level to produce a 25 μV N1/P1 when presented in isolation. Masker level was then adjusted to produce a 3 dB decrease in this 12 kHz response. A full description of these methods appears elsewhere (Cheatham et al., 2004; Gao et al., 2007).
Histological processing
After euthanasia with an overdose of Euthasol (200 mg/kg), mice were cardiac perfused first with heparinized PBS and then with 4% paraformaldehyde. Cochleae were then harvested and post fixed for ∼2 hours at room temperature. Because the number and size of the β-galactosidase positive inclusions can be quite variable (Friedrich et al., 1993), we used our affinity purified, C-terminal prestin antibody (anti-prestin, 1:2000) (Matsuda et al., 2004) in combination with a secondary antibody, donkey anti-rabbit IgG-HRP (horseradish peroxidase, 1:200) (Jackson ImmunoResearch Laboratories, Bar Harbor ME) and subsequent reaction with diaminobenzidine (DAB Substrate Kit for Peroxidase, Vector Laboratories, Burlingame CA). Cochleae were stained, dehydrated, and plasticized at 60°C overnight using an Araldite 502/PolyBed 812 kit (Polysciences, Inc., Warrington PA). Excess resin and cochlear bone were removed before separating segments of the cochlear duct from the modiolus (Bohne and Harding, 1997) and mounting them on glass slides for observation using bright field, light microscopy. Because whole-mount tissue is thick, a single plane of focus did not suffice over the entire length of a given segment. Therefore, multiple images were captured, each at a different focal plane. These pictures were then combined using MicroSuite FIVE (Olympus Soft Imaging Solutions Corp., Lakewood CO) and its Extended Focal Imaging (EFI) module to create a single in-focus image. Adjacent fields of view were subsequently stitched together from base to apex using DoubleTake (Echo One, Frederikssund, Denmark). The final image of all concatenated pictures showed each row of OHCs in focus. After calculating cochlear length and dividing the tissue into 7% segments, cochleograms were constructed by plotting the average percent OHCs lacking prestin in each 7% segment along the basilar membrane. In mice that had very few OHCs containing prestin, there were usually some missing cells in the base of the cochlea similar to prestin KO mice (Wu et al., 2004). In this case, the percent OHCs lacking prestin included the unstained cells, as well as the number of missing OHCs. Because segmentation started in the base, the first segment plotted at 93% extended from the very end of the basilar membrane to a location 7% of the distance from the base of the cochlea. The decision to plot our results by aligning the data in each bin to the lowest margin rather than to its center was made in order to be consistent with the original data published for prestin KO mice (Wu et al., 2004). Five-micron radial sections were also cut from re-embedded short cochlear segments and viewed using bright-field, light microscopy.
The procedures for X-Gal histochemistry were similar to those used for the clock chimera (Low-Zeddies and Takahashi, 2001). After fixation, apical cochlear coils were dissected and stained at 37°C overnight with a solution containing 1mg/ml X-Gal (5-bromo-4-chloro-3-indolyl-β-D-galactopyranoside (Sigma-Aldrich, St. Louis MO) dissolved in dimethyl formamide), 5 mM K3Fe(CN)6 and 5 mM K4Fe(CN)6 in wash buffer. After rinsing, the tissue was mounted with Fluoromount-G (Southern Biotech, Birmingham AL) on glass slides and viewed as a whole mount with light microscopy.
Results
Data from control mice
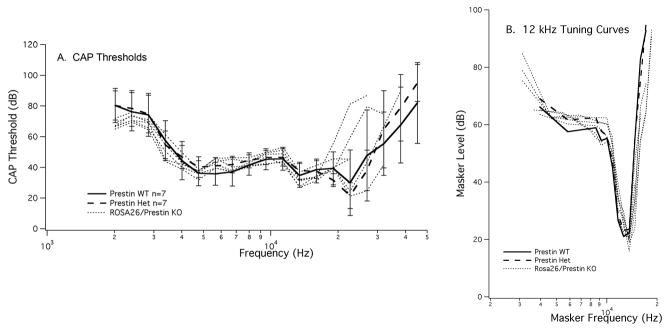
Before beginning this series of experiments, we determined that the parental strain carrying the cell marker had normal cochlear sensitivity. This result indicates that the lacZ gene provides a developmentally neutral cell marker and that it does not influence the expression or the function of the prestin gene. As an additional control, we also mated mice from the two parental strains. The offspring are essentially prestin heterozygotes where the WT mouse is ROSA26 positive. Assuming that strain background is not a confounding factor, these ROSA26 WT/prestin KO controls would be expected to demonstrate WT-like sensitivity and tuning (Cheatham et al., 2005). Data in Fig. 2 indicate that this is the case. CAP thresholds on the left and CAP tuning curves on the right are both similar to the average WT/het physiology. This result is consistent with our previously published results on prestin heterozygotes where it was shown that near-normal levels of prestin protein are expressed in mice having only one copy of the prestin gene (Cheatham et al., 2005). Results in Fig. 2 also confirm that there is no negative outcome due to lacZ expression in cochlear hair cells or to strain background effects.
Figure 2.
Peripheral auditory physiology is normal in ROSA26/prestin heterozygous mice. Offspring obtained by mating a ROSA26 homozygote with a prestin KO mouse show normal CAP thresholds in panel A and CAP tuning curves in panel B. WT data are plotted with solid lines, prestin heterozygotes with dashed lines and ROSA26/prestin heterozygotes with dotted lines.
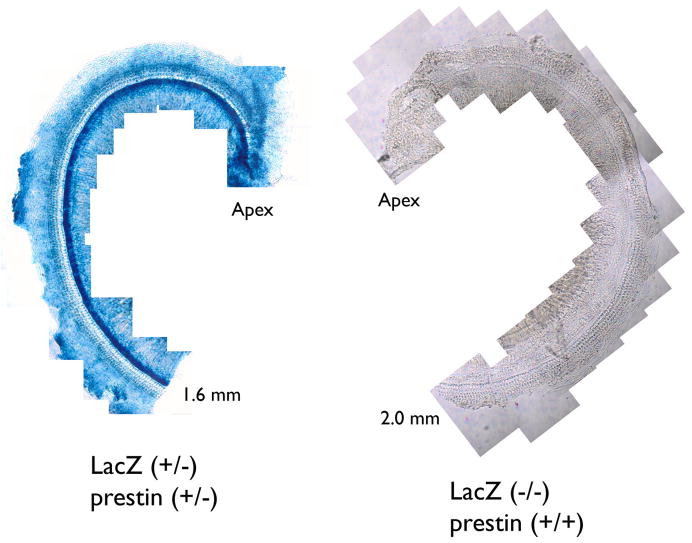
These ROSA26/prestin controls, as well as all of the chimeras, are heterozygous for the cell marker. In other words, they contain β-galactosidase, an enzyme produced by the lacZ gene, which turns its substrate, X-Gal, blue. In Fig. 3, the whole mount on the left displays the apical turn of a ROSA26 positive cochlea. All cells display the blue reaction product, while the negative control on the right shows no stain.
Figure 3.
LacZ staining in the organ of Corti. An apical coil is stained with the chromogenic substrate X-Gal in a ROSA26 positive mouse on the left and a negative control shown on the right at 25×. These mice were obtained by breeding a ROSA26 homozygote with a prestin KO mouse.
Data from chimeric mice
Of the 54 mice available, 7 were brown indicating WT, 31 were black indicating KO and 16 mice were mottled indicating contributions from both parental strains. It is of interest that 69% of the mice were male, which compares with clock chimeras where 72% were also male (Low-Zeddies and Takahashi, 2001). Early experiments (Tarkowski, 1961; Mullen and Whitten, 1971) revealed that ∼50% of experimental embryos are male/female, ∼25% are male and ∼25% are female. Because of the importance of the Y chromosome in determining sex, most of the sex chimeras (XX-XY) are phenotypically male. Hence, they should theoretically outnumber females by 3:1. Portraits were obtained on 46 of the 54 mice and ordered from black to brown, as shown in supplementary materials.
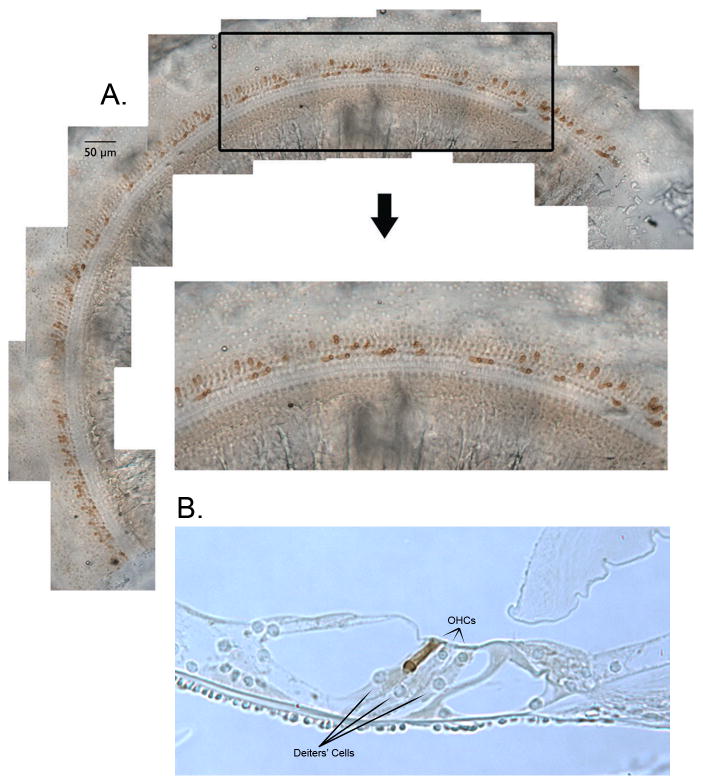
Anatomical data were obtained on 27 ears collected from 16 mice. The average basilar membrane length was 6.02+/-0.18mm (mean+/-one standard deviation) with each 7% segment covering 0.419+/-0.004mm. The distribution of prestin-containing outer hair cells is shown in Fig. 4A. These images were obtained from a mottled mouse with ∼23% of OHCs immuno-positive for prestin. In order to evaluate the distribution of prestin-containing cells, a segment located 2.8 to 4.3 mm from the base is displayed. The enlarged region indicates that there is no propensity for cells of similar genotype to group together, i.e., there were no large patches of prestin-containing OHCs alternating with OHCs lacking prestin. This observation is consistent with reports that early aggregation chimeras produce mosaics in all tissue examined to date (Dewey et al., 1976; Oster-Granite and Gearhart, 1981; Goldowitz, 1987, Wang et al., 2006; Du et al., 2007).
Figure 4.
Distribution of prestin-containing OHCs in a chimeric cochlea. A segment of stitched segments lying 2.8 and 4.3 mm from the base is enlarged to reveal the mosaic pattern of OHCs derived from ROSA26 WT and prestin KO embryos. Only OHCs from the ROSA26 positive parent stain with anti-prestin. A representative radial section of the organ of Corti in a chimeric mouse is provided in panel B for illustrative purposes. This 5-micron section was obtained from a mid-cochlear segment (∼3 mm from the helicotrema) at 20× to show increase in Deiters'-cell lengths associated with short, no prestin-containing OHCs. This particular chimera had 39% OHCs staining for prestin. The two shorter than normal OHCs were derived from the prestin KO parent; the longer OHC in row 3, from the ROSA26 WT parent.
We also obtained radial sections to better evaluate the architecture of the organ of Corti when stained and unstained cells occurred at the same location, as shown in Fig. 4B. While OHCs lacking prestin are shorter than WT (Liberman et al., 2002; Cheatham et al., 2007), Deiters' cells increase in length, preventing gross distortions in the anatomical relationships between cells in the organ. As a result, the reticular lamina remains relatively flat in this ear where, on average, 61% of the OHCs lack prestin. In fact, our examination of radial sections in several chimeric mice did not reveal any obvious distortions in the reticular lamina or in the overall architecture of the organ of Corti. It is possible, however, that the mechanical properties of the organ of Corti changed in response to an increase in Deiters'-cell length. Because there is no significant difference in length between OHCs in different rows (Keiler and Richter, 2001; Cheatham et al., unpublished observations), the changes in length shown in Fig. 4B cannot arise as a result of the particular row in which a given OHC finds itself. In addition, the length of the OHC in row 3 is consistent with that reported by Keiler and Richter (2001) indicating that WT OHCs do not adjust in the same way as Deiters' cells. In fact, the length of the WT cell in Fig. 4B is nearly identical to the lengths of OHCs in a nearby radial section where all OHCs were derived from the WT parent.
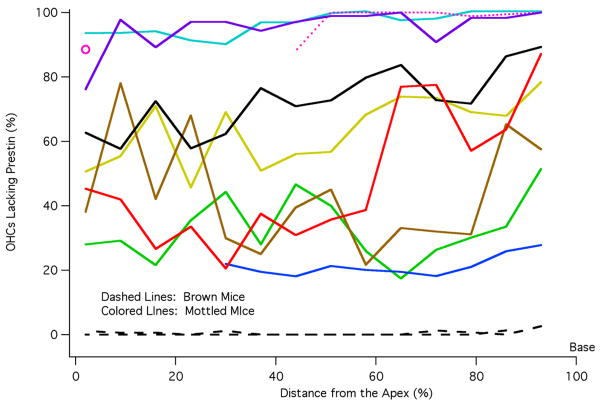
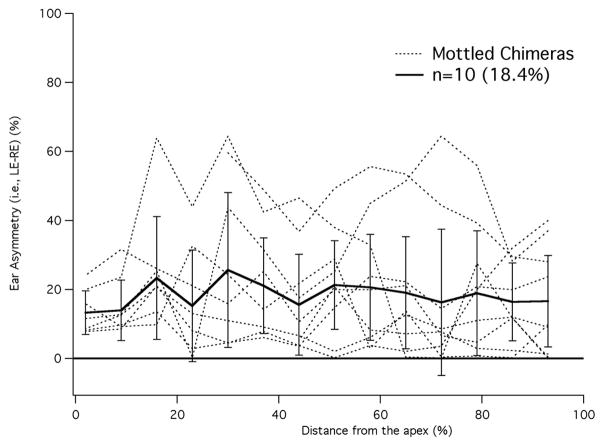
By counting the number of OHCs with and without prestin, cochleograms were constructed as shown in Fig. 5. In this figure, percent OHCs lacking prestin is plotted versus percent distance from the apex, i.e., the base of the cochlea is on the right. Data are included for two brown mice (dashed lines) that have virtually no unstained OHCs. In other words, all OHCs originated from the ROSA26 embryo and all contained prestin. Of the 31 black mice, none had stained cells. The data for black and brown mice indicate that tissue chimerism was not detected in any mouse having a single coat color. Mottled mice plotted with colored lines display a varied distribution of prestin-containing cells, which spans the range from all OHCs staining for prestin to all OHCs lacking prestin. The cochleogram plotted with dotted pink line indicates that tissue is missing in the apex. The isolated open circle provides the only apical data for this animal. Although absolute counts are not provided, they can be estimated since each 7% segment contained 170+/-8 OHCs, i.e., the average cochlea contained 2431+/-45 OHCs. Because prestin KO mice suffer OHC loss beginning at the base of the cochlea after P21 (Wu et al., 2004), we documented the number of missing OHCs in chimeric mice. In fact, the percent OHCs lacking prestin in Fig. 5 is composed of both unstained and missing cells since it is assumed that missing cells in the base very likely originated from the KO parent. This assumption is based on the observation that no missing cells were found in mice whose organs of Corti contained at least 40% prestin. Only when mice became more KO-like, did they show an increasing number of missing OHCs at the base of the cochlea. In other words, the chimeric approach is no cure for the OHC death problem in cells lacking prestin. We also evaluated the asymmetry between right and left ears in mottled mice as shown in Fig. 6. The percent difference between cochleograms for right and left ears is plotted vs. distance. Individual curves appear as dotted lines; mean and standard deviation as solid lines. On average, right and left ears differ by ∼18%. For comparison, asymmetry in brown mice was found to be less than 2%.
Figure 5.
Cochleograms. Percent OHCs lacking prestin is plotted as a function of distance from the apex of the cochlea. The average number of unstained/missing cells is computed for each 7% segment. Cochleograms for brown mice are plotted with dashed lines. Data for mottled mice are represented with solid, colored lines except for the one mouse plotted with pink dotted lines to indicate that data are missing in the apex. Although the data plotted represent the average percent of OHCs lacking prestin for all rows, it should be stated that there was only one instance where a statistically significant difference existed between rows of OHCs. This occurred in one mottled mouse and for only the most basal 7% section. The color code used for mottled mice is maintained in Figs. 7B, 8 and 9.
Figure 6.
Asymmetry in chimeric ears. The absolute difference between right and left ears is plotted in percent for chimeric mice. The mean difference and standard deviation are also appended and plotted with solid lines.
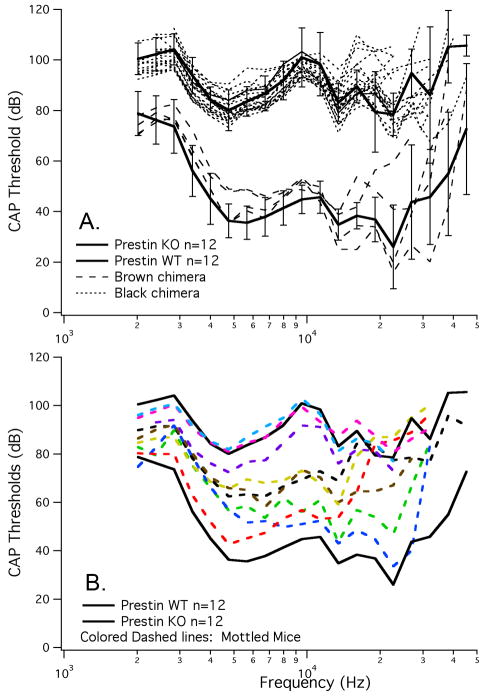
In order to evaluate the effect of reducing the number of prestin-containing cells, physiological data were obtained using a round-window electrode in anesthetized mice. In Fig. 7A, we show mean data from WT and KO mice plotted with standard deviations. Brown mice (dashed lines) have WT-like sensitivity and black mice (dotted lines) are similar to KOs in that they have an ∼50 dB threshold shift. These data indicate that a small number of either WT or mutant cells does not dominate the phenotype. Figure 7B provides mean WT and mean prestin KO CAP thresholds (solid black lines) along with results obtained in mottled mice and plotted as colored dashed lines. The range of change in sensitivity spans that encompassed by the two parental strains from near normal to near KO-like, such that sensitivity in mottled mice improved concomitant with an increase in the proportion of WT OHCs. Mottled mice with the worst sensitivity were found to contain less than 5% OHCs with prestin. Because these animals had a slightly mottled coat color, we inspected the untested ear and found a larger complement of prestin-staining cells; hence, their mottled appearance. The only condition where the physiological data were inconsistent with coat color was when the ears were asymmetrical and we recorded from the ear with the smallest number of prestin-containing OHCs.
Figure 7.
CAP thresholds for chimeric mice. Mice of a single coat color appeared as WT when brown (dashed lines) or KO (dotted lines) when black. For comparison, mean and standard deviations for WT and prestin KO mice are appended. CAP thresholds in mottled mice are provided in panel B. Animals with a variegated coat color (colored dashed lines) exhibited an intermediate phenotype that spanned the range between WT and KO sensitivities. The more brown in coat color the more WT in phenotype.
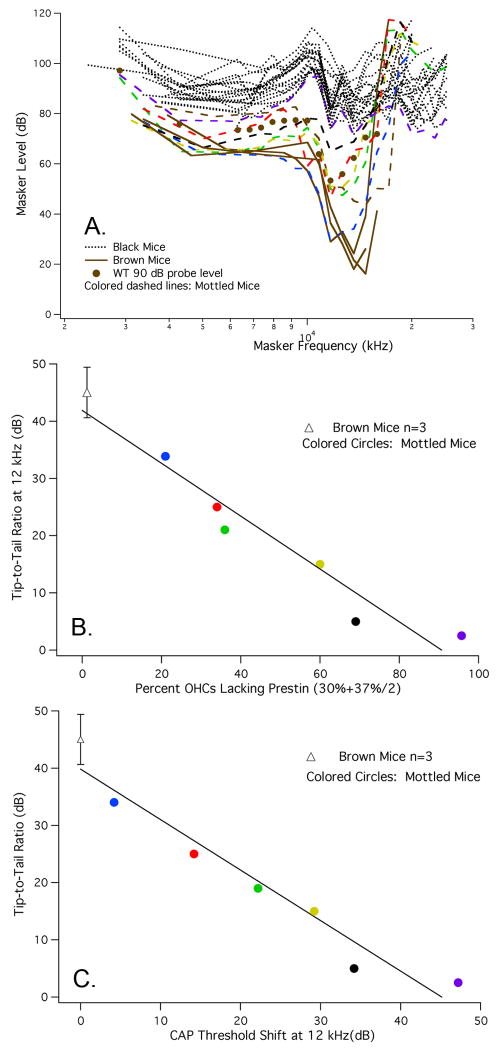
Tuning curves for the CAP were also recorded for a 12 kHz probe tone, as shown in Fig. 8A. Brown mice (solid lines) have normal frequency selectivity and normal tip-to-tail ratios, while the black mice (dotted lines) lack tuning. In contrast, the mottled mice plotted as colored dashed lines show near-normal tuning when probe levels are low, i.e., when they have WT-like sensitivity. However, as mice lose prestin and probe level increases, the tips of the curves move up and the tip-to-tail ratio decreases. For reference, data are appended as solid circles to show a WT tuning curve obtained for a 90 dB probe. This level is comparable to that used for prestin-KO mice (Cheatham et al., 2007). Although the tip-to-tail ratio is moderately reduced, WT mice continue to exhibit tuning even at high-probe levels (Dallos and Cheatham, 1976). In other words, loss of tuning in black mice is predominantly due to the absence of prestin-expressing cells and not simply due to increasing probe level.
Figure 8.
A. CAP tuning curves at 12 kHz in chimeric mice. Similar to the changes in threshold, CAP tuning curves at 12 kHz were WT like in brown mice (solid lines) and KO like in black mice (dotted lines). Mottled mice (colored dashed lines) exhibited a decreasing tip-to-tail ratio as the number of OHCs containing prestin decreased. The average probe level for brown mice was 54 dB, for black mice, 93 dB and for mottled mice 74 dB. B. For brown and mottled mice, the tip-to-tail ratio is plotted as a function of percent OHCs lacking prestin. This latter metric is computed over a distance located between 30 and 44% of the distance from the apex. Brown mice (open triangle) are represented by their mean and standard deviation, while data for mottled, chimeric mice are plotted individually as colored circles. C. In this panel, tip-to-tail ratio is plotted as a function of CAP threshold shift at 12 kHz for brown mice, represented by their mean and standard deviation, and for mottled mice plotted individually. It should be understood that a full data set was not collected on each mouse. This related to shipping difficulties such that some mice arrived when they were much older than is ideal for making round-window recordings. In addition, some mice displayed anatomical anomalies that prevented CAP recording and in other instances tissue was lost in the region coding for the 12 kHz probe. Hence, our inability to provide results for a larger number of mottled mice.
The relationship between tuning-curve shape and prestin expression is represented in Fig. 8B where tip-to-tail ratio is plotted as a function of the average percent of OHCs lacking prestin in the region lying 30% to 44% of the distance from the apex. Based on the mouse frequency-place map (Müller et al., 2005), the 12 kHz location is ∼33% from the apex, i.e., in the middle of the 30% segment, which is 30-37% of the distance from the apex. Because of the relatively high probe levels used for mottled mice, the average percent OHCs without prestin was computed for an extended region in the basal direction to account for the possibility that a larger number of single auditory nerve fibers were responding to the 12 kHz probe, i.e., the average number of OHCs lacking prestin was computed for two 7% segments: the one containing the 12 kHz place and the neighboring basal segment. Data from brown mice (open triangle) indicate that they have an average tip-to-tail ratio of 45 dB and only 1.2% of OHCs lack prestin. For mottled mice (colored circles), the ratio decreases as the number of OHCs lacking prestin increases. For example, a line fit to the data points indicates that a 50% reduction in prestin expression is associated with an ∼15 dB tip-tail ratio. The regression line also produces a 0 dB tip-to-tail ratio at ∼75% reduction in prestin-expressing OHCs. Tip-to-tail ratio is also plotted as a function of CAP threshold shift at 12 kHz in Fig. 8C. Again, tip length decreases as the sensitivity at probe frequency is reduced due to the loss of prestin-containing OHCs.
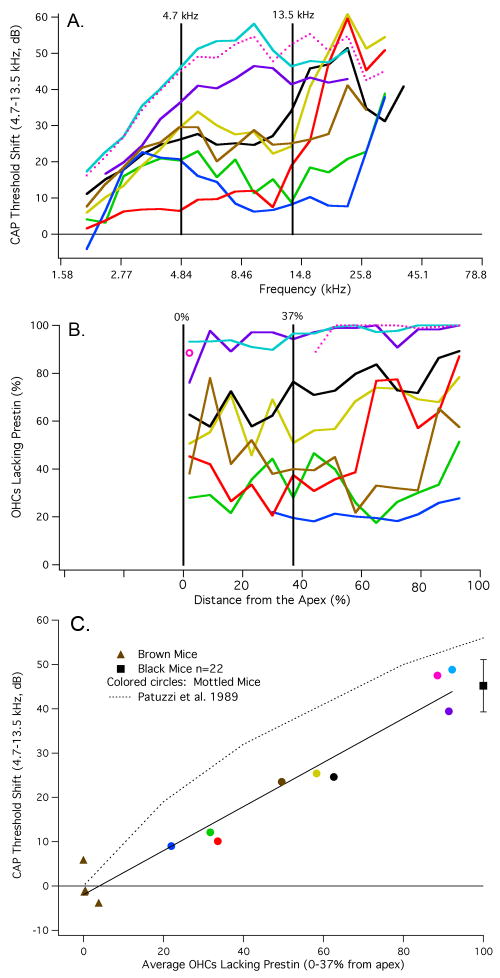
In Fig. 9, we plot CAP threshold shifts in panel A and cochleograms showing percent OHCs lacking prestin in panel B. The frequency/place map of Müller et al. (2005) was again used to determine the anatomical position of each stimulus frequency used to obtain CAP thresholds. Because the two data sets are now plotted on the same abscissa, one can better compare the change in sensitivity with the number of OHCs lacking prestin. In order to quantify this relationship, we computed the average threshold shift between 4.7 and 13.5 kHz and correlated this metric with the average number of OHCs lacking prestin at the locations associated with these frequencies. The frequency range was not extended to higher frequencies for two reasons. First, because variability in measured sensitivity at high frequencies can relate to several causes (anesthesia, temperature, age-related hearing loss, vulnerability) independent of prestin expression and second, because the threshold shifts and the percent OHCs lacking prestin are relatively flat in the apical part of the cochlea. Calculations for the region indicated by the vertical lines are shown in Fig. 9C. Data points represent the average threshold shift plotted against the average percent of OHCs lacking prestin for each individual mouse. As expected, brown mice (triangles) have very few cells without prestin and no threshold shift. In other words, they are WT like. Black mice (isolated square +/- one standard deviation) have a large threshold shift and all OHCs lack prestin. The colored circles represent chimeric mice with varying degrees of prestin staining and varying degrees of threshold shift. These results are best fit with a straight line. Also appended are Patuzzi et al.'s (Patuzzi et al., 1989, Fig. 3, dotted line) predictions of gain change (CAP threshold shift) associated with decrease in the cochlear microphonic produced by acoustic trauma. Their empirical estimate of this relationship implies that a 50% decrease in prestin should produce a 36 dB threshold shift. Model results of Neely and Kim (1986) indicate an even larger threshold shift, i.e., 56 dB when the negative damping component of their active hydrodynamic model is reduced by 50%. All data from mottled chimeras are well below these predictions.
Figure 9.
CAP threshold shifts (panel A) and cochleograms (panel B). By using the mouse frequency/place map of Müller et al. (2005), the physiological and anatomical data were plotted on the same abscissa to correlate changes in prestin expression with changes in sensitivity. It should be noted, however, that CAP responses below ∼4.5 kHz are produced by single units with characteristic frequencies greater than the stimulus frequency. In other words, these nerve fibers are responding on the tails of their tuning curves. Average threshold shift and average percent OHCs lacking prestin are computed for frequencies and distances indicated by the vertical lines. The cochleogram plotted with the pink dotted line indicates missing tissue due to dissection artifact. In this case, basal counts are available, as well as for the last apical segment, which appears as an isolated open circle. The CAP threshold shift for this mouse is also plotted with a dotted line. The relationship between CAP threshold shift and percent OHCs lacking prestin is provided in panel C. In this figure, the average CAP threshold shift for frequencies between 4.7 and 13.5 kHz is plotted as a function of percent OHCs lacking prestin. It should also be stated that the same result was obtained when the average CAP threshold was extended to 16.5 kHz. However, we decided to use the narrower range because CAP threshold shifts increase rapidly above 13.5 kHz in some mottled mice, i.e., the threshold shift did not remain flat. Data for brown mice appear as triangles, those for mottled mice as colored circles. The mean (+/- one standard deviation) for black mice appears as a square. The predicted change of gain estimated by Patuzzi et al. (1989, Fig. 3) is appended for reference.
Discussion
Since their introduction in the 1960s, chimeric mice have been shown to provide a valuable tool for testing gene function (Low-Zeddies and Takahashi, 2005). In this report, anatomical data reveal that the distribution of prestin-containing cells forms a mosaic, consistent with previous chimeric analyses of other genes (Dewey et al., 1976; Oster-Granite and Gearhart, 1981; Goldowitz, 1987; Low-Zeddies and Takahashi, 2001; Guo et al., 2004). In fact, there are studies showing a mosaic expression in the inner ear for frizzled 3 and frizzled 6 (Wang et al., 2006), as well as for math1 chimeric mice (Du et al., 2007). These recent anatomical results demonstrate a mixture of normal and mutant cells in both cochlear and vestibular sense organs. The observed intermingling of cells derived from the two parental strains implies that a single progenitor cell does not give rise to a large number of OHCs. In other words, OHCs do not seem to descend from a small number of progenitor cells as in the cerebellum (Vogel and Herrup, 1993). In contrast, the cochlea appears to be composed of thousands of OHCs, each derived from a single or very small number of precursor cells, similar to the retina (Williams and Goldowitz, 1992). This is consistent with the observation that OHCs exhibit a primarily vertical nuclear migration (Katayama and Corwin, 1993) from their place of generation, to their adult position within the organ of Corti.
We also found no tissue chimerism in mice with a single coat color, similar to the clock chimera (Low-Zeddies and Takahashi, 2001). For example, brown mice have greater than 95% OHCs with prestin, while black mice showed no prestin staining. Although we found asymmetry between ears, the average asymmetry was ∼18%. This result compares well with observations in the nervous system where the reported differences in cell proportions between sides was usually less than 25% (Sanyal and Zeilmaker, 1977; Herrup et al., 1984,b; Herrup, 1986; Herrup and Sunter, 1986; Crandall and Herrup, 1990; Fishell et al., 1990). Except in mice with asymmetrical ears, there was a correlation between coat color and the anatomical/physiological measurements in the cochlea. It should also be emphasized that we did not observe a mixed physiological phenotype in which the proportion of prestin-containing cells impacted sensitivity independent of tuning. In other words, if there was a change in threshold, there was a decrease in tip-to-tail ratio, i.e., a decrease in tuning curve tip length. Hence, these observations are consistent with the notion that OHCs containing prestin are essential for the sensitivity and frequency selectivity expressed in the organ of Corti and that the mutant defect is intrinsic to the OHC, i.e., the prestin effect acts in a cell-autonomous mode.
In order to validate this approach, we made additional controls by mating a ROSA26 WT male with a prestin KO female. All offspring showed lacZ staining and normal cochlear function. The latter result is consistent with Cheatham et al. (2005) where near-normal levels of prestin protein were produced in prestin heterozygotes, thereby preserving WT-like sensitivity and frequency selectivity. It was also demonstrated that cells in mice having only one copy of the prestin gene were similar to WT OHCs in length and although not measured, probably in stiffness as well.
When making comparisons between this control and a chimera, it should be emphasized that all OHCs in mice containing only one copy of WT prestin are heterozygous for the prestin gene. In contrast, OHCs in the chimera are either WT or KO, i.e., no OHC is heterozygous for the prestin gene. In a 50:50 balanced chimera, half of the OHCs express prestin and half do not, i.e., half of the cells are short and much less stiff than their neighbors. In mice with only one copy of the prestin gene, the OHCs are all the same, i.e., they are near normal in protein, length and most likely stiffness. So the observation that ROSA26 WT/prestin KO controls have normal hearing simply indicates that changes in genetic background and the presence of the reporter gene lacZ do not impact phenotype. This result, however, does not contradict the observation that a 50:50 chimera shows about half of the maximum gain.
In contrast to KO/KI mouse models, an intermediate phenotype is observed in prestin chimeric mice such that a partial loss of gain is recorded. In other words, the CAP thresholds and CAP tuning curves in mottled mice exhibit a phenotypic gradient, where the transition between WT animals having normal amplification and KOs having none occurs in proportion to their constituent genotypes. Hence, the data indicate a proportional change in amplifier gain (in decibels) as the number of prestin-containing OHCs decreases, i.e., genotype ratio and phenotype are intimately related in prestin chimeric mice. The loss of sensitivity, however, is smaller than predictions from current models of amplification. There is also no evidence of nonlinearity in the relationship between sensitivity and amplifier gain, which characterizes Patuzzi et al.'s (1989) model predictions, as well as those of Neely and Kim (1986).
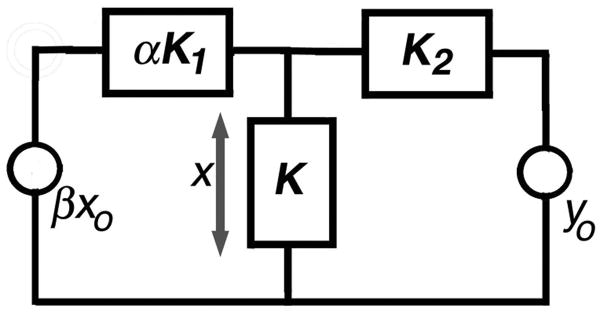
One can approach these results in a semi-quantitative way. In Fig. 10, a Thèvenin equivalent is shown for a length of cochlea within which the outputs of OHCs sum. We assume that there are two separate displacement sources: OHC somatic motility (βxo) and stereociliary motility (yo). The factor β represents the fraction of OHCs producing somatic motility, i.e., those containing prestin. The source compliance of the somatic motor complex is αK1, while that of the ciliary motor complex is K2. The factor α represents change in compliance due to prestin removal. The load compliance, K, symbolizes the passive mechanical load upon the motors, principally some combination of reticular lamina, tectorial membrane and basilar membrane compliances. Neither absolute nor relative magnitudes matter a great deal in the simple exercise that follows.
Figure 10.
A Thèvenin equivalent circuit showing displacement sources for both somatic (xo) and ciliary (yo) motility. Component factors are identified in the text.
Let us express the displacement across the load as x. If only xo is active, then
| (Eq. 1) |
Next, we compute x when only yo is active, such that
| (Eq. 2) |
Notice that as β decreases, so does the displacement due to somatic motility, but there is no change in ciliary-driven displacement. Next, the compliance of somatic OHC motors is varied between a normal, wildtype-prestin value of α=1 and an extreme value of infinite compliance. In this second case, the displacement, x, decreases when the driving source is xo, but the response increases for the ciliary drive, yo, because the denominator decreases in Eq. 2. Assuming that feedback/gain is provided by somatic motility, a decrease in the number of contributing OHCs or an increase in source compliance yields a reduced response. This circuit analogy suggests that the reduction of prestin/stiffness in chimeric mice serves to decouple the system, thereby diminishing the interaction of OHCs with other elements in the feedback loop. This effect would very likely preclude any amplifier from generating enough force to boost basilar membrane vibrations at low-stimulus levels. Because the ciliary amplifier is demonstrated to increase mechanical displacements when compliance increases, this simulation, as well as the chimera data, do not agree with a model in which the principal source of gain is ciliary motility alone.
A chimera analysis of prestin function indicates proportionality between threshold shift and amplification, as measured by CAP thresholds and the tip-length of CAP tuning curves, and between these variables and the proportion of prestin-expressing OHCs in the cochlea. The change in threshold vs. proportion of no-prestin OHCs in the amount of ∼0.5 dB/% is a useful estimate of the logarithmic relationship between these variables. These results are consistent with prestin-mediated OHC motility playing a critical role in cochlear amplification.
Supplementary Material
Portraits are ordered by coat color and show a gradient between black/prestin KO mice (upper left) and brown/ROSA26 WT mice (lower right).
Acknowledgments
We thank Lindsey Tengerstrom for help constructing cochleograms. Work supported by NIDCD #DC00089 (to PD), NIMH #5R44MH066670 (to SLZ) and The Knowles Leadership Fund (MAC).
References
- Bohne B, Harding GW. Processing and analyzing the mouse temporal bone to identify gross, cellular and subcellular pathology. Hear Res. 1997;109:34–45. doi: 10.1016/s0378-5955(97)00019-1. [DOI] [PubMed] [Google Scholar]
- Brown SDM, Hardisty-Hughes RE, Mburu P. Quiet as a mouse: dissecting the molecular and genetic basis of hearing. Nature Rev Gen. 2008;9:277–290. doi: 10.1038/nrg2309. [DOI] [PubMed] [Google Scholar]
- Cheatham MA, Huynh KH, Gao J, Zuo J, Dallos P. Cochlear function in Prestin knockout mice. J Physiol. 2004;560:821–830. doi: 10.1113/jphysiol.2004.069559. [DOI] [PMC free article] [PubMed] [Google Scholar]
- Cheatham MA, Zheng J, Huynh KH, Du GG, Gao J, Zuo J, Navarrete E, Dallos P. Cochlear function in mice with only one copy of the Prestin gene. J Physiol. 2005;569:229–241. doi: 10.1113/jphysiol.2005.093518. [DOI] [PMC free article] [PubMed] [Google Scholar]
- Cheatham MA, Zheng J, Huynh KH, Du GG, Edge RM, Anderson CT, Zuo J, Ryan AF, Dallos P. Evaluation of an independent prestin mouse model derived from the 129S1 strain. Audiol Neurotol. 2007;12:378–390. doi: 10.1159/000106481. [DOI] [PubMed] [Google Scholar]
- Crandall JE, Herrup K. Patterns of cell lineage in the cerebral cortex reveal evidence for developmental boundaries. J Exp Zoo. 1990;109:131–139. doi: 10.1016/s0014-4886(05)80014-7. [DOI] [PubMed] [Google Scholar]
- Dallos P, Cheatham MA. Compound action potential (AP) tuning curves. J Acoust Soc Am. 1976;59:591–597. doi: 10.1121/1.380903. [DOI] [PubMed] [Google Scholar]
- Dallos P, Wu XM, Cheatham MA, Gao J, Zheng J, Anderson CT, Jia S, Wang X, Cheng WHY, Sengupta S, He DZZ, Zuo J. Prestin-based outer hair cell motility is necessary for mammalian cochlear amplification. Neuron. 2008;58:333–339. doi: 10.1016/j.neuron.2008.02.028. [DOI] [PMC free article] [PubMed] [Google Scholar]
- Dallos P, Harris DM. Properties of auditory nerve responses in the absence of outer hair cells. J Neurophysiol. 1978;41:365–383. doi: 10.1152/jn.1978.41.2.365. [DOI] [PubMed] [Google Scholar]
- Dewey MJ, Gervais AG, Mintz B. Brain and ganglion development from two genotypic classes of cells in allophenic mice. Dev Bio. 1976;50:68–81. doi: 10.1016/0012-1606(76)90068-3. [DOI] [PubMed] [Google Scholar]
- Du X, Jensen P, Goldowitz D, Hamre KM. Wild-type cells rescue genotypically Math1-null hair cells in the inner ears of chimeric mice. Dev Bio. 2007;305:430–438. doi: 10.1016/j.ydbio.2007.02.028. [DOI] [PubMed] [Google Scholar]
- Falconer DS, Avery PJ. Variability of chimeras and mosaics. J Embry Exp Morph. 1978;43:195–219. [PubMed] [Google Scholar]
- Fishell G, Rossant J, van der Kooy D. Neuronal lineages in chimeric mouse forebrain are segregated between compartments and in the rostrocaudal and radial planes. Dev Bio. 1990;141:70–83. doi: 10.1016/0012-1606(90)90102-o. [DOI] [PubMed] [Google Scholar]
- Friedrich G, Soriano P. Promotor traps in embryonic stem cells: A genetic screen to identify and mutate developmental genes in mice. Genes Dev. 1991;5:1513–1523. doi: 10.1101/gad.5.9.1513. [DOI] [PubMed] [Google Scholar]
- Friedrich VL, Holstein GR, Li X, Gow A, Kelley KA, Lazzarini RA. Intracellular distribution of transgenic bacterial β-galactosidase in central nervous system neurons and neuroglia. J Neurosci Res. 1993;36:88–98. doi: 10.1002/jnr.490360110. [DOI] [PubMed] [Google Scholar]
- Gao J, Wang X, Wu X, Aguinaga S, Huynh K, Jia S, Matsuda K, Patel M, Zheng J, Cheatham MA, He DZZ, Dallos P, Zuo J. Prestin-based outer hair cell electromotility in knockin mice does not appear to adjust the operating point of a cilia-based amplifier. PNAS. 2007;104:12542–12547. doi: 10.1073/pnas.0700356104. [DOI] [PMC free article] [PubMed] [Google Scholar]
- Goldowitz D. Cell partitioning and mixing in the formation of the CNS: Analysis of the cortical somatosensory barrels in chimeric mice. Dev Br Res. 1987;35:1–9. doi: 10.1016/0165-3806(87)90002-2. [DOI] [PubMed] [Google Scholar]
- Guo N, Hawkins C, Nathans J. Frizzled 6 controls hair patterning in mice. PNAS. 2004;101:9277–9281. doi: 10.1073/pnas.0402802101. [DOI] [PMC free article] [PubMed] [Google Scholar]
- Herrup K. Cell lineage relationships in the development of the mammalian CNS: role of cell lineage in control of cerebellar Purkinje cell number. Dev Bio. 1986;115:148–154. doi: 10.1016/0012-1606(86)90236-8. [DOI] [PubMed] [Google Scholar]
- Herrup K, Sunter K. Cell lineage dependent and independent control of Purkinje cell number in the mammalian CNS: Further quantitative studies of lurcher chimeric mice. Dev Bio. 1986;117:417–427. doi: 10.1016/0012-1606(86)90310-6. [DOI] [PubMed] [Google Scholar]
- Herrup K, Diglio TJ, Letsou A. Cell lineage relationships in the development of the mammalian CNS. I. The facial nerve nucleus. Dev Bio. 1984a;103:329–336. doi: 10.1016/0012-1606(84)90321-x. [DOI] [PubMed] [Google Scholar]
- Herrup K, Wetts R, Diglio TJ. Cell lineage relationships in the development of the mammalian CNS. II. Bilateral independence of CNS clones. J Neurogen. 1984b;1:275–288. doi: 10.3109/01677068409107092. [DOI] [PubMed] [Google Scholar]
- Hogan B, Beddington R, Costantini F, Lacy E. Manipulating the Mouse Embryo. Cold Spring Harbor Press; New York: 1994. [Google Scholar]
- Katayama A, Corwin J. Cochlear cytogenesis visualized through pulse labeling of chick embryos in culture. J Comp Neurol. 1993;333:28–40. doi: 10.1002/cne.903330103. [DOI] [PubMed] [Google Scholar]
- Keiler S, Richter CP. Cochlear dimensions obtained in hemicochleae of four different strains of mice: CBA/CaJ, 129/CD1, 129/SvEv and C57BL/6J. Hear Res. 2001;162:91–104. doi: 10.1016/s0378-5955(01)00374-4. [DOI] [PubMed] [Google Scholar]
- Kelly SJ. Studies of the developmental potential of 4- and 8-cell stage mouse blastomeres. J Exp Zool. 1977;200:365–376. doi: 10.1002/jez.1402000307. [DOI] [PubMed] [Google Scholar]
- Liberman C, Gao J, He DZZ, Wu X, Jia S, Zuo J. Prestin is required for electromotility of the outer hair cell and for the cochlear amplifier. Nature. 2002;419:300–304. doi: 10.1038/nature01059. [DOI] [PubMed] [Google Scholar]
- Low-Zeddies S, Takahashi J. Chimera analysis of the Clock mutation in mice shows that complex cellular integration determines circadian behavior. Cell. 2001;105:25–42. doi: 10.1016/s0092-8674(01)00294-x. [DOI] [PMC free article] [PubMed] [Google Scholar]
- Low-Zeddies S, Takahashi J. Mouse chimeras and their application to circadian biology. Meth Enzymol. 2005;393:478–492. doi: 10.1016/S0076-6879(05)93024-3. [DOI] [PMC free article] [PubMed] [Google Scholar]
- Matsuda K, Zheng J, Du GG, Klöcker N, Madison LD, Dallos P. N-linked glycosylation sites of the motor protein prestin: effects on membrane targeting and electrophysiological function. J Neurochem. 2004;89:928–938. doi: 10.1111/j.1471-4159.2004.02377.x. [DOI] [PubMed] [Google Scholar]
- Mintz B. Formation of genotypically mosaic mouse embryos. Am J Zoo. 1962;4:432. [Google Scholar]
- Mullen RJ, Whitten RK. Relationship of genotype and degree of chimerism in coat color to sex ratios and gametogenesis in chimeric mice. J Exp Zoo. 1971;178:165–176. doi: 10.1002/jez.1401780203. [DOI] [PubMed] [Google Scholar]
- Müller M, von Hünerbein K, Hoidis S, Smolders JWT. A physiological place-frequency map of the cochlea in the CBA/J mouse. Hear Res. 2005;202:63–73. doi: 10.1016/j.heares.2004.08.011. [DOI] [PubMed] [Google Scholar]
- Neely S, Kim DO. A model for active elements in cochlear mechanics. J Acoust Soc Am. 1986;79:1472–1480. doi: 10.1121/1.393674. [DOI] [PubMed] [Google Scholar]
- Oster-Granite ML, Gearhart J. Cell lineage analysis of cerebellar Purkinje cells in mouse chimeras. Dev Bio. 1981;85:199–208. doi: 10.1016/0012-1606(81)90251-7. [DOI] [PubMed] [Google Scholar]
- Patuzzi RB, Yates GK, Johnstone BM. Changes in cochlear microphonic and neural sensitivity produced by acoustic trauma. Hear Res. 1989;39:189–202. doi: 10.1016/0378-5955(89)90090-7. [DOI] [PubMed] [Google Scholar]
- Ryan A, Dallos P. Effect of absence of cochlear outer hair cells on behavioural auditory threshold. Nature. 1975;253:44–46. doi: 10.1038/253044a0. [DOI] [PubMed] [Google Scholar]
- Sanyal S, Zeilmaker GH. Cell lineage in retinal development of mice studied in experimental chimaeras. Nature. 1977;265:731–733. doi: 10.1038/265731a0. [DOI] [PubMed] [Google Scholar]
- Tarkowski AK. Mouse chimaeras developed from fused eggs. Nature. 1961;190:857–860. doi: 10.1038/190857a0. [DOI] [PubMed] [Google Scholar]
- Vogel MW, Herrup K. A theoretical and experimental examination of cell lineage relationships among cerebellar Purkinje cells. Dev Bio. 1993;156:49–68. doi: 10.1006/dbio.1993.1058. [DOI] [PubMed] [Google Scholar]
- Wang Y, Guo N, Nathans J. The role of Frizzled3 and Frizzled6 in neural tube closure and in the planar polarity of inner-ear sensory hair cells. J Neurosci. 2006;26:2147–2156. doi: 10.1523/JNEUROSCI.4698-05.2005. [DOI] [PMC free article] [PubMed] [Google Scholar]
- Wu X, Gao J, Guo Y, Zuo J. Hearing threshold elevation precedes hair-cell loss in prestin knockout mice. Molec Br Res. 2004;126:30–37. doi: 10.1016/j.molbrainres.2004.03.020. [DOI] [PubMed] [Google Scholar]
- Williams RW, Goldowitz D. Structure of clonal and polyclonal cell arrays in chimeric mouse retina. PNAS. 1992;89:1184–1188. doi: 10.1073/pnas.89.4.1184. [DOI] [PMC free article] [PubMed] [Google Scholar]
- Zambrowicz BP, Imamoto A, Fiering S, Herzenberg LA, Kerr WG, Soriano P. Disruption of overlapping transcripts in the ROSA βgeo 26 gene trap strain leads to widespread expression of β-galactosidase in mouse embryos and hematopoietic cells. Dev Bio. 1997;94:3789–3794. doi: 10.1073/pnas.94.8.3789. [DOI] [PMC free article] [PubMed] [Google Scholar]
- Zheng J, Shen W, He DZZ, Long KB, Madison LD, Dallos P. Prestin is the motor protein of cochlear outer hair cells. Nature. 2000;405:149–155. doi: 10.1038/35012009. [DOI] [PubMed] [Google Scholar]
- Zheng J, Long K, Matsuda K, Madison LD, Ryan A, Dallos P. Genomic characterization and expression of mouse prestin, the motor protein of outer hair cells. Mamm Genome. 2003;14:87–96. doi: 10.1007/s00335-002-2227-y. [DOI] [PubMed] [Google Scholar]
Associated Data
This section collects any data citations, data availability statements, or supplementary materials included in this article.
Supplementary Materials
Portraits are ordered by coat color and show a gradient between black/prestin KO mice (upper left) and brown/ROSA26 WT mice (lower right).


