

Abstract
Objective
The food retail environment is an important determinant of food access and the ability to achieve a healthy diet. However, immigrant communities may procure their food in different ways than the mainstream population owing to preferences for specific cultural products, or limited English language proficiency. The objective of this analysis was to describe the grocery shopping patterns and behaviors of one of the largest immigrant groups in New York City, Chinese Americans – a group experiencing high poverty and cardio-metabolic disparities.
Design
Cross-sectional survey data.
Setting
Community-based sample.
Participants
Self-identified Chinese Americans in the New York metropolitan area (n=239).
Results
Three shopping patterns were identified: Type 1: shopped weekly at an ethnic grocery store – and nowhere else; Type 2: shopped weekly at a non-ethnic grocery store, with occasional shopping at an ethnic store; and Type 3: did not perform weekly shopping. Type 1 vs. Type 2 shoppers tended to have lower education levels (37.5% vs. 78.0% with college degree); to be on public insurance (57.6% vs. 22.8%); speak English less well (18.4 vs. 41.4%); be food insecure (47.2% vs. 24.2%; p<0.01 for all) and, to travel nearly two miles further to shop at their primary grocery store (β=−1.55; 95% CI −2.81, −0.30).
Discussion
There are distinct grocery shopping patterns amongst urban-dwelling Chinese Americans corresponding to demographic and sociocultural factors that may help inform health interventions in this understudied group. Similar patterns may exist among other immigrant groups, lending preliminary support for an alternative conceptualization of how immigrant communities interact with the food retail environment.
Keywords: food retail environment, immigrant communities, Chinese American, grocery shopping, grocery stores
INTRODUCTION
Numerous recent reviews have established that immigrant communities, including Asian American and Hispanic groups – face chronic disease disparities compared to the non-Hispanic white population.(3–7) Having a healthy diet, and in particular, consuming fewer packaged and processed foods, and more fruits and vegetables, are important components to reducing chronic disease related morbidity and mortality.(16, 17) For immigrant communities, disparities in diet quality exist, particularly related to sodium, refined grains, sugary drinks and whole fruit consumption;(22–24) however, very few programs and policies targeting improvement of dietary quality that have been implemented in the past 10 years have been inclusive of these groups.(25) Moreover, studies in immigrants often focus on acculturation, which has been associated with both improved and worse diet quality following migration(26, 27) and tends to distract from the underlying absence of culturally appropriate programs and policies. There is a critical need for approaches to address chronic disease disparities for immigrant communities that respect cultural significance of foods and preserve healthful aspects of traditional diets, while promoting new, healthy behaviors.(29)
The food retail environment – including both the community nutrition environment and geographical access, as well as the consumer nutrition environment – has been recognized as an important determinant of chronic disease, food access and the ability to achieve a healthy diet.(30–32) Living in an immigrant neighborhood has been shown to be associated with healthier dietary patterns(38) and better access to healthy foods,(39) but also to have a high proportion of fast food restaurants and ready availability of unhealthy options (i.e., convenience versions of traditional foods high in sodium, fat).(40, 41) Little to no characterization of interaction with the food retail environment, or food shopping behaviors amongst immigrant communities exists in the current literature other than a few examples in Hispanic communities.(42–44) Understanding how immigrant communities interact with the food environment is imperative to identifying culturally appropriate opportunities for nutrition policy and intervention that will act to improve dietary behaviors for these groups in the long term.
Improving the food retail environment, particularly in urban settings, has increasingly become a target of public health intervention and food-related policy. However the introduction of supermarkets in low resourced areas does not appear to influence changes in diet quality.(45, 46) One potential explanatory factor for this may be that immigrant communities may procure their food in different ways than the mainstream population, owing to preference for specific cultural ingredients or products, or limited health literacy/English language proficiency. Individuals may be routinely traveling outside of their residential neighborhood for grocery shopping and, therefore, geographic proximity to a grocery store does not translate to usage. Culturally and linguistically diverse populations have reported rejecting stores that sold unfamiliar items and only frequenting stores with culturally appropriate options and a variety of ethnic foods.(47) In particular, there is emerging data that immigrant community members travel outside of their neighborhood to go to the supermarket in New York City (NYC).(48) Thus, existing efforts to improve only the geographically proximal food retail environment may have limited impact on immigrant communities. Conversely, stores that specialize in ethnic-specific items may offer a way to reach a large number of individuals who are not from the neighborhood surrounding that store.
The objective of this analysis was to describe the grocery shopping patterns of one of the largest and underserved immigrant groups in the U.S., Chinese Americans. National and local data demonstrate that Chinese Americans have similar poverty rates as other racial/ethnic minority groups (national poverty rate: Chinese American – non-citizen immigrant, 26%; white, 11%; black, 26%; Hispanic, 24%;33 NYC poverty rate, Chinese Americans, 21%; white, 14%; black, 22%; Hispanic, 25%).34 Yet, broad racial stereotypes, both societally and in the research community, suggesting that this community suffers from few health disparities35 have contributed to limited knowledge of dietary behaviors36 and a lack of nutrition-related interventions in this group. In NYC, Chinese Americans face a higher burden of a number of diet-related, chronic disease disparities compared to whites, including hypertension, pre-diabetes, stroke, and gastric cancer.(50–53) For Chinese Americans at the national level, hypertensive heart disease in adults(54) and non-alcoholic fatty liver disease and obesity in children have emerged as particular issues.(55, 56) In characterizing the interaction of Chinese Americans with the food retail environment, the goal of this analysis is to highlight potential mechanisms by which this population may be reached (e.g., leveraging ethnic grocery stores as a gathering place for Chinese American community members across the metropolitan area) and how new interventions may be developed (e.g., connecting Chinese Americans to non-ethnic, but more proximal stores) to improve food access, diet and ultimately stem the emerging tide of chronic disease within this group.
METHODS
Study Design and Participants
The Examining Norms and Behaviors Linked to Eating (ENABLE) Pilot Study focused on Chinese American adults and families led by the NYU Center for the Study of Asian American Health (CSAAH) in 2018. Settings and venues to reach participants were co-identified with the help of partnering community-based organizations (CBOs) serving the Chinese American community in NYC. In-language (simplified Chinese) fliers were hung at 3 different community locations to introduce the study prior to being onsite. Study staff were then available at times before, during and after regularly scheduled classes (e.g., cooking class, English as second language class) to invite participants to fill out the ENABLE survey. Recruitment also occurred at two health fairs. Participants were also recruited via emails addressed to CSAAH’s vast CBO partner network; an online REDCap(73) survey in both English and simplified Chinese was circulated. Participants were eligible for inclusion in the study if they self-identified as Chinese American, and if they responded they would be able to answer questions related to grocery shopping. Data collection occurred from February to June 2018.
Participants who met eligibility criteria completed surveys with trained, bilingual research staff or were also given the option to complete the survey online. The survey was developed with input from community partners and focused on aspects of the food environment. Questions assessed whether participants shopped in their neighborhood of residence, the closest store to their residence, the details (i.e., store names, addresses and cross streets) of the top three stores where their family purchased groceries, frequency and the reasons for shopping at these stores. The reasons for shopping at the stores were derived from the published literature in Black and Latinx populations, and through conversations with CBO partners.(44, 47, 74) Questions developed for this survey are available in Supplemental File 1. Participants were provided with an incentive of their choice (i.e., gift card, umbrella) valued at $10.
Measures and statistical analysis
The list of grocery stores derived from participant surveys was compared with the 2016 New York State Agriculture and Markets (NYS Ag & Markets) list. The NYS Ag & Markets list includes all stores in the state of New York that sell perishable food items. First, the named grocery store was verified to be on the NYS Ag & Markets list using store name, address (cross streets from ENABLE data), zip code and store number if available (e.g., chain stores). These multiple factors for verification were required because there were some national chains named with more than one location (e.g., Costco), and in other cases, similar names of local stores (e.g., New York Mart; New York Supermarket). The exact address was derived for each location, and the names cleaned to be consistent so as not to cause duplicates in the data. Using the cleaned list of named grocery stores, two Chinese American community health workers independently searched on Google and yelp, and identified whether the store was ‘ethnic’ or ‘non-ethnic’. An ethnic store was defined as one that appeared to carry mostly culturally specific or specialty produce or items; culture was not limited to Chinese – it could be predominantly Chinese, Japanese, Mexican, Korean, etc. This was a relatively straightforward process – in particular because many of the non-ethnic stores named were larger local or national chains (e.g., Key Food in NYC, Trader Joe’s). Any discrepancies were discussed between the two staff members and with Dr. Yi.
Using an emergent approach to categorization, shopper pattern types were identified (see Results). Demographic, sociocultural and health characteristics were assessed according to shopping pattern types. Sex, education (college graduate vs. less than college graduate), income (> $55,000 per year vs. ≤ $55,000 per year), insurance (Medicaid, Medicare, Other public, Private, None), English proficiency (speak English very well vs. speak English well, not well or not at all), nativity (US Born vs. foreign born), self-rated health (fair/poor), and self-rated diet (fair/poor) are reported in percentages. Mean age, years in the U.S., and acculturation were calculated. Acculturation was based on the Stephenson Multi-group Acculturation Scale (SMAS).(75) Two dimensions were explored: dominant society immersion (DSI) – e.g., adopting behaviors, attitudes (“I regularly read American magazines/newspapers”, “I feel at home in the United States”; and ethnic society immersion (ESI) – e.g., cultural traditions, speaking the native language – or language of the country of one’s Asian ancestry (“I eat traditional foods from my native country”; “I think in my native language”). The SMAS consists of a 15-item DSI subscale and 17-item ESI subscale.(75) Each subscale is averaged to produce an estimate of acculturation for each respective dimension with a maximum possible value of 4 for either subscale. The reasons for shopping at different stores were also assessed according to shopping pattern types. Food insecurity was assessed using the 2-item set of questions validated by Hager et al.(76) Participants were also asked their opinion about future programming.
Grocery store and home location data was geocoded using a combination of Texas A&M University geocoding services,(77) Google Maps, and geosphere packages in R (3.5.0) and RStudio v.1.2.5. Exact addresses were used for grocery store locations; however, zip codes were used for the home locations. To maximize participation amongst community members, some who may be reluctant to share precise address - we allowed for participants to report their zip code only. For home location, the distHaversine function in the geosphere package of R was used, which uses the haversine formula to determine the distance between two points on a sphere given latitude and longitude. It uses the centroid of the participant’s zip code as a proxy for home location. Straight line distance in miles between home and store location latitude and longitude coordinates were calculated, and shopping routes to the top 40 primary grocery stores were visualized using curved lines to show the relative distance. Comparisons of participant characteristics by shopping pattern type were conducted using t-tests and linear regression models for continuous variables, and chi-squared tests and multiple logistic regression models for categorical. Data were analyzed using STATA v. 15.0.
RESULTS
A total of 239 people participated in the ENABLE survey. Due to missing data, 234 participants were included in the analysis (n=5 missing information on grocery shopping) and 227 participants were included in the geographic analysis (n=8 missing zip code). Table 1 presents demographic characteristics of study participants. Approximately two-thirds of participants resided in Manhattan (34.2%) and Brooklyn (33.3%). The majority of individuals had a college degree or more (60.4%), nearly half were on public insurance (45%), and approximately one third were categorized as food insecure (35.1%) or spoke English very well (30.2%). Of individuals who were born outside of the US, the mean time spent in the US was 16 years. Around one-fifth of participants self-reported fair or poor diet quality (21.3%), and approximately one-sixth of participants self-reported fair or poor health (16.1%). When asked which suggested programs they would prefer to improve eating habits, a majority of individuals supported nutrition education (69.9%) and advertising for healthy foods (56.5%).
Table 1.
Demographic characteristics of ENABLE participants
| Age, mean ± SD | 41.4 ± 15.4 |
| Female, % | 74.8 |
| Speak English very well, % | 30.2 |
| U.S. Born, % | 17.6 |
| Years in U.S. if non-U.S. born, mean ± SD | 16.4 ± 13.1 |
| Acculturation level | |
| Ethnic Society Immersion Score, mean ± SD | 3.3 ± 0.6 |
| Dominant Society Immersion Score, mean ± SD | 2.8 ± 0.8 |
| College educated, % | 60.4 |
| Income >$55K per year | 49.2 |
| Insurance | |
| Medicaid | 24.9 |
| Medicare | 10.7 |
| Other public | 5.3 |
| Private | 55.1 |
| None | 4.0 |
| Fair/Poor Self-Rated Health, % | 16.1 |
| Fair/Poor Self-Rated Diet, % | 21.3 |
| Food insecurity, % | 35.1 |
| If nearest grocery store is primary, % | 59.4 |
| If nearest grocery store is ethnic, % | 42.2 |
| Borough of Residence, % | |
| Manhattan | 34.2 |
| Bronx | 1.3 |
| Brooklyn | 33.3 |
| Queens | 20.7 |
| Staten Island | 3.4 |
| Outside NYC | 7.2 |
| Suggested programs to improve eating habits, %1 | |
| Cooking classes | 42.3 |
| Cooking demonstrations | 32.6 |
| School-based programs | 30.1 |
| Programs that involve multiple family members | 31.0 |
| Nutrition education | 69.9 |
| Advertising for healthy foods | 56.5 |
| Providing cooking tools, such as a salt measuring spoon | 26.4 |
| Programs in grocery stores, such as taste tests | 34.7 |
Response to Question: What do you think can be done to improve the eating habits of people in your neighborhood? Select all that apply.
Characteristics of the grocery stores (i.e., ethnic vs. non-ethnic) and frequency of shopping were used to categorize grocery shopping patterns. As these patterns have not been previously established, strict a priori assumptions were not applied to the categorization process. However based on formative research in the community, it was hypothesized that at least two patterns would emerge: 1) those who shopped at an ethnic store as their primary store; and 2) those who shopped at a non-ethnic store as their primary store, but supplemented their shopping less frequently at an ethnic store. Instead, three distinct patterns emerged, which are described below. The first step of the categorization process was to characterize weekly shopping at a grocery store (yes/no); n=29 individuals reported not performing weekly grocery shopping. These individuals were considered separately from those who performed weekly grocery shopping for two reasons. The first reason was conceptual: those who are only shopping every other week may be ordering out more and/or not cooking. Second, similar to analyses of consumption of a specific item (e.g., sugary drinks), non-consumers are considered separately from those who do report consumption. These 29 individuals were categorized as Type 3 shoppers (12%). Of the remaining participants who did perform weekly grocery shopping, we then differentiated those whose primary grocery store was ethnic (n=108, 47%; Type 1) and those whose primary grocery store was non-ethnic (n=94, 41%; Type 2).
Type 1 (vs. Type 2, Type 3) shoppers tended to speak English less well (18.4 vs. 41.4%, 55.6%); have lower levels of education (37.5% vs. 78.0%, 92.6% with college degree) and income (36.1% vs. 59.3%, 56% making ≤$55,000 per year); to be on public insurance (57.6% vs. 22.8%, 35.7%); have fair/poor self-rated diet (28.7% vs. 12.8%, 20.7%) or be food insecure (47.2% vs. 24.2%, 14.8%; Table 2). Conversely, Type 2 and Type 3 (vs. Type 1) shoppers tended to be U.S. born (24.7%, 35.7% vs. 6.7%); more acculturated to American society, with higher DSI (greater identification with the dominant, American, society), and lower ESI (less identification towards the ethnic, Chinese, society). Type 1 (vs. Type 2, Type 3) shoppers were also more likely to have their nearest grocery store be an ethnic grocery store (71.7% vs. 12.8%, 31%).
Table 2.
Comparison of shopper type characteristics
| Type 11 | Type 22 | Type 33 | p-value | |
|---|---|---|---|---|
| Age, mean ± SD | 43.1 ± 17.0 | 41.4 ± 14.4 | 36.3 ± 12.4 | 0.09 |
| Female, % | 71.6 | 75.5 | 82.1 | 0.58 |
| Speak English very well, % | 18.4 | 41.4 | 55.6 | <0.01 |
| U.S. Born, % | 6.7 | 24.7 | 35.7 | <0.01 |
| Years in U.S. if non-U.S. born, mean ± SD | 13.9 ± 1.1 | 20.5 ±1.8 | 15.6 ± 3.2 | 0.05 |
| Acculturation level | ||||
| Ethnic Society Immersion Score, mean ± SD | 3.5 ± 0.4 | 3.1 ± 0.8 | 3.1 ± 0.7 | <0.01 |
| Dominant Society Immersion Score, mean ± SD | 2.4 ± 0.8 | 3.1 ± 0.6 | 3.0 ± 0.7 | <0.01 |
| College educated, % | 37.5 | 78.0 | 92.6 | <0.01 |
| Income >$55K per year | 36.1 | 59.3 | 56.0 | 0.01 |
| Insurance | ||||
| Medicaid | 37.4 | 9.8 | 25.0 | <0.01 |
| Medicare | 15.2 | 7.6 | 3.6 | |
| Other public | 5.1 | 5.4 | 7.1 | |
| Private | 38.4 | 72.8 | 64.3 | |
| None | 4.0 | 4.4 | 0.0 | |
| Fair/Poor Self-Rated Health | 21.5 | 9.6 | 17.2 | 0.07 |
| Fair/Poor Self-Rated Diet | 28.7 | 12.8 | 20.7 | 0.02 |
| Food Insecure, % | 47.2 | 24.2 | 14.8 | <0.01 |
| If nearest grocery store is primary | 56.1 | 60.9 | 62.1 | 0.73 |
| If nearest grocery store is ethnic | 71.7 | 12.8 | 31.0 | <0.01 |
Type 1: performed weekly shopping at their primary ethnic grocery store;
Type 2: performed weekly shopping at their primary non-ethnic grocery store;
Type 3: did not perform weekly shopping.
Shopper types differed somewhat with regards to the reasons why they shopped at their primary store (Table 3). Type 1 shoppers prioritized proximity to places they frequented and language (product labeling, spoken by cashiers). Type 2 shoppers prioritized food quality and cleanliness; and Type 3 shoppers prioritized ease and availability of items/brands they wanted to buy.
Table 3.
Top Five Reasons for Shopping at Primary Store by Shopper Type
| Type 1 | Type 2 | Type 3 | ||||
|---|---|---|---|---|---|---|
| Ranking | Reason | % | Reason | % | Reason | % |
| 1 | Near frequented places (work, children’s school) | 55.6 | Best food quality | 53.2 | Easy to find the items and brands I like | 62.1 |
| 2 | Easy to find the items and brands I like | 53.7 | Cleanliness** | 53.2 | Carries items and brands I like | 58.6 |
| 3 | Carries items and brands I like | 44.4 | Carries items and brands I like | 51.1 | Best prices | 58.6 |
| 4 | Best prices | 39.8 | Best prices | 51.1 | Cleanliness | 41.4 |
| 5 | Another reason (e.g., products labeled in Asian language, language used by cashiers)* | 38.0 | Easy to find the items and brands I like | 48.9 | Near frequented places (work, children’s school) | 41.4 |
p<0.01 vs. % of Type 2 or Type 3 shoppers who indicated this reason (Type 2: 7.5%; Type 3: 13.8%)
p=0.01 vs. % of Type 1 or Type 3 shoppers who indicated this reason (Type 1: 30.6%; Type 3: 41.4%)
Type 1: performed weekly shopping at their primary ethnic grocery store;
Type 2: performed weekly shopping at their primary non-ethnic grocery store;
Type 3: did not perform weekly shopping.
The majority of Type 1 shoppers (78.7%) did not shop at any grocery stores in addition to their primary ethnic store, while more than half of Type 2 shoppers (52.1%) shopped at an ethnic grocery store in addition to their primary non-ethnic store (Figure 1).
Figure 1.

Shopping at Additional Stores Across Shopper Types
The straight line distance between participant homes and stores ranged between 0.07 to 26.78 miles with a median of 0.79 miles and an interquartile range of 0.44 to 1.90 miles. Shopping routes to the top 40 primary stores are visualized in Figure 2. Distance traveled to a primary grocery store differed by shopping pattern type. Type 1 shoppers traveled the furthest distance to their primary grocery store (M=2.88 miles; SD=5.16), whereas Type 2 shoppers traveled the least distance (M=1.33 miles; SD=1.96). On average, Type 1 shoppers traveled over 1.5 miles further (β=−1.55; 95% CI −2.81, −0.30) to access their primary grocery store when compared to Type 2 shoppers.
Figure 2.
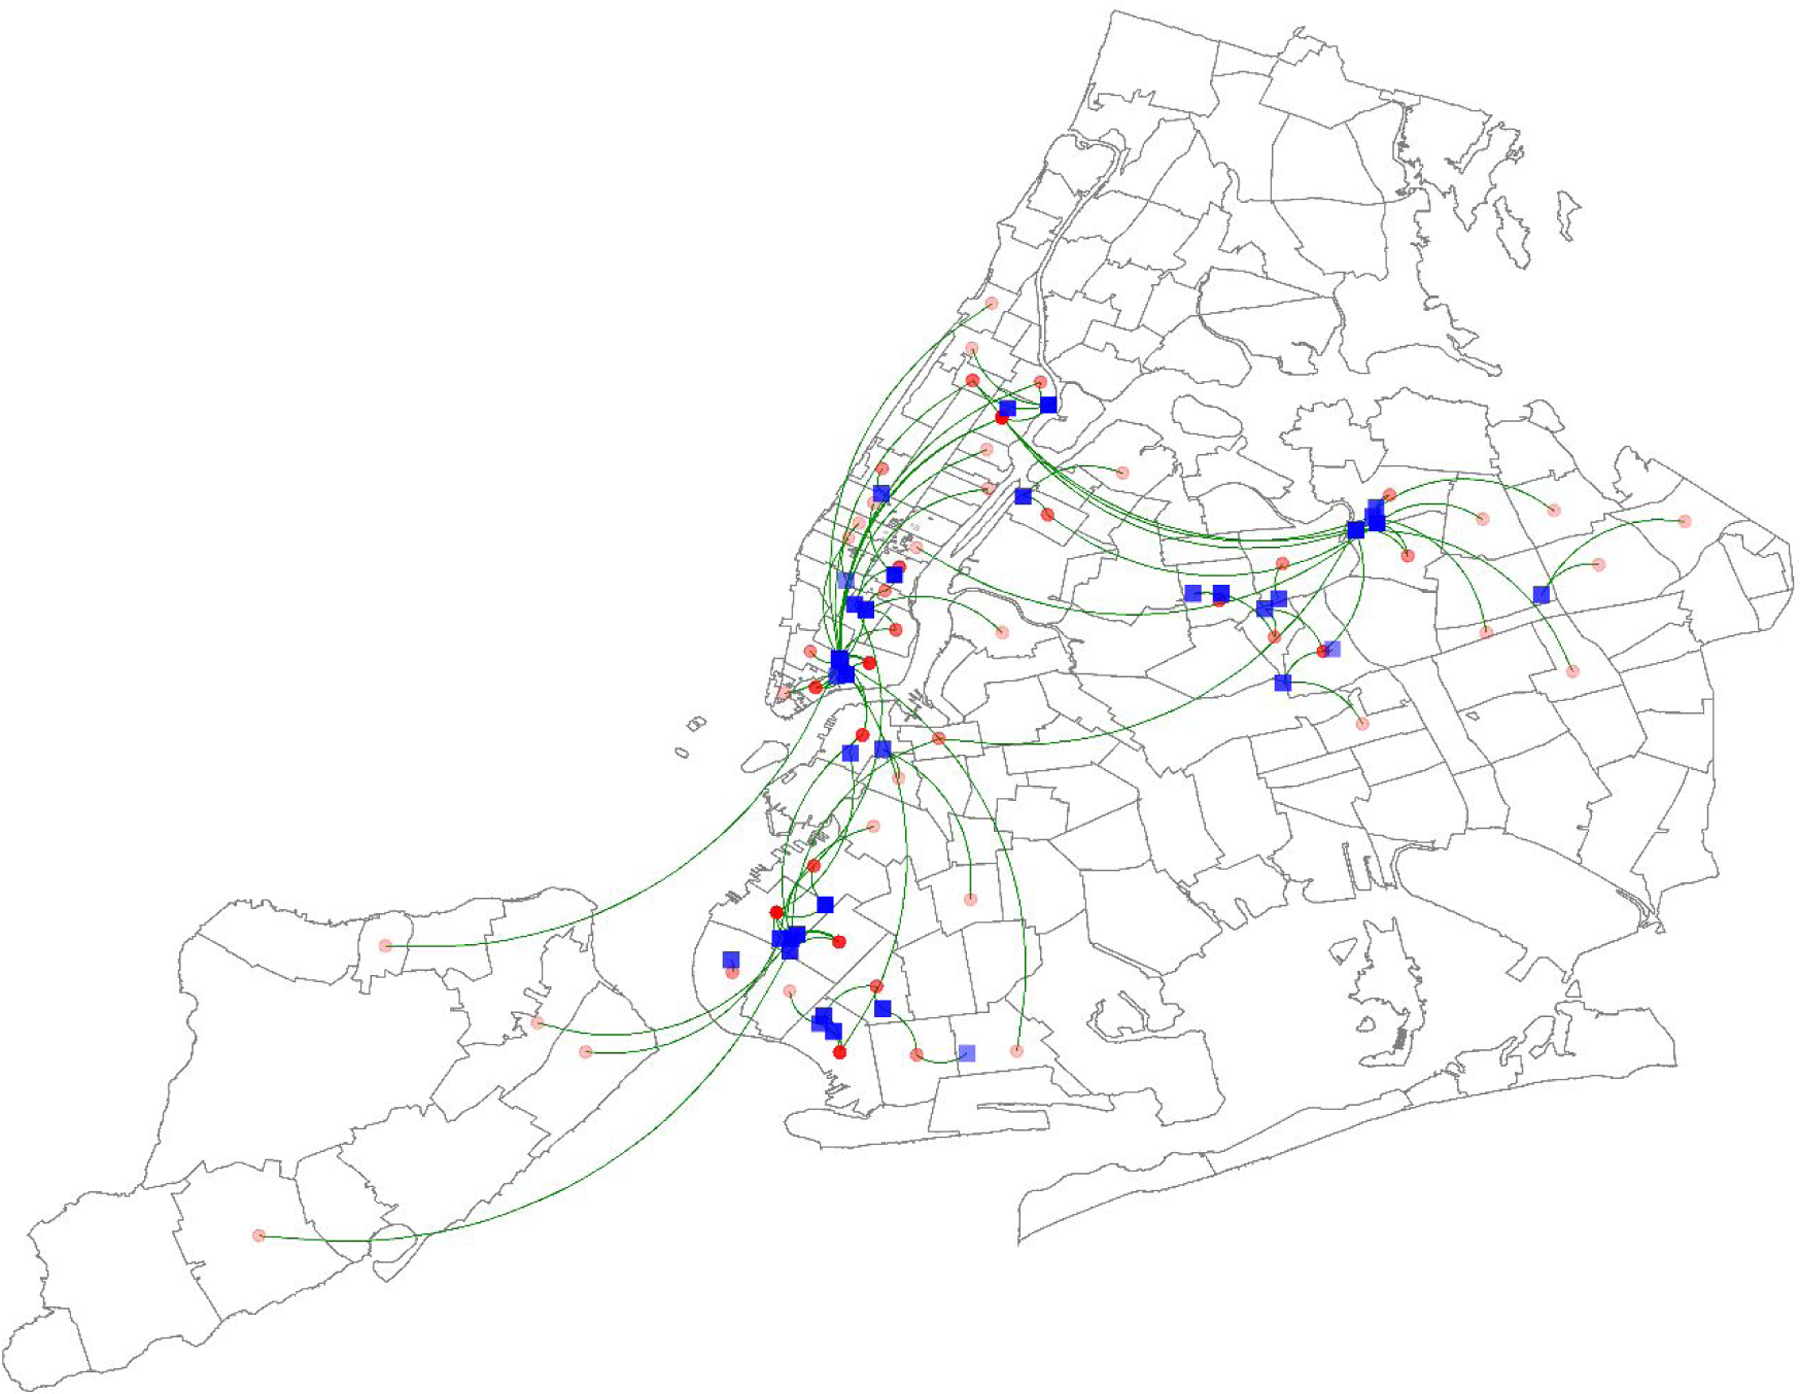
Shopping routes (green curves) between approximate homes (red dots) and top 40 primary stores (blue squares).
Straight line distance in miles between home and store location latitude and longitude coordinates were calculated, and shopping routes to the top 40 primary grocery stores were visualized using curved lines to show the relative distance.
DISCUSSION
This study assessed the grocery shopping patterns amongst urban dwelling Chinese Americans. Three primary patterns of shopping were identified: Type 1: performed weekly shopping at their primary ethnic grocery store; Type 2: performed weekly shopping at their primary non-ethnic grocery store; and Type 3: did not perform weekly shopping. Differences in demographic characteristics emerged based on the type of shopping. Type 1 shoppers tended to have lower levels of education and income; to be on public insurance; and to be food insecure, whereas Type 2 shoppers were more acculturated to American society. Type 3 shoppers were more similar to Type 2 than Type 1 shoppers, but were also unique according to specific characteristics: for example, like Type 2 shoppers they had high acculturation and education levels, but more similar to Type 1 shoppers, a modest proportion of them reported their nearest grocery stores as being an ethnic store (i.e., proxy for ethnic neighborhood residence). We conjecture that Type 3 shoppers may be important to treat as distinct from those who perform grocery shopping more frequently. First, because they may have alternative consumption patterns (e.g., consuming more ‘prepared foods’ and cooking less meals at home),(78, 79) and second, because this subgroup may require a different type of health intervention that encourages cooking at home or making healthier choices when eating out rather than being focused on grocery stores or grocery shopping.
Overwhelmingly, Type 1 shoppers exclusively shopped at ethnic grocery stores; only a small percentage shopped infrequently at another store that was non-ethnic. Type 1 shoppers tended to be less acculturated to U.S. society and to be more disadvantaged, with lower levels of income and education; and higher levels of food insecurity. While the authors are not aware of this being previously characterized in Chinese Americans, this finding is consistent with prior work indicating low acculturation level to be associated with preferences for Hispanic grocery stores (tiendas) amongst Latina women in California.(42, 80) Low income ethnic minorities in London (Afro-Caribbeans, South Asians) have also reported a preference for shopping at ethnic grocery stores.(81) For the Type 1 shoppers in this sample of Chinese Americans, a combination of limited English proficiency and corresponding preference for in-language signage or clerks, limited knowledge on preparation of non-Chinese foods,(56) and relatedly, a preference for cultural foods may be operating in concert to contribute to the higher burden of food insecurity.
Cooking traditional meals is an important means to preserve cultural identity in immigrant communities. Availability of culturally-specific foods has considerable influence on shopping behavior. In this study, Type 1 shoppers tended to report that the most important reason for shopping at their primary grocery store was because it carried brands/items that they liked.(81–83) On average, Type 1 shoppers traveled one and a half miles further to their primary grocery store. Walkability to stores is often a priority for low-income and minority populations, given the lack of resources (i.e., money, time).(47) However, the present findings indicate that cultural identity may take priority over convenience for Chinese American immigrants given that individuals traveled further to obtain culturally relevant foods – a pattern which may be generalizable to other groups.
Grocery store-based interventions have been shown to be a promising setting in which to provide education and improve healthful behaviors in immigrant communities.(84–86) For the Asian American community in particular, one stellar program the University of California at San Diego Moores Cancer Center’s Asian Grocery Store-Based Cancer Education Program has been demonstrated as an effective and sustainable strategy for disseminating cancer-related information to Asian and Pacific Islander communities.(86) Beyond this example, however, to our knowledge there few other grocery store-based interventions that have been empirically tested in the Asian American community.
Third places - or social, public gathering places apart from home or work(87) – have been identified as potentially effective settings to improve people’s health. We conjecture that ethnic grocery stores have been underutilized as a potential third place for reaching Asian American and other immigrant communities. Potential interventions include those that have been demonstrated to be effective for other racial/ethnic groups; such as pricing or economic incentives, nutrition education, or grocery store tours.(88, 89) In this sample of Chinese Americans, the majority of participants supported nutrition education. Prior efforts that have trained community members to disseminate culturally tailored messages have been particularly effective at increasing purchase of heathy foods in racial/ethnic minority communities.(88) Another potential intervention might be taste tests – for unfamiliar foods (e.g., bok choy for Hispanic communities), new preparations of foods (e.g., consuming uncooked vegetables for Chinese communities), or culturally stigmatized foods (e.g., brown rice in East Asian communities).(90–92)
Initiatives at non-ethnic grocery stores are also important. Connecting less acculturated shoppers with nearby non-ethnic grocery stores might decrease food insecurity, especially among those who use resources to travel further distances to ethnic stores. Additionally, shoppers may feel more social connectedness in the community as a result of shopping at the local store, interacting with their neighbors, or with familiar store clerks – which might act to ‘substitute’ similar feelings of cohesion within their ethnic store. Involving producers and distributors in increasing access to ethnic food items in stores has also been shown to improve food access for these individuals.(88)
There are a few limitations to note. The study was cross-sectional, which may limit interpretations of associations. Data were self-reported, and as such might be subject to social desirability bias. Additionally, the sample was not systematically recruited, so the results may not be generalizable to all Chinese American immigrants. Home addresses were not collected from participants to maximize participation rates, thus zip codes were used to represent the home location in the geographical analysis. Further, straight-line distance was used to approximate distance. As a result of both of these methods, the distance to grocery stores may be under- or overestimated, but it is a simple way to give a relative comparison of the travel distance between participants and their nearest shops. Distance was also not a primary exposure or outcome of this study, thus we feel the characterization of the data in this way was appropriate. Lastly, we do not have measures of diet, items consumed or purchased, beyond the ‘overall rating of diet’ question; however this question has been previously shown to correspond to the diet quality and the Healthy Eating Index.(93) Despite these limitations, our study fills an important research gap about the grocery shopping patterns amongst Chinese Americans and provides important evidence for designing targeted, effective interventions to improve the diet of this understudied population.
There are distinct behavioral and geographical grocery shopping patterns amongst urban dwelling Chinese Americans. Identifying such patterns may help to reach this understudied group through tailored health interventions. Similar patterns may exist among other immigrant groups in urban settings. Approaches including nutrition education and/or social marketing of healthy foods in key social gathering locations, i.e., ethnic grocery stores, may help to improve diets in Chinese Americans and other immigrant communities. Alternative strategies for reaching those who do not perform regular grocery shopping should also be explored. Lastly, understanding these distinct patterns and accompanying acculturation level may also help to improve the feasibility, acceptability and longer term sustainability of nutrition interventions in immigrant populations.
Supplementary Material
Acknowledgements:
We’d like to thank our study participants, Ziwei Ran, Funing Yang, Alice Liang, Judy Ah-Yune, and the East Harlem Health Action Center for their invaluable contributions to this project. We’d also like to thank the reviewers and editor for their helpful comments in reshaping this manuscript.
Financial Support: This research was supported in part by NIH/National Institute on Minority Health and Health Disparities (U54MD000538), and National Heart, Lung, and Blood Institute (R01HL141427). The contents of this publication are solely the responsibility of the authors and do not necessarily represent the official views of the NIH.
Footnotes
Conflict of Interest: None
Ethical Standards Disclosure: This study was conducted according to the guidelines laid down in the Declaration of Helsinki and all procedures involving research study participants were approved by the Institutional Review Board at the NYU School of Medicine. Written informed consent was obtained from all subjects/patients.
References
- 1.Li WOC, Huynh M, Castro A, Falci L, Gurung S, Kennedy J, Maduro G, Sun Y, and Van Wye G. Summary of Vital Statistics, 2017. New York, NY: New York City Department of Health and Mental Hygiene, Beureau of Vital Statistics; 2019. [Google Scholar]
- 2.Hoyert DLXJ. Deaths: Preliminary data for 2011. Hyattsville, MD: National Center for Health Statistics; 2012. [PubMed] [Google Scholar]
- 3.Abesamis CJ, Fruh S, Hall H, et al. Cardiovascular Health of Filipinos in the United States: A Review of the Literature. Journal of transcultural nursing : official journal of the Transcultural Nursing Society. 2016;27(5):518–28. [DOI] [PMC free article] [PubMed] [Google Scholar]
- 4.Gong Z, Zhao D. Cardiovascular diseases and risk factors among Chinese immigrants. Internal and emergency medicine. 2016;11(3):307–18. [DOI] [PubMed] [Google Scholar]
- 5.Kandula N, Ahmed M, Dodani S, et al. Cardiovascular Disease & Cancer Risk Among South Asians: Impact of Sociocultural Influences on Lifestyle and Behavior. J Immigr Minor Health. 2019;21(Suppl 1):15–25. [DOI] [PMC free article] [PubMed] [Google Scholar]
- 6.Shin CN, Keller C, An K, et al. Cardiovascular Disease in Korean Americans: A Systematic Review. J Cardiovasc Nurs. 2018;33(1):82–93. [DOI] [PubMed] [Google Scholar]
- 7.Velasco-Mondragon E, Jimenez A, Palladino-Davis AG, et al. Hispanic health in the USA: a scoping review of the literature. Public health reviews. 2016;37:31. [DOI] [PMC free article] [PubMed] [Google Scholar]
- 8.Palaniappan L, Garg A, Enas E, et al. South Asian Cardiovascular Disease & Cancer Risk: Genetics & Pathophysiology. Journal of community health. 2018;43(6):1100–14. [DOI] [PMC free article] [PubMed] [Google Scholar]
- 9.Angell SY, Garg RK, Gwynn RC, et al. Prevalence, awareness, treatment, and predictors of control of hypertension in New York City. Circ Cardiovasc Qual Outcomes. 2008;1(1):46–53. [DOI] [PubMed] [Google Scholar]
- 10.Menke A, Casagrande S, Geiss L, et al. Prevalence of and Trends in Diabetes Among Adults in the United States, 1988–2012. Jama. 2015;314(10):1021–9. [DOI] [PubMed] [Google Scholar]
- 11.Nwanko T, Yoon S, Burt V, et al. Hypertension among adults in the United States: National Health and Nutrition Examination Survey, 2011–2012. National Center for Health Statistics Data Brief; 2013. [PubMed]
- 12.Selvin E, Wang D, Lee AK, et al. Identifying Trends in Undiagnosed Diabetes in U.S. Adults by Using a Confirmatory Definition: A Cross-sectional Study. Ann Intern Med. 2017;167(11):769–76. [DOI] [PMC free article] [PubMed] [Google Scholar]
- 13.Sorlie PD, Allison MA, Aviles-Santa ML, et al. Prevalence of hypertension, awareness, treatment, and control in the Hispanic Community Health Study/Study of Latinos. Am J Hypertens. 2014;27(6):793–800. [DOI] [PMC free article] [PubMed] [Google Scholar]
- 14.Ursua R, Aguilar D, Wyatt L, et al. Awareness, treatment and control of hypertension among Filipino immigrants. J Gen Intern Med. 2014;29(3):455–62. [DOI] [PMC free article] [PubMed] [Google Scholar]
- 15.Ye J, Rust G, Baltrus P, et al. Cardiovascular risk factors among Asian Americans: results from a National Health Survey. Ann Epidemiol. 2009;19(10):718–23. [DOI] [PMC free article] [PubMed] [Google Scholar]
- 16.Aune D, Giovannucci E, Boffetta P, et al. Fruit and vegetable intake and the risk of cardiovascular disease, total cancer and all-cause mortality-a systematic review and dose-response meta-analysis of prospective studies. International journal of epidemiology. 2017;46(3):1029–56. [DOI] [PMC free article] [PubMed] [Google Scholar]
- 17.Monteiro CA, Cannon G, Moubarac JC, et al. The UN Decade of Nutrition, the NOVA food classification and the trouble with ultra-processing. Public health nutrition. 2018;21(1):5–17. [DOI] [PMC free article] [PubMed] [Google Scholar]
- 18.Aburto NJ, Hanson S, Gutierrez H, et al. Effect of increased potassium intake on cardiovascular risk factors and disease: systematic review and meta-analyses. BMJ. 2013;346:f1378. [DOI] [PMC free article] [PubMed] [Google Scholar]
- 19.Boeing H, Bechthold A, Bub A, et al. Critical review: vegetables and fruit in the prevention of chronic diseases. European journal of nutrition. 2012;51(6):637–63. [DOI] [PMC free article] [PubMed] [Google Scholar]
- 20.Yang Q, Liu T, Kuklina EV, et al. Sodium and potassium intake and mortality among US adults: prospective data from the Third National Health and Nutrition Examination Survey. Archives of internal medicine. 2011;171(13):1183–91. [DOI] [PubMed] [Google Scholar]
- 21.Appel LJ, Brands MW, Daniels SR, et al. Dietary approaches to prevent and treat hypertension: a scientific statement from the American Heart Association. Hypertension. 2006;47(2):296–308. [DOI] [PubMed] [Google Scholar]
- 22.Awata H, Linder S, Mitchell LE, et al. Association of Dietary Intake and Biomarker Levels of Arsenic, Cadmium, Lead, and Mercury among Asian Populations in the United States: NHANES 2011–2012. Environ Health Perspect. 2017;125(3):314–23. [DOI] [PMC free article] [PubMed] [Google Scholar]
- 23.Firestone MJ, Beasley JM, Kwon SC, et al. Asian American Dietary Sources of Sodium and Salt Behaviors Compared with Other Racial/ethnic Groups, NHANES, 2011–2012. Ethn Dis. 2017;27(3):241–8. [DOI] [PMC free article] [PubMed] [Google Scholar]
- 24.Rehm CD, Penalvo JL, Afshin A, et al. Dietary Intake Among US Adults, 1999–2012. Jama. 2016;315(23):2542–53. [DOI] [PMC free article] [PubMed] [Google Scholar]
- 25.Russo R, Li Y, Chong S, et al. Dietary Policies and Programs in the United States: A Narrative Review. Preventive Medicine Reports. In press. [DOI] [PMC free article] [PubMed]
- 26.Kirshner L, Yi SS, Wylie-Rosett J, et al. Acculturation and Diet Among Chinese American Immigrants in New York City. Current Developments in Nutrition. 2019. [DOI] [PMC free article] [PubMed]
- 27.Rodriguez CJ, Allison M, Daviglus ML, et al. Status of cardiovascular disease and stroke in Hispanics/Latinos in the United States: a science advisory from the American Heart Association. Circulation. 2014;130(7):593–625. [DOI] [PMC free article] [PubMed] [Google Scholar]
- 28.Azar KM, Chen E, Holland AT, et al. Festival foods in the immigrant diet. J Immigr Minor Health. 2013;15(5):953–60. [DOI] [PMC free article] [PubMed] [Google Scholar]
- 29.Satia JA. Dietary acculturation and the nutrition transition: an overview. Appl Physiol Nutr Metab. 2010;35(2):219–23. [DOI] [PubMed] [Google Scholar]
- 30.Black C, Moon G, Baird J. Dietary inequalities: what is the evidence for the effect of the neighbourhood food environment? Health Place. 2014;27:229–42. [DOI] [PMC free article] [PubMed] [Google Scholar]
- 31.Story M, Kaphingst KM, Robinson-O’Brien R, et al. Creating healthy food and eating environments: policy and environmental approaches. Annu Rev Public Health. 2008;29:253–72. [DOI] [PubMed] [Google Scholar]
- 32.Glanz K, Yaroch AL. Strategies for increasing fruit and vegetable intake in grocery stores and communities: policy, pricing, and environmental change. Preventive medicine. 2004;39 Suppl 2:S75–80. [DOI] [PubMed] [Google Scholar]
- 33.Franco M, Diez Roux AV, Glass TA, et al. Neighborhood characteristics and availability of healthy foods in Baltimore. Am J Prev Med. 2008;35(6):561–7. [DOI] [PMC free article] [PubMed] [Google Scholar]
- 34.Kamphuis CB, Giskes K, de Bruijn GJ, et al. Environmental determinants of fruit and vegetable consumption among adults: a systematic review. Br J Nutr. 2006;96(4):620–35. [PubMed] [Google Scholar]
- 35.Larson NI, Story MT, Nelson MC. Neighborhood environments: disparities in access to healthy foods in the U.S. Am J Prev Med. 2009;36(1):74–81. [DOI] [PubMed] [Google Scholar]
- 36.Morland K, Wing S, Diez Roux A, et al. Neighborhood characteristics associated with the location of food stores and food service places. Am J Prev Med. 2002;22(1):23–9. [DOI] [PubMed] [Google Scholar]
- 37.Kwate N, Yau CY, Loh JM, Williams D. Inequality of obesigenic environments: Fast food denisty in New York City. Health and Place. 2009;15(1):364–73. [DOI] [PubMed] [Google Scholar]
- 38.Park Y, Neckerman K, Quinn J, et al. Neighbourhood immigrant acculturation and diet among Hispanic female residents of New York City. Public health nutrition. 2011;14(9):1593–600. [DOI] [PMC free article] [PubMed] [Google Scholar]
- 39.Osypuk TL, Diez Roux AV, Hadley C, et al. Are immigrant enclaves healthy places to live? The Multi-ethnic Study of Atherosclerosis. Soc Sci Med. 2009;69(1):110–20. [DOI] [PMC free article] [PubMed] [Google Scholar]
- 40.Galvez MP, Morland K, Raines C, et al. Race and food store availability in an inner-city neighbourhood. Public health nutrition. 2008;11(6):624–31. [DOI] [PubMed] [Google Scholar]
- 41.Planting Seeds of Change. Strategies for Engaging Asian Pacific Americans in Healthy Eating and Active Living Initiatives. 2012. [Available from: http://www.cacf.org/documents/Planting%20Seeds%20of%20Change.pdf.
- 42.Ayala GX, Mueller K, Lopez-Madurga E, et al. Restaurant and food shopping selections among Latino women in Southern California. J Am Diet Assoc. 2005;105(1):38–45. [DOI] [PubMed] [Google Scholar]
- 43.Sharif MZ, Albert SL, Chan-Golston AM, et al. Community Residents’ Beliefs About Neighborhood Corner Stores in 2 Latino Communities: Implications for Interventions to Improve the Food Environment. J Hunger Environ Nutr. 2017;12(3):342–51. [DOI] [PMC free article] [PubMed] [Google Scholar]
- 44.Sanchez-Flack JC, Baquero B, Linnan LA, et al. What influences Latino grocery shopping behavior? Perspectives on the small food store environment from managers and employees in San Diego, California. Ecol Food Nutr. 2016;55(2):163–81. [DOI] [PMC free article] [PubMed] [Google Scholar]
- 45.Cummins S, Flint E, Matthews SA. New neighborhood grocery store increased awareness of food access but did not alter dietary habits or obesity. Health Aff (Millwood). 2014;33(2):283–91. [DOI] [PMC free article] [PubMed] [Google Scholar]
- 46.Elbel B, Moran A, Dixon LB, et al. Assessment of a government-subsidized supermarket in a high-need area on household food availability and children’s dietary intakes. Public health nutrition. 2015;18(15):2881–90. [DOI] [PMC free article] [PubMed] [Google Scholar]
- 47.Pitt E, Gallegos D, Comans T, et al. Exploring the influence of local food environments on food behaviours: a systematic review of qualitative literature. Public health nutrition. 2017;20(13):2393–405. [DOI] [PMC free article] [PubMed] [Google Scholar]
- 48.Elfassy T, Yi S, C. N. Perceived Access to fresh fruits & vegetables in New York City. Epi Data Brief, New York City Department of Health and Mental Hygiene. Available at: http://www.nyc.gov/html/doh/downloads/pdf/epi/databrief49.pdf. Accessed August 25, 2014. 2014. [Google Scholar]
- 50.Fang J, Foo SH, Jeng JS, et al. Clinical characteristics of stroke among Chinese in New York City. Ethn Dis. 2004;14(3):378–83. [PubMed] [Google Scholar]
- 51.Fei K, Rodriguez-Lopez JS, Ramos M, et al. Racial and Ethnic Subgroup Disparities in Hypertension Prevalence, New York City Health and Nutrition Examination Survey, 2013–2014. Prev Chronic Dis. 2017;14:E33. [DOI] [PMC free article] [PubMed] [Google Scholar]
- 52.Rajpathak SN, Gupta LS, Waddell EN, et al. Elevated risk of type 2 diabetes and metabolic syndrome among Asians and south Asians: results from the 2004 New York City HANES. Ethn Dis. 2010;20(3):225–30. [PubMed] [Google Scholar]
- 53.Huang V, Li W, Tsai J, et al. Cancer Mortality among Asians and Pacific Islanders in New York City, 2001–2010. J Cancer Epidemiol. 2013;2013:986408. [DOI] [PMC free article] [PubMed] [Google Scholar]
- 54.Jose PO, Frank AT, Kapphahn KI, et al. Cardiovascular disease mortality in Asian Americans. J Am Coll Cardiol. 2014;64(23):2486–94. [DOI] [PMC free article] [PubMed] [Google Scholar]
- 55.Malespin M, Sleesman B, Lau A, et al. Prevalence and correlates of suspected nonalcoholic fatty liver disease in Chinese American children. J Clin Gastroenterol. 2015;49(4):345–9. [DOI] [PubMed] [Google Scholar]
- 56.Zhou N, Cheah CS. Ecological risk model of childhood obesity in Chinese immigrant children. Appetite. 2015;90:99–107. [DOI] [PMC free article] [PubMed] [Google Scholar]
- 57.Chen JL, Wu Y. Cardiovascular risk factors in Chinese American children: associations between overweight, acculturation, and physical activity. J Pediatr Health Care. 2008;22(2):103–10. [DOI] [PMC free article] [PubMed] [Google Scholar]
- 58.Jih J, Mukherjea A, Vittinghoff E, et al. Using appropriate body mass index cut points for overweight and obesity among Asian Americans. Prev Med. 2014;65C:1–6. [DOI] [PMC free article] [PubMed] [Google Scholar]
- 59.Park Y, Wang S, Kitahara CM, et al. Body mass index and risk of death in Asian Americans. Am J Public Health. 2014;104(3):520–5. [DOI] [PMC free article] [PubMed] [Google Scholar]
- 60.Rajpathak SN, Wylie-Rosett J. High prevalence of diabetes and impaired fasting glucose among Chinese immigrants in New York City. J Immigr Minor Health. 2011;13(1):181–3. [DOI] [PMC free article] [PubMed] [Google Scholar]
- 61.Shih M, Du Y, Lightstone AS, et al. Stemming the tide: rising diabetes prevalence and ethnic subgroup variation among Asians in Los Angeles County. Prev Med. 2014;63:90–5. [DOI] [PubMed] [Google Scholar]
- 62.Thompson CA, Gomez SL, Hastings KG, et al. The Burden of Cancer in Asian Americans: A Report of National Mortality Trends by Asian Ethnicity. Cancer Epidemiol Biomarkers Prev. 2016;25(10):1371–82. [DOI] [PMC free article] [PubMed] [Google Scholar]
- 63.Tsai CF, Thomas B, Sudlow CL. Epidemiology of stroke and its subtypes in Chinese vs white populations: a systematic review. Neurology. 2013;81(3):264–72. [DOI] [PMC free article] [PubMed] [Google Scholar]
- 64.Wong RJ, Chou C, Sinha SR, et al. Ethnic disparities in the association of body mass index with the risk of hypertension and diabetes. Journal of community health. 2014;39(3):437–45. [DOI] [PubMed] [Google Scholar]
- 65.Yi SS, Kwon SC, Wyatt L, et al. Weighing in on the hidden Asian American obesity epidemic. Prev Med. 2015;73:6–9. [DOI] [PMC free article] [PubMed] [Google Scholar]
- 66.Mayeda ER, Glymour MM, Quesenberry CP, et al. Inequalities in dementia incidence between six racial and ethnic groups over 14 years. Alzheimers Dement. 2016;12(3):216–24. [DOI] [PMC free article] [PubMed] [Google Scholar]
- 67.Mehta KM, Yeo GW. Systematic review of dementia prevalence and incidence in United States race/ethnic populations. Alzheimers Dement. 2017;13(1):72–83. [DOI] [PubMed] [Google Scholar]
- 68.Bellavia A, Larsson SC, Bottai M, et al. Fruit and vegetable consumption and all-cause mortality: a dose-response analysis. Am J Clin Nutr. 2013;98(2):454–9. [DOI] [PubMed] [Google Scholar]
- 69.Boeing H, Bechthold A, Bub A, et al. Critical review: vegetables and fruit in the prevention of chronic diseases. Eur J Nutr. 2013;51(6):637–63. [DOI] [PMC free article] [PubMed] [Google Scholar]
- 70.Dauchet L, Amouyel P, Hercberg S, et al. Fruit and vegetable consumption and risk of coronary heart disease: a meta-analysis of cohort studies. J Nutr. 2006;136(10):2588–93. [DOI] [PubMed] [Google Scholar]
- 71.He FJ, Nowson CA, MacGregor GA. Fruit and vegetable consumption and stroke: meta-analysis of cohort studies. Lancet. 2006;367(9507):320–6. [DOI] [PubMed] [Google Scholar]
- 72.Morris MC. Nutrition and risk of dementia: overview and methodological issues. Ann N Y Acad Sci. 2016;1367(1):31–7. [DOI] [PMC free article] [PubMed] [Google Scholar]
- 73.Harris PA, Taylor R, Thielke R, et al. Research electronic data capture (REDCap)--a metadata-driven methodology and workflow process for providing translational research informatics support. J Biomed Inform. 2009;42(2):377–81. [DOI] [PMC free article] [PubMed] [Google Scholar]
- 74.DiSantis KI, Hillier A, Holaday R, et al. Why do you shop there? A mixed methods study mapping household food shopping patterns onto weekly routines of black women. Int J Behav Nutr Phys Act. 2016;13:11. [DOI] [PMC free article] [PubMed] [Google Scholar]
- 75.Stephenson M. Development and validation of the Stephenson Multigroup Acculturation Scale (SMAS). Psychol Assess. 2000;12(1):77–88. [PubMed] [Google Scholar]
- 76.Hager ER, Quigg AM, Black MM, et al. Development and validity of a 2-item screen to identify families at risk for food insecurity. Pediatrics. 2010;126(1):e26–32. [DOI] [PubMed] [Google Scholar]
- 77.Texas A&M GeoServices. http://geoservices.tamu.edu/ [
- 78.Wolfson JA, Bleich SN. Is cooking at home associated with better diet quality or weight-loss intention? Public health nutrition. 2015;18(8):1397–406. [DOI] [PMC free article] [PubMed] [Google Scholar]
- 79.United States Department of Agriculture. Economic Research Service. America’s Eating Habits: Food Away from Home 2018. [Available from: https://www.ers.usda.gov/publications/pub-details/?pubid=90227.
- 80.Emond JA, Madanat HN, Ayala GX. Do Latino and non-Latino grocery stores differ in the availability and affordability of healthy food items in a low-income, metropolitan region? Public health nutrition. 2012;15(2):360–9. [DOI] [PMC free article] [PubMed] [Google Scholar]
- 81.Rawlins E, Baker G, Maynard M, et al. Perceptions of healthy eating and physical activity in an ethnically diverse sample of young children and their parents: the DEAL prevention of obesity study. J Hum Nutr Diet. 2013;26(2):132–44. [DOI] [PMC free article] [PubMed] [Google Scholar]
- 82.Cannuscio CC, Hillier A, Karpyn A, et al. The social dynamics of healthy food shopping and store choice in an urban environment. Social science & medicine (1982). 2014;122:13–20. [DOI] [PubMed] [Google Scholar]
- 83.Webber CB, Sobal J, Dollahite JS. Shopping for fruits and vegetables. Food and retail qualities of importance to low-income households at the grocery store. Appetite. 2010;54(2):297–303. [DOI] [PubMed] [Google Scholar]
- 84.Sanchez-Flack J, Pickrel JL, Belch G, et al. Examination of the Relationship between In-Store Environmental Factors and Fruit and Vegetable Purchasing among Hispanics. International journal of environmental research and public health. 2017;14(11). [DOI] [PMC free article] [PubMed] [Google Scholar]
- 85.Ayala GX, Baquero B, Laraia BA, et al. Efficacy of a store-based environmental change intervention compared with a delayed treatment control condition on store customers’ intake of fruits and vegetables. Public health nutrition. 2013;16(11):1953–60. [DOI] [PMC free article] [PubMed] [Google Scholar]
- 86.Truong L, Tat J, Booy M, et al. The Asian Grocery Store-Based Cancer Education Program: Creating New Education Modules. Journal of cancer education : the official journal of the American Association for Cancer Education. 2016;31(2):292–300. [DOI] [PMC free article] [PubMed] [Google Scholar]
- 87.Oldenburg R Celebrating the third place : inspiring stories about the “great good places” at the heart of our communities. New York: Marlowe & Co.; 2001. x, 224 p. p. [Google Scholar]
- 88.Adam A, Jensen JD. What is the effectiveness of obesity related interventions at retail grocery stores and supermarkets? -a systematic review. BMC public health. 2016;16(1):1247. [DOI] [PMC free article] [PubMed] [Google Scholar]
- 89.Nikolaus CJ, Muzaffar H, Nickols-Richardson SM. Grocery Store (or Supermarket) Tours as an Effective Nutrition Education Medium: A Systematic Review. J Nutr Educ Behav. 2016;48(8):544–54.e1. [DOI] [PubMed] [Google Scholar]
- 90.Gore R, Patel S, Choy C, et al. Influence of organizational and social contexts on the implementation of culturally adapted hypertension control programs in Asian American-serving grocery stores, restaurants, and faith-based community sites: a qualitative study. Transl Behav Med. 2019. [DOI] [PMC free article] [PubMed]
- 91.Kim SS, Rideout C, Han HW, et al. Implementing a Targeted and Culturally Tailored Policy, Systems, and Environmental Nutrition Strategy to Reach Korean Americans. Prog Community Health Partnersh. 2018;12(1):73–81. [DOI] [PMC free article] [PubMed] [Google Scholar]
- 92.Wong J, Russo R, Min D, et al. Cultural Dietary Norms and Associated Factors in an Urban-Dwelling Chinese American Community Sample (P04–129-19). Current Developments in Nutrition. 2019;3(Supplement_1). [Google Scholar]
- 93.Adjoian TK, Firestone MJ, Eisenhower D, et al. Validation of self-rated overall diet quality by Healthy Eating Index-2010 score among New York City adults, 2013. Prev Med Rep. 2016;3:127–31. [DOI] [PMC free article] [PubMed] [Google Scholar]
Associated Data
This section collects any data citations, data availability statements, or supplementary materials included in this article.