

Abstract
Feeding behavior is a fundamental aspect of energy homeostasis and is crucial for animal survival. This process is regulated by a multitude of neurotransmitters including neuropeptides within a complex neuroendocrine system. Given the high chemical complexity and wide distribution of neuropeptides, the precise molecular mechanisms at the cellular and network levels remain elusive. Here we report comparative neuropeptidomic analysis of brain and major neuroendocrine organ in a crustacean model organism in response to feeding. A multi-faceted approach employing direct tissue matrix-assisted laser desorption/ionization mass spectrometry (MALDI-MS), stable isotopic labeling of neuropeptide extracts for quantitation, and mass spectrometric imaging (MSI) has been employed to obtain complementary information on the expression changes of a large array of neuropeptides in the brain and the pericardial organ (PO) in the crab Cancer borealis. Multiple neuropeptides exhibited changes in abundance after feeding, including RFamides, Cancer borealis tachykinin related peptides (CabTRPs), RYamides, and pyrokinins. By combining quantitative analysis of neuropeptide changes via isotopic labeling of brain extract and MSI mapping of neuropeptides of brain slices, we identified the boundary of olfactory lobe (ON) and median protocerebrum (MPC) area as two potential feeding centers in the crab brain.
Keywords: Feeding, Neuropeptide, Cancer borealis, Quantitation, MALDI mass spectrometric imaging (MSI), MALDI-TOF/TOF
Introduction
Regulation of food intake and body weight is a complex physiological process involving interactions between the nervous system and peripheral signals (1-3). It is suggested that three aspects are involved in the feeding regulation, including a sensor that monitors the level of energy, a nervous system that receives and integrates signals from circulating hormones, and an effecter system that influences energy intake and energy expenditure (4). As one of the most important and complex classes of signaling molecules, many neuropeptides have been demonstrated to play critical roles in this process. For instance, several neuropeptides present in the hypothalamus including neuropeptide Y (NPY), orexin, galanin, proopiomelanocortin (POMC), melanin-concentrating hormone (MCH), neurotensin, cholecystokinin (CCK), bombesin, corticortropin-releasing factor, and tachykinin can either stimulate or decrease food intake (5-9). However, the interplay between these neuropeptides and hormones at the system level is largely unknown due to the enormous technical challenges of studying the complex mammalian nervous system. In contrast, invertebrate nervous systems offer simpler yet relevant model systems for gaining insight into the functional roles of neuropeptides in feeding (10-12).
Increasing evidence suggests that many of the signaling molecules and pathways underlying complex behaviors such as feeding are conserved across species and animal phyla. For example, the conserved NPY signaling pathway has been strongly implicated in the regulation of food intake behaviors in vertebrates and in C. elegans (13, 14). More recently, Drosophila neuropeptide F, a human NPY homologue, was reported to mediate food signaling through a conserved pathway (15). Furthermore, a remarkably large and diverse group of RFamides has been characterized in invertebrates (16, 17), and members of the RFamide family have been shown to influence feeding behavior in both vertebrates and invertebrates (18). However, the interactions of multiple peptidergic systems at the network levels are not well understood. To study the peptidergic regulation of feeding, Cancer borealis nervous system is a particularly attractive invertebrate preparation due to the well-defined neural circuits in the stomatogastric nervous system (STNS) and its extensive neuromodulation by various neuromodulators including numerous neuropeptides (11, 19). The neuropeptide complement of C. borealis has been extensively studied by immunohistochemistry (20) and mass spectrometry (21-25).
Conventionally the identification of appetite regulators has been achieved by the use of peptide injections followed by measurements of food intake, molecular cloning in combination with gene expression study and radioimmunoassay (26-28). Recently the advancement of mass spectrometry-based techniques enabled more rapid and global analysis of neuropeptide expression in response to food intake. Fricker and coworkers reported the use of isotopic labeling with trimethylammoniumbutyryl (TMAB) N-hydroxysuccinimide coupled to liquid chromatography (LC)/MS/MS for large-scale peptidomic changes in Cpefat/fat mouse hypothalamus by food deprivation and exercise (29).
In this study, we combine direct tissue analysis and stable isotope labeling to investigate tissue-specific expression and distribution of neuropeptides in crustacean brain and pericardial organ (PO) upon feeding. In addition, we employ MALDI MS imaging to examine the spatial distribution of neuropeptides in the brain, which shows site-specific neuropeptide expression changes induced by feeding. Collectively, this study demonstrates that MS-based large-scale quantitative peptidomic investigation enables simultaneous determination of the coordinated changes of a large number of neuropeptides in feeding in a well-defined neuronal structure. This information can be combined with single-cell physiology of feeding circuit to provide further insights into neuropeptide regulation of feeding behavior at the network and cellular levels.
Results and Discussion
Feeding behavior is regulated by multiple neuropeptides within the extremely complex nervous system. A better understanding of the neural circuitry that controls this process requires knowledge of the full cast of molecular players and their mode of action on each of the elements of the circuits. Here, we employed a powerful multifaceted MS-based platform for sensitive and high throughput comparative analysis of a panel of neuropeptides under different feeding states. Furthermore, the MSI technique enables precise localization of peptide expression and differential mapping of peptide isoforms of the same peptide family. Based on this integrated methodology, a large array of neuropeptides can be investigated simultaneously for their roles in feeding process.
Study of Peptide Expression Level Changes in Brain Tissue using Isotopic Formaldehyde Labeling
Figure 1 shows a representative MALDI-TOF/TOF spectrum obtained from a single brain extract. The identities of neuropeptides were assigned by a combination of accurate mass matching against an in-house organ-specific neuropeptide database of C. borealis (30) and collision-induced dissociation (CID) sequence-specific fragmentation. A total of 51 neuropeptides were detected in a single spectrum, which belong to 15 families, including RFamide, CabTRP, A- type, B-type and C-type allatostatins, RYamide, orcokinin, orcomyotropin, proctolin, crustacean cardioactive peptide (CCAP), corazonin, pigment dispersing hormone (PDH), pyrokinin, SIFamide, and YRamide.
Figure 1.
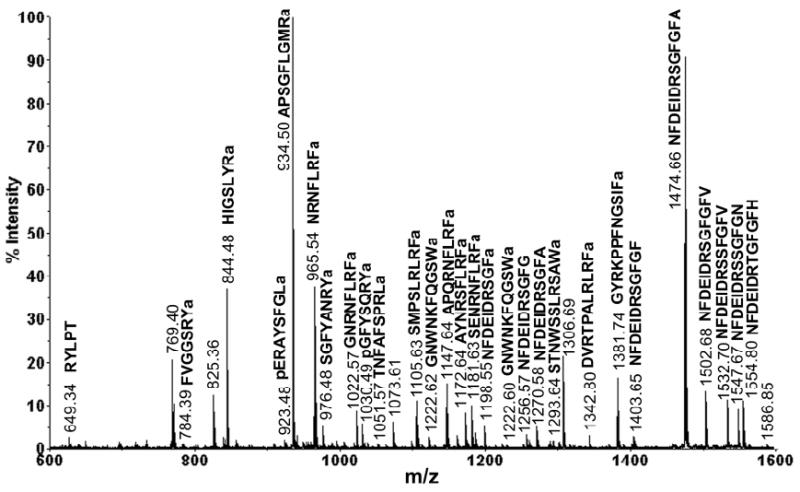
Neuropeptide detection of a single brain extract on MALDI-TOF/TOF. The abundant peaks in the spectrum are labeled with their masses and amino acid sequences. These peptides belong to several neuropeptide families including RFamide, crustacean tachykinin related peptide (CabTRP), RYamide, orcokinin, YRamide, SIFamide and proctolin.
In order to accurately measure the quantitative changes of neuropeptide expression in animals under different feeding states, stable isotopic labeling with formaldehyde was employed. This labeling technique has been reported as a fast and simple reaction that can be applied for differential proteomic and peptidomic analyses (31). MALDI-TOF/TOF analysis of a mixture of differentially labeled control brain extract combined with 1:1 ratio showed approximately 1:1 ratios of each labeled peptide pairs (Figure 2), validating the labeling methodology. As a result, 25 neuropeptides from 9 families were examined in the feeding study. Reverse labeling experiments of two pericardial organ extract samples have also been performed, which showed that the H2-formaldehyde and D2-formaldehyde have the same labeling efficiency (Figure S1). Using this method, we examined the quantitative changes of neuropeptide expression in the brains from five groups of fasting and satiated crabs. Figure 3 shows a representative MALDI-TOF/TOF mass spectrum obtained from one group of brain extracts. Several neuropeptide families exhibited increase in ion abundance after feeding, including CabTRPs, RFamides, YRamide and a few others. Table 1 lists the five groups of average abundance ratios for 25 neuropeptides present in fed crab brain versus unfed crab brain. The mean ratios averaged for five groups of data and their p values were included. A graphic representation of abundance ratios for each examined neuropeptide (expressed as characteristic m/z values) in fed crab versus unfed crab was provided in Figure S2.
Figure 2.
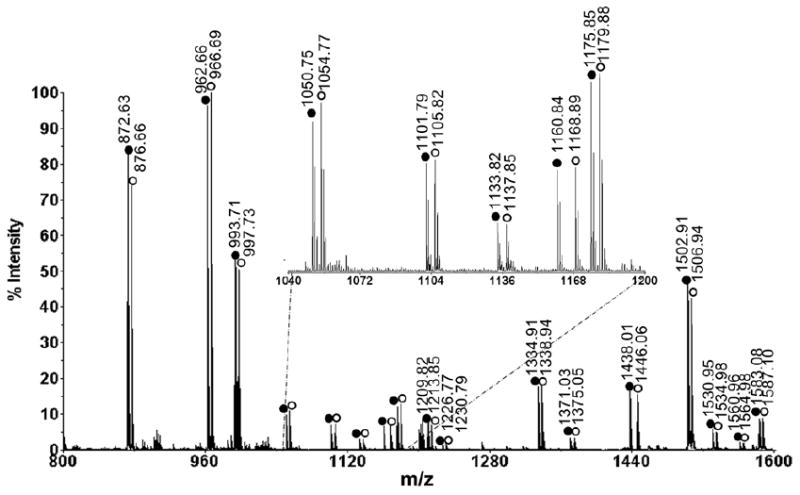
MALDI-TOF/TOF mass spectrum of isotopic formaldehyde labeled mixture from brain extracts. Two aliquots of C18 ziptip processed brain extract of the same volume are labeled with formaldehyde or deuterium formaldehyde in the same way and mixed with ratio of 1:1. The D2-formaldehyde (FD2) labeled peaks are indicated with open circles, and the H2-formaldehyde (FH2) labeled peaks are indicated with closed circles. There are 4 Da mass differences between each labeled pairs.
Figure 3.
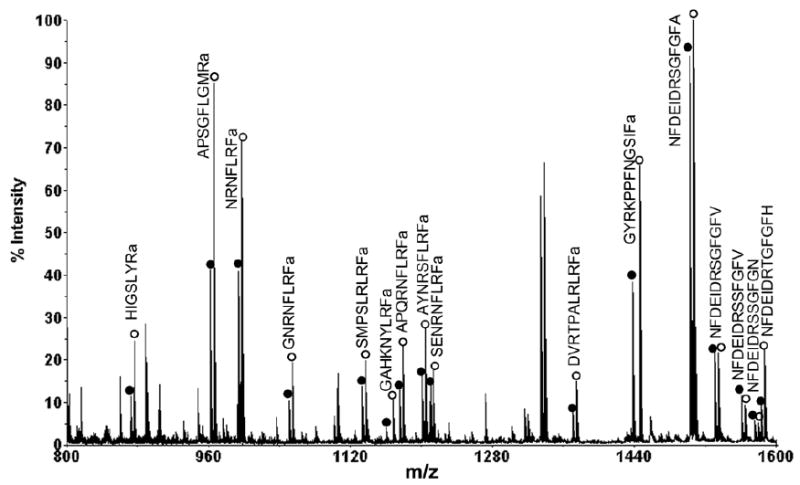
Representative MALDI-TOF/TOF mass spectrum of isotopic formaldehyde labeled mixture of brain extracts from fed and unfed crabs. Three crab brains were used to make each extract. Unfed sample was labeled with FH2 and fed sample was labeled with FD2. The heavy labeled peaks are indicated with open circles, and the light labeled peaks are indicated with closed circles. The peak pairs from several abundant neuropeptides are indicated and labeled with their corresponding amino acid sequences.
Table 1. Ratios of neuropeptide abundances in the brain tissues collected from fed crabs versus unfed crabs (N=5).
| Family | m/z | sequence | 1 | 2 | 3 | 4 | 5 | Raverage | SDaverage | p value |
|---|---|---|---|---|---|---|---|---|---|---|
| RFamide | 965.54 | NRNFLRFamide | 1.35 | 1.12 | 1.14 | 1.49 | 1.65 | 1.35 | 0.22 | <0.001 |
| 1022.57 | GNRNFLRFamide | 1.21 | 1.16 | 1.10 | 1.50 | 1.82 | 1.36 | 0.30 | 0.002 | |
| 1104.61 | GAHKNYLRFamide | 1.80 | 1.14 | 1.30 | 1.96 | 2.58 | 1.76 | 0.57 | <0.001 | |
| 1105.63 | SMPSLRLRFamide | 1.18 | 1.32 | 0.91 | 1.44 | 1.33 | 1.23 | 0.20 | 0.009 | |
| 1147.65 | APQRNFLRFamide | 1.25 | 1.07 | 1.04 | 1.48 | 1.84 | 1.34 | 0.33 | 0.007 | |
| 1172.63 | AYNRSFLRFamide | 1.59 | 1.53 | 1.3 | 1.61 | 1.46 | 1.5 | 0.12 | <0.001 | |
| 1181.62 | SENRNFLRFamide | 0.88 | 1.06 | 0.99 | 1.46 | 1.87 | 1.257 | 0.40 | 0.102 | |
| 1288.68 | QDLDHVFLRFamide | 0.75 | 0.67 | 0.87 | 1.01 | 1.05 | 0.87 | 0.16 | 0.033 | |
| 1342.81 | DVRTPALRLRFamide | 1.11 | 1.03 | 0.65 | 1.40 | 1.13 | 1.07 | 0.27 | 0.756 | |
| Orcokinin | 1198.55 | NFDEIDRSGFamide | 1.73 | 0.84 | 1.12 | 1.56 | 1.6 | 1.37 | 0.37 | 0.022 |
| 1270.57 | NFDEIDRSGFA | 0.79 | 1.94 | 0.92 | 2.57 | 1.19 | 1.48 | 0.75 | 0.118 | |
| 1474.63 | NFDEIDRSGFGFA | 1.19 | 0.84 | 1.04 | 1.06 | 1.14 | 1.05 | 0.13 | 0.304 | |
| 1502.70 | NFDEIDRSGFGFV | 1.19 | 0.88 | 1.17 | 1.02 | 1.13 | 1.08 | 0.12 | 0.124 | |
| 1532.70 | NFDEIDRSSFGFV | 1.25 | 0.71 | 1.42 | 0.92 | 1.03 | 1.07 | 0.27 | 0.702 | |
| 1547.68 | NFDEIDRSSFGFN | 1.15 | 0.56 | 1.02 | 0.97 | 1.14 | 0.97 | 0.24 | 0.542 | |
| 1554.70 | NFDEIDRTGFGFH | 1.87 | 0.94 | 0.87 | 1.95 | 2.13 | 1.55 | 0.59 | 0.028 | |
| RYamide | 784.41 | FVGGSRYamide | 1.87 | 1.05 | 1.30 | 1.80 | n.a | 1.50 | 0.39 | 0.009 |
| 976.46 | SGFYANRYamide | 1.34 | 1.26 | 1.06 | 1.6 | 1.83 | 1.42 | 0.30 | 0.001 | |
| CabTRPs | 934.49 | APSGFLGMRamide | 2.33 | 1.43 | 1.61 | 1.94 | 3.14 | 2.09 | 0.67 | <0.001 |
| 964.50 | TPSGFLGMRamide | n.a | 1.84 | 1.59 | 3.08 | 4.37 | 2.72 | 1.27 | <0.001 | |
| Proctolin | 649.37 | RYLPT | 3.80 | 1.31 | 1.47 | n.a | n.a | 2.19 | 1.39 | 0.038 |
| CCAP | 956.38 | PFcNAFTGcamide | 1.00 | 1.44 | 1.26 | 1.08 | n.a | 1.19 | 0.19 | 0.037 |
| YRamide | 844.48 | HIGSLYRamide | 8.29 | 1.07 | 2.82 | 1.61 | 3.21 | 3.4 | 2.86 | 0.002 |
| Pyrokinin | 1037.55 | SGGFAFSPRLamide | 0.86 | 0.58 | 0.70 | 0.88 | n.a | 0.75 | 0.14 | <0.001 |
| SIFamide | 1381.74 | GYRKPPFNGSIFamide | 1.06 | 1.09 | 0.93 | 1.58 | 1.39 | 1.20 | 0.26 | 0.038 |
Note: Peptides indicated in bold and italics exhibited significant changes in feeding.
Cancer borealis Tachykinin Related Peptides (CabTRPs)
Significant changes were observed for members from several neuropeptide families (p<0.01), indicated with bold letter in Table 1. Two CabTRPs (m/z 934.49 and m/z 964.50) were detected to be consistently elevated in fed crab brain from 1.4 to 4.4 fold in all five groups of preparations with mean ratios of 2.1 and 2.7 (p<0.001). Tachykinin peptide family has been extensively identified throughout the animal kingdom ranging from invertebrates to mammals with various physiological effects on both of the central nervous system (CNS) and peripheral tissues (32-34). It was reported previously that two mammalian tachykinin peptides neuropeptide K and substance P can acutely and consistently suppress feeding behavior in rat (35, 36). In another feeding study with goldfish, the level of r-preprotachykinin mRNA was increased after a meal in the brain (37). In crustaceans, tachykinin related peptides have been isolated and characterized in both the CNS and the STNS as well as in midgut endocrine cells (38-41); previous studies showed excitatory effects of both CabTRP 1a (38) and CabTRP II (41) peptides on the pyloric motor pattern, suggesting its involvement in food processing. The presence and distribution of both CabTRP 1a and CabTRP II in neural tissue as well as midgut tissues have been documented in numerous Cancer crabs (41) and lobster H. americanus (40), further supporting its potential roles associated with feeding. Here, we provide the first direct evidence that the levels of these two crustacean tachykinin related peptides are elevated in crab brain after food intake, which suggests that this peptide family is involved with food intake in decapod crustaceans. This observation also agrees well with previous reports on the roles of tachykinin-related peptides (TKRPs) in feeding in various insects (42). For instance, dramatic TKRPs expression level changes were observed during foraging in the brain of honey bee probed by quantitative mass spectrometry (43). In addition, in cockroach, starvation led to a decrease of the level of LemTRP-1 in the midgut, whereas its level in hemolymph was elevated, suggesting that LemTRP-1 was released from midgut to hemolymph to sustain food consumption (44). In our previous study, we also observed higher level of CabTRPs in circulating fluid hemolymph in unfed crabs, suggesting that these peptides might possibly be released from midgut endocrine cells under starvation (45). Interestingly, we demonstrate here that CabTRPs are accumulated to a higher level in the brain after feeding compared with unfed crabs, which may be due to less CabTRPs being released into the hemolymph after feeding.
FMRFamide Related Peptides
The abundances of several RFamides, including NRNFLRFamide (m/z 965.54), GAHKNYLRFamide (m/z 1104.61), SMPSLRLRFamide (m/z 1105.63), APQRNFLRFamide (m/z 1147.65), GNRNFLRFamide (m/z 1022.57), AYNRSFLRFamide (m/z 1172.63), were significantly increased in brain from fed animals, but by smaller extent (∼1.5 fold) compared to CabTRPs. RFamide-related peptides represent a large neuropeptide family identified in the nervous systems of animals across all major phyla with diverse functions (46-48). The anorexigenic role of RFamide in feeding regulation in mice was first suggested 20 years ago (49), followed by increasing evidence of the involvement of this peptide family in feeding from many other animal models (47). The quantitative studies described here show increased levels of several RFamide isoforms in crab brain after meal, suggesting RFamides may also function as anorexigenic signaling molecules in crab.
RYamides and YRamide
RYamide FVGGSRYamide (m/z 784.41), SGFYANRYamide (m/z 976.46) and YRamide HIGSLYRamide (m/z 844.48) also exhibited higher abundances in fed crab. RYamide peptide family was first discovered in the pericardial organ of C. borealis (24), and thus far the physiological effects of this family are largely unknown. HIGSLYRamide was identified recently from the pericardial organ and sinus gland of C. productus (50), and subsequently this peptide was also found in the sinus gland, brain and STNS of C. borealis (22, 25). So far no physiological study has been reported for this peptide. The quantitative analysis of neuropeptidomes in response to feeding described here showed that both peptides exhibited increase in relative abundance in crab brain after food intake, suggesting their potential relationship with feeding.
Pyrokinin
Conversely, a pyrokinin (m/z 1037.55) was detected to be significantly reduced compared with the brain extract sampled from unfed animals (p<0.001). Among the nine neuropeptide families that were examined in this study, pyrokinin was the only one showing significant reduction in relative ion abundance ratio in crab brain after food intake. Electrophysiological study has shown that pyrokinins excite gastric mill circuit neurons and elicit the gastric mill rhythm (chewing) in the isolated STG from C. borealis (51). Therefore, it is not surprising to see the change of pyrokinin content in brain after food intake. Further physiological experiments are needed to establish the precise roles of this peptide in feeding.
Peptides not Changed in the Brain after Feeding
Orcokinin was one of the most abundant neuropeptide families present in the crab brain, and majority of members in this family did not exhibit significant changes in abundance upon feeding. Most orcokinin peptides detected in fed and unfed animals were around 1.0 in all five groups of preparations. In addition, several other neuropeptides, such as SIFamide and CCAP did not change relative abundance significantly upon feeding.
The MS based quantitation study of multiple families of neuropeptides in crab brains offers an initial glimpse of the diverse assortment of neuropeptides involved in feeding behavior and provides the basis for subsequent biochemical and physiological studies. The differential expression of neuropeptide isoforms within various peptide families upon feeding also provides important biological insights into possible functional consequences of large peptide diversity and multiplicity in the context of food intake. Some of these neuropeptides may play roles in control or termination of food intake, and some of them may be downstream changes or indirectly affected by the feeding states of the animals. Future studies will be performed to test the actions of certain target neuropeptides on the neural circuits. In addition, behavioral study followed by infusion of particular neuropeptides into the animal will allow us to further understand the physiological consequences of the neuropeptides examined in this study.
Spatial Mapping of Neuropeptides Involved in Feeding in C. borealis Brain by MALDI Mass Spectrometric Imaging
To investigate correlation of neuropeptide expression and localization, MALDI MS imaging was employed to map the distribution of several neuropeptides of interest in the brain. Tissues were collected from the middle region of the brain and mass spectral images of numerous neuropeptides were obtained. The structure and morphology of C. borealis brain has been well studied (52). As shown in Figure 4a, the main body of the decapod crustacean brain consists of three contiguous brain regions, including the median protocerebrum (MPC), deutocerebrum (DC), and tritocerebrum (TC). There are five major neuropils in a crab brain, including anterior (AMPN) and posterior medial protocerebral neuropil (PMPN), olfactory lobe (ON), lateral antenna I neuropil (LAN) and antenna II neuropil (AnN). Three of the neuronal clusters were indicated, including 9, 10 on the boundary of ON and 6 between AMPN and PMPN. Figure 4b shows the optical micrograph of a brain slice on the MALDI plate with a thin layer of DHB matrix coating. Figure 4c shows several example images of neuropeptides present in the brain, including three RFamides, two orcokinins and CabTRP 1a. Most RFamides, such as NRNFLRFamide (m/z 965.54) and GAHKNYLRFamide (m/z 1104.65), are concentrated in AMPN and PMPN (Figure 4c i, ii). CabTRP 1a (APSGFLGMRamide, m/z 934.49) is the most abundant peptide in the crab brain, and it is extensively present in most areas of brain, however it has higher concentration in the inner boundary of ON (Figure 4c iv). Previous immunocytochemical study has also shown similar distribution of these two neuropeptide families in the brain of other crustacean species (53, 54). Most isoforms of the orcokinin family, such as NFDEIDRSGFGFA (m/z 1474.70), are expressed in high abundance in AnN (Figure 4c v), however, unlike CabTRPs and RFamides, most orcokinin members are not seen in the MPC region. Most isoforms from the same family are localized in identical brain areas, although several exceptions are seen. For instance, one of the orcokinin NFDEIDRTGFGFH (m/z 1554.70, Figure 4c vi) exhibits distinct distribution pattern from the other isoforms of the family, while displaying similar spatial patterns as the RFamides and exhibiting high abundance in the MPC region. Another example is DVRTPALRLRFamide (m/z 1342.81), which is only detected with high abundance in AnN.
Figure 4.
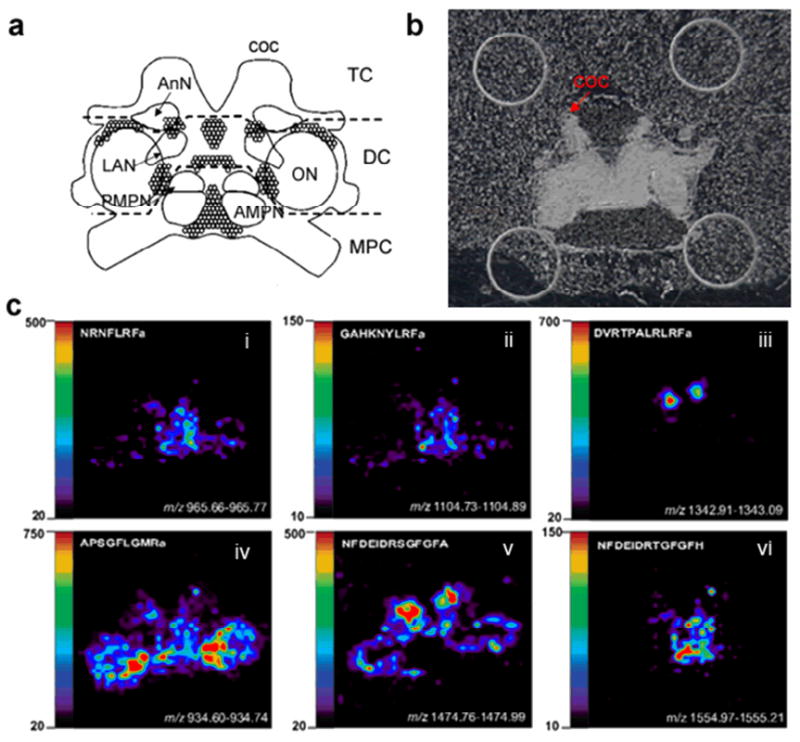
Neuropeptide localization in the C. borealis brain. (a) Representation of the ventral surface of the isolated brain with labeled neuropil region and neuronal clusters. The main body of the decapod crustacean brain consists of three contiguous brain regions, including the median protocerebrum (MPC), deutocerebrum (DC), and tritocerebrum (TC). The coc projects from the tritocerebrum to the thoracic ganglion (TG). Five major neuropils in crab brain include anterior (AMPN) and posterior medial protocerebral neuropil (PMPN), olfactory lobe (ON), lateral antenna I neuropil (LAN) and antenna II neuropil (AnN). Neuronal clusters 6 in the MPC and 9, 10 near ON are projected to STNS through coc. (b) Optical micrograph of a brain slice on MALDI plate coated with thin layer of DHB matrix. The coc nerve is arranged on the top as indicated. (c) MALDI-MS images of several neuropeptides of interest from three families, including three RFamides, CabTRP 1a and orcokinins with DVRTPALRLRFa and NFDEIDRTGFGFH showing distinct localization from the general distribution trend of their respective families. Note: The orientation of the above three figures is the same.
The functions of signaling molecules in a complex neuronal structure or an organism are often related to their locations. Based on the current study, most of these feeding related neuropeptides including CabTRPs and several RFamides were detected in the MPC region or around ON boundary (Figure 4c i, ii and iv). In contrast, most of the orcokinin family members which did not show changes upon feeding were more intensively expressed in AnN (Figure 4c v). Furthermore, MALDI mass spectral images also showed the differential expression of family isoforms in a region-specific manner and possible association with feeding. For example, in contrast to several RFamides displaying differences in response to feeding, several RFamide isoforms were unchanged after feeding (Table 1), such as DVRTPALRLRFamide (m/z 1342.81). MALDI image showed that this peptide was only present in the AnN region (Figure 4c iii), which was distinctly different from the other RFamides involved in feeding. Likewise, such differential localization of neuropeptides was observed for the orcokinin family as well. The relative ion abundance ratios of most orcokinins between brain tissues from unfed and fed crabs were around 1:1, and these peptides were more concentrated in AnN and were not detected in the MPC region. However, NFDEIDRTGFGFH (m/z 1554.70) was expressed at higher level after feeding (∼1.5 fold) and interestingly this peptide was only detected in the MPC region and not seen in AnN. These results demonstrate that members from the same family exhibit distinct distribution patterns in the crustacean brain, and that feeding induced neuropeptide expression level changes are highly related to their localization in the brain. A single neuropeptide family may exert multiple physiological functions by expressing different isoforms in different brain regions. As reported by Kirby and Nusbaum, C. borealis brain is connected with the STNS by projection from cell clusters 6,7 (near AMPN and PMPN),9,10 (around ON) through CoG via coc fiber (52), which is consistent with the results in this study that most neuropeptides expressed at different levels after food intake are concentrated in those two regions. Therefore, it is very likely that the brain regulates the STNS motor pattern to control feeding behavior and food processing by transporting multiple neuropeptides that are expressed in these regions. In other words, MPC and ON may function as major feeding regulation centers in crustaceans. To further understand the mechanism of food intake, it will be interesting to study the level of cell-specific neuropeptide changes within the well-characterized neural network, and immunocytochemical studies and single cell analysis will be carried out for such purpose.
Neuropeptide Changes in the Pericardial Organs after Feeding
Pericardial organs (POs) are one of the major neurosecretory sites in crustacean nervous system. Figure 5 shows MALDI-TOF/TOF mass spectra of direct tissue analysis of POs from unfed (A) and fed (B) animals. Around 20 neuropeptides were detected directly from the PO tissue, including RYamides, RFamides, A-type allatostatins (AST-A) and B-type allatostatins (AST-B). 10-6 M arginine-vasopressin (AVP) was added as an internal standard. As shown in Figure 5, the neuropeptide profiles from POs in both animals were almost identical qualitatively. However, RFamides in the POs from the fed animal were detected with much lower signal intensities, and the peak intensities of several RYamides were slightly higher in the POs from the fed animal. To measure the accurate content level changes of neuropeptides in POs between unfed and fed animals, stable isotopic labeling of tissue extract was performed. Table 2 shows ratios of neuropeptide abundances in the POs between fed and unfed animals from 11 groups of preparations. Most isoforms of RFamides exhibited significant reduction in abundance in fed animals (p<0.01).
Figure 5.
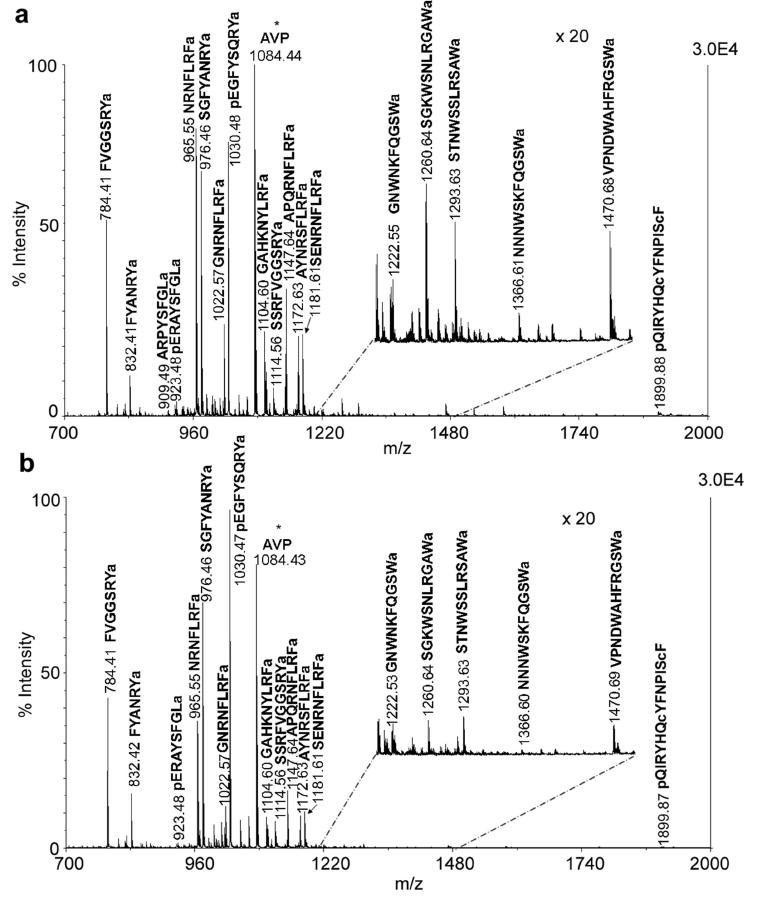
MALDI-TOF/TOF mass spectra of direct tissue analysis comparison of the POs from (a) unfed and (b) fed crabs. Tissues were collected from the same position of anterior region of the PO in both animals. Arg-vasopressin (AVP) (m/z 1084.44) was added as an internal standard indicated with asterisk. 16 neuropeptides from 4 families were detected and labeled with their masses and amino acid sequences.
Table 2. Ratios of neuropeptide abundances in the PO from fed versus unfed crabs (N=11).
| m/z | sequence | Raverage | SDratio | p value |
|---|---|---|---|---|
| RYamide | ||||
| 784.41 | FVGGSRYamide | 0.89 | 0.11 | 0.104 |
| 976.46 | SGFYANRYamide | 0.80 | 0.16 | 0.014 |
| RFamide | ||||
| 965.54 | NRNFLRFamide | 0.71 | 0.14 | 0.001 |
| 1005.57 | GPRNFLRFamide | 0.88 | 0.12 | 0.069 |
| 1022.57 | GNRNFLRFamide | 0.86 | 0.15 | 0.039 |
| 1104.61 | GAHKNYLRFamide | 0.57 | 0.07 | <0.001 |
| 1146.61 | GYSKNYLRFamide | 0.67 | 0.08 | 0.004 |
| 1147.65 | APQRNFLRFamide | 0.76 | 0.16 | 0.009 |
| 1172.63 | AYNRSFLRFamide | 0.80 | 0.11 | 0.009 |
| 1181.62 | SENRNFLRFamide | 0.68 | 0.11 | <0.001 |
| AST-B | ||||
| 1293.63 | STNWSSLRSAWamide | 0.92 | 0.16 | 0.269 |
| 1470.70 | VPNDWAHFRGSWamide | 0.82 | 0.13 | 0.078 |
Note: Peptides highlighted in bold and italics exhibited significant changes (p<0.001) in feeding.
Pericardial organs can release peptide hormones to modulate the motor patterns generated by neural circuits located in the STNS. One can expect the involvement of this important neurohemal organ with feeding by releasing certain neuropeptides into hemolymph. Different from trends observed in brain, most detected neuropeptides exhibited reduced levels in the POs after food intake; presumably due to possible release of these peptides from the POs after feeding. However, due to the low concentration of neuropeptides present in the circulating fluid, RFamides were rarely detected in our hemolymph profiling experiments or with very low intensity for accurate quantitative comparison (data not shown). Among the three families that were detected in the POs, RFamides were most significantly reduced (Table 2). Interestingly, although several different RFamides were changed upon feeding, GAHKNYLRFamide showed the most significant reduction among all RFamides in the POs and the greatest increase in the brain preparations (Table 1). This observation strongly suggests that GAHKNYLRFamide may play a more important role in food intake compared to other RFamides. Again, the current study demonstrates that isoforms of different amino acid sequences from a single neuropeptide family may have distinct physiological functions, therefore highlighting the unique advantages of using mass spectrometry-based peptidomics approach to reveal such isoform-specific changes in feeding.
Methods
Animals and Feeding Experiments
Jonah crabs Cancer borealis were purchased from The Fresh Lobster Company (Gloucester, Massachusetts, USA) and maintained without food in an artificial seawater tank at 12-13 °C for 10 days before use. In a feeding experiment, the crabs were fed with small pieces of seafood until they stopped, which usually took 30 to 45 minutes. Crabs were then cold anesthetized by packing them on ice for 15 minutes. Dissection was performed in chilled (approximately 10 °C) physiological saline (composition: 440 mM NaCl; 11 mM KCl; 13 mM CaCl2; 26 mM MgCl2; 10 mM HEPES acid; pH 7.4 [adjusted with NaOH]). The details of dissection were described previously (21).
Mass Spectrometry and MALDI Imaging
A model 4800 MALDI-TOF/TOF analyzer (Applied Biosystems, Framingham, MA) equipped with a 200 Hz, 355 nm Nd:YAG laser was used for direct tissue analysis, brain extract quantitation and MALDI imaging. Acquisitions were performed in positive ion reflectron mode. Instrument parameters were set using the 4000 Series Explorer software (Applied Biosystems). Mass spectra were obtained by averaging 900 laser shots covering mass range m/z 500-4000. MS/MS was achieved by 1 kV collision induced dissociation (CID) using air. MALDI mass spectrometric imaging of C. borealis brain was performed as previously described (55). Imaging acquisition was performed using the 4800 Imaging application software (www.maldi-msi.org). To generate images, spectra were collected at 100 μm intervals in both the x and y dimensions across the surface of the sample. Each mass spectrum was generated by averaging 200 laser shots over the mass range m/z 800-2000. Individual spectra were acquired using 1.0 ns binning to yield 27 812 data points per spectrum. Image files were processed and extracted ion images were created using the TissueView software package (Applied Biosystems, Framingham, MA, USA).
Sample Preparation
Direct tissue analysis was performed as described previously (21). Briefly, the tissue was rinsed in a droplet of acidified methanol (90% methanol, 9% acetic acid, 1% water, v/v/v), desalted in a droplet of dilute DHB solution (10 mg/mL, aqueous), and placed on the MALDI plate. A droplet of 0.4 μL standard mixed DHB matrix solution was deposited on top of the tissue placed on the MALDI target and allowed to crystallize at room temperature. Tissue extractions were performed by homogenizing in cooled acidified methanol as described elsewhere (30). The crude extracts were processed by C18 Ziptip according to the product instruction to remove lipids and salt before formaldehyde labeling reaction.
Quantitation using Isotopic Labeling
A 3 μL aliquot of tissue extract from brain or PO was labeled in solution by adding 0.7 μL borane pyridine (C5H8BN, 120 mM in 10% methanol), and then mixed with formaldehyde (FH2, 15% in H2O, 0.5 μL) for unfed samples or deuterium formaldehyde (FD2, 15% in H2O, 0.5 μL) for fed samples. The samples were then placed in 37 °C water bath for 20 minutes for the labeling reaction to complete. Fed and unfed samples were then mixed with 1:1 ratio. Each resulting sample was spotted on MALDI plate twice and each spot was analyzed twice, resulting in four replicate spectra. The spectra were analyzed manually and the peak pairs generated from known neuropeptides were selected for quantitative analysis. The relative abundance ratio for each neuropeptide in fed crab versus unfed crab was determined by dividing heavy labeled peak intensity with light labeled peak intensity followed by averaging the ratios from four replicate spectra. Student's t-test was performed to evaluate the differences of each peptide between fed and unfed states, and p value < 0.01 was considered as statistically significant.
Supplementary Material
Acknowledgments
The authors thank Dr. Amy Harms and Dr. Mike Sussman at the University of Wisconsin-Biotechnology Center Mass Spectrometry Facility for access to the MALDI-TOF/TOF instrument. We also wish to thank Dr. Eve Marder at Brandeis University for valuable advice and helpful discussions for preparing the paper.
Funding Sources: National Science Foundation CAREER Award (CHE-0449991) and the National Institutes of Health through grant 1R01DK071801. L.L. acknowledges an Alfred P. Sloan Research Fellowship.
Abbreviations
- MSI
Mass spectrometric imaging
- STNS
stomatogastric nervous system
- PO
pericardial organ
- MPC
median protocerebrum
- DC
deutocerebrum
- TC
tritocerebrum
- AMPN
anterior medial protocerebral neuropil
- PMPN
posterior medial protocerebral neuropil
- ON
olfactory lobe
- LAN
lateral antenna I neuropil
- AnN
antenna II neuropil
- CabTRP
Cancer borealis tachykinin related peptide
- AST
allatostatin
Footnotes
Author Contribution: R. C. and L. L. designed research; R.C., L.H., S.S.C., and J.W. performed research; R.C. analyzed data; R. C. and L. L. wrote the paper.
Supporting Information Available
Reverse isotopic formaldehyde labeling and bar graphic representation for abundance ratios for neuropeptide expression in fed crabs versus unfed crabs are included as supporting material. This information is available free of charge via the Internet at http://pubs.acs.org.
References
- 1.Schwartz MW, Woods SC, Porte D, Jr, Seeley RJ, Baskin DG. Central nervous system control of food intake. Nature. 2000;404:661–671. doi: 10.1038/35007534. [DOI] [PubMed] [Google Scholar]
- 2.Lin X, Volkoff H, Narnaware Y, Bernier NJ, Peyon P, Peter RE. Brain regulation of feeding behavior and food intake in fish. Comp Biochem Physiol A Mol Integr Physiol. 2000;126:415–434. doi: 10.1016/s1095-6433(00)00230-0. [DOI] [PubMed] [Google Scholar]
- 3.Gao Q, Horvath TL. Neurobiology of feeding and energy expenditure. Annu Rev Neurosci. 2007;30:367–398. doi: 10.1146/annurev.neuro.30.051606.094324. [DOI] [PubMed] [Google Scholar]
- 4.Jequier E, Tappy L. Regulation of body weight in humans. Physiol Rev. 1999;79:451–480. doi: 10.1152/physrev.1999.79.2.451. [DOI] [PubMed] [Google Scholar]
- 5.Valassi E, Scacchi M, Cavagnini F. Neuroendocrine control of food intake. Nut Metab Cardiovasc Dis. 2008;18:158–168. doi: 10.1016/j.numecd.2007.06.004. [DOI] [PubMed] [Google Scholar]
- 6.Jing J, Vilim FS, Horn CC, Alexeeva V, Hatcher NG, Sasaki K, Yashina I, Zhurov Y, Kupfermann I, Sweedler JV, Weiss KR. From hunger to satiety: reconfiguration of a feeding network by Aplysia neuropeptide Y. J Neurosci. 2007;27:3490–3502. doi: 10.1523/JNEUROSCI.0334-07.2007. [DOI] [PMC free article] [PubMed] [Google Scholar]
- 7.Volkoff H. The role of neuropeptide Y, orexins, cocaine and amphetamine-related transcript, cholecystokinin, amylin and leptin in the regulation of feeding in fish. Comp Biochem Physiol A Mol Integr Physiol. 2006;144:325–331. doi: 10.1016/j.cbpa.2005.10.026. [DOI] [PubMed] [Google Scholar]
- 8.Volkoff H, Canosa LF, Unniappan S, Cerda-Reverter JM, Bernier NJ, Kelly SP, Peter RE. Neuropeptides and the control of food intake in fish. Gen Comp Endocrinol. 2005;142:3–19. doi: 10.1016/j.ygcen.2004.11.001. [DOI] [PubMed] [Google Scholar]
- 9.Woods SC, Figlewicz DP, Madden L, Porte D, Jr, Sipols AJ, Seeley RJ. NPY and food intake: discrepancies in the model. Regul Pept. 1998;75-76:403–408. doi: 10.1016/s0167-0115(98)00095-0. [DOI] [PubMed] [Google Scholar]
- 10.Sweedler JV, Li L, Rubakhin SS, Alexeeva V, Dembrow NC, Dowling O, Jing J, Weiss KR, Vilim FS. Identification and characterization of the feeding circuit-activating peptides, a novel neuropeptide family of aplysia. J Neurosci. 2002;22:7797–7808. doi: 10.1523/JNEUROSCI.22-17-07797.2002. [DOI] [PMC free article] [PubMed] [Google Scholar]
- 11.Nusbaum MP, Beenhakker MP. A small-systems approach to motor pattern generation. Nature. 2002;417:343–350. doi: 10.1038/417343a. [DOI] [PMC free article] [PubMed] [Google Scholar]
- 12.Marder E. Motor pattern generation. Curr Opin Neurobiol. 2000;10:691–698. doi: 10.1016/s0959-4388(00)00157-4. [DOI] [PubMed] [Google Scholar]
- 13.Arora S, Anubhuti Role of neuropeptides in appetite regulation and obesity--a review. Neuropeptides. 2006;40:375–401. doi: 10.1016/j.npep.2006.07.001. [DOI] [PubMed] [Google Scholar]
- 14.de Bono M, Bargmann CI. Natural variation in a neuropeptide Y receptor homolog modifies social behavior and food response in C. elegans. Cell. 1998;94:679–689. doi: 10.1016/s0092-8674(00)81609-8. [DOI] [PubMed] [Google Scholar]
- 15.Shen P, Cai HN. Drosophila neuropeptide F mediates integration of chemosensory stimulation and conditioning of the nervous system by food. J Neurobiol. 2001;47:16–25. doi: 10.1002/neu.1012. [DOI] [PubMed] [Google Scholar]
- 16.Li C, Kim K, Nelson LS. FMRFamide-related neuropeptide gene family in Caenorhabditis elegans. Brain Res. 1999;848:26–34. doi: 10.1016/s0006-8993(99)01972-1. [DOI] [PubMed] [Google Scholar]
- 17.Taghert PH. FMRFamide neuropeptides and neuropeptide-associated enzymes in Drosophila. Microsc Res Tech. 1999;45:80–95. doi: 10.1002/(SICI)1097-0029(19990415)45:2<80::AID-JEMT3>3.0.CO;2-X. [DOI] [PubMed] [Google Scholar]
- 18.Dockray GJ. The expanding family of -RFamide peptides and their effects on feeding behaviour. Exp Physiol. 2004;89:229–235. doi: 10.1113/expphysiol.2004.027169. [DOI] [PubMed] [Google Scholar]
- 19.Marder E, Bucher D. Understanding circuit dynamics using the stomatogastric nervous system of lobsters and crabs. Annu Rev Physiol. 2007;69:291–316. doi: 10.1146/annurev.physiol.69.031905.161516. [DOI] [PubMed] [Google Scholar]
- 20.Christie AE, Skiebe P, Marder E. Matrix of neuromodulators in neurosecretory structures of the crab Cancer borealis. J Exp Biol. 1995;198:2431–2439. doi: 10.1242/jeb.198.12.2431. [DOI] [PubMed] [Google Scholar]
- 21.Kutz KK, Schmidt JJ, Li L. In situ tissue analysis of neuropeptides by MALDI FTMS in-cell accumulation. Anal Chem. 2004;76:5630–5640. doi: 10.1021/ac049255b. [DOI] [PubMed] [Google Scholar]
- 22.Fu Q, Goy MF, Li L. Identification of neuropeptides from the decapod crustacean sinus glands using nanoscale liquid chromatography tandem mass spectrometry. Biochem Biophys Res Commun. 2005;337:765–778. doi: 10.1016/j.bbrc.2005.09.111. [DOI] [PubMed] [Google Scholar]
- 23.Li L, Pulver SR, Kelley WP, Thirumalai V, Sweedler JV, Marder E. Orcokinin peptides in developing and adult crustacean stomatogastric nervous systems and pericardial organs. J Comp Neurol. 2002;444:227–244. doi: 10.1002/cne.10139. [DOI] [PubMed] [Google Scholar]
- 24.Li L, Kelley WP, Billimoria CP, Christie AE, Pulver SR, Sweedler JV, Marder E. Mass spectrometric investigation of the neuropeptide complement and release in the pericardial organs of the crab, Cancer borealis. J Neurochem. 2003;87:642–656. doi: 10.1046/j.1471-4159.2003.02031.x. [DOI] [PubMed] [Google Scholar]
- 25.Ma M, Wang J, Chen R, Li L. Expanding the Crustacean neuropeptidome using a multifaceted mass spectrometric approach. J Proteome Res. 2009;8:2426–2437. doi: 10.1021/pr801047v. [DOI] [PMC free article] [PubMed] [Google Scholar]
- 26.Turton MD, O'Shea D, Gunn I, Beak SA, Edwards CMB, Meeran K, Choi SJ, Taylor GM, Heath MM, Lambert PD, Wilding JPH, Smith DM, Ghatei MA, Herbert J, Bloom SR. A role for glucagon-like peptide-1 in the central regulation of feeding. Nature. 1996;379:69–72. doi: 10.1038/379069a0. [DOI] [PubMed] [Google Scholar]
- 27.Batterham RL, Cowley MA, Small CJ, Herzog H, Cohen MA, Dakin CL, Wren AM, Brynes AE, Low MJ, Ghatei MA, Cone RD, Bloom SR. Gut hormone PYY3-36 physiologically inhibits food intake. Nature. 2002;418:650–654. doi: 10.1038/nature00887. [DOI] [PubMed] [Google Scholar]
- 28.Lawrence CB, Celsi F, Brennand J, Luckman SM. Alternative role for prolactin-releasing peptide in the regulation of food intake. Nat Neurosci. 2000;3:645–646. doi: 10.1038/76597. [DOI] [PubMed] [Google Scholar]
- 29.Che FY, Yuan Q, Kalinina E, Fricker LD. Peptidomics of Cpefat/fat Mouse Hypothalamus: effect of food depriveation and exercise on peptide levels. J Biol Chem. 2005;280:4451–4461. doi: 10.1074/jbc.M411178200. [DOI] [PubMed] [Google Scholar]
- 30.Ma M, Chen R, Sousa GL, Bors EK, Kwiatkowski MA, Goiney CC, Goy MF, Christie AE, Li L. Mass spectral characterization of peptide transmitters/hormones in the nervous system and neuroendocrine organs of the American lobster Homarus americanus. Gen Comp Endocrinol. 2008;156:395–409. doi: 10.1016/j.ygcen.2008.01.009. [DOI] [PMC free article] [PubMed] [Google Scholar]
- 31.Hsu JL, Huang SY, Chow NH, Chen SH. Stable-isotope dimethyl labeling for quantitative proteomics. Anal Chem. 2003;75:6843–6852. doi: 10.1021/ac0348625. [DOI] [PubMed] [Google Scholar]
- 32.Satake H, Kawada T, Nomoto K, Minakata H. Insight into tachykinin-related peptides, their receptors, and invertebrate tachykinins: a review. Zoolog Sci. 2003;20:533–549. doi: 10.2108/zsj.20.533. [DOI] [PubMed] [Google Scholar]
- 33.Severini C, Improta G, Falconieri-Erspamer G, Salvadori S, Erspamer V. The tachykinin peptide family. Pharmacol Rev. 2002;54:285–322. doi: 10.1124/pr.54.2.285. [DOI] [PubMed] [Google Scholar]
- 34.Otsuka M, Yoshioka K. Neurotransmitter functions of mammalian tachykinins. Physiol Rev. 1993;73:229–308. doi: 10.1152/physrev.1993.73.2.229. [DOI] [PubMed] [Google Scholar]
- 35.Kalra SP, Dube MG, Kalra PS. Neuropeptide K (NPK) suppresses copulatory behavior in male rats. Physiol Behav. 1991;49:1297–1300. doi: 10.1016/0031-9384(91)90367-w. [DOI] [PubMed] [Google Scholar]
- 36.Kalra SP, Sahu A, Dube G, Kalra PS. Effects of various tachykinins on pituitary LH secretion, feeding, and sexual behavior in the rat. Ann N Y Acad Sci. 1991;632:332–338. doi: 10.1111/j.1749-6632.1991.tb33120.x. [DOI] [PubMed] [Google Scholar]
- 37.Peyon P, Saied H, Lin X, Peter RE. Preprotachykinin gene expression in goldfish brain: sexual, seasonal, and postprandial variations. Peptides. 2000;21:225–231. doi: 10.1016/s0196-9781(99)00190-4. [DOI] [PubMed] [Google Scholar]
- 38.Christie AE, Lundquist CT, Nassel DR, Nusbaum MP. Two novel tachykinin-related peptides from the nervous system of the crab Cancer borealis. J Exp Biol. 1997;200:2279–2294. doi: 10.1242/jeb.200.17.2279. [DOI] [PubMed] [Google Scholar]
- 39.Christie AE, Kutz-Naber KK, Stemmler EA, Klein A, Messinger DI, Goiney CC, Conterato AJ, Bruns EA, Hsu YW, Li L, Dickinson PS. Midgut epithelial endocrine cells are a rich source of the neuropeptides APSGFLGMRamide (Cancer borealis tachykinin-related peptide Ia) and GYRKPPFNGSIFamide (Gly1-SIFamide) in the crabs Cancer borealis, Cancer magister and Cancer productus. J Exp Biol. 2007;210:699–714. doi: 10.1242/jeb.02696. [DOI] [PubMed] [Google Scholar]
- 40.Christie AE, Cashman CR, Stevens JS, Smith CM, Beale KM, Stemmler EA, Greenwood SJ, Towle DW, Dickinson PS. Identification and cardiotropic actions of brain/gut-derived tachykinin-related peptides (TRPs) from the American lobster Homarus americanus. Peptides. 2008;29:1909–1918. doi: 10.1016/j.peptides.2008.07.010. [DOI] [PubMed] [Google Scholar]
- 41.Elizabeth AS, Braulio P, Emily AB, Patsy SD, Andrew EC. Identification, physiological actions, and distribution of TPSGFLGMRamide: a novel tachykinin-related peptide from the midgut and stomatogastric nervous system of Cancer crabs. J Neurochem. 2007;101:1351–1366. doi: 10.1111/j.1471-4159.2007.04520.x. [DOI] [PubMed] [Google Scholar]
- 42.Audsley N, Weaver RJ. Neuropeptides associated with the regulation of feeding in insects. Gen Comp Endocrinol. 2009;162:93–104. doi: 10.1016/j.ygcen.2008.08.003. [DOI] [PubMed] [Google Scholar]
- 43.Brockmann A, Annangudi SP, Richmond TA, Ament SA, Xie F, Southey BR, Rodriguez-Zas SR, Robinson GE, Sweedler JV. Quantitative peptidomics reveal brain peptide signatures of behavior. Proc Natl Acad Sci. 2009;106:2383–2388. doi: 10.1073/pnas.0813021106. [DOI] [PMC free article] [PubMed] [Google Scholar]
- 44.Pascual N, Maestro JL, Chiva C, Andreu D, Belles X. Identification of a tachykinin-related peptide with orexigenic properties in the German cockroach. Peptides. 2008;29:386–392. doi: 10.1016/j.peptides.2007.11.010. [DOI] [PubMed] [Google Scholar]
- 45.Chen R, Ma M, Hui L, Zhang J, Li L. Measurement of neuropeptides in crustacean hemolymph via MALDI mass spectrometry. J Am Soc Mass Spectrom. 2009;20:708–718. doi: 10.1016/j.jasms.2008.12.007. [DOI] [PMC free article] [PubMed] [Google Scholar]
- 46.McGaw IJ, McMahon BR. The FMRFamide-related peptides F1 and F2 alter hemolymph distribution and cardiac output in the crab Cancer magister. Biol Bull. 1995;188:186–196. doi: 10.2307/1542084. [DOI] [PubMed] [Google Scholar]
- 47.Bechtold DA, Luckman SM. The role of RFamide peptides in feeding. J Endocrinol. 2007;192:3–15. doi: 10.1677/JOE-06-0069. [DOI] [PubMed] [Google Scholar]
- 48.Mercier AJ, Friedrich R, Boldt M. Physiological functions of FMRFamide-like peptides (FLPs) in crustaceans. Microsc Res Tech. 2003;60:313–324. doi: 10.1002/jemt.10270. [DOI] [PubMed] [Google Scholar]
- 49.Kavaliers M, Hirst M, Mathers A. Inhibitory influences of FMRFamide on morphine- and deprivation-induced feeding. Neuroendocrinology. 1985;40:533–535. doi: 10.1159/000124126. [DOI] [PubMed] [Google Scholar]
- 50.Fu Q, Kutz KK, Schmidt JJ, Hsu YW, Messinger DI, Cain SD, de la Iglesia HO, Christie AE, Li L. Hormone complement of the Cancer productus sinus gland and pericardial organ: an anatomical and mass spectrometric investigation. J Comp Neurol. 2005;493:607–626. doi: 10.1002/cne.20773. [DOI] [PubMed] [Google Scholar]
- 51.Saideman SR, Ma M, Kutz-Naber KK, Cook A, Torfs P, Schoofs L, Li L, Nusbaum MP. Modulation of rhythmic motor activity by pyrokinin peptides. J Neurophysiol. 2007;97:579–595. doi: 10.1152/jn.00772.2006. [DOI] [PubMed] [Google Scholar]
- 52.Kirby MS, Nusbaum MP. Central nervous system projections to and from the commissural ganglion of the crab Cancer borealis. Cell Tissue Res. 2007;328:625–637. doi: 10.1007/s00441-007-0398-2. [DOI] [PubMed] [Google Scholar]
- 53.Schmidt M, Ache BW. Descending neurons with dopamine-like or with substance P/FMRFamide-like immunoreactivity target the somata of olfactory interneurons in the brain of the spiny lobster, Panulirus argus. Cell Tissue Res. 1994;278:337–352. doi: 10.1007/BF00414177. [DOI] [PubMed] [Google Scholar]
- 54.Langworthy K, Helluy S, Benton J, Beltz B. Amines and peptides in the brain of the American lobster: immunocytochemical localization patterns and implications for brain function. Cell Tissue Res. 1997;288:191–206. doi: 10.1007/s004410050806. [DOI] [PubMed] [Google Scholar]
- 55.DeKeyser SS, Kutz-Naber KK, Schmidt JJ, Barrett-Wilt GA, Li L. Imaging mass spectrometry of neuropeptides in decapod crustacean neuronal tissues. J Proteome Res. 2007;6:1782–1791. doi: 10.1021/pr060603v. [DOI] [PMC free article] [PubMed] [Google Scholar]
Associated Data
This section collects any data citations, data availability statements, or supplementary materials included in this article.