

Abstract
Objective:
To measure insurance coverage at prepregnancy, birth, postpartum, and coverage continuity across these periods among rural and urban U.S. residents.
Methods:
We performed a pooled, cross-sectional analysis of survey data from 154,992 postpartum individuals in 43 states and two jurisdictions participating in the 2016–2019 Pregnancy Risk Assessment Monitoring System. We calculated unadjusted estimates of insurance coverage (Medicaid, commercial, or uninsured) during three periods (prepregnancy, birth, and postpartum), as well as insurance continuity across these periods among rural and urban U.S. residents. We conducted subgroup analyses to compare uninsurance rates among rural and urban residents by sociodemographic and clinical characteristics. We used logistic regression models to generate adjusted odds ratios for each comparison.
Results:
Rural residents experienced greater odds of uninsurance in each period and continuous uninsurance across all three periods compared to their urban counterparts. Uninsurance was higher among rural compared with urban residents during prepregnancy (15.4% vs 12.1%; aOR 1.19 [95% CI 1.11–1.28]), at birth (4.6% vs 2.8%; aOR 1.60 [95% CI 1.41–1.82]), and postpartum (12.7% vs 9.8%; aOR 1.27 [95% CI 1.17–1.38]). In each period, rural residents who were non-Hispanic White, married, and with intended pregnancies experienced greater adjusted odds of uninsurance compared to their urban counterparts. Rural–urban differences in uninsurance persisted across both Medicaid expansion and non-expansion states and among those with varying levels of education and income. Rural inequities in perinatal coverage were experienced by Hispanic, English-speaking and Indigenous individuals during prepregnancy and at birth.
Conclusion:
Perinatal uninsurance disproportionately affects rural compared with urban residents in the 43 states examined. Differential insurance coverage may have important implications for addressing rural–urban inequities in maternity care access and maternal health.
Précis:
Rural compared with urban residents experience greater odds of uninsurance at prepregnancy, birth, postpartum, and continuously across each period.
Introduction:
Addressing rural inequities in maternal and infant healthcare and health is a national policy priority.1 Rural residents face declining access to obstetric services2–4 and greater risk of severe maternal morbidity and mortality at birth.5 The pregnancy-related mortality ratio increases with rurality.6 The Centers for Disease Control and Prevention (CDC) has identified lack of timely access to healthcare as a key contributor to pregnancy-related mortality.7,8
Health insurance is an important prerequisite for accessing quality healthcare before, during, and after pregnancy.9 In the general adult population, individuals residing in rural counties in the U.S. experience higher rates of uninsurance compared to urban residents.10 Being uninsured in the prepregnancy period has been associated with later and less adequate prenatal care,11 which decreases the likelihood of optimizing management of chronic conditions or addressing other important risk factors for adverse gestational outcomes prior to pregnancy. Postpartum uninsurance and insurance disruptions are associated with lower rates of receiving recommended care, including a postpartum visit.12 Further, many individuals who become uninsured postpartum report conditions that require ongoing care after birth, such as complications related to hypertension or depression, and nearly a quarter report at least one unmet need for medical care.13
The objective of this cross-sectional analysis was to describe differences in perinatal health insurance coverage for rural and urban residents in 43 states. To do so, we measured insurance status in each period (prepregnancy, birth, and postpartum) and assessed insurance continuity across these periods.
Methods:
We conducted a pooled, cross-sectional analysis using data from the Pregnancy Risk Assessment Monitoring System (PRAMS) collected in 43 states and two jurisdictions (the District of Columbia and New York City) from 2016 to 2019. PRAMS is an ongoing state-level, population-based surveillance system conduced by state, territorial, or local health departments in partnership with the CDC’s Division of Reproductive Health.14 Each month, each participating state draws a random, stratified sample of state residents who gave birth to a live-born infant. Sampled individuals are contacted 2–6 months after giving birth to participate in a mixed-mode (mail and telephone) survey that collects data on sociodemographic characteristics including geographic location of residence and health insurance coverage before, during, and after pregnancy. We limited our sample to respondents with complete insurance information (97.2% of the total sample).12,15–18
We used PRAMS data to classify insurance at three periods: 1) prepregnancy, measured as one month before pregnancy; 2) birth, measured at delivery; and 3) postpartum, measured as insurance held at the time of the postpartum survey (mean: 4 months; interquartile range: 3–5 months after birth). Prepregnancy and postpartum insurance status were self-reported. Insurance status at birth is the primary source of payment for childbirth as recorded by the hospital on the birth certificate.
We followed methods previously used by the CDC to hierarchically categorize insurance coverage in each period (prepregnancy, birth, and postpartum) into one of three categories: Medicaid, commercial, or uninsured.15 The Medicaid category included respondents who reported enrollment in Medicaid or a state-named Medicaid program. The commercial insurance category included respondents who reported commercial insurance alone or in combination with Medicaid and those who reported TRICARE or other military insurance. The uninsured category included respondents who indicated no insurance. Consistent with the U.S. Census,19 other national surveys,20 and previous analyses of the PRAMS,15,17 individuals who reported only Indian Health Service (IHS) were also classified as uninsured. This is because the IHS provides a system of health care delivery, largely primary care, not health insurance.19 The only exception was Alaska, where the IHS response option on the PRAMS included other state-specific programs, and thus was classified as Medicaid.15 We also generated six measures of insurance continuity between prepregnancy and postpartum: 1) continuous commercial, 2) continuous Medicaid, 3) continuous insurance with a commercial-Medicaid discontinuity, 4) one period of uninsurance, 5) two periods of uninsurance, and 6) continuous uninsurance.
Other demographic and clinical covariates included maternal age, income, highest level of education achieved, state Medicaid expansion status, marital status, parity, pregnancy intention, and the presence of pre-existing chronic conditions that are available in the PRAMS data: obesity, diabetes, hypertension, and depression. The PRAMS data also includes maternal race and ethnicity variables collected from the birth certificate and a survey question reflecting language spoken at home. We chose to include these variables as they may represent histories of racism and societal marginalization. Studies of uninsurance among reproductive-aged women have found that nearly one in three noncitizen individuals are uninsured, compared with just 9% of U.S.-born citizens.21 Thus, we used primary language (English or Spanish) as a proxy for country of origin for Hispanic respondents. Language is one of the most frequently used, and strongest predictors of, acculturation,22 and has been used as a proxy for nativity or acculturation in other studies of health disparities among Hispanic populations in the United States.23 As such, we used the following racial and ethnic categories in the PRAMS data: Asian, non-Hispanic (combined categories Asian Pacific Islander, Chinese, Filipino, Japanese, and “Other Asian;” henceforth Asian); Black, non-Hispanic; Hispanic, English-Speaking; Hispanic, Spanish-Speaking; American Indian/Alaska Native, non-Hispanic (henceforth Indigenous); and a composite of “Other, non-White” and “Mixed race,” non-Hispanic (henceforth additional races and ethnicities or Mixed). Income data were missing for 8.8% of respondents, so missing was included as a categorization to retain these observations; all other covariates had very low proportions of missing data. As such, complete case-based analysis was used in our analytic models.
The PRAMS variable describing rural compared with urban respondent county of residence is based on the 2013 National Center for Health Statistics Urban-Rural Classification Scheme for counites.24 This classification scheme contains 6 categories, which are frequently collapsed into a dichotomous variable distinguishing urban areas (all metropolitan statistical areas, including 4 different NCHS categories of urban/metropolitan areas) and rural areas (all non-metropolitan statistical areas, including both micropolitan and noncore counties in the original NCHS categorization). The rural/urban dichotomized variable is commonly used in rural/urban analysis and is also the only geographic variable available consistently across all states (not all states report all 6 of the NCHS categories).
Survey weighting allows researchers to generate state-level estimates using the PRAMs data.14 The sampling frame for each PRAMS state is all resident individuals who gave birth to a live-born infant during the surveillance year. The PRAMS sample is stratified so that subpopulations of public health interest can be oversampled. Statistical weighting schemes account for the different sampling rates in different strata, allowing estimates from these groups to be combined to obtain state-level estimates that ultimately reflect the actual proportions of births attributed to these subpopulations.
We calculated survey weighted estimates of insurance status in each period and for each measure of insurance continuity separately for urban and rural residents. We similarly calculated survey weighted estimates of uninsurance for rural and urban residents within each sociodemographic and clinical subgroup. We used survey weighted logistic regression models to calculate the unadjusted and adjusted (for covariates described above) odds of uninsurance in each period among rural compared with urban residents overall and for each subgroup. All analyses were conducted in STATA, version 16.0. This analysis of de-identified data was considered exempt from review by the study site’s Institutional Review Board. This study follows the STROBE (Strengthening the Reporting of Observational Studies in Epidemiology) reporting guidelines for reporting in observational studies.25
Results:
The analytic sample included 154,992 postpartum individuals. Rural residents comprised 15.6% (n=32,178) of the sample. Table 1 presents the demographic and clinical characteristics of rural and urban residents. Higher proportions of rural residents were non-Hispanic White (75.9% compared to 55.4% of urban residents), reported incomes less than 138% of the federal poverty level (42.7% compared to 31.2% of urban residents), and lived in Medicaid non-expansion states (47.5% compared to 33.6% of urban residents). Higher proportions of rural residents were in younger age categories, had unintended pregnancies, and reported diagnoses of the chronic conditions examined (obesity, diabetes, hypertension, and depression).
Table 1.
Sociodemographic and Clinical Characteristics of Overall Study Sample, Rural Residents, and Urban Residents (N=154,992)
| Characteristic | Rural (n=32,178) | Urban (n=122,744) | ||
|---|---|---|---|---|
| n | Survey weighted % (95% CI) | n | Survey weighted % (95% CI) | |
| Age, years | ||||
| ≤19 | 2,083 | 6.4 (6.0–6.9) | 5,004 | 3.8 (3.6–3.9) |
| 20–24 | 7,546 | 25.9 (25.0–26.7) | 20,468 | 16.9 (16.6–17.3) |
| 25–29 | 10,370 | 33.1 (32.2–34.0) | 34,754 | 28.4 (28.0–28.8) |
| 30–34 | 7,806 | 22.9 (22.1–23.6) | 37,868 | 30.9 (30.5–31.3) |
| ≥35 | 4,373 | 11.8 (11.3–12.4) | 24,645 | 20.0 (19.7–20.3) |
| Missing | 0 | 5 | 0.0 (0.0–0.0) | |
| Race and Ethnicity | ||||
| Asian* | 614 | 1.0 (0.8–1.1) | 9,862 | 6.1 (6.0–6.3) |
| Black, Non-Hispanic | 2,701 | 8.1 (7.6–8.6) | 25,533 | 16.5 (16.2–16.8) |
| Hispanic, English-Speaking | 2,027 | 4.7 (4.4–5.1) | 11,984 | 9.5 (9.2–9.7) |
| Hispanic, Spanish-Speaking | 1,252 | 3.3 (3.0–3.7) | 9,048 | 7.6 (7.3–7.8) |
| Indigenous† | 3,867 | 2.9 (2.7–3.0) | 2,375 | 0.4 (0.4–0.5) |
| Additional races and ethnicities or Mixed‡ | 1,641 | 2.6 (2.3–2.8) | 6,402 | 3.2 (3.1–3.4) |
| White, Non-Hispanic | 17,863 | 75.9 (75.3–76.6) | 55,104 | 55.4 (55.0–55.8) |
| Missing | 2,213 | 1.5 (1.4–1.6) | 2,436 | 1.2 (1.2–1.3) |
| Income, % federal poverty level | ||||
| ≤138 | 13,874 | 42.7 (41.7–43.6) | 41,484 | 31.2 (30.8–31.6) |
| 139–199 | 3,890 | 12.7 (12.0–13.3) | 12,443 | 9.9 (9.6–10.1) |
| 200–399 | 7,585 | 24.6 (23.8–25.4) | 28,206 | 24.1 (23.8–24.5) |
| ≥400 | 4,408 | 12.7 (12.1–13.3) | 28,713 | 25.8 (25.4–26.2) |
| Missing | 2,421 | 7.4 (6.9–7.9) | 11,898 | 9.0 (8.8–9.3) |
| State Medicaid Expansion | ||||
| Adopted | 18,224 | 52.5 (52.3–52.8) | 83,815 | 66.4 (66.4–66.5) |
| Not adopted | 13,954 | 47.5 (47.2–47.7) | 38,929 | 33.6 (33.5–33.7) |
| Missing | 0 | 0 | ||
| Education | ||||
| <High school | 4,643 | 14.1 (13.4–14.8) | 14,257 | 11.0 (10.7–11.3) |
| High school | 9,410 | 31.4 (30.5–32.3) | 27,692 | 22.9 (22.6–23.3) |
| >High school | 17,986 | 54.2 (53.2–55.1) | 79,561 | 65.2 (64.8–65.6) |
| Missing | 139 | 0.4 (0.3–0.5) | 1,234 | 0.9 (0.8–1.0) |
| Marital Status | ||||
| Married | 17,870 | 57.3 (56.3–58.2) | 74,931 | 63.0 (62.5–63.4) |
| Not Married | 14,272 | 42.6 (41.7–43.6) | 47,723 | 37.0 (36.6–37.4) |
| Missing | 36 | 0.0 (0.0–0.2) | 90 | 0.0 (0.0–0.1) |
| Parity | ||||
| Primiparous | 11,689 | 35.6 (34.7–36.5) | 48,149 | 39.1 (38.7–39.6) |
| Multiparous | 20,451 | 64.4 (63.4–65.3) | 74,373 | 60.7 (60.3–61.1) |
| Missing | 38 | 0.1 (0.0–0.2) | 222 | 0.2 (0.1–0.2) |
| Pregnancy Intendedness | ||||
| Yes | 17,617 | 54.6 (53.7–55.6) | 71,299 | 59.1 (58.7–59.5) |
| No | 14,206 | 44.2 (43.3–45.2) | 49,944 | 39.6 (39.2–40.1) |
| Missing | 355 | 1.1 (0.9–1.3) | 1,501 | 1.3 (1.2–1.4) |
| Chronic conditions | ||||
| Obesity | ||||
| Yes | 9,194 | 29.9 (29.0–30.8) | 30,452 | 23.5 (23.2–23.9) |
| No | 21,809 | 66.7 (65.8–67.6) | 86,610 | 71.7 (71.4–72.1) |
| Missing | 1,175 | 3.5 (3.1–3.9) | 5,682 | 4.8 (4.6–4.9) |
| Diabetes | ||||
| Yes | 1,161 | 3.7 (3.4–4.1) | 4,139 | 3.2 (3.0–3.3) |
| No | 30,730 | 95.5 (95.1–95.9) | 117,318 | 95.8 (95.6–95.9) |
| Missing | 287 | 0.8 (0.7–1.0) | 1,287 | 1.1 (1.0–1.2) |
| Hypertension | ||||
| Yes | 2,173 | 6.3 (5.8–6.7) | 7,369 | 5.1 (5.9–5.3) |
| No | 29,757 | 93.1 (92.6–93.5) | 114,298 | 94.0 (93.8–94.2) |
| Missing | 248 | 0.7 (0.6–0.9) | 1,077 | 0.9 (0.8–1.0) |
| Depression | ||||
| Yes | 6,000 | 19.7 (19.0–20.5) | 16,910 | 12.8 (12.5–13.1) |
| No | 25,956 | 79.6 (78.8–80.4) | 104,732 | 86.3 (86.0–86.6) |
| Missing | 222 | 0.7 (0.6–0.9) | 1,100 | 0.9 (0.8–1.0) |
N values are unweighted; percentages are survey weighted to account for sample design, nonresponse, and noncoverage
Combined categories Asian Pacific Islander, Chinese, Filipino, Japanese, and “Other Asian” from PRAMS data, non-Hispanic
Combined categories Alaska Native and American Indian from PRAMS data, non-Hispanic
Combined categories “Mixed race” and Other, non-White” from PRAMS data, non-Hispanic
Rural residents were less often commercially insured (57.4% vs. 66.5%; aOR 0.87 [95% CI 0.82–0.92]) and more often uninsured (15.4% vs 12.1%; aOR 1.19 [95% CI 1.11–1.28]) during the prepregnancy period, compared to urban residents (Figure 1, Table 2). In examining uninsurance by race and ethnicity, the highest rates of prepregnancy uninsurance among rural residents were identified among Hispanic, Spanish-speaking (64.2%); Hispanic, English-Speaking (25.3%); and Indigenous (22.6%) individuals (Table 3). More than 20% of rural residents with less than a high school education, incomes <138% of the federal poverty level, and in Medicaid non-expansion states were also uninsured. Rural–urban differences in uninsurance were significant for respondents in all age categories >24 years; identifying as Hispanic, English-Speaking, Indigenous, and non-Hispanic White; who were married, reported intended pregnancies, and living in either Medicaid expansion or non-expansion states; and across varying levels of income and education.
Figure 1.
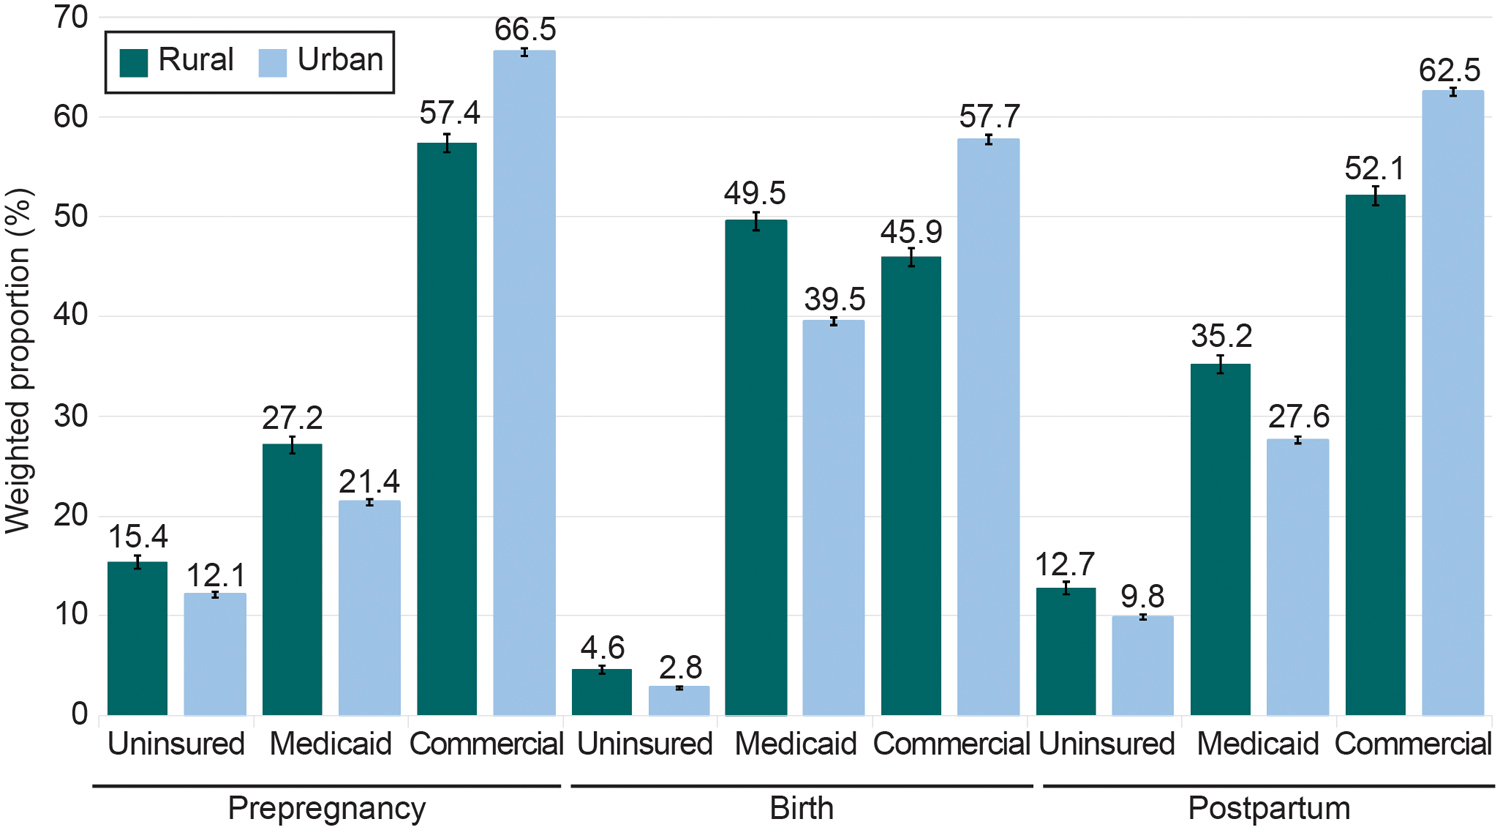
Insurance status at prepregnancy, birth, and postpartum among rural compared with urban residents (n=154,922).
Table 2.
Perinatal Insurance Status and Continuity Among Rural Compared with Urban Residents (N=154,992)
| Variable | Rural (n=32,178) | Urban (n=122,744) | Unadjusted Odds Ratio | Adjusted Odds Ratio* | ||
|---|---|---|---|---|---|---|
| n | Survey weighted % (95% CI) | n | Survey weighted % (95% CI) | |||
| Prepregnancy | ||||||
| Commercial | 17,746 | 57.4 (56.5–58.3) | 78,405 | 66.5 (66.1–66.9) | 0.68 (0.65–0.71)§ | 0.87 (0.82–0.92)§ |
| Medicaid | 9,382 | 27.2 (26.3–28.0) | 29,807 | 21.4 (21.1–21.7) | 1.37 (1.31–1.44)§ | 1.05 (0.98–1.12) |
| Uninsured | 5,050 | 15.4 (14.7–16.1) | 14,532 | 12.1 (11.8–12.4) | 1.32 (1.24–1.40)§ | 1.19 (1.11–1.28)§ |
| Birth | ||||||
| Commercial | 14,329 | 45.9 (45.0–46.8) | 67,292 | 57.7 (57.3–58.2) | 0.62 (0.60–0.65)§ | 0.76 (0.72–0.81)§ |
| Medicaid | 16,405 | 49.5 (48.6–50.4) | 52,032 | 39.5 (39.1–39.9) | 1.50 (1.44–1.56)§ | 1.19 (1.12–1.26)§ |
| Uninsured | 1,444 | 4.6 (4.2–5.0) | 3,420 | 2.8 (2.6–2.9) | 1.70 (1.53–1.90)§ | 1.60 (1.41–1.82)§ |
| Postpartum | ||||||
| Commercial | 16,150 | 52.1 (51.1–53.0) | 73,382 | 62.5 (62.1–62.9) | 0.65 (0.62–0.68)§ | 0.84 (0.79–0.89)§ |
| Medicaid | 11,976 | 35.2 (34.3–36.1) | 37,720 | 27.6 (27.3–28.0) | 1.42 (1.36–1.49)§ | 1.06 (1.00–1.13) |
| Uninsured | 4,052 | 12.7 (12.1–13.4) | 11,642 | 9.8 (9.6–10.1) | 1.34 (1.25–1.43)§ | 1.27 (1.17–1.38)§ |
| Continuous Insurance | ||||||
| Continuous commercial insurance | 12,483 | 40.2 (39.3–41.1) | 60,243 | 51.9 (51.5–52.4) | 0.62 (0.60–0.65)§ | 0.80 (0.75–0.85)§ |
| Continuous Medicaid | 7,501 | 21.9 (21.1–22.7) | 23,494 | 16.5 (16.2–16.8) | 1.42 (1.35–1.49)§ | 1.08 (1.01–1.16)† |
| Commercial-Medicaid discontinuity | 5,024 | 16.8 (16.0–17.5) | 18,821 | 14.9 (14.6–15.2) | 1.15 (1.08–1.21)§ | 1.04 (0.97–1.1) |
| Any Uninsurance | ||||||
| 1 period uninsured | 2,228 | 6.3 (5.8–6.8) | 6,474 | 5.5 (5.3–5.7) | 1.14 (1.05–1.25)‡ | 1.11 (0.99–1.24) |
| 2 periods uninsured | 4,368 | 12.1 (11.5–12.7) | 12,245 | 9.8 (9.5–10.1) | 1.27 (1.19–1.36)§ | 1.07 (1.00–1.15) |
| 3 periods (continuously) uninsured | 574 | 2.7 (2.3–3.0) | 1,467 | 1.3 (1.2–1.4) | 2.13 (1.82–2.50)§ | 2.02 (1.65–2.49)§ |
N values are unweighted; all other data are survey weighted to account for sample design, nonresponse, and noncoverage
Odds ratios are adjusted for maternal age, race and ethnicity, income, highest level of education achieved, state Medicaid expansion status, marital status, parity, pregnancy intention, and the presence of pre-existing chronic conditions (obesity, diabetes, hypertension, and depression).
P<.05
P<.01
P<.001
Table 3.
Prepregnancy Uninsurance Among Rural Compared With Urban Residents (N=19,582)
| Rural (n=5,050) | Urban (n=14,532 | |||
|---|---|---|---|---|
| Characteristic | Survey weighted % (95% CI) | Survey weighted % (95% CI) | Unadjusted Odds Ratio | Adjusted Odds Ratio* |
| Age (years old) | ||||
| ≤19 | 13.3 (10.6–16.1) | 14.9 (13.1–16.6) | 0.88 (0.67–1.16) | 1.11 (0.80–1.52) |
| 20–24 | 18.4 (16.9–19.9) | 18.5 (17.6–19.4) | 0.99 (0.88–1.11) | 1.10 (0.96–1.26) |
| 25–29 | 14.9 (13.7–16.1) | 13.2 (12.6–13.7) | 1.16 (1.04–1.29)‡ | 1.14 (1.00–1.29)† |
| 30–34 | 13.3 (12.0–14.6) | 9.2 (8.7–9.6) | 1.52 (1.34–1.72)§ | 1.24 (1.06–1.45)‡ |
| ≥35 | 15.6 (13.6–17.6) | 9.3 (8.7–9.8) | 1.81 (1.53–2.14)§ | 1.51 (1.22–1.88)§ |
| Race/Ethnicity | ||||
| Asian or Pacific Islander | 12.5 (6.5–18.5) | 6.8 (6.0–7.5) | 1.97 (1.12–3.47)† | 1.50 (0.85–2.66) |
| Black, Non-Hispanic | 15.7 (13.0–18.4) | 11.5 (10.8–12.2) | 1.42 (1.15–1.77)‡ | 1.03 (0.82–1.30) |
| Hispanic, English-Speaking | 25.3 (21.5–29.1) | 15.0 (14.0–16.0) | 1.92 (1.55–2.38)§ | 1.28 (1.01–1.63)† |
| Hispanic, Spanish-Speaking | 64.2 (59.7–68.7) | 52.0 (50.3–53.6) | 1.66 (1.35–2.03)§ | 1.22 (0.94–1.58) |
| Indigenous | 22.6 (20.1–25.0) | 15.6 (13.7–17.5) | 1.58 (1.29–1.93)§ | 1.43 (1.15–1.78)‡ |
| Additional races and ethnicities or Mixed | 15.7 (12.3–19.2) | 11.8 (10.3–13.3) | 1.40 (1.4–1.88)† | 1.07 (0.76–1.52) |
| White, Non-Hispanic | 12.5 (11.7–13.2) | 7.0 (6.6–7.3) | 1.91 (1.75–2.07)§ | 1.17 (1.07–1.29)‡ |
| Income (%FPL) | ||||
| ≤138 | 21.5 (20.2–26.7) | 21.6 (20.9–22.2) | 0.99 (0.91–1.08) | 1.13 (1.02–1.25)† |
| 139–199 | 18.2 (16.2–20.3) | 16.4 (15.3–17.4) | 1.14 (0.97–1.34) | 1.14 (0.96–1.36) |
| 200–399 | 7.2 (6.3–8.2) | 6.3 (5.9–6.8) | 1.15 (0.98–1.35) | 1.09 (0.91–1.31) |
| ≥400 | 2.1 (1.3–2.9) | 0.9 (0.7–1.1) | 2.33 (1.50–3.63)§ | 1.95 (1.16–3.27)† |
| Missing | 26.0 (22.6–29.3) | 22.3 (21.0–23.5) | 1.2 (1.01–1.48)† | 1.37 (1.06–1.78)† |
| State Medicaid Expansion | ||||
| Adopted | 10.1 (9.4–10.9) | 9.5 (9.2–9.8) | 1.07 (0.98–1.18) | 1.22 (1.09–1.36)‡ |
| Not Adopted | 21.3 (20.1–22.5) | 17.3 (16.7–18.0) | 1.29 (1.19–1.40)§ | 1.15 (1.04–1.27)‡ |
| Education | ||||
| <High school | 35.2 (32.6–37.7) | 31.9 (30.6–33.1) | 1.16 (1.02–1.32)† | 1.43 (1.20–1.70)§ |
| High school | 17.6 (16.2–18.9) | 18.5 (17.8–19.3) | 0.94 (0.84–1.04) | 1.04 (0.92–1.17) |
| >High school | 9.0 (8.3–9.7) | 6.5 (6.2–6.7) | 1.43 (1.30–1.57)§ | 1.13 (1.01–1.26)† |
| Marital Status | ||||
| Married | 13.2 (12.4–14.1) | 8.3 (8.0–8.6) | 1.69 (1.55–1.84)§ | 1.31 (1.18–1.45)§ |
| Not Married | 18.3 (17.2–19.5) | 18.6 (18.1–19.2) | 0.98 (0.90–1.07) | 1.04 (0.94–1.15) |
| Parity | ||||
| Multiparous | 15.8 (14.9–16.7) | 12.4 (12.1–12.8) | 1.32 (1.22–1.42)§ | 1.21 (1.11–1.33)§ |
| Primiparous | 14.7 (13.6–15.9) | 11.6 (11.1–12.1) | 1.31 (1.19–1.45)§ | 1.14 (1.01–1.29)† |
| Pregnancy Intendedness | ||||
| Yes | 13.7 (12.8–14.6) | 9.8 (9.5–10.1) | 1.46 (1.34–1.59)§ | 1.32 (1.19–1.47)§ |
| No | 17.3 (16.2–18.4) | 15.4 (14.9–16.0) | 1.15 (1.05–1.25)‡ | 1.09 (0.98–1.20) |
| Chronic conditions | ||||
| Obesity | 13.6 (12.4–14.8) | 12.2 (11.6–12.8) | 1.13 (1.01–1.27)† | 1.06 (0.92–1.21) |
| Diabetes | 12.4 (9.1–15.7) | 10.9 (9.4–12.4) | 1.15 (0.82–1.63) | 1.01 (0.67–1.5) |
| Hypertension | 13.8 (11.2–16.5) | 9.5 (8.4–10.6) | 1.53 (1.18–1.98)‡ | 1.28 (0.93–1.76) |
| Depression | 13.0 (11.6–14.4) | 10.6 (9.8–11.3) | 1.27 (1.09–1.47)‡ | 1.09 (0.92–1.29) |
Data are survey weighted to account for sample design, nonresponse, and noncoverage.
Odds ratios are adjusted for maternal age, race and ethnicity, income, highest level of education achieved, state Medicaid expansion status, marital status, parity, pregnancy intention, and the presence of pre-existing chronic conditions (obesity, diabetes, hypertension, and depression) except for the covariate of interest in each row.
P<.05
P<.01
P<.001
Combined categories Asian Pacific Islander, Chinese, Filipino, Japanese, and “Other Asian” from PRAMS data, non-Hispanic
Combined categories Alaska Native and American Indian from PRAMS data, non-Hispanic
Combined categories “Mixed race” and Other, non-White” from PRAMS data, non-Hispanic
At birth, rural residents remained less often commercially insured compared with urban residents (45.9% vs 57.7%; aOR 0.76 [95% CI 0.72–0.81]) and experienced greater odds of Medicaid coverage at birth (49.5% vs 39.5%; aOR 1.19 [95% CI 1.12–1.26]; Table 4). While the prevalence of uninsurance was lower overall at birth compared to the prepregnancy period, the rural–urban difference in uninsurance remained (rural: 4.6%; urban 2.8%; aOR 1.60 [95% CI 1.41–1.82]). The highest rates of uninsurance at birth were identified among respondents who identified as Hispanic, Spanish-speaking (rural: 24.2%; urban: 14.1%) and reported less than a high school education (rural: 17.3%; urban: 9.3%). Rural compared with urban residents experienced greater odds of uninsurance in all age categories >19 years; identifying as Hispanic, English-Speaking, Indigenous; or non-Hispanic White; who were married, reported intended pregnancies, had obesity or depression, and living in either Medicaid expansion or non-expansion states; and across varying levels of income and education.
Table 4.
Uninsurance at Birth Among Rural Compared With Urban Residents (N=4,864)
| Rural (n=1,444) | Urban (n=3,4200) | |||
|---|---|---|---|---|
| Characteristic | Survey weighted % (95% CI) | Survey weighted % (95% CI) | Unadjusted Odds Ratio | Adjusted Odds Ratio* |
| Age (years old) | ||||
| ≤19 | 3.3 (1.9–4.6) | 3.5 (2.6–4.4) | 0.92 (0.56–1.52) | 1.48 (0.87–2.81) |
| 20–24 | 3.6 (2.8–4.3) | 2.9 (2.5–3.2) | 1.26 (0.98–1.62) | 1.40 (1.04–1.87)† |
| 25–29 | 4.4 (3.7–5.1) | 2.7 (2.5–3.0) | 1.63 (1.33–2.00)§ | 1.43 (1.15–1.80)‡ |
| 30–34 | 5.0 (4.1–5.9) | 2.4 (2.2–2.6) | 2.14 (1.73–2.65)§ | 1.84 (1.46–3.32)§ |
| ≥35 | 7.4 (5.9–8.9) | 3.1 (2.7–3.4) | 2.51 (1.96–3.21)§ | 1.80 (1.32–2.45)§ |
| Race/Ethnicity | ||||
| Asian or Pacific Islander | 4.8 (0.01–1.0) | 1.1 (0.7–1.4) | 4.7 (1.59–14.15)‡ | 1.74 (0.61–5.00) |
| Black, Non-Hispanic | 1.0 (0.3–1.6) | 1.6 (1.3–1.9) | 0.60 (0.28–1.27) | 0.42 (0.20–0.91)† |
| Hispanic, English-Speaking | 6.9 (4.8–9.0) | 2.3 (2.0–2.7) | 3.08 (2.14–4.43)§ | 2.91 (1.94–4.38)§ |
| Hispanic, Spanish-Speaking | 24.2 (19.5–28.9) | 14.1 (13.0–15.3) | 1.94 (1.47–2.55)§ | 1.33 (0.94–1.87) |
| Indigenous | 6.0 (5.3–6.8) | 3.0 (2.2–3.9) | 2.06 (1.50–2.83)§ | 2.08 (1.53–2.82)§ |
| Additional races and ethnicities or Mixed | 4.0 (1.7–6.2) | 2.1 (1.3–2.9) | 1.91 (0.96–3.82) | 1.87 (0.91–3.85) |
| White, Non-Hispanic | 4.0 (3.5–4.5) | 1.9 (1.7–2.0) | 2.18 (1.87–2.53)§ | 1.57 (1.33–1.86)§ |
| Income (%FPL) | ||||
| ≤138 | 4.7 (4.1–5.4) | 3.9 (3.6–4.2) | 1.22 (1.04–1.45)† | 1.60 (1.29–1.93)§ |
| 139–199 | 4.5 (3.4–5.6) | 2.7 (2.3–3.1) | 1.69 (1.24–2.30)‡ | 1.53 (1.11–2.13)† |
| 200–399 | 3.7 (3.0–4.4) | 2.4 (2.1–2.6) | 1.60 (1.27–2.01)§ | 1.23 (0.96–1.58) |
| ≥400 | 1.6 (0.9–2.2) | 0.7 (0.6–0.8) | 2.17 (1.38–2.43)‡ | 1.60 (1.01–2.53)† |
| Missing | 12.2 (9.5–14.9) | 5.7 (5.0–6.4) | 2.31 (1.73–3.07)§ | 2.49 (1.68–3.69)§ |
| State Medicaid Expansion | ||||
| Adopted | 3.9 (3.4–4.4) | 2.2 (2.1–2.4) | 1.80 (1.55–2.08)§ | 1.72 (1.43–2.06)§ |
| Not Adopted | 5.4 (4.7–6.1) | 3.8 (3.5–4.2) | 1.43 (1.21–1.68)§ | 1.49 (1.25–1.78)§ |
| Education | ||||
| <High school | 17.3 (8.4–10.1) | 9.3 (8.4–10.1) | 2.05 (1.71–2.45)§ | 1.87 (1.48–2.37)§ |
| High school | 3.0 (2.4–3.6) | 3.1 (2.8–3.5) | 0.97 (0.77–1.21) | 1.22 (0.93–1.58) |
| >High school | 2.2 (1.9–2.5) | 1.5 (1.4–1.6) | 1.45 (1.22–1.73)§ | 1.40 (1.15–1.70)‡ |
| Marital Status | ||||
| Married | 6.0 (5.3–6.6) | 2.6 (2.5–2.8) | 2.36 (2.07–2.69)§ | 1.69 (1.45–1.97)§ |
| Not Married | 2.7 (2.2–3.2) | 3.0 (2.7–3.2) | 0.91 (0.74–1.11) | 1.23 (0.95–1.58) |
| Parity | ||||
| Multiparous | 5.4 (4.8–6.0) | 3.2 (3.0–3.4) | 1.71 (1.51–1.94)§ | 1.55 (1.33–1.80)§ |
| Primiparous | 3.1 (2.6–3.7) | 2.0 (1.8–2.2) | 1.56 (1.25–1.93)§ | 1.76 (1.36–2.27)§ |
| Pregnancy Intendedness | ||||
| Yes | 4.6 (4.0–5.1) | 2.6 (2.4–2.8) | 1.81 (1.56–2.09)§ | 1.67 (1.41–1.98)§ |
| No | 4.4 (3.8–5.0) | 3.0 (2.7–3.2) | 1.50 (1.27–1.78)§ | 1.50 (1.23–1.83)§ |
| Chronic conditions | ||||
| Obesity | 2.7 (2.1–3.3) | 2.0 (1.7–2.3) | 1.38 (1.05–1.79)† | 1.43 (1.06–1.94)† |
| Diabetes | 2.2 (1.0–3.4) | 2.9 (2.1–3.7) | 0.76 (0.40–1.44) | 0.68 (0.32–1.43) |
| Hypertension | 1.6 (0.9–2.3) | 2.1 (1.5–2.6) | 0.78 (0.46–1.32) | 0.82 (0.41–1.62) |
| Depression | 2.5 (1.8–3.2) | 1.5 (1.2–1.8) | 1.70 (1.20–2.42)‡ | 1.59 (1.07–2.38)† |
Data are survey weighted to account for sample design, nonresponse, and noncoverage.
Odds ratios are adjusted for maternal age, race and ethnicity, income, highest level of education achieved, state Medicaid expansion status, marital status, parity, pregnancy intention, and the presence of pre-existing chronic conditions (obesity, diabetes, hypertension, and depression) except for the covariate of interest in each row.
P<.05
P<.01
P<.001
Combined categories Asian Pacific Islander, Chinese, Filipino, Japanese, and “Other Asian” from PRAMS data, non-Hispanic
Combined categories Alaska Native and American Indian from PRAMS data, non-Hispanic
Combined categories “Mixed race” and Other, non-White” from PRAMS data, non-Hispanic
During the postpartum period, rural residents remained less often commercially insured (52.1% vs. 62.5%; aOR 0.84 [95% CI 0.79–0.89]) and more often uninsured (12.7% vs 9.8%; aOR 1.27 [95% CI 1.17–1.38]) compared to urban residents (Table 5). There were substantial rural–urban differences in postpartum uninsurance rates identified among individuals identifying as Hispanic, Spanish-Speaking or non-Hispanic White, who were married, reported intended pregnancies, and living in either Medicaid expansion or non-expansion states; and across varying levels of education. Those with some chronic conditions, including obesity and hypertension, also experienced greater odds of uninsurance compared with urban residents.
Table 5.
Postpartum Uninsurance Among Rural Compared with Urban Residents (N=15,694)
| Rural (n=4,052) | Urban (n=11,642) | |||
|---|---|---|---|---|
| Characteristic | Survey weighted % (95% CI) | Survey weighted % (95% CI) | Unadjusted Odds Ratio | Adjusted Odds Ratio* |
| Age (years old) | ||||
| ≤19 | 13.4 (10.6–16.2) | 12.2 (10.6–13.7) | 1.12 (0.84–1.49) | 1.36 (0.97–1.90) |
| 20–24 | 13.9 (12.5–15.2) | 14.0 (13.2–14.8) | 0.99 (0.87–1.13) | 1.13 (0.96–1.32) |
| 25–29 | 12.4 (11.2–13.5) | 10.49.9–10.9) | 1.22 (1.08–1.37)‡ | 1.18 (1.02–1.36)† |
| 30–34 | 10.9 (9.8–12.1) | 7.6 (7.1–8.0) | 1.50 (1.31–1.72)§ | 1.33 (1.12–1.58)‡ |
| ≥35 | 14.4 (12.4–16.4) | 8.6 (8.0–9.1) | 1.80 (1.50–2.14)§ | 1.62 (1.28–2.07)§ |
| Race/Ethnicity | ||||
| Asian or Pacific Islander | 14.8 (7.8–21.9) | 5.4 (4.7–6.2) | 3.04 (1.7–5.4)§ | 1.76 (1.01–3.07)† |
| Black, Non-Hispanic | 11.4 (9.0–13.7) | 8.4 (7.8–9.1) | 1.39 (1.08–1.79)† | 1.01 (0.77–1.32) |
| Hispanic, English-Speaking | 21.2 (17.6–24.8) | 12.9 (11.9–13.9) | 1.82 (1.44–2.30)§ | 1.20 (0.92–1.56) |
| Hispanic, Spanish-Speaking | 67.0 (62.6–71.4) | 48.6 (46.9–50.2) | 2.15 (1.75–2.65)§ | 1.49 (1.16–1.92)‡ |
| Indigenous | 17.9 (15.7–20.1) | 13.1 (11.1–15.0) | 1.45 (1.15–1.83)‡ | 1.27 (0.99–1.63) |
| Additional races and ethnicities or Mixed | 12.9 (9.8–15.9) | 8.7 (7.3–10.1) | 1.55 (1.12–2.14)‡ | 1.13 (0.78–1.62) |
| White, Non-Hispanic | 9.8 (9.1–10.5) | 5.0 (4.7–5.3) | 2.08 (1.89–2.30)§ | 1.27 (1.14–1.42)§ |
| Income (%FPL) | ||||
| ≤138 | 16.7 (15.6–17.8) | 16.9 (16.3–17.5) | 0.99 (0.90–1.08) | 1.21 (1.08–1.35)‡ |
| 139–199 | 15.3 (13.3–17.2) | 13.3 (12.3–14.3) | 1.18 (0.99–1.40) | 1.19 (0.99–1.45) |
| 200–399 | 6.2 (5.3–7.0) | 5.2 (4.8–5.6) | 1.20 (1.01–1.42)† | 1.10 (0.90–1.34) |
| ≥400 | 2.2 (1.3–3.0) | 0.6 (0.5–0.8) | 3.28 (2.08–5.19)§ | 2.53 (1.47–4.32)‡ |
| Missing | 25.4 (22.1–28.8) | 20.0 (18.8–21.3) | 1.35 (1.12–1.65)‡ | 1.53 (1.14–2.06)‡ |
| State Medicaid Expansion | ||||
| Adopted | 7.5 (6.8–8.2) | 7.1 (6.8–7.3) | 1.07 (0.96–1.19) | 1.37 (1.20–1.56)§ |
| Not Adopted | 18.5 (17.4–19.6) | 15.3 (14.7–15.9) | 1.26 (1.15–1.37)§ | 1.20 (1.08–1.33)‡ |
| Education | ||||
| <High school | 31.5 (27.1–29.6) | 28.4 (27.2–29.6) | 1.16 (1.02–1.33)† | 1.50 (1.24–1.81)§ |
| High school | 13.8 (12.6–15.0) | 14.3 (13.6–15.0) | 0.96 (0.86–1.08) | 1.13 (0.98–1.30) |
| >High school | 7.2 (6.5–7.8) | 5.1 (4.8–5.3) | 1.45 (1.30–1.62)§ | 1.15 (1.02–1.31)† |
| Marital Status | ||||
| Married | 12.4 (11.6–13.3) | 7.3 (7.0–7.6) | 1.80 (1.65–1.97)§ | 1.41 (1.26–1.58)§ |
| Not Married | 13.2 (12.1–14.2) | 14.1 (13.5–14.6) | 0.92 (0.84–1.02) | 1.07 (0.94–1.20) |
| Parity | ||||
| Multiparous | 14.2 (13.3–15.0) | 11.1 (10.7–11.4) | 1.33 (1.22–1.43)§ | 1.26 (1.14–1.40)§ |
| Primiparous | 10.1 (9.1–11.1) | 7.9 (7.5–8.3) | 1.31 (1.16–1.48)§ | 1.26 (1.09–1.46)‡ |
| Pregnancy Intendedness | ||||
| Yes | 11.6 (10.8–12.5) | 8.3 (8.0–8.6) | 1.45 (1.32–1.59)§ | 1.36 (1.21–1.53)§ |
| No | 13.8 (12.8–14.9) | 12.0 (11.5–12.5) | 1.18 (1.07–1.30)‡ | 1.18 (1.05–1.33)‡ |
| Chronic conditions | ||||
| Obesity | 11.7 (10.6–12.9) | 9.6 (9.0–10.1) | 1.26 (1.11–1.43)‡ | 1.26 (1.08–1.47)‡ |
| Diabetes | 11.5 (8.2–14.8) | 9.7 (8.3–11.1) | 1.22 (0.85–1.74) | 1.19 (0.74–1.91) |
| Hypertension | 11.2 (8.8–13.7) | 8.3 (7.2–9.4) | 1.40 (1.05–1.85)† | 1.49 (1.07–2.08)† |
| Depression | 10.0 (8.8–11.3) | 8.0 (7.3–8.7) | 1.28 (1.08–1.52)‡ | 1.12 (0.92–1.36) |
Data are survey weighted to account for sample design, nonresponse, and noncoverage.
Odds ratios are adjusted for maternal age, race and ethnicity, income, highest level of education achieved, state Medicaid expansion status, marital status, parity, pregnancy intention, and the presence of pre-existing chronic conditions (obesity, diabetes, hypertension, and depression) except for the covariate of interest in each row.
P<.05
P<.01
P<.001
Combined categories Asian Pacific Islander, Chinese, Filipino, Japanese, and “Other Asian” from PRAMS data, non-Hispanic
Combined categories Alaska Native and American Indian from PRAMS data, non-Hispanic
Combined categories “Mixed race” and Other, non-White” from PRAMS data, non-Hispanic
Rural compared with urban residents experienced greater odds of continuous uninsurance (rural: 2.7%, urban: 1.3%; aOR 2.02 [95% CI 1.65–2.49]) and continuous Medicaid coverage (rural: 21.9%, urban: 16.5%; aOR 1.08 [95% CI 1.01–1.16]) across all three periods. Similarly, rural compared with urban residents experienced lower odds of continuous commercial coverage (rural: 40.2%, urban: 51.9%; aOR 0.80 [95% CI 0.75–0.85]) across all three periods. Discontinuities between commercial insurance and Medicaid and the odds of experiencing one or two periods of uninsurance were not statistically different across groups.
Discussion:
Using multistate data from 2016 to 2019, we found substantial rural–urban differences in perinatal insurance coverage during the years leading into the COVID-19 Public Health Emergency. Cross-sectional estimates reveal that rural residents experienced greater adjusted odds of uninsurance during prepregnancy, birth, and postpartum and they experienced greater adjusted odds of continuous uninsurance across these periods compared to urban residents. In each period, rural residents who were non-Hispanic White, married, and with intended pregnancies experienced greater adjusted odds of uninsurance compared to their urban counterparts. Rural inequities persisted across both Medicaid expansion and non-expansion states and varying levels of education and income. Rural residents who were Hispanic, English-Speaking and Indigenous experienced greater adjusted odds of uninsurance in two of the three periods. These data have important implications for maternal health policymakers, clinicians, and advocates.
Health insurance coverage is driven by federal and state health policy and thus amenable to policy intervention.26 This analysis found that nearly 13% of rural residents were uninsured by three months postpartum, representing approximately 156,000 rural residents across the 43 states and two jurisdictions examined who became uninsured after giving birth from 2016–2019. As rural residents are more likely than urban residents to be insured by Medicaid27 at the time of birth, they may face greater risk of becoming uninsured postpartum, as pregnancy-related Medicaid coverage has historically ended at 60 days postpartum for nearly all enrollees. Our findings are concerning and reveal that rural residents with postpartum uninsurance were more likely to be older than 35 and have obesity or chronic hypertension compared to urban residents who are uninsured postpartum. These conditions place postpartum individuals at greater risk of medical complications in the postpartum year—including maternal morbidity and mortality.
The 15 states that do not currently plan to adopt Medicaid extensions through the first year postpartum are home to a disproportionate number of rural-residing U.S. residents.28 The data presented in the present study may inform active state and federal policymaking on the topic of perinatal health insurance coverage and the need for continued Medicaid eligibility beyond 60 days postpartum, particularly in rural counties.
Higher rates of uninsurance (and concomitantly lower rates of commercial insurance) were also identified at prepregnancy and birth among rural residents. Multiple policy approaches may be warranted to increase insurance enrollment during these periods, and such policies must account for rural differences in employment and employment-based insurance.29,30 Rural residents are more likely to work at smaller and family-owned firms, and less likely to have benefits like health insurance or paid leave, which contributed to inequities in rural health outcomes during the COVID-19 pandemic.31,32 Improving access to commercial insurance could be accomplished, for instance, through employer-based programs and state policies incentivizing employers, including smaller employers, to provide affordable health insurance coverage or directly subsidize it through the creation of high-risk pools or other programs, like incentives to offer spousal and family coverage to employees.33,34 Additionally, rural residents have more limited access to health information,35 and targeted investments addressing health insurance literacy in the rural U.S. have been instrumental in increasing insurance enrollment among eligible, but unenrolled individuals for Medicaid and subsidized health plans; use of “health insurance navigators;” and other rural-tailored health programs.36 Future work is needed to further disentangle whether the high proportions of rural residents who are uninsured in the perinatal period reflect lack of eligibility, lack of enrollment, or both among eligible individuals.
We identified increased odds of perinatal uninsurance among Hispanic, English-Speaking and Indigenous individuals residing in rural compared with urban counties. In fact, approximately 40% of rural residents who were uninsured in the perinatal period were Indigenous or Hispanic despite these populations only reflecting approximately 10% of the rural population.
Among Hispanic individuals, this likely represents more limited access to employer-sponsored coverage and restrictions on Medicaid eligibility. For instance, if lawfully residing immigrants meet income eligibility requirements, they may enroll in Medicaid after a 5-year waiting period (waived for pregnant individuals in 29 states); however, this does not apply to individuals who are residing in the U.S. non-lawfully or non-pregnant individuals (as would be needed for insurance coverage in the prepregnancy period).37 Approximately 8% of all U.S. births are to non-lawfully residing immigrants (250,000 per year) as of 2016.38 While overall reports of maternal morbidity and mortality suggest similar rates among non-Hispanic-White and Hispanic individuals,39 attention must turn to addressing heterogeneity within the Hispanic population, including a lens toward examining intersectionality by rural compared with urban residence, nativity, immigration status, and acculturation, among other factors.
Many Indigenous individuals live on reservations or in highly rural or frontier communities that are long distances from care.40 Those in federally-recognized tribes may receive care from Indian Health Services or tribal health centers, but this is not health insurance coverage—the scope of services is limited and usually does not include full-scope maternal care.41 In a recent report, researchers describe significant barriers to insurance enrollment and receipt of high-quality perinatal healthcare reported by Indigenous women in non-federally-recognized tribes.42 In the study, participants describe pre-paying for childbirth when uninsured and needing education about insurance options and enrollment. There is an urgent need to address access to perinatal care for Indigenous individuals, particularly among rural residents.
Study strengths include use of a large, multi-state survey to assess policy-relevant rural inequities in perinatal insurance coverage. However, this study has several limitations to consider when interpreting the results. First, the findings do not generalize to the seven states not included in the present study: Arizona, California, Idaho, Ohio, Nevada, South Carolina, and Texas; however, the states included represent a broad range of geographies. Second, we were unable to assess changes in insurance coverage within insurance categories (e.g., transitions from a Medicaid program designed for a low-income adult to a pregnancy-related Medicaid program), which often result in care disruptions. Therefore, our estimates of discontinuities are likely conservative. In addition, insurance status at prepregnancy and postpartum were self-reported and subject to recall bias. For measures of coverage continuity, we would expect this to apply equally to each period studied, thus not affecting our estimates of insurance changes over time. Finally, we were unable to assess citizenship in the present study, which often affects insurance eligibility.
We identified substantial rural–urban differences in perinatal insurance coverage in the pre-pandemic period and outline possible strategies for addressing rural inequities in perinatal insurance coverage. National attention has been directed toward declining access to obstetric care in rural counties, often creating long drive times to care, and the high rates of severe maternal morbidity and mortality among rural residents, including Indigenous people.6,43 Insurance coverage represents the first step in the pathway toward accessing high-quality perinatal care.9 It is imperative that further policy attention be directed toward the inequities in access to and receipt of care, including through perinatal insurance coverage, faced by rural residents.
Supplementary Material
Acknowledgements:
The authors thank the PRAMS Working Group and the Centers for Disease Control and Prevention (CDC) for their role in conducting PRAMS surveillance, and Sarah Block in the Department of Obstetrics and Gynecology at the University of Michigan for her help in manuscript preparation.
Funding/Support:
This research was supported by the Federal Office of Rural Health Policy (FORHP), Health Resources and Services Administration (HRSA), U.S. Department of Health and Human Services (HHS) under PHS Grant No. 5U1CRH03717 and the National Institutes of Health’s National Center for Advancing Translational Sciences, grant UL1TR002494. Dr. Admon also received funding from grant K08HS027640 from the Agency for Healthcare Research and Quality (AHRQ), and Drs. Admon, Daw, and Kozhimannil received funding from grant R01HS0291 from AHRQ. The content is solely the responsibility of the authors and does not necessarily represent the official views of the funders.
Financial Disclosure
Lindsay K. Admon reports receiving consulting fees from the NIMHD, grant UG3HD1080053 (PI Bauer) and grant R01MD016892 (PI Peet); HRSA, grant #U1CRH03717 (PI Kozhimannil); the Commonwealth Fund, grant 20224055 (PI Gordon); and Medicaid and CHIP Payment and Access Commission (MACPAC) Consulting. The following entities paid consulting fees to her institution’s department: Division of Reproductive Health, Centers for Disease Control and Prevention, the ACOG Health Policy Division, and the Commonwealth Fund. The other authors did not report any potential conflicts of interest.
Each author has confirmed compliance with the journal’s requirements for authorship.
References
- 1.House TW. FACT SHEET: President Biden’s Maternal Health Blueprint Delivers for Women, Mothers, and Families. The White House. Published June 24, 2022. Accessed July 7, 2022. https://www.whitehouse.gov/briefing-room/statements-releases/2022/06/24/fact-sheet-president-bidens-maternal-health-blueprint-delivers-for-women-mothers-and-families/
- 2.Hung P, Henning-Smith CE, Casey MM, Kozhimannil KB. Access To Obstetric Services In Rural Counties Still Declining, With 9 Percent Losing Services, 2004–14. Health Aff (Millwood). 2017;36(9):1663–1671. doi: 10.1377/hlthaff.2017.0338 [DOI] [PubMed] [Google Scholar]
- 3.Kozhimannil KB, Hung P, Henning-Smith C, Casey MM, Prasad S. Association Between Loss of Hospital-Based Obstetric Services and Birth Outcomes in Rural Counties in the United States. JAMA. 2018;319(12):1239–1247. doi: 10.1001/jama.2018.1830 [DOI] [PMC free article] [PubMed] [Google Scholar]
- 4.Kozhimannil KB, Interrante JD, Tuttle MKS, Henning-Smith C. Changes in Hospital-Based Obstetric Services in Rural US Counties, 2014–2018. JAMA. 2020;324(2):197–199. doi: 10.1001/jama.2020.5662 [DOI] [PMC free article] [PubMed] [Google Scholar]
- 5.Kozhimannil KB, Interrante JD, Henning-Smith C, Admon LK. Rural-Urban Differences In Severe Maternal Morbidity And Mortality In The US, 2007–15. Health Aff (Millwood). 2019;38(12):2077–2085. doi: 10.1377/hlthaff.2019.00805 [DOI] [PubMed] [Google Scholar]
- 6.Merkt PT, Kramer MR, Goodman DA, et al. Urban-rural differences in pregnancy-related deaths, United States, 2011–2016. Am J Obstet Gynecol. 2021;225(2):183.e1–183.e16. doi: 10.1016/j.ajog.2021.02.028 [DOI] [PMC free article] [PubMed] [Google Scholar]
- 7.Petersen EE, Davis NL, Goodman D, et al. Vital Signs: Pregnancy-Related Deaths, United States, 2011–2015, and Strategies for Prevention, 13 States, 2013–2017. Morb Mortal Wkly Rep. 2019;68(18):423–429. [DOI] [PMC free article] [PubMed] [Google Scholar]
- 8.Chinn JJ, Eisenberg E, Dickerson SA, et al. Maternal Mortality in the United States: Research Gaps, Opportunities and Priorities. Am J Obstet Gynecol. Published online 2020. [DOI] [PMC free article] [PubMed] [Google Scholar]
- 9.Eisenberg JM, Power EJ. Transforming insurance coverage into quality health care: voltage drops from potential to delivered quality. JAMA. 2000;284(16):2100–2107. doi: 10.1001/jama.284.16.2100 [DOI] [PubMed] [Google Scholar]
- 10.Bureau UC. Uninsured Rates in Urban and Rural America. Census.gov. Accessed May 4, 2022. https://www.census.gov/library/visualizations/interactive/rural-urban-uninsured-2017.html
- 11.Wally MK, Huber LRB, Issel LM, Thompson ME. The Association Between Preconception Care Receipt and the Timeliness and Adequacy of Prenatal Care: An Examination of Multistate Data from Pregnancy Risk Assessment Monitoring System (PRAMS) 2009–2011. Matern Child Health J. 2018;22(1):41–50. doi: 10.1007/s10995-017-2352-6 [DOI] [PubMed] [Google Scholar]
- 12.Admon LK, Daw JR, Winkelman TNA, et al. Insurance Coverage and Perinatal Health Care Use Among Low-Income Women in the US, 2015–2017. JAMA Netw Open. 2021;4(1):e2034549. [DOI] [PMC free article] [PubMed] [Google Scholar]
- 13.McMorrow S, Dubay L, Kenney GM, Johnston EM, Caraveo CA. Uninsured New Mothers’ Health and Health Care Challenges Highlight the Benefits of Increasing Postpartum Medicaid Coverage. Urban Institute. Published 2020. Accessed October 13, 2021. https://www.urban.org/research/publication/uninsured-new-mothers-health-and-health-care-challenges-highlight-benefits-increasing-postpartum-medicaid-coverage [Google Scholar]
- 14.Shulman HB, D’Angelo DV, Harrison L, Smith RA, Warner L. The Pregnancy Risk Assessment Monitoring System (PRAMS): Overview of Design and Methodology. Am J Public Health. 2018;108(10):1305–1313. doi: 10.2105/AJPH.2018.304563 [DOI] [PMC free article] [PubMed] [Google Scholar]
- 15.D’Angelo DV, Le B, O’Neil ME, et al. Patterns of Health Insurance Coverage Around the Time of Pregnancy Among Women with Live-Born Infants -- Pregnancy Risk Assessment Monitoring System, 29 States, 2009. MMWR Surveill Summ. 2015;64(4):1–19. [PMC free article] [PubMed] [Google Scholar]
- 16.Daw JR, Winkelman TNA, Dalton VK, Kozhimannil KB, Admon LK. Medicaid Expansion Improved Perinatal Insurance Continuity For Low-Income Women. Health Aff Millwood. 2020;39(9):1531–1539. [DOI] [PubMed] [Google Scholar]
- 17.Daw JR, Kolenic GE, Dalton VK, et al. Racial and Ethnic Disparities in Perinatal Insurance Coverage. Obstet Gynecol. 2020;135(4):917–924. doi: 10.1097/AOG.0000000000003728 [DOI] [PMC free article] [PubMed] [Google Scholar]
- 18.Daw JR, Kozhimannil KB, Admon LK. Factors Associated With Postpartum Uninsurance Among Medicaid-Paid Births. JAMA Health Forum. 2021;2(6):e211054. doi: 10.1001/jamahealthforum.2021.1054 [DOI] [PMC free article] [PubMed] [Google Scholar]
- 19.Artiga: Health coverage and care for American Indians… - Google Scholar. Accessed November 9, 2022. https://scholar.google.com/scholar_lookup?title=Health+coverage+and+care+for+American+Indians+and+Alaska+natives&author=S+Artiga&author=R+Arguello&author=P+Duckett&
- 20.National Center for Health Statistics. Long-term trends in health insurance: estimates from the national health interview survey, United States, 1968–2018. Available at: https://www.cdc.gov/nchs/data/nhis/health_insurance/TrendHealthInsurance1968_2018.pdf. Retrieved November 11, 2022.
- 21.Kenney R. Health Insurance Coverage for Women of Reproductive Age, 2013–16. :21. [Google Scholar]
- 22.Thomson MD, Hoffman-Goetz L. Defining and measuring acculturation: a systematic review of public health studies with Hispanic populations in the United States. Soc Sci Med 1982. 2009;69(7):983–991. doi: 10.1016/j.socscimed.2009.05.011 [DOI] [PubMed] [Google Scholar]
- 23.Carter-Pokras O, Zambrana RE, Yankelvich G, Estrada M, Castillo-Salgado C, Ortega AN. Health status of Mexican-origin persons: do proxy measures of acculturation advance our understanding of health disparities? J Immigr Minor Health. 2008;10(6):475–488. doi: 10.1007/s10903-008-9146-2 [DOI] [PubMed] [Google Scholar]
- 24.Data Access - Urban Rural Classification Scheme for Counties. Published December 2, 2019. Accessed May 12, 2022. https://www.cdc.gov/nchs/data_access/urban_rural.htm
- 25.von Elm E, Altman DG, Egger M, Pocock SJ, Gøtzsche PC, Vandenbroucke JP. The Strengthening the Reporting of Observational Studies in Epidemiology (STROBE) Statement: Guidelines for Reporting Observational Studies. Ann Intern Med. 2007;147(8):573–577. doi: 10.7326/0003-4819-147-8-200710160-00010 [DOI] [PubMed] [Google Scholar]
- 26.Kozhimannil KB, Henning-Smith C. Improving Health Among Rural Residents in the US. JAMA. 2021;325(11):1033–1034. doi: 10.1001/jama.2020.26372 [DOI] [PubMed] [Google Scholar]
- 27.Heberlein M. Medicaid’s Role in Financing Maternity Care. :16. Accessed 12/07/22. https://www.macpac.gov/wp-content/uploads/2019/12/Medicaid%E2%80%99s-Role-in-Financing-Maternity-Care-presentation.pdf. [Google Scholar]
- 28.Jul 01 P, 2022. Medicaid Postpartum Coverage Extension Tracker. KFF. Published July 1, 2022. Accessed July 7, 2022. https://www.kff.org/medicaid/issue-brief/medicaid-postpartum-coverage-extension-tracker/ [Google Scholar]
- 29.Larson SL, Hill SC. Rural-urban differences in employment-related health insurance. J Rural Health Off J Am Rural Health Assoc Natl Rural Health Care Assoc. 2005;21(1):21–30. doi: 10.1111/j.1748-0361.2005.tb00058.x [DOI] [PubMed] [Google Scholar]
- 30.Urban-Rural Differences in Employer-Based Health Insurance Coverage of Workers - Coburn Andrew F., Kilbreth Elizabeth H., Long Stephen H., Marquis M. Susan, 1998. Accessed November 12, 2022. https://journals.sagepub.com/doi/10.1177/107755879805500406 [DOI] [PubMed]
- 31.Brooks MM, Mueller JT, Thiede BC. Rural-Urban Differences in the Labor-Force Impacts of COVID-19 in the United States. Socius. 2021;7:23780231211022096. doi: 10.1177/23780231211022094 [DOI] [PMC free article] [PubMed] [Google Scholar]
- 32.Henning-Smith C, Lahr M. Rural-Urban Difference in Workplace Supports and Impacts for Employed Caregivers. J Rural Health Off J Am Rural Health Assoc Natl Rural Health Care Assoc. 2019;35(1):49–57. doi: 10.1111/jrh.12309 [DOI] [PubMed] [Google Scholar]
- 33.Marquis MS, Buntin MB. How much risk pooling is there in the individual insurance market? Health Serv Res. 2006;41(5):1782–1800. doi: 10.1111/j.1475-6773.2006.00577.x [DOI] [PMC free article] [PubMed] [Google Scholar]
- 34.Swartz K. Markets for individual health insurance: can we make them work with incentives to purchase insurance? Inq J Med Care Organ Provis Financ. 2001;38(2):133–145. doi: 10.5034/inquiryjrnl_38.2.133 [DOI] [PubMed] [Google Scholar]
- 35.Chen X, Orom H, Hay JL, et al. Differences in Rural and Urban Health Information Access and Use. J Rural Health Off J Am Rural Health Assoc Natl Rural Health Care Assoc. 2019;35(3):405–417. doi: 10.1111/jrh.12335 [DOI] [PMC free article] [PubMed] [Google Scholar]
- 36.Edward J, Thompson R, Jaramillo A. Availability of Health Insurance Literacy Resources Fails to Meet Consumer Needs in Rural, Appalachian Communities: Implications for State Medicaid Waivers. J Rural Health. 2021;37(3):526–536. doi: 10.1111/jrh.12485 [DOI] [PMC free article] [PubMed] [Google Scholar]
- 37.Clark M. Medicaid and CHIP Coverage for Pregnant Women: Federal Requirements, State Options. Published online 2020:11. [Google Scholar]
- 38.Passel JS, Cohn D, Gramlich J. Number of U.S.-born babies with unauthorized immigrant parents has fallen since 2007. Pew Research Center. Accessed July 28, 2022. https://www.pewresearch.org/fact-tank/2018/11/01/the-number-of-u-s-born-babies-with-unauthorized-immigrant-parents-has-fallen-since-2007/ [Google Scholar]
- 39.Hoyert D. National Center for Health Statistics, Centers for Disease Control and Prevention. Maternal Mortality Rates in the United States, 2020. Published February 22, 2022. Accessed March 8, 2022. https://www.cdc.gov/nchs/data/hestat/maternal-mortality/2020/maternal-mortality-rates-2020.htm
- 40.Kroelinger CD, Brantley MD, Fuller TR, et al. Geographic access to critical care obstetrics for women of reproductive age by race and ethnicity. Am J Obstet Gynecol. 2021;224(3):304.e1–304.e11. doi: 10.1016/j.ajog.2020.08.042 [DOI] [PMC free article] [PubMed] [Google Scholar]
- 41.Access to Affordable Care in Rural America: Current Trends and Key Challenges. ASPE. Accessed May 4, 2022. https://aspe.hhs.gov/reports/access-care-rural-america [Google Scholar]
- 42.Liddell JL, Lilly JM. Healthcare experiences of uninsured and under-insured American Indian women in the United States. Glob Health Res Policy. 2022;7(1):5. doi: 10.1186/s41256-022-00236-4 [DOI] [PMC free article] [PubMed] [Google Scholar]
- 43.Kozhimannil KB, Interrante JD, Tofte AN, Admon LK. Severe Maternal Morbidity and Mortality Among Indigenous Women in the United States. Obstet Gynecol. 2020;135(2):294–300. doi: 10.1097/AOG.0000000000003647 [DOI] [PMC free article] [PubMed] [Google Scholar]
Associated Data
This section collects any data citations, data availability statements, or supplementary materials included in this article.