1. INTRODUCTION
One of the driving forces for recent developments in magnetic resonance microscopy (MRM) has been the explosion of genetically engineered mouse models. These models have opened avenues for understanding the basis of human diseases, as well as the relationship between genotype and phenotype. In addition, the environment, which can also modulate the phenotype, as well as gene expression patterns, can be well controlled in rodents. It has therefore become essential to develop and improve upon existing noninvasive techniques that can follow the longitudinal progression of disease, as well as the effects of putative treatments.
Among imaging techniques magnetic resonance imaging (MRI) is particularly well suited to phenotype rodent models of disease because of its unparalleled rich soft tissue contrast. Much progress has been shown in high-field magnetic resonance instrumentation, including gradient and radiofrequency (RF) coils, increased computing power and efficient software processing of large arrays, as well as animal and specimen preparation techniques. All these have allowed the acquisition of magnetic resonance images with spatial resolutions high enough to characterize changes in the volume and microstructure of mouse body organs. The acquisition of MR images at resolutions higher than 300 microns (Johnson, Thompson et al. 1986) has been defined as magnetic resonance microscopy (for comprehensive treatment see (Callaghan 1991). However, it has now become routine to acquire images at resolution of, or higher than 100 microns (Glover and Mansfield 2002) (Tyszka, Fraser et al. 2005). To resolve the same kind of anatomical detail in a mouse as in a human, MRM operates with much smaller voxel sizes (1 nl for 100 μm-sized cube, or 10 pl for a 22μm-sized cube) compared to clinical imaging (1ul, for a 1mm-sized cube); differences which translate into 4–5 orders of magnitude weaker signal coming from one voxel. To compensate for this signal loss, it has been necessary to develop specific hardware and software for image formation, reconstruction, and analysis.
Because of its three-dimensional (3D) nature, MRM allows appreciating the rodent anatomy in fixed specimens free of spatial distortions inherent to optical histology (Suddarth and Johnson 1991) (Johnson, Benveniste et al. 1993). In contrast with traditional histology, the hydration of tissues is preserved in MRM, and both the whole body and then isolated organs can be imaged (at different resolutions to increase the level of observed detail), since MRM is nondestructive. While the inherently digital MRM images can be virtually resliced in any arbitrary plane, the spatial relationships and connections among anatomical structures, as well as their shapes remain unaltered. From a structural, qualitative perspective, MRM can exploit a plethora of contrast mechanisms to differentiate tissue types. In addition, quantitative data can complement the global picture one can obtain from MR. Quantitative volumetric measures and shape parameters can be used to characterize normal strains of mice, models of disease at distinct time points in the evolution of that disease, or treated mice versus controls. Atlases are being developed and made available online, to provide baseline estimates for the variability within a given population, as well to help phenotype mouse models of disease.
Perhaps the most important attribute of MRM in small animals is the ability to image the live animal longitudinally. Functional measures of the heart, lungs, and brain complement the picture of the anatomy. Besides normal physiology in the adult rodent, MRM has the potential to illustrate changes occurring with development and aging, as well as to characterize abnormal lesions from ischemia, to cancer, or the migration of stem cells. Because of its nondestructive nature, and the recent availability of multimodal probes, MRM can be now used in conjunction with other in vivo imaging modalities such as SPECT, PET, or CT, providing different probes of anatomy and function. One can perform nondestructive, volumetric analysis studies using MR and still have the possibility of performing optical histology studies after MR imaging.
Together, these attributes of MR make it a powerful method for 3D, spatially coherent, high-resolution imaging of fixed specimens, an invaluable tool for the study of living tissue, while holding great promise for functional measures (from blood flow, perfusion, to gas dynamics and brain function) and even molecular information (Hammoud, Hoffman et al. 2007) (Terreno, Castelli et al.).
Among its numerous applications, MRM has been used intensively in the past 10 years to phenotype small animals of human disease—to assess structural (Johnson, Cofer et al. 2002) and functional (Bucholz, Ghaghada et al. 2010) phenotypes in the adult and developing mouse (Dhenain, Ruffins et al. 2001) (Petiet, Kaufman et al. 2008), as well as for drug development (Beckmann, Laurent et al. 2004), in toxicology (Johnson, Ryan et al. 2006), and genetics (Badea, Johnson et al. 2009; Badea, Johnson et al. 2009). This chapter starts by explaining the basic aspects of image formation in MRM, with an emphasis on the differences from clinical MRI configuration and demands. Mechanisms for contrast manipulation in MR and the benefits of contrast-enhancing agents are described. Given these techniques, also covered are the length of MR scans required to achieve sufficient resolution, sensitivity demands, and special protocols for animal-handling and specimen preparation. We will illustrate recent advances in imaging rodent anatomy, follow with functional aspects that are some of the main strengths of live animal imaging made possible by MR, and end by highlighting recent trends in MRM, including imaging genetics.
1.1 BASIC PRINCIPLES OF IMAGE FORMATION AND HARDWARE REQUIREMENTS
While MRM may appear to be a natural extension of clinical MRI to small animal imaging, the transition has been accompanied by significant challenges. The major problem is that small animal samples require smaller voxels to achieve comparable anatomic resolution in small animals. Since fewer protons occupy these smaller voxels, the signal is substantially weaker. To address this problem, most small animal imaging studies are performed at higher magnetic fields (4–16 T) than clinical studies (usually 1–3 T), to benefit from increased magnetization. Other steps towards improving the signal-to-noise ratio (SNR) include using more efficient detectors for the MR signal i.e. RF coils, as well gradients that are stronger (500–10000 mT/m versus 10–50mT/m gradient strength) and faster (1000–10000 Tm−1s−1 versus 10–200Tm−1s−1 slew rate) (Johnson, Gewalt et al. 1991) (Hurlston, Cofer et al. 1997). Strong gradients with high slew rate, high duty cycle, and high power amplifiers are critical for achieving fast imaging scans of samples that occupy small volumes 22×11×11 mm3 (~2.5 cc) for a mouse brain compared to 20×20×20 cm3 (~8000 cc) for a human brain. The use of higher magnetic fields introduces important physical effects that are not as prominent in the clinical domain, e.g. susceptibility variations at the interface of tissue and air, which may result in signal drop and distortions. Relaxation parameters also change when operating at higher fields. Biological motion from the heart (300–600 beats/minute (bpm) in the mouse versus 60–12 bpm in humans), and respiration (breathing rates from 50–70 breaths per minute in mice versus 20 breaths/minute in humans) pose additional challenges to achieving the highest resolution.
The principles of image formation, as well as basic hardware components, are shared by MRM with its clinical parent, MRI, and are well described in (Haacke, Brown et al. 1999) (Vlaardingerbroek and Boer 2003). The NMR signal from a source, such as a small animal, positioned inside a magnetic field is generated following excitation by a transmitter coil, detected by a receiver coil, and reconstructed usually by means of a Fourier transform (Ernst and Anderson 1966), (Kumar, Welti et al. 1975). The origin of the signal is most often the motion of nuclear spin magnetic moment characteristic to hydrogen atoms in water (110 mol/l) and lipid components of the animal’s body. The magnetic spins precess (Figure 1a) about the local magnetic field (B0, defining the z axis) at the Larmor frequency (ωL), proportional to the local magnetic field strength (B0), and a constant called the gyromagnetic ratio (γ):
Figure 1.
(a) The source of signal in MR is the proton magnetization, which precesses around the static magnetic field at the Larmor frequency. (b) In a reference frame rotating at this Larmor frequency M0 appears to be stationary. In the 90-FID pulse sequence, the net magnetization is rotated down into the x′y′ plane with a 90° RF pulse. (c) A changing magnetic flux induces a current in the receiver coil. (d) The signal recorded in the laboratory frame following the RF pulse constitutes the FID.
The Larmor frequency for 1H changes from 64 MHz at 1.5 T to 400 MHz at 9.4 T. A collection of protons in a magnetic field will all precess at this same frequency. Since the protons are precessing together, their coherent motion generates a physical property of the tissue, the magnetization M0, which is given by the sum over all individual protons. This magnetization is the true source of the signal. Consider a rotating frame of reference, with angular velocity corresponding to the Larmor frequency (Figure 1b). Using this reference frame helps us understand the generation of the NMR signal from M0. Since the reference frame is rotating at the Larmor frequency, M0 will appear stationary and aligned with the magnetic field. If one applies an oscillating magnetic field at the Larmor frequency, when resonance conditions are met), one can efficiently move M0. In the 90– free induction decay (FID) pulse sequence (Figure 1b), the net magnetization was rotated down into the x′y′ plane with a 90° RF pulse. M0 now lies along the y′ axis. But, this is in the rotating reference frame. In the laboratory frame, which is stationary, the changing magnetic flux induces a current in the surrounding coil (Figure 1c), which is sent to an amplifier. The recorded signal constitutes the FID (Figure 1d). As the magnetization continues to precess in the x′y′ plane, the individual protons see slightly different fields because of their local molecular environment. As a consequence of these differences, a gradual loss of coherence occurs, hence the decay.
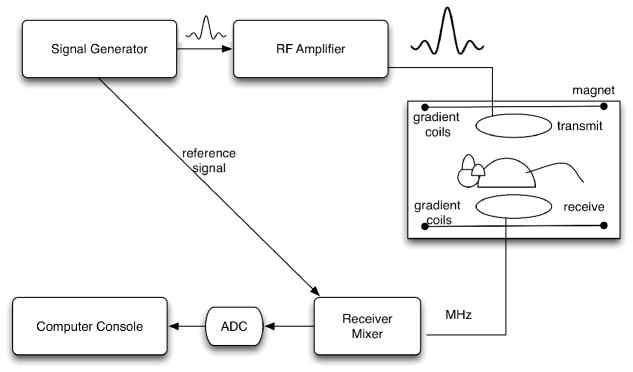
A schematic representation of hardware required for forming an MR image is shown in Figure 2. Briefly, a biological sample is placed within the center of a (usually) superconducting magnet, which generates a strong, but static field. Superconducting magnets need to be cooled using cryogens, thus decreasing the power requirements for maintaining the magnetic field. Magnets are also shielded from magnetic fields originating from outside the sample, either passively, using a Faraday cage, or actively compensating for the presence of external magnetic fields.
Figure 2.
The basic elements of the MR system include an RF pulse generator, whose signal is amplified before being sent to the transmitter coil. The same signal is used to synchronize the acquisition of the MR signal coming from the receiver coil. After unmixing and passing through the analog-to-digital converter, the real and imaginary components are used to reconstruct and visualize the MR image either by the same console computer used to control the RF and the gradients, or offline.
An RF pulse is sent from the pulse waveform generator (transmitter, frequency synthesizer) to an RF amplifier, and finally to the transmitter coil, where it excites the biological sample. This transmit coil must produce a uniform field B1 perpendicular to B0 (the static magnetic field), and therefore have relatively large dimensions.
The signal coming from on-resonance spins, as they return to equilibrium, is collected by the receiver coils. The receiver coil has to be sensitive to the relatively low detected signal. It is usually of small dimensions, just large enough to be wrapped around the imaged sample for a volume coil, or a surface coil placed in close proximity to the area of interest can be used. The disadvantage when using such a coil is that the high sensitivity and high signal at the sample surface falls off with increasing depth. Improvements in coil performance help improve sensitivity, spatial resolution (Hurlston, Cofer et al. 1997), potentially reducing acquisition time. The improvement may come from developing coils that are 1) smaller, tight-fitting, or implanted; 2) circularly polarized (quadrature) coils ( improvement in SNR); 3) birdcage, or 4) cryogenic or superconducting coils with negligible resistance at low temperatures (3–10-fold improvement in SNR). The use of phased arrays of multiple receiver coils operating independently provide similar SNR as single detectors, over larger field of views.
The signal is digitized by the main computer, which also controls the RF transmit and receive, as well as the gradients. The role of the gradient fields is to create a spatially varying magnetic field, which allows the spatial encoding of the signal to determine the location of the signal source according to small variations in the resonant frequency and phase. Three pairs of gradient coils, generating orthogonal and linearly varying magnitudes of magnetic field, are used to encode the spatially varying signal.
In essence, the MR signal is sent from the receiver coil to the receiver mixer where it is amplified by a low-noise amplifier before being sent to the analog-to-digital converter (ADC). A splitter provides imaginary and real components, corresponding to the x′ and y′ components of the magnetization vector. These are used to provide magnitude and phase information for each location in the spatial frequency domain, or k-space.
An image is typically generated through the repetition of a sequence of RF and gradient waveforms (pulse sequence) that encode the image. The signals from the repeated sequence are collected by the computer and transferred to software that performs the image reconstruction.
1.2 CONTRAST MECHANISMS
The signal in MRI is governed by multiple parameters such as the proton density, their polarization, relaxation rates (R1, R2, and R2*; relaxation rates are the inverse of relaxation timesT1, T2, T2*), diffusion properties of water and water exchange dynamics. This multivariate signal dependence is the source of the rich soft tissue contrast, which can be tuned by choosing appropriate acquisition parameters.
Since the samples in MRM are small (a mouse is almost 3000-times smaller than a human, per weight), the voxels required are small compared with clinical imaging. Also, the signal coming from these smaller voxels is much weaker. To achieve microscopic resolution, one must somehow increase the sensitivity. One method to do so is to operate at higher magnetic field. But when this is done, it is important to be cognizant of the changes in physics induced by the higher magnetic field.
After the application of a 90° RF pulse that tips the magnetization vector into the transverse plane (see Figure 1), the longitudinal component of the magnetization recovers at an exponential rate characterized by tissue characteristic constant T1, the spin-lattice relaxation time. At a time t the longitudinal magnetization is given by:
At 1.5 T, typical for clinical systems, T1 is 0.8 s for brain white matter, but 2 s for cerebrospinal fluid (CSF). As a consequence, white matter recovers its longitudinal magnetization more quickly than CSF (Haacke EM, Brown RM et al. 1999), as illustrated in Figure 3. The transverse magnetization, however, decays at a rate governed by T2, or to be more precise T2* (called T-2-star), describing in homogeneities of the local magnetic field.
Figure 3.
Differences in the spin-lattice (T1) and spin-spin (T2) relaxation times of tissue compartments can be emphasized by intelligent manipulation of acquisition parameters, such as echo time (TE) and repetition time (TR). In the left panel, the longitudinal magnetization of white matter (black) with T1=0.8 ms recovers faster than cerebrospinal fluid with T1=2 s (gray). The differences are seen using a relatively short repetition time (0.4 s). In the right panel, the signal from liver (black), which has a short T2=40 ms, diminishes faster than the signal from fat, with a longer T2 of 60 ms (gray). These differences are captured at an echo time of 20 ms. This figure has been adapted from (Driehuys, Nouls et al. 2008). It is reprinted with permission from the ILAR Journal, Institute for Laboratory Animal Research, National Research Council, Washington, DC (www.nationalacademies.org/ilar).
The MR image reflects the properties of the transverse magnetization at a time TE (echo time) after application of the RF pulse (B1 field). As RF pulses are repeated with a periodicity given by TR (repetition time) the intensity of the MR image will be proportional to the value of the starting longitudinal magnetization at TR. Thus, TE and TR interact with T1 and T2 to modulate the MR signal.
The endogenous contrast (based on proton density, T1 and T2 differences) can be supplemented with exogenous contrast agents, which affect relaxation properties of water protons to induce dramatic changes in T1 and T2. Increased signal is obtained due to T1 shortening by paramagnetic agents, while signal drop is due to strong, but negative, susceptibility effect of superparamagnetic agents. These paramagnetic or superparamagnetic compounds are based on the strong magnetic moment of unpaired electrons. Paramagnetic probes are typically complexes of gadolinium (Gd) containing 7unpaired electrons, in which the metal ion is coordinated by a chelating ligand in order to reduce its toxicity (e.g. GdDTPA or GdDOTA). Superparamagnetic probes are iron oxide nanoparticles, containing hundreds or thousands of iron atoms, exerting a high magnetic moment. Again, biocompatibility is achieved by decorating the iron core with an organic coating, e.g. dextran. The magnitude of the contrast agent-induced changes in proton relaxation times depends on the molar relaxivity of the contrast agents (a measure of their efficiency) and their concentration in tissue. Typically, the method enables the detection of signal changes induced by local concentrations of the contrast agents of 10−3–10−6 molar(Hammoud, Hoffman et al. 2007). In general, these changes are not specific to an organ, tissue, or lesion.
The use of blood pool contrast agents (Clarkson R.B. 2002) allows one to image the vascular system and to evaluate cardiac function (Moriarty, Finn et al.) and accumulation in lesions (Giesel, Mehndiratta et al. 2010). These are available commercially e.g. gadofosveset (Vasovist, Bayer Schering Pharma, Wedding, GE; MS325, EPIX Medical, Cambridge, MA, USA) or ferumoxtran ultra small superparamagnetic iron oxide (Combidex, AMAG Pharmaceuticals Inc, Cambridge, MA), or are developed by research laboratories (Weissleder, Elizondo et al. 1990; Ghaghada, Hawley et al. 2008).
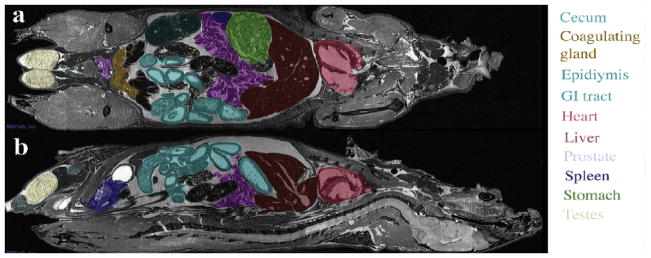
Major organs, such as the liver, heart, or kidneys, can be identified and segmented in the mouse body, imaged at 50μmresolution (Figure 5) on a 7T MR scanner with a GE console. The spatial relationships among organs can readily be appreciated and the slice used to cut through the digital volume can be oriented in any of the three cardinal planes (Figure 5 shows a horizontal (a), and a sagittal (b) cut), or in an arbitrary plane).
Figure 5.
Whole body imaging of a fixed-perfused mouse specimen at 50 μm resolution allows the identification of major organs, as well as the assessment of microstructural properties. Reprinted with permission from (Maronpot, Sills et al. 2004).
The adaptation from MRI to MRM has required considerable technical developments, including operating at higher magnetic field strengths, improved encoding strategies, and specialized radio-frequency coils (Johnson, 2002). But, these developments have opened a number of fascinating applications for the basic scientist, which we will illustrate in the following sections.
2 ANIMAL PREPARATION FOR IMAGING
One of the main advantages of MRM is the capability to image live animals, and to be able to repeat the imaging at multiple time points, e.g. during disease progression to assess the extent of pathological changes, or during treatment to assess its efficacy. However, the animal is located within the small bore of a strong magnet, which makes it challenging for the investigator to supervise its physiological state or to administer contrast agents. An excellent treatise of animal handling for in vivo imaging can be found elsewhere (Hedlund, Cofer et al. 2000), in this section we will cover the basic elements. It is essential that magnet compatible equipment should be used in the proximity of the magnet and a remote physiological system must be used to monitor and adjust body temperature, level of anesthesia, or to trigger the imaging acquisition. To counteract the effects of motion associated with respiration and to control lung volume, animals can be supported by a ventilator. This way, the position of the lungs is precisely reproduced from one breath to the next (Hedlund, Cofer et al. 2000) (Mai, Badea et al. 2005), and the image acquisition can be triggered as specific phases in the respiratory cycle, where motion is minimal (end expiration or full inspiration). To achieve ventilator-synchronous acquisition, animals have to be intubated with an endotracheal tube, and closely monitored. ECG monitoring electrodes can be used to achieve cardiac gating to specific intervals during the cardiac cycle.
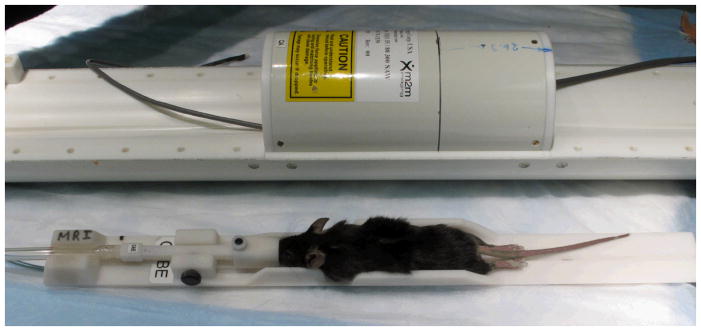
MR-compatible monitoring systems are commercially available (e.g. BIOPAC MP 150, from BIOPAC Systems, Inc, Galeta, CA) to ensure adequate animal support for the duration of the scan. These can be used in conjunction with specialized cradles that facilitate the accurate positioning/repositioning of the animal. For example, a mouse cradle can accommodate ECG pads, a respiratory pillow, a temperature probe, and a nose cone equipped with an incisor bar, which delivers gas anesthesia, while ensuring proper positioning (Howles, Nouls et al. 2009). To maintain the animal’s normal body temperature, a thermistor attached to the cradle controls the temperature of a heating agent (water or air) flowing through the cold magnet core. Using such a device, the animal can be quickly setup within the coil(Figure 5), with the head reliably fixed in position.
Figure 5.
A dedicated cradle helps to quickly and accurately reposition a mouse within the radiofrequency coil (top figure), while allowing anesthesia to be administered by a nose cone, and to monitor physiologic parameters via a respiratory pillow, temperature probe and/or electrodes.
Since voxel size needs to be small to resolve structures in the rodent body, the signal that comes from the voxel will be proportionally smaller. For example, a voxel size of 20 μl would be sufficient for imaging the human lung, but to obtain comparable details in the mouse chest, the voxel size would be perhaps 0.6 nl (Driehuys, Nouls et al. 2008). This corresponds to a signal 33-times smaller coming from such a voxel. One way to compensate for such a signal loss is to inject parmagnetic contrast agents, such as Gd chelates (e.g. Magnevist, ProHance, Multihance, etc). The paramagnetic agents shorten the relaxation times and allow faster MR acquisitions, important when imaging live animals. Contrast agents are usually administered by intravascular (IV) injections. One single injection may suffice, if the contrast agent has a sufficiently long circulation time, or a pump may be used for continuous infusion of small volumes of fluid. Other techniques to obtain higher image contrast increase the number of spins aligned versus those anti-aligned to the applied magnetic field, i.e. the amount of polarization(Viale, Reineri et al. 2009). To deliver hyperpolarized gas to the lungs the flow of air must be rapidly switched to a mixture of hyperpolarized gas and oxygen at specific phases in the breathing cycle (Driehys and Hedlund, 2007) (Driehuys, Moller et al. 2009). Because of the potential high increase in sensitivity, active efforts are being made to increase polarization levels and delivery efficiency to image lung perfusion and gas exchange (Driehuys, Cofer et al. 2006) (Fain, Korosec et al. 2007), as well as to image blood flow and perfusion in the brain (Swanson, Rosen et al. 1997), (Zhou, Sun et al. 2010), or to estimate oxygenation (Wolber, Cherubini et al. 2000).
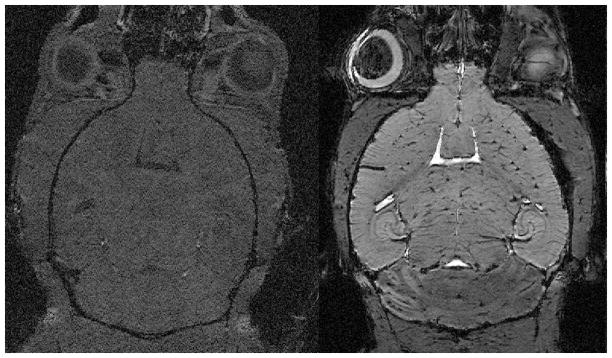
Image resolutions of 100 μm isotropic have become standard in small animal imaging in vivo, but higher resolutions can be obtained from fixed specimens, which can be scanned for long times (sometimes more than 24 hours) to yield high signal-to-noise ratio, or to use multiple contrast mechanisms. To further enhance contrast-to-noise ratio, smaller specimens, such as embryos, can be immersed in a solution of fixative (e.g. Bouin’s) and MR contrast agent (Petiet, Hedlund et al. 2007). For imaging larger specimens a vascular perfusion is done with a mixture of contrast agent (ProHance, Bracco Diagnostics, Princeton, NJ), and fixative (e.g. formalin) to achieve what has been coined as “active staining” (Johnson, Cofer et al. 2002). Postnatal aged animals need to be first flushed of blood with a mixture of saline and ProHance, followed by fixation perfusion with formalin and ProHance (Petiet and Johnson 2010). The active staining methods allow acquiring MR images of fixed specimens with exquisite contrast and in shorter times compared to those obtained from simply formalin fixed specimens.
3 ANATOMICAL IMAGING
As shown in the previous section, MRM is well suited to study rodent histology (Johnson, Benveniste et al. 1993; Johnson, Cofer et al. 2002; Johnson, Cofer et al. 2002) Compared to specimen imaging, live animal imaging is restricted to shorter scans and is complicated by motion. Blood flow, cardiac, respiratory, and peristaltic motions are potential sources of imaging artifacts. One approach to circumvent these problems is to acquire images in a manner that exploits the periodicity of the physiological signal. Other strategies aim to sample faster, switch from Cartesian to radial and spiral acquisition, and/or to correct for motion artifacts. The next sections present examples where specific organs are imaged in the live animal, the associated challenges, and proposed solutions.
3.1 BODY IMAGING
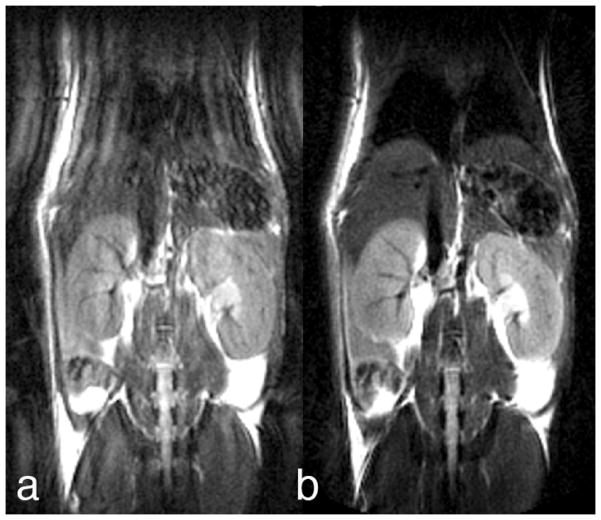
Respiratory motion is one of the first challenges in imaging the animal’s body in vivo. Active mechanical ventilation can be used to synchronize the acquisition with the respiration. However, this approach has two drawbacks. It requires intubation of the animal, which significantly reduces the throughput. Also there is some morbidity associated with the intubation, which can limit the number and frequency of scans in a longitudinal study. Alternatively, methods for motion correction similar to those used in humans can be adapted to small animal imaging. One example is the use of PROPELLER (Periodically Rotated Overlapping Parallel Lines with Enhanced Reconstruction) for imaging the mouse body (Pipe 1999). The method (Pandit, Qi et al. 2010)relies on a novel strategy to sample the raw (Fourier) data. Figure 6a shows a coronal image of a free-breathing mouse acquired with a conventional Cartesian sampling strategy. The image is the result of 256 pulses repeated over a period of up to 12 minutes. Since the data are acquired without synchronization with respiration, the inconsistencies of the respiratory state of the animal leads to the ringing artifacts seen in Figure 6a. The image, in Figure 6b was obtained from the same free-breathing animal using the PROPELLER method. The raw (Fourier) data used to reconstruct the image, has been sampled with “blades”—produced from bursts of data. Each blade is acquired at a different angle. A very low-resolution image can be reconstructed from each of these blades. The phase of the data is used to determine if there are motion differences between the individual blades. When motion irregularities occur, that particular blade of data is rejected. As is evident in Figure 6b, the motion artifacts are significantly reduced.
Figure 6.
Effects of motion (ringing around sharp edges) can be greatly decreased relative to Cartesian Fast Spin Echo (a) using PROPELLER (b) imaging These images were acquired on a 7T magnet at 195 × 195 μm resolution in plane, 1 mm slices, TR=3 s, echo spacing 5ms, echo train length 24 (lines per blade), in ~10 min. Reproduced with permission from (Pandit, King et al. 2008).
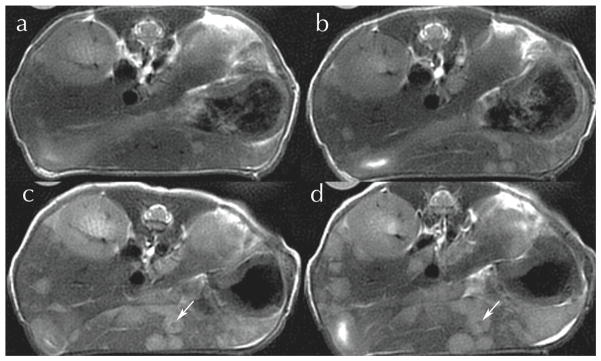
A particularly appealing application of PROPELLER imaging is characterizing cancer lesions, e.g. metastases from implanted human cell lines of HTN29 colon carcinoma (Pandit, 2010 — personal communication). Careful selection of the acquisition parameters allows obtaining images in which the signal is heavily dependent on differences in tissue spin-spin relaxation (T2) (Figure 7). Liver metastases are very visible in these T2-weighted images obtained with a two-shot PROPELLER with TE of 67 ms and TR of 3 s, at 125 μm in-plane resolution, 1 mm between planes, acquired in only 33 minutes on a 7T magnet. Lesions are visible in the ventral liver lobe starting with day 17 after inoculation and they continue to increase in size as illustrated in Figure 7. Moreover, one can discern a hypointense necrotic core (arrows) surrounded by hyperintense lesion mass.
Figure 7.
PROPELLER images of a free-breathing mouse follow the evolution of metastatic colon cancer in the liver at (a) day 21; (b) day 24; (c) day 28; (d) day 31 post-inoculation. Lesions measuring < 200 μm seen in day 21 can be seen in the 1 mm slices out to the point where the necrotic core begins to form (arrows). Courtesy Dr. Prachi Pandit, PhD.
3.2 BRAIN
MR has been extraordinarily valuable in imaging the brain because of the superb contrast between gray and white matter. Differences in T1 provide superb morphologic contrast in the clinic. And differences in T2 provide the most frequently used method for delineating pathology. Unfortunately at higher magnetic fields used for small animal studies, these mechanisms are less effective. In addition, the use of contrast agents in the brain is hindered by the blood brain barrier (BBB). Several groups have recently described approaches to circumvent this problem by opening the blood brain barrier, which can also be done using ultrasound (Choi, Pernot et al. 2007)(Hynynen, McDannold et al. 2001)(Howles, Bing et al. 2010). This improves both the signal to noise by reducing the T1 and in some cases the contrast to noise. Such images can allow one to distinguish details such as the hippocampal layers, white matter tracts, as well as the organization of the vascular network(Figure 8). The contrast is much higher than what was obtained without opening the BBB even for a longer TR in previous studies.
Figure 8.
In Vivo Images of the mouse brain before and after infusion of Gd-DTPA through and opening the blood brain barrier. Both images were acquired with the same sequence and parameters: Spoiled gradient recalled image (SPGR), TE=5 ms, TR=28 ms, flip angle 30°, BW=15 kHz, resolution 40×40×200 μm. Courtesy of Nicholas Laucis, Duke Center for In Vivo Microscopy.
We have recently used the method to detect amyloid plaques in a transgenic mouse model (Jankowsky, Slunt et al. 2005). Opening the blood brain barrier globally reduces the T1 of the brain parenchyma, permitting the use of a shorter TR, i.e. more rapid scanning. At the same time we have increased the repetition time and used a multiecho sequence processed in Fourier domain (Sharief and Johnson 2006) to enhance tissue differentiation on the basis of T2. The in vivo image shown in Figure 9 was acquired using a TR of 400 ms, and an echo train length of 8, with spacing of 6.5 ms, at a spatial resolution of 40×52×625 μm, with an acquisition time of less than 2 hours. The plaques, appearing with lower intensity have a shorter T2 than the surrounding tissues. We speculate that this might be due to the presence of iron in the plaque.
Figure 9.
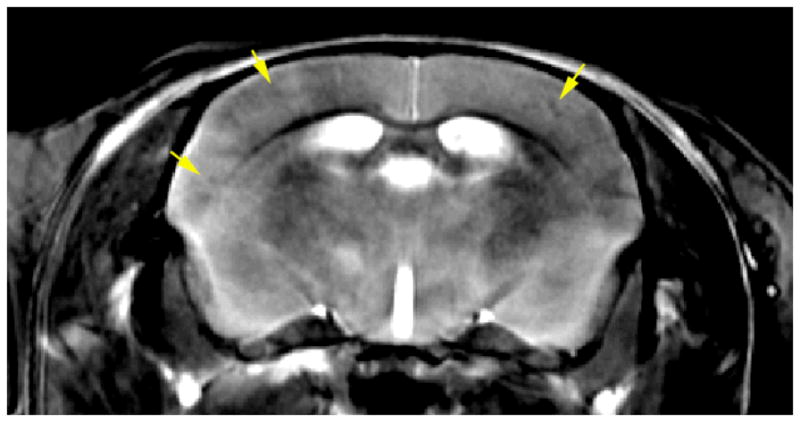
In vivo imaging of the mouse brain after Gd-DTPA delivery in conjunction with ultrasound opening of BBB. (TR=400ms, ETL=8 echoes, echo spacing 6.4 ms, resolution 40×52×625 μm, matrix size of 512×512×32 slices, BW 62.5 kHz. Total acquisition time is under 2 hours. Note reduced signal from the plaque (arrows).
Several investigators have uses targeted contrast agents for MR visualization of amyloid plaques. These agents can be modified to enhance BBB permeability e.g. using a polyamine modification (Poduslo, Wengenack et al. 2002) or delivered in conjunction with opening of the BBB (Sigurdsson, Wadghiri et al. 2008). The targeted agents bind specifically to the amyloid plaques, resulting in enhanced local contrast.
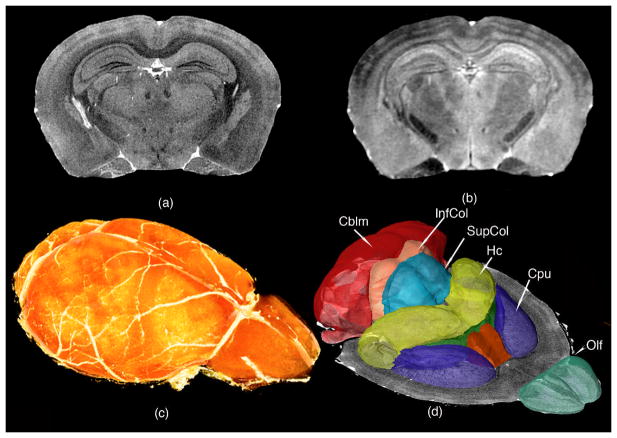
The use of MR to study fixed specimens i.e. MR histology was first suggested in 1993 (Johnson, Benveniste et al. 1993). Since the tissues are fixed, one can use specialized methods to actively stain the tissues and longer scanning times to attain even higher spatial resolution than attained in vivo (Johnson, Cofer et al. 2002). As with the actively stained in vivo studies, one can exploit several different sources of contrast as shown in Figure 10. For example, a T1-weighted scan (Figure 10a) is useful to accurately determine the borders of gray matter structures, such the superior and inferior coliculi, olfactory bulbs, or hippocampus, as well as its subfields; or to identify cortical layers and white matter tracts (Figure 10a). A longer T2-weighted scan (Figure 10b) adds rich information on thalamic nuclei, such the medial and lateral geniculate. This information from the two scans can be combined to segment the brain compartments (Ali, Dale et al. 2005) (Sharief, Badea et al. 2008) (Johnson, Badea et al. 2010), and to infer information on their on their shape, size, and location relative to the each other and to the whole brain (Figure 10 c and 10d).
Figure 10.
(a) T1-weighted and (b) T2-weighted images of the actively stained mouse brain offer rich contrast to differentiate and segment brain regions, and can help determine the genetic basis of their volume variation; (c) Volume rendered T1 image showing the brain surface; (d) Surface rendering of structures that have been segmented and quantified, including olfactory areas (Olf), striatum (CPu), septal nuclei, fimbria, hippocampus (Hc), superior and inferior colliculi (SupCol, InfCol), and cerebellum (Cblm). Reprinted with permission from (Badea, Johnson et al. 2009).
The volumes of segmented structures can give information on the covariance structure in the CNS of mouse strains that have been well genotyped, e.g. the BXD family. The high estimates of heritability for these structures (Badea, Johnson et al. 2009) allows us to believe that it will be possible to map genes responsible for variations in the anatomical phenotype.
3.3 ATLASING EFFORTS
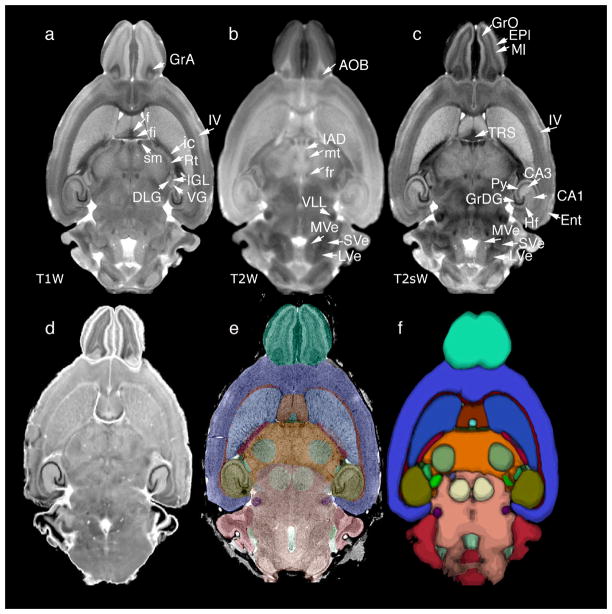
Analogous to efforts in human brain imaging, the mouse neuroimaging community has developed brain atlases, for several mouse strains including C57BL/6, 129S1/SvIm (MacKenzie-Graham, Lee et al. 2004) (Ma, Hof et al. 2005)(Badea, Ali-Sharief et al. 2007)(Ma, Smith et al. 2008; Johnson, Badea et al. 2010). The digital imaging task force of the International Neuroinformatics Coordinating committee (INCF, www.incf.org) is developing tools to facilitate the international sharing of data from the mouse brain (Hawrylycz, Boline et al. 2009). Waxholm Space (WHS), one such tool, is a coordinate system based on multispectral 3D data from three different MRM imaging protocols and conventional Nissl stained histology (Figure 11). Thirty-seven substructures of the brain have been labeled and the data and visualization tools are freely available on line (http://www.civm.duhs.duke.edu/neuro201001/ndex.html). Data from 13 additional specimens scanned using the same imaging protocol has allowed construction of an average atlas with T1-weighted, a T2-weighted, and T2*-weighted images, where one can distinguish with increased precision gray mater nuclei and white matter bundles, as well as construct an average label and probabilistic atlas.
Figure 11.
multiple specimens imaged with MRM have been used to generate population-averages: (a) T1-weighted (T1W), (b) T2-weighted (T2W), and (c) T2*-weighted (T2s); (d) also a 3D volume of Nissl histology was acquired on one of the specimens; (e) labels defined on the one specimen atlas images can be used to map other mouse brains; (f) labels from multiple specimens have been used to produce a probabilistic atlas that gives insight into volume and shape variability. Modified and reproduced with permission from (Johnson, Badea et al. 2010).
Such atlases can be used to estimate limits of normal variability within one strain, as well as to make comparisons across strains and characterize populations of mouse models of neurological disorders.
3.4 DIFFUSION TENSOR IMAGING
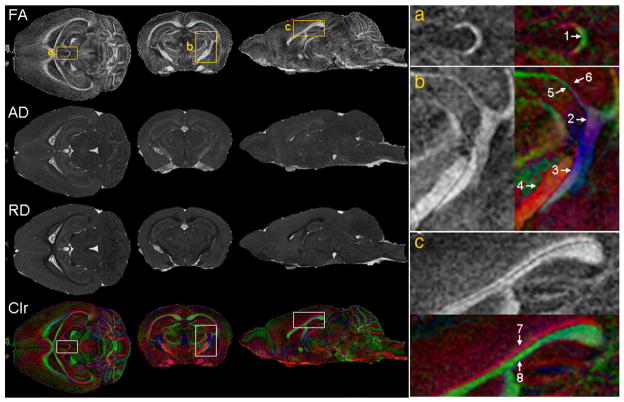
The diffusion properties water in tissue can be used to complement the information from T1-weighted, T2-weighted, and T2*-weighted images of the rodent brain (Basser and Pierpaoli 1996) (Le Bihan, Mangin et al. 2001) (Mori, Itoh et al. 2001), and provide information on the degree of orientation in an image. The richness of the tensor information supports a number of different diffusion-related parameters, and helps characterize the brain microstructure. Figure 12 illustrates a few important parameters derived from the diffusion tensor. FA (fractional anisotropy) reflects how anisotropic the diffusion in one voxel is. AD (axial diffusivity) is the primary eigenvalue, representing diffusivity along the major axis of the tissue. RD (radial diffusivity) is the mean of the secondary and tertiary eigenvalues, characterizing diffusivity perpendicular to the long axis of the tissue. White matter exhibits higher anisotropy, characterized by the FA, higher AD, and lower RD than the gray matter, since in white matter bundles, in the axon and its surrounding extracellular space, the parallel diffusivity is higher and the perpendicular diffusivity is lower compared to those in the soma. These images, which characterize orientation, can be used to distinguish small white matter bundles, such as the habenular commisure, or among fibers located closely in space such as fimbria, optic tract, stria terminal is, cerebral peduncle; or the cingulum from the rest of the corpus callosum (Figure 12).
Figure 12.
Diffusion tensor imaging (DTI) provides rich information on white matter structures, connectivity patterns, as well as the integrity of these connections in the mouse brain. Among the parameters calculated from DTI are: FA (fractional anisotropy), AD (axial diffusivity), RD (radial diffusivity), and Clr (color-coded orientation map of the primary eigenvector. Green: left-to-right; red: rostral-to-caudal; blue: dorsal-to-ventral). The right column shows magnified views that correspond to the regions specified by the rectangles (a, b, and c) in the left column. Arrows indicate structures that are better discerned using directional information on the colormap: 1. Habenular commissure; 2. Fimbria; 3. Optic tract; 4. Cerebral peduncle; 5. Thin branch of optic tract adjacent to 6. Thin branch of fimbria; 7. Cingulum (rostro-caudal orientation); 8 Corpus callosum (medial to lateral orientation). Reproduced with permission from (Jiang and Johnson 2010).
Fiber tracts can be reconstructed based on DTI using tractography algorithms (Mori, Crain et al. 1999), to give insight into the architecture of neural connections. This information, together with parameters extracted from DTI, can be used to characterize connectivity in the normal brain and to identify changes in mouse models of disease involving loss white matter integrity. DTI atlases (Chuang, Mori et al. 2010) (Jiang and Johnson 2010) help assess the bounds of normal variability in the adult, as well as progression of myelination during development, or defects in animal models of diseases involving demyleination (Fatemi, Folsom et al. 2009).
3.5 DEVELOPMENTAL IMAGING
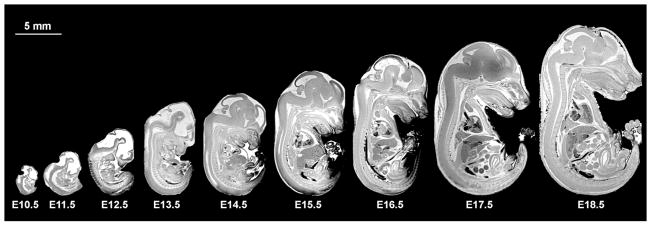
Atlases have also been useful in studying development in the mouse embryo and fetus (Petiet, Kaufman et al. 2008) (Chuang, Mori et al. 2011). Images acquired for E9.5 with a FOV of 5 mm and a 256×256×256 matrix resulted in 20 μm isotropic resolution. Larger arrays are however required for imaging larger specimens. To obtain the same resolution for an E19.5 embryo, which requires a FOV of 20×10×10 mm, the image array must be 1024×512×512. This results in ~4GB of raw data, and yields an array of ~500 MB for the reconstructed image. The approach requires powerful computational resources, relatively large storage space, and large amounts of memory to visualize the 3D anatomy. To address these problems (Petiet, Kaufman et al. 2008) have shared their imaging protocol and imaging database of the developing mouse, at 16 stages, from E10.5 to post-natal day (PND) 32, as well as 200 associated labels. The protocol starts with actively staining specimens either through immersion of using a cardiac perfusion under ultrasound guidance. This active staining allows the acquisition of 3D images with 19.5μm resolution in ~ 3 hours. Figure 13 illustrates the differences in scale encountered in developmental imaging from E10.5 to E18.8, where the crown to rump length varies from 4 mm at E10.5, to about 16.5 mm at E18.8, but this continues to get larger—up to 75mm crown to tail length in PND32.
Figure 13.
Mid-sagittal slices from volume datasets of developing mouse at stages E10.5–E18.5 illustrate differences in specimen scale occurring in less than 10 days during early development. (Petiet, Kaufman et al. 2008).
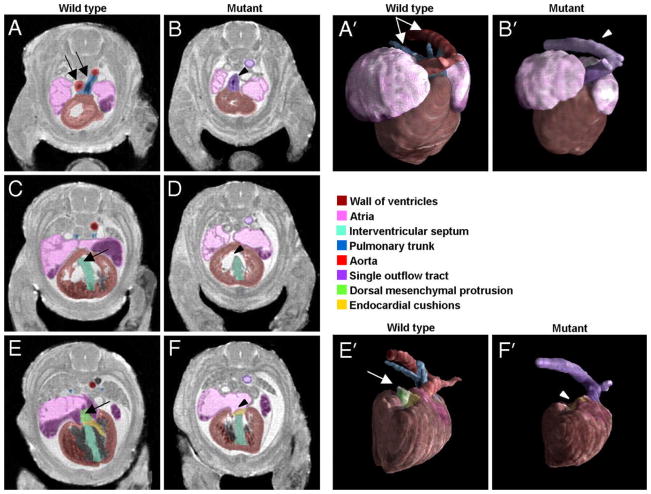
A high-throughput version of the embryo imaging protocol has been used to characterize cardiac defects occurring in a mouse strain with a conditional ablation of the Smo receptor gene (Petiet, Kaufman et al. 2008). In these mutant mice, the outflow tract appears as a singe entity, while in the wild type (WT)control it branches into the aorta and pulmonary trunk (Figure 14, A and B). The interventricular septum appears open in the mutant rather than continuous as in the WT. In the most caudal slices the dorsal mesenchymal protrusion (DMP) is absent in the mutant. 3D surface renderings of the reconstructed heart and associated blood vessels allow for direct observation of changes in the shape and position of the different part of the anatomy, as segmented based on high-resolution MRM images.
Figure 14.
MRM imaging at 19.5 μm resolution allows discerning cardiac defects in a mouse with conditional ablation of Smo receptor gene. From most cranial to most caudal slices, the arrows point to (A, B) outflow tract abnormalities in the mutant mouse, which fails to branch into the aorta and pulmonary trunk (C, D) an open septum defect (E, F), absence of DMP in mutant mouse. (A′, B′) present surface rendering of the segmented heart (ventral view) and abnormal outflow tract in the mutant in comparison to the wild type control. (E′, F′) illustrate the absence of DMP (in a dorsal view of the heart). Reproduced with permission from (Petiet, Kaufman et al. 2008). Copyright 2008 National Academy of Sciences, USA.
While demands on the resolution and scan time are exacerbated in the case of developmental imaging, because of the small sample size, early detection of abnormal phenotypes is a promising avenue not only for studies of mutant (Goddeeris, Rho et al. 2008) or engineered mice, but also for studies on the effects of the environment, toxic insults, and substances of abuse (Godin, O’Leary-Moore et al. 2010).
FUNCTIONAL IMAGING
While structural imaging, as well as recordings of physiological parameters, have both been used for a long time, they have traditionally provided independent views on the same animal model. MRM has the ability to provide both anatomical imaging, and insights into the physiological status, through estimates of cardiac contractility, blood volume and flow dynamics, neuronal, and respiratory function. Such imaging studies require that the animal must be held under anesthesia for the duration of the scan, which may affect the physiological parameters and make studies such as functional MRI (fMRI) very challenging in small animals. In addition, biological motion tends to be an exacerbated problem in live animal imaging, compared to clinical imaging. This is because the mouse heart rate is in the range of 500 beats/minute (bpm), while the respiratory rate is around 100 bpm, depending on the activity level of the animal.
4.1 HEART
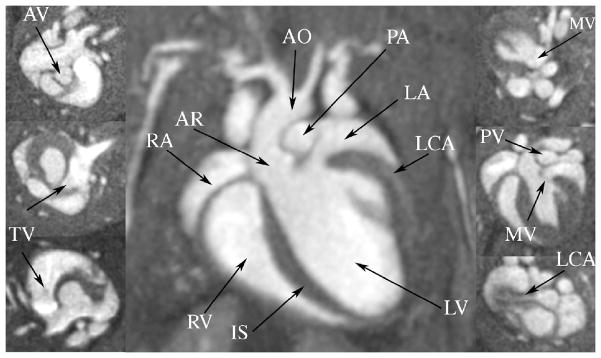
Given the prevalence of heart disease in the modern world, cardiac function has become one of the foremost interests of live animal imaging (Epstein 2007). Normal as well as mouse models of cardiac dysfunction have received special attention. One major goal has been to obtain high throughput in estimating cardiac function, and associated parameters like cardiac mass, wall thickness, stress, ventricular volumes, cardiac output, and ejection fraction (Ruff, Wiesmann et al. 1998; Yang, Berr et al. 2004). MR allows one to appreciate infarct size, remodeling after infarction, as well as atherosclerotic plaque. But now one must consider 4 dimensional arrays i.e. spatial and temporal resolution. The rapid heart rate of the mouse, requires temporal resolution on the order of 10 ms to achieve comparable frame rates in the mouse as in humans. Bucholz et al have addressed this challenge using a novel 4D radial sampling method (Bucholz, Ghaghada et al. 2008). This method differs from the more traditional encoding method by sampling the raw data in a polar coordinate system. Traditional sampling strategies use a Cartesian sampling strategy when one line of a square (or cubic) array is acquired with each excitation. The radial sampling strategy is particularly useful in reducing artifacts from respiratory motion in the mouse and in providing the rapid sampling required to capture the high temporal resolution. But the approach requires specialized reconstruction algorithms such as the nonuniform fast Fourier transform (NUFFT) described in (Song, Liu et al. 2009), Bucholz et al have used the 4D radial approach to acquire 4D arrays with 87 μm isotropic spatial resolution and 10 ms temporal resolution in 31 minutes. Figure 15 shows selected images from one such array at diastole. Since the spatial resolution is isotropic, one can choose any arbitrary plane without loss of spatial resolution, allowing us to discriminate not only the ventricles and the atria, but also the major blood vessels (like aorta, pulmonary artery, left carotid artery), and four valves (tricuspid, mitral, pulmonary, and aortic). These high spatial resolution images reduce the partial volumes effects on volumetric estimates of the cardiac chambers, and allow one to assess abnormal morphological and functional phenotypes, including valve defects or aortic stenosis (Bucholz, Ghaghada et al. 2008).
Figure 15.
MRM imaging at resolution of 87 μm allows clear visualization of the four major compartments of the mouse heart: left (LV) and right ventricles (RV), left (LA) and right atria (RA), as well as the intraventricular septum (IS). The major cardiac blood vessels are visible: the left carotid (LCA) feeding the heart, the aorta (AO) ands its root (AR), as well as the pulmonary arteries (PA). In addition, the valves for the aorta (AV) and pulmonary artery (PV), as well as the tricuspid (TV) and mitral valve (MV), are identifiable (insets). Reproduced with permission from (Bucholz, Ghaghada et al. 2008).
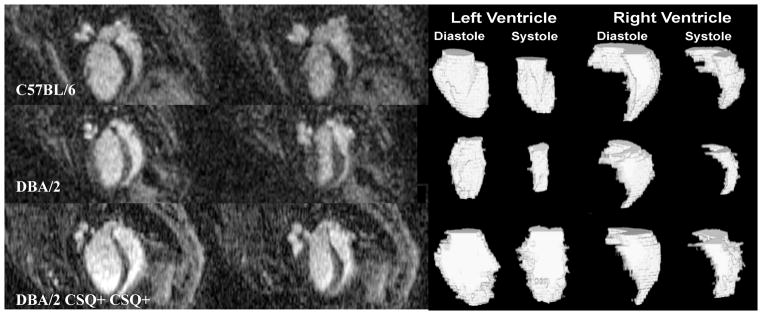
Such advances in cardiac imaging allow investigation of mouse models of cardiac dysfunction, and assessing the effects of genotype or environment. Bucholz et al (Bucholz, Ghaghada et al. 2010) acquired contrast-enhanced cardiac MRM images, using a high-throughput protocol, which results in 87 μm in plane, 352 μm between planes spatial resolution, and a temporal resolution of 9.6 ms (TE=300μs, TR=2.4 ms, α=45°, BW=125 kHZ). These images allowed identifying significant differences among three mouse strains in left ventricle distolic volumes, end systole volumes and ejection fraction (EF), and a markedly lower left ventricle EF for the transgenic mice. Such studies illustrate the possibilities offered by MRM for rapid phenotyping of the mouse heart, holding great promise for elucidating the relationship between phentotype and genotype, as well as assessing the influence of the environment on cardiac function. Mouse imaging studies, which can provide rich information on cardiac anatomy and function, are particularly relevant to developing drugs and assessing their efficacy (Hiller, Waller et al. 2008).
4.2 LUNG
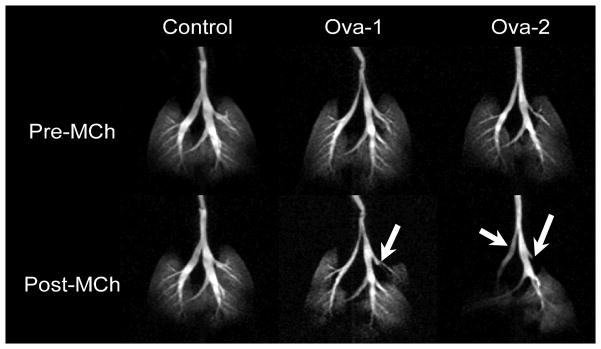
The challenges for imaging the lungs with MR arise not only from the effects of motion (in the range of 100 breaths/minute in the mouse), but also because the proton density of the lung is lower than that of muscle (~0.2–0.4 relative to muscle), which correspond to a proportional loss of signal intensity. The many interfaces between the air spaces and tissue lead to rapid signal decay, which can be addressed with ultra-short TE. A more important signal increase can be obtained, however, through enhancement of the nuclear magnetic moment alignment—hyperpolarization (Albert, Cates et al. 1994). Hyperpolarization (HP) of gas (3He or 129Xe) (Driehuys, Walker et al. 2007)can be used to produce ventilation images. The gas is polarized outside the MR scanner using optical pumping and spin exchange, where the alignment is transferred from laser photons to gas nuclei via an intermediary alkali metal (Happer, Miron et al. 1984). The hyperpolarized gas can be captured and transferred to the animal via a dedicated animal ventilator. An immediate application of gas imaging is illustrated in Figure 17, where a mouse model of asthma, sensitized to ovalbumin (OVA) presents with impaired ventilation patterns compared to normal control after they were both administered a methacholine challenge. Hyperpolarized 3He distribution can be visualized at resolution of 125×125×100 μm, and in this example was sufficient to allow identification of airway constriction in major bronchi in this mouse model of asthma.
Figure 17.
Gas exchange in the mouse lungs of models of asthma (Ova sensitized) compared to a control animal. Maximum intensity projections based on 3D (radial acquisition) images of 3He distribution in the lungs before and after administration of 250 μg/kg methacholine (MCh) challenge. The image were aquired using TR = 5 ms, TE = 132 μs, bandwidth (BW) = 62.5 kHz, with 20 radial k-space views per breath, interpolated to 256×256×16 matrix and resolution is 125×125×1000 μm3. Airways constriction is indicated with white arrows in the Ova-sensitized mice. Reproduced with permission from (Driehuys 2007).
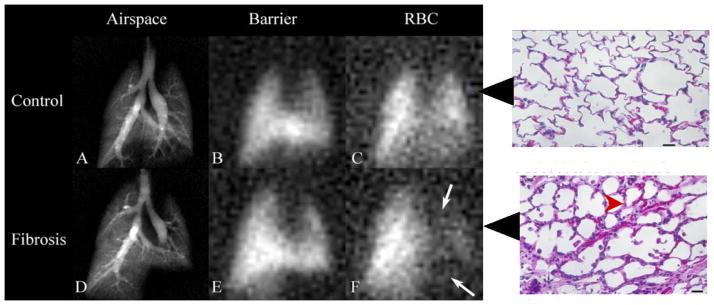
Since 3He availability and price are not practical for large cohort studies, 129Xe has received renewed attention and can be used to provide functional information on the lungs (Driehuys, Moller et al. 2009). Even more attractive is the fact that 129Xe is soluble in fluids and tissue, and exhibits distinct resonance frequencies, separated by large frequency shifts. Because of these characteristics, one can image in the lungs three separate compartments corresponding to peaks of the frequency in the airspace, interstitial space, and blood. Such a compartmental analysis allows the study of gas exchange, for example in mouse models of fibrosis.
4.3 BRAIN
While fMRI has become an important tool in human neuroimaging, a major challenge in obtaining functional information from the brain of small animals comes from the fact that anesthesia is known to interfere with brain activation (Lahti, Ferris et al. 1999). Imaging awake animals requires control and correction of motion affects, including the difficult task of immobilizing the animal. Even after circumventing these difficulties, the signal recorded is very small. Brain activation was detected by fMRI in the rat somatosensory cortex during electrical stimulation of the forepaws (Gyngell, Bock et al. 1996), and highly localized in the postero-medial barrel subfield during mechanical stimulation of a single whisker (Yang et al., 1996). Photic stimulation was used to elicit brain activation in the mouse brain occipital area containing the visual cortex (Huang, Plyka et al. 1996). Pain-processing and the effects of analgesics were studied by fMRI (Tuor, Malisza et al. 2000). In another study, brain activation following intravenous cocaine infusions was characterized in halothane-anesthetized rats using contrast-enhanced fMRI (Marota, Mandeville et al. 2000). Intravenous cocaine-induced activation was reflected in increased regional cerebral blood volume (rCBV) throughout the frontal cortex, and partially in the parietal and occipital cortex at cocaine doses greater than 0.1 mg/kg (Marota et al., 2000).
As an alternative to the fMRI, which is coupled to the vascular response, small animal researchers have developed techniques to look into the small animal functional anatomy based on the use of manganese ions or MnCl2 (Manganese Enhance MRI or MEMRI)(Lin and Koretsky 1997)(Obenaus and Jacobs 2007), a calcium analog that has high uptake in highly active regions of the brain. This technique was shown to identify activated regions of the rodent brain which “light-up” in T1-weighted images following auditory (Yu, Wadghiri et al. 2005) (Yu, Zou et al. 2008) or somatosensory stimulation (Aoki, Naruse et al. 2004) (Weng, Chen et al. 2007) (Howles, Qi et al. 2010), performed after injection manganese chloride (Howles, Qi et al. 2010). However, the fact that this technique requires general anesthesia and opening of the blood brain barrier, as well as the toxicity of manganese, are issues that need to be considered (Eschenko, Canals et al. 2010) in order to fully exploit the potential of MEMRI for imaging plasticity, testing behavioral paradigms, or studying the effects of pharmacological agents or substances of abuse on the central nervous system (Lu, Xi et al. 2007).
4 CURRENT TRENDS IN MRM
Although present from about the same time as clinical MRI (Henkelman 2010), MRM of small animals presents additional challenges and opportunities. Perhaps most important limiting factor in the translation from human to mouse imaging is that the smaller voxels provide a weaker signal.
One way to improve sensitivity is to increase coil performance by developing better copper coils operating at room temperature and customized for specific geometry of samples. Cryogenic probes can increase the sensitivity by a factor of up to 2.9 by operating at low temperature (60 K) (Nouls, Izenson et al. 2008), or 30K (Baltes, Radzwill et al. 2009). However the cost is still high and temperature must be well controlled to avoid frequency shifts and changes in coil performance. Another approach to improve imaging efficiency is to use phased arrays of small coils that cover a larger field of view (Sutton, Ciobanu et al. 2005; Schneider, Lanz et al. 2010). Multiple animal imaging can benefit from such developments and contribute to increased throughput scanning of live animals (Bock, Konyer et al. 2003; Dazai, Bock et al. 2004), (Ramirez, Esparza-Coss et al. 2010) or fixed specimens.
Major efforts are being made to increase the molar relaxivities of contrast agents based on paramagnetic T1 agents such as Gd and Mn (MnDPDP), or superparamagnetic T2*/T2 agents such as iron oxide nanoparticles. The later category present high sensitivity and can be good candidates for molecular imaging. Contrast enhancement is an ever-developing area of interest, excellently reviewed by (Terreno, Castelli et al. 2010), providing either higher SNR per unit time overall in the image, or improving the basically low specificity of MR, and more importantly to provide insight into molecular and cellular processes. One approach to enhance the image information content is to use multiple sources of information. For example, anatomical information from high-resolution imaging modalities, such as CT or MR, can be combined with imaging modalities that have great sensitivity but lower resolution, such as PET/SPECT. The first approaches combine imaging modalities through software fusion, while hardware fusion has now become possible. Software fusion is a possible answer, but it is a complex process with many degrees of freedom, especially for aligning images of flexible organs that change shape or size. To address these problems, hardware fusion holds great promise, but it is a challenging engineering approach in the case of MR. On one hand, PET/SPECT detectors based on photomultiplier tubes are sensitive to magnetic fields, on the other hand the homogeneity of the magnetic field required for MRM can be perturbed by the presence of PET/SPECT detectors. It has become possible to combine two such techniques into one single system and a low field MRPET system has been proposed (Cherry, Louie et al. 2008), as well as a MRSPECT (Goetz, Breton et al. 2008). MR has the potential to improve results currently obtained with imaging modalities of high sensitivity, but lower resolution such as PET and SPECT. Hybrid multimodal imaging techniques aim to combine the benefits of sensitivity with those of resolution and MRM, and can be used in conjunction with other imaging techniques such as CT or fluorescence. Dual probes (Jennings and Long 2009) can facilitate the transition from one imaging modality to another, but it is essential that they bind specifically. To achieve this, molecular probes are being developed for detecting tumor cell lines, enzyme activity, proteins, or pathogens, for use with MR or joint use with other modalities such as fluorescence (Haun, Yoon et al. 2010). These probes may contain a paramagnetic or superparamagnetic moiety, which improves the MR contrast, and a specific molecular structure. The development of such targeted probes help raise MR to the level of a molecular imaging technique. MR is diverging today from the traditional imaging of water protons, to make use of the enhanced signal, but also the spectral information given by hyperpolarized agents including 3He, 129Xe, and 13C. These agents are themselves the source of signal rather than acting on the tissue relaxation parameters. The increase in sensitivity was useful for characterizing lung ventilation patterns and gas exchange (Mistry, Thomas et al. 2010), brain perfusion alterations in stroke (Zhou, Sun et al. 2010), as well as illustrating the metabolic activity in tumors (Golman, Zandt et al. 2006). These techniques are however very expensive, and therefore only accessible to a limited number of research laboratories.
MRM produces in general large image arrays compared to clinical standards, requiring powerful and efficient processing tools from optimized acquisition schemes, efficient computer reconstruction protocols, memory management, and visualization components. Statistical analysis tools are needed to infer quantitative information, which can be used to assess anatomical variability in control populations, and deviations from the normal in mouse models of disease. Quantitative information derived from MRM can be used to explore the relationship between anatomical phenotype and genetic variations (Nieman, Flenniken et al. 2006) (Badea, Johnson et al. 2009) (Ellegood, Pacey et al. 2010). Imaging genetics can be used for gene discovery either through genome-wide association studies using imaging data or derived quantitative traits as phenotype, either voxel-wise (Stein, Hua et al. 2010) or using regional phenotypes (Potkin, Macciardi et al. 2010).
Pharmacological research should benefit from the possibility of performing longitudinal studies for drug development, as well as from the ability to image specific processes such as apoptosis or plasticity. One of the challenges when imaging the central nervous system (CNS) is to penetrate the blood brain barrier (BBB) and deliver imaging or pharmacological agents. To address this problem, chemical (Wadghiri, Sigurdsson et al. 2003) (Poduslo, Wengenack et al. 2002) and mechanical methods using ultrasound (Kinoshita, McDannold et al. 2006; Bing, Howles et al. 2009; Choi, Wang et al. 2010) have been developed to disrupt the BBB, as well as cell permeable contrast agents (Lee, Zhang et al. 2010). This may help reduce toxicity, as well as enhance efficacy of treatment for the CNS. Conjugated efforts from multiple disciplines contribute to making MRM one of the foremost imaging modalities for the small animal brain and body.
From its beginnings, MRM has been moving towards efficient high-resolution images approaching the diffusion limit. Moving beyond anatomical imaging, MRM is providing growing evidence of its value for studying physiological function of the circulatory system, the heart, as well as neural activity. Molecular MR is still a developing field, along with cellular imaging or imaging genetics, but these are all avenues to watch, because they have the potential to lead towards better understanding of fundamental biological processes.
Figure 4.
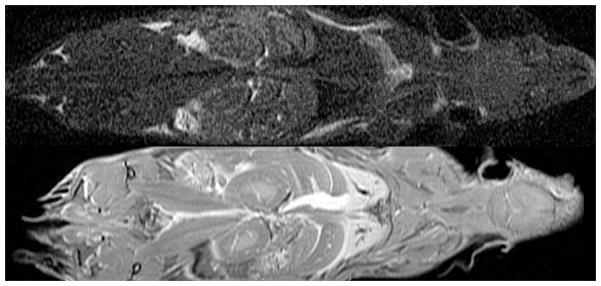
A five-fold higher signal-to-noise ratio (SNR) per unit scan time can be obtained imaging a specimen prepared with active staining (bottom row: 1:20 Gd-DTPA, 10% formalin) compared to a formalin-fixed specimen (top row: 10% formalin, TR=100ms). SNR increased from 10 to 50. Reprinted with permission from (Johnson, Cofer et al. 2002).
Figure 16.
MRM can be used to identify differences in cardiac function among strains of mice. Here the C57BL/6 was found to be slightly hypertrophic compared to the DBA/2 and DBA/2 CSQ+. The ventricular volumes were used to determine significant differences in left ventricle ejection fraction, smallest for DBA2 CSQ+, and largest for DBA/2, while the right ventricle ejection fraction was significantly higher in DBA/2. Significant differences are also apparent in the right ventricle end systole, larger in DBA2 CSQ+. These differences are also apparent from surface renderings of the segmented heart compartments. Reproduced with permission from (Bucholz, Ghaghada et al. 2010).
Figure 18.
Gas exchange impairment can be assessed with MR imaging of HP 129Xe in the three compartments of the lung: airspace (A, D), tissue barrier (B, E), and red blood cells (C, F). Arrows in F indicate diminished 129Xe uptake in red blood cells (RBC) due to inflammation and fibrosis caused by bleomycin. The thickening of blood gas barrier, confirmed by histology slides, slows down the 129Xe transfer to gas space. Adapted and reprinted with permission from (Driehuys, Cofer et al. 2006). Copyright 2006 National Academy of Sciences, USA.
Acknowledgments
The authors would like to thank Dr Stanley Cohen for the opportunity to work on this project, their collaborators at the Center for In Vivo Microscopy for permission to use images from their publications and work, and to Sally Zimney for editorial assistance. In addition we are grateful to Drs Laurence Hedlund, Bastiaan Driehuys and Zachary Cleveland for helpful discussion., The work presented was performed at The Duke Center for In Vivo Microscopy, supported by NIH as an NCRR national Biomedical Technology Research Center (P41 RR005959) and by NCI as a Small Animal Imaging Resource Program (U24 CA092656).
References
- Albert MS, Cates GD, et al. BIOLOGICAL MAGNETIC-RESONANCE-IMAGING USING LASER POLARIZED XE-129. Nature. 1994;370(6486):199–201. doi: 10.1038/370199a0. [DOI] [PubMed] [Google Scholar]
- Ali AA, Dale AM, et al. Automated segmentation of neuroanatomical structures in multispectral MR microscopy of the mouse brain. Neuroimage. 2005;27(2):425–435. doi: 10.1016/j.neuroimage.2005.04.017. [DOI] [PubMed] [Google Scholar]
- Aoki I, Naruse S, et al. Manganese-enhanced magnetic resonance imaging (MEMRI) of brain activity and applications to early detection of brain ischemia. NMR Biomed. 2004;17(8):569–580. doi: 10.1002/nbm.941. [DOI] [PubMed] [Google Scholar]
- Badea A, Ali-Sharief AA, et al. Morphometric analysis of the C57BL/6J mouse brain. Neuroimage. 2007;37(3):683–693. doi: 10.1016/j.neuroimage.2007.05.046. [DOI] [PMC free article] [PubMed] [Google Scholar]
- Badea A, Johnson GA, et al. Genetic dissection of the mouse brain using high-field magnetic resonance microscopy. Neuroimage. 2009;45(4):1067–1079. doi: 10.1016/j.neuroimage.2009.01.021. [DOI] [PMC free article] [PubMed] [Google Scholar]
- Badea A, Johnson GA, et al. Genetic dissection of the mouse CNS using magnetic resonance microscopy. Curr Opin Neurol. 2009;22(4):379–386. doi: 10.1097/WCO.0b013e32832d9b86. [DOI] [PMC free article] [PubMed] [Google Scholar]
- Baltes C, Radzwill N, et al. Micro MRI of the mouse brain using a novel 400 MHz cryogenic quadrature RF probe. NMR Biomed. 2009;22(8):834–842. doi: 10.1002/nbm.1396. [DOI] [PubMed] [Google Scholar]
- Basser PJ, Pierpaoli C. Microstructural and physiological features of tissues elucidated by quantitative-diffusion-tensor MRI. J Magn Reson B. 1996;111(3):209–219. doi: 10.1006/jmrb.1996.0086. [DOI] [PubMed] [Google Scholar]
- Beckmann N, Laurent D, et al. Magnetic resonance imaging in drug discovery: lessons from disease areas. Drug Discov Today. 2004;9(1):35–42. doi: 10.1016/S1359-6446(04)02943-5. [DOI] [PubMed] [Google Scholar]
- Bing KF, Howles GP, et al. Blood-brain barrier (BBB) disruption using a diagnostic ultrasound scanner and Definity in Mice. Ultrasound Med Biol. 2009;35(8):1298–1308. doi: 10.1016/j.ultrasmedbio.2009.03.012. [DOI] [PMC free article] [PubMed] [Google Scholar]
- Bock NA, Konyer NB, et al. Multiple-mouse MRI. Magn Reson Med. 2003;49(1):158–167. doi: 10.1002/mrm.10326. [DOI] [PubMed] [Google Scholar]
- Bucholz E, Ghaghada K, et al. Four-dimensional MR microscopy of the mouse heart using radial acquisition and liposomal gadolinium contrast agent. Magn Reson Med. 2008;60(1):111–118. doi: 10.1002/mrm.21618. [DOI] [PMC free article] [PubMed] [Google Scholar]
- Bucholz E, Ghaghada K, et al. Cardiovascular phenotyping of the mouse heart using a 4D radial acquisition and liposomal Gd-DTPA-BMA. Magn Reson Med. 2010;63(4):979–987. doi: 10.1002/mrm.22259. [DOI] [PMC free article] [PubMed] [Google Scholar]
- Callaghan PT. Principles of Nuclear Magnetic Resonance Microscopy. Oxford: Oxford University Press; 1991. [Google Scholar]
- Cherry SR, Louie AY, et al. The integration of positron emission tomography with magnetic resonance imaging. Proceedings of the Ieee. 2008;96(3):416–438. [Google Scholar]
- Choi JJ, Pernot M, et al. Noninvasive, transcranial and localized opening of the blood-brain barrier using focused ultrasound in mice. Ultrasound Med Biol. 2007;33(1):95–104. doi: 10.1016/j.ultrasmedbio.2006.07.018. [DOI] [PubMed] [Google Scholar]
- Choi JJ, Wang S, et al. Molecules of various pharmacologically-relevant sizes can cross the ultrasound-induced blood-brain barrier opening in vivo. Ultrasound Med Biol. 2010;36(1):58–67. doi: 10.1016/j.ultrasmedbio.2009.08.006. [DOI] [PMC free article] [PubMed] [Google Scholar]
- Chuang N, Mori S, et al. An MRI-based atlas and database of the developing mouse brain. Neuroimage. 2010 doi: 10.1016/j.neuroimage.2010.07.043. [DOI] [PMC free article] [PubMed] [Google Scholar]
- Chuang N, Mori S, et al. An MRI-based atlas and database of the developing mouse brain. Neuroimage. 2011;54(1):80–89. doi: 10.1016/j.neuroimage.2010.07.043. [DOI] [PMC free article] [PubMed] [Google Scholar]
- Clarkson RB. Blood-Pool MRI Contrast Agents. In: Krause W, editor. Contrast Agents I: Magnetic Resonance Imaging (Topics in Current Chemistry) Pt. 1. Berlin: Springer; 2002. pp. 201–236. [Google Scholar]
- Dazai J, Bock NA, et al. Multiple mouse biological loading and monitoring system for MRI. Magn Reson Med. 2004;52(4):709–715. doi: 10.1002/mrm.20215. [DOI] [PubMed] [Google Scholar]
- Dhenain M, Ruffins SW, et al. Three-dimensional digital mouse atlas using high-resolution MRI. Dev Biol. 2001;232(2):458–470. doi: 10.1006/dbio.2001.0189. [DOI] [PubMed] [Google Scholar]
- Driehuys B, Cofer GP, et al. Imaging alveolar-capillary gas transfer using hyperpolarized 129Xe MRI. Proc Natl Acad Sci U S A. 2006;103(48):18278–18283. doi: 10.1073/pnas.0608458103. [DOI] [PMC free article] [PubMed] [Google Scholar]
- Driehuys B, Moller HE, et al. Pulmonary perfusion and xenon gas exchange in rats: MR imaging with intravenous injection of hyperpolarized 129Xe. Radiology. 2009;252(2):386–393. doi: 10.1148/radiol.2522081550. [DOI] [PMC free article] [PubMed] [Google Scholar]
- Driehuys B, Nouls J, et al. Small animal imaging with magnetic resonance microscopy. ILAR J. 2008;49(1):35–53. doi: 10.1093/ilar.49.1.35. [DOI] [PMC free article] [PubMed] [Google Scholar]
- Driehuys B, Walker J, et al. He-3 MRI in mouse models of asthma. Magnetic Resonance in Medicine. 2007;58(5):893–900. doi: 10.1002/mrm.21306. [DOI] [PMC free article] [PubMed] [Google Scholar]
- Ellegood J, Pacey LK, et al. Anatomical phenotyping in a mouse model of fragile X syndrome with magnetic resonance imaging. Neuroimage. 2010;53(3):1023–1029. doi: 10.1016/j.neuroimage.2010.03.038. [DOI] [PubMed] [Google Scholar]
- Epstein FH. "MR in mouse models of cardiac disease. NMR Biomed. 2007;20(3):238–255. doi: 10.1002/nbm.1152. [DOI] [PubMed] [Google Scholar]
- Ernst R, Anderson WA. Application of Fourier Transform Spectroscopy to Magnetic Resonance. Rev Sci Instrum. 1966;37(93):93–102. [Google Scholar]
- Eschenko O, Canals S, et al. Mapping of functional brain activity in freely behaving rats during voluntary running using manganese-enhanced MRI: implication for longitudinal studies. Neuroimage. 2010;49(3):2544–2555. doi: 10.1016/j.neuroimage.2009.10.079. [DOI] [PubMed] [Google Scholar]
- Fain SB, Korosec FR, et al. Functional lung imaging using hyperpolarized gas MRI. J Magn Reson Imaging. 2007;25(5):910–923. doi: 10.1002/jmri.20876. [DOI] [PubMed] [Google Scholar]
- Fatemi SH, Folsom TD, et al. Abnormal expression of myelination genes and alterations in white matter fractional anisotropy following prenatal viral influenza infection at E16 in mice. Schizophr Res. 2009;112(1–3):46–53. doi: 10.1016/j.schres.2009.04.014. [DOI] [PMC free article] [PubMed] [Google Scholar]
- Ghaghada K, Hawley C, et al. T1 relaxivity of core-encapsulated gadolinium liposomal contrast agents--effect of liposome size and internal gadolinium concentration. Acad Radiol. 2008;15(10):1259–1263. doi: 10.1016/j.acra.2008.04.018. [DOI] [PMC free article] [PubMed] [Google Scholar]
- Giesel FL, Mehndiratta A, et al. High-relaxivity contrast-enhanced magnetic resonance neuroimaging: a review. Eur Radiol. 2010;20(10):2461–2474. doi: 10.1007/s00330-010-1805-8. [DOI] [PubMed] [Google Scholar]
- Glover P, Mansfield SP. Limits to magnetic resonance microscopy. Reports on Progress in Physics. 2002;65(10):1489. [Google Scholar]
- Goddeeris MM, Rho S, et al. Intracardiac septation requires hedgehog-dependent cellular contributions from outside the heart. Development. 2008;135(10):1887–1895. doi: 10.1242/dev.016147. [DOI] [PMC free article] [PubMed] [Google Scholar]
- Godin EA, O’Leary-Moore SK, et al. Magnetic resonance microscopy defines ethanol-induced brain abnormalities in prenatal mice: effects of acute insult on gestational day 7. Alcohol Clin Exp Res. 2010;34(1):98–111. doi: 10.1111/j.1530-0277.2009.01071.x. [DOI] [PMC free article] [PubMed] [Google Scholar]
- Goetz C, Breton E, et al. SPECT low-field MRI system for small-animal imaging. J Nucl Med. 2008;49(1):88–93. doi: 10.2967/jnumed.107.044313. [DOI] [PubMed] [Google Scholar]
- Golman K, Zandt RI, et al. Metabolic imaging by hyperpolarized 13C magnetic resonance imaging for in vivo tumor diagnosis. Cancer Res. 2006;66(22):10855–10860. doi: 10.1158/0008-5472.CAN-06-2564. [DOI] [PubMed] [Google Scholar]
- Gyngell ML, Bock C, et al. Variation of functional MRI signal in response to frequency of somatosensory stimulation in alpha-chloralose anesthetized rats. Magn Reson Med. 1996;36(1):13–15. doi: 10.1002/mrm.1910360104. [DOI] [PubMed] [Google Scholar]
- Haacke EM, Brown RM, et al. Magnetic Resonance Imaging: Physical Properties and equence Design. New York: Wiley-Liss; 1999. [Google Scholar]
- Haacke EM, Brown RW, et al. Magnetic Resonance Imaging: Physical Principles and Sequence Design. New York: Wiley-Liss; 1999. [Google Scholar]
- Hammoud DA, Hoffman JM, et al. Molecular neuroimaging: from conventional to emerging techniques. Radiology. 2007;245(1):21–42. doi: 10.1148/radiol.2451060731. [DOI] [PubMed] [Google Scholar]
- Happer W, Miron E, et al. Polarization of the Nuclear Spins of Noble-Gas Atoms by Spin Exchange with Optically Pumped Alkali-Metal Atoms. Physical Review A. 1984;29(6):3092–3110. [Google Scholar]
- Haun JB, Yoon TJ, et al. Magnetic nanoparticle biosensors. Wiley Interdiscip Rev Nanomed Nanobiotechnol. 2010;2(3):291–304. doi: 10.1002/wnan.84. [DOI] [PubMed] [Google Scholar]
- Hawrylycz M, Boline J, et al. The INCF Digital Atlasing Program: Report on Digital Atlasing Standards in the Rodent Brain. Nature Precedings 2009 [Google Scholar]
- Hedlund LW, Cofer GP, et al. MR-compatible ventilator for small animals: computer-controlled ventilation for proton and noble gas imaging. Magn Reson Imaging. 2000;18(6):753–759. doi: 10.1016/s0730-725x(00)00154-5. [DOI] [PubMed] [Google Scholar]
- Henkelman RM. Systems Biology through Mouse Imaging Centers: Experience and New Directions. Annual Review of Biomedical Engineering, Vol 12. Palo Alto, Annual Reviews. 2010;12:143–166. doi: 10.1146/annurev-bioeng-070909-105343. [DOI] [PubMed] [Google Scholar]
- Hiller KH, Waller C, et al. Magnetic resonance of mouse models of cardiac disease. Handb Exp Pharmacol. 2008;185(Pt 2):245–257. doi: 10.1007/978-3-540-77496-9_10. [DOI] [PubMed] [Google Scholar]
- Howles G, Qi Y, et al. Ultrasonic disruption of the blood-brain barrier enables in vivo functional. Neuroimage 2010. 2010 May 1;50(4):1464–71. doi: 10.1016/j.neuroimage.2010.01.050. Epub 2010 Jan 22.(- 1095–9572 (Electronic)): - 1464–1471. [DOI] [PMC free article] [PubMed] [Google Scholar]
- Howles GP, Bing KF, et al. Contrast-enhanced in vivo magnetic resonance microscopy of the mouse brain enabled by noninvasive opening of the blood-brain barrier with ultrasound. Magn Reson Med. 2010;64(4):995–1004. doi: 10.1002/mrm.22411. [DOI] [PMC free article] [PubMed] [Google Scholar]
- Howles GP, Nouls JC, et al. Rapid production of specialized animal handling devices using computer-aided design and solid freeform fabrication. J Magn Reson Imaging. 2009;30(2):466–471. doi: 10.1002/jmri.21821. [DOI] [PMC free article] [PubMed] [Google Scholar]
- Huang W, Plyka I, et al. Magnetic resonance imaging (MRI) detection of the murine brain response to light: temporal differentiation and negative functional MRI changes. Proc Natl Acad Sci U S A. 1996;93(12):6037–6042. doi: 10.1073/pnas.93.12.6037. [DOI] [PMC free article] [PubMed] [Google Scholar]
- Hurlston SE, Cofer GP, et al. Optimized receiver coils for increased SNR in MR Microscopy. The International Journal of Imaging Systems and Technology. 1997;8:277–284. [Google Scholar]
- Hynynen K, McDannold N, et al. Noninvasive MR imaging-guided focal opening of the blood-brain barrier in rabbits. Radiology. 2001;220(3):640–646. doi: 10.1148/radiol.2202001804. [DOI] [PubMed] [Google Scholar]
- Jankowsky JL, Slunt HH, et al. Persistent amyloidosis following suppression of Abeta production in a transgenic model of Alzheimer disease. PLoS Med. 2005;2(12):e355. doi: 10.1371/journal.pmed.0020355. [DOI] [PMC free article] [PubMed] [Google Scholar]
- Jennings LE, Long NJ. ’Two is better than one’--probes for dual-modality molecular imaging. Chem Commun (Camb) 2009;(24):3511–3524. doi: 10.1039/b821903f. [DOI] [PubMed] [Google Scholar]
- Jiang Y, Johnson GA. Microscopic diffusion tensor imaging of the mouse brain. Neuroimage. 2010;50(2):465–471. doi: 10.1016/j.neuroimage.2009.12.057. [DOI] [PMC free article] [PubMed] [Google Scholar]
- Johnson GA, Badea A, et al. Waxholm space: an image-based reference for coordinating mouse brain research. Neuroimage. 2010;53(2):365–372. doi: 10.1016/j.neuroimage.2010.06.067. [DOI] [PMC free article] [PubMed] [Google Scholar]
- Johnson GA, Benveniste H, et al. Histology by magnetic resonance microscopy. Magn Reson Q. 1993;9(1):1–30. [PubMed] [Google Scholar]
- Johnson GA, Benveniste H, et al. Histology by magnetic resonance microscopy. Magnetic Resonance Quarterly. 1993;9(1):1–30. [PubMed] [Google Scholar]
- Johnson GA, Cofer GP, et al. Magnetic resonance histology for morphologic phenotyping. J Magn Reson Imaging. 2002;16(4):423–429. doi: 10.1002/jmri.10175. [DOI] [PubMed] [Google Scholar]
- Johnson GA, Cofer GP, et al. Morphologic phenotyping with MR microscopy: the visible mouse. Radiology. 2002;222(3):789–793. doi: 10.1148/radiol.2223010531. [DOI] [PubMed] [Google Scholar]
- Johnson GA, Gewalt SL, et al. MR microscopy of pathology specimens. 32nd Experimental Nuclear Magnetic Resonance Spectroscopy Conference; St. Louis, MO. 1991. [Google Scholar]
- Johnson GA, Thompson MB, et al. Nuclear magnetic resonance imaging at microscopic resolution. Journal of Magnetic Resonance. 1986;68:129–137. [Google Scholar]
- Johnson K, Ryan L, et al. Application of magnetic resonance imaging in developmental neurotoxicity testing: a pilot study. Neurotoxicology. 2006;27(5):846–851. doi: 10.1016/j.neuro.2006.06.005. [DOI] [PubMed] [Google Scholar]
- Kinoshita M, McDannold N, et al. Targeted delivery of antibodies through the blood-brain barrier by MRI-guided focused ultrasound. Biochem Biophys Res Commun. 2006;340(4):1085–1090. doi: 10.1016/j.bbrc.2005.12.112. [DOI] [PubMed] [Google Scholar]
- Kumar A, Welti D, et al. NMR Fourier zeugmatography. Journal of Magnetic Resonance (1969) 1975;18(1):69–83. doi: 10.1016/j.jmr.2011.09.019. [DOI] [PubMed] [Google Scholar]
- Lahti KM, Ferris CF, et al. Comparison of evoked cortical activity in conscious and propofol-anesthetized rats using functional MRI. Magn Reson Med. 1999;41(2):412–416. doi: 10.1002/(sici)1522-2594(199902)41:2<412::aid-mrm28>3.0.co;2-3. [DOI] [PubMed] [Google Scholar]
- Le Bihan D, Mangin JF, et al. Diffusion tensor imaging: Concepts and applications. Journal of Magnetic Resonance Imaging. 2001;13(4):534–546. doi: 10.1002/jmri.1076. [DOI] [PubMed] [Google Scholar]
- Lee T, Zhang XA, et al. In vivo imaging with a cell-permeable porphyrin-based MRI contrast agent. Chem Biol. 2010;17(6):665–673. doi: 10.1016/j.chembiol.2010.05.009. [DOI] [PMC free article] [PubMed] [Google Scholar]
- Lin YJ, Koretsky AP. Manganese ion enhances T-1-weighted MRI during brain activation: An approach to direct imaging of brain function. Magnetic Resonance in Medicine. 1997;38(3):378–388. doi: 10.1002/mrm.1910380305. [DOI] [PubMed] [Google Scholar]
- Lu H, Xi ZX, et al. Cocaine-induced brain activation detected by dynamic manganese-enhanced magnetic resonance imaging (MEMRI) Proc Natl Acad Sci U S A. 2007;104(7):2489–2494. doi: 10.1073/pnas.0606983104. [DOI] [PMC free article] [PubMed] [Google Scholar]
- Ma Y, Hof PR, et al. A three-dimensional digital atlas database of the adult C57BL/6J mouse brain by magnetic resonance microscopy. Neuroscience. 2005;135(4):1203–1215. doi: 10.1016/j.neuroscience.2005.07.014. [DOI] [PubMed] [Google Scholar]
- Ma Y, Smith D, et al. In Vivo 3D Digital Atlas Database of the Adult C57BL/6J Mouse Brain by Magnetic Resonance Microscopy. Front Neuroanat. 2008;2:1. doi: 10.3389/neuro.05.001.2008. [DOI] [PMC free article] [PubMed] [Google Scholar]
- MacKenzie-Graham A, Lee EF, et al. A multimodal, multidimensional atlas of the C57BL/6J mouse brain. J Anat. 2004;204(2):93–102. doi: 10.1111/j.1469-7580.2004.00264.x. [DOI] [PMC free article] [PubMed] [Google Scholar]
- Mai W, Badea CT, et al. Effects of breathing and cardiac motion on spatial resolution in the microscopic imaging of rodents. Magn Reson Med. 2005;53(4):858–865. doi: 10.1002/mrm.20400. [DOI] [PubMed] [Google Scholar]
- Maronpot RR, Sills RC, et al. Applications of magnetic resonance microscopy. Toxicol Pathol. 2004;32(Suppl 2):42–48. doi: 10.1080/01926230490451707. [DOI] [PubMed] [Google Scholar]
- Marota JJ, Mandeville JB, et al. Cocaine activation discriminates dopaminergic projections by temporal response: an fMRI study in Rat. Neuroimage. 2000;11(1):13–23. doi: 10.1006/nimg.1999.0520. [DOI] [PubMed] [Google Scholar]
- Mistry NN, Thomas A, et al. Quantitative analysis of hyperpolarized 3He ventilation changes in mice challenged with methacholine. Magn Reson Med. 2010;63(3):658–666. doi: 10.1002/mrm.22311. [DOI] [PMC free article] [PubMed] [Google Scholar]
- Mori S, Crain BJ, et al. Three-dimensional tracking of axonal projections in the brain by magnetic resonance imaging. Annals of Neurology. 1999;45(2):265–269. doi: 10.1002/1531-8249(199902)45:2<265::aid-ana21>3.0.co;2-3. [DOI] [PubMed] [Google Scholar]
- Mori S, Itoh R, et al. Diffusion tensor imaging of the developing mouse brain. Magn Reson Med. 2001;46(1):18–23. doi: 10.1002/mrm.1155. [DOI] [PubMed] [Google Scholar]
- Moriarty JM, Finn JP, et al. Contrast agents used in cardiovascular magnetic resonance imaging: current issues and future directions. Am J Cardiovasc Drugs. 2010;10(4):227–237. doi: 10.2165/11539370-000000000-00000. [DOI] [PubMed] [Google Scholar]
- Nieman BJ, Flenniken AM, et al. Anatomical phenotyping in the brain and skull of a mutant mouse by magnetic resonance imaging and computed tomography. Physiol Genomics. 2006;24(2):154–162. doi: 10.1152/physiolgenomics.00217.2005. [DOI] [PubMed] [Google Scholar]
- Nouls JC, Izenson MG, et al. Design of a superconducting volume coil for magnetic resonance microscopy of the mouse brain. J Magn Reson. 2008;191(2):231–238. doi: 10.1016/j.jmr.2007.12.018. [DOI] [PMC free article] [PubMed] [Google Scholar]
- Obenaus A, Jacobs RE. Magnetic resonance imaging of functional anatomy: Use for small animal epilepsy models. Epilepsia. 2007;48:11–17. doi: 10.1111/j.1528-1167.2007.01237.x. [DOI] [PubMed] [Google Scholar]
- Pandit P, King K, et al. Abdominal Imaging in Free-Breathing Mice Using PROPELLER. ISMRM; Toronto, Ontario, CA: 2008. [Google Scholar]
- Pandit P, Qi Y, et al. Multishot PROPELLER for high-field preclinical MRI. Magn Reson Med. 2010;64(1):47–53. doi: 10.1002/mrm.22376. [DOI] [PMC free article] [PubMed] [Google Scholar]
- Petiet A, Hedlund L, et al. Staining methods for magnetic resonance microscopy of the rat fetus. J Magn Reson Imaging. 2007;25(6):1192–1198. doi: 10.1002/jmri.20932. [DOI] [PMC free article] [PubMed] [Google Scholar]
- Petiet A, Johnson GA. Active staining of mouse embryos for magnetic resonance microscopy. Methods Mol Biol. 2010;611:141–149. doi: 10.1007/978-1-60327-345-9_11. [DOI] [PMC free article] [PubMed] [Google Scholar]
- Petiet AE, Kaufman MH, et al. High-resolution magnetic resonance histology of the embryonic and neonatal mouse: a 4D atlas and morphologic database. Proc Natl Acad Sci U S A. 2008;105(34):12331–12336. doi: 10.1073/pnas.0805747105. [DOI] [PMC free article] [PubMed] [Google Scholar]
- Pipe JG. Motion correction with PROPELLER MRI: application to head motion and free-breathing cardiac imaging. Magn Reson Med. 1999;42(5):963–969. doi: 10.1002/(sici)1522-2594(199911)42:5<963::aid-mrm17>3.0.co;2-l. [DOI] [PubMed] [Google Scholar]
- Poduslo JF, Wengenack TM, et al. Molecular targeting of Alzheimer’s amyloid plaques for contrast-enhanced magnetic resonance imaging. Neurobiol Dis. 2002;11(2):315–329. doi: 10.1006/nbdi.2002.0550. [DOI] [PubMed] [Google Scholar]
- Potkin SG, Macciardi F, et al. Identifying gene regulatory networks in schizophrenia. Neuroimage. 2010;53(3):839–847. doi: 10.1016/j.neuroimage.2010.06.036. [DOI] [PMC free article] [PubMed] [Google Scholar]
- Ramirez MS, Esparza-Coss E, et al. Multiple-mouse MRI with multiple arrays of receive coils. Magn Reson Med. 2010;63(3):803–810. doi: 10.1002/mrm.22236. [DOI] [PMC free article] [PubMed] [Google Scholar]
- Ruff J, Wiesmann F, et al. Magnetic resonance microimaging for noninvasive quantification of myocardial function and mass in the mouse. Magn Reson Med. 1998;40(1):43–48. doi: 10.1002/mrm.1910400106. [DOI] [PubMed] [Google Scholar]
- Schneider J, Lanz T, et al. Accelerated cardiac magnetic resonance imaging in the mouse using an. Magn Reson Med. 2010 Aug 25;2010:1522–2594. doi: 10.1002/mrm.22605. (Electronic)): T - aheadofprint. [DOI] [PMC free article] [PubMed] [Google Scholar]
- Sharief AA, Badea A, et al. Automated segmentation of the actively stained mouse brain using multi-spectral MR microscopy. Neuroimage. 2008;39(1):136–145. doi: 10.1016/j.neuroimage.2007.08.028. [DOI] [PMC free article] [PubMed] [Google Scholar]
- Sharief AA, Johnson GA. Enhanced T2 contrast for MR histology of the mouse brain. Magn Reson Med. 2006;56(4):717–725. doi: 10.1002/mrm.21026. [DOI] [PubMed] [Google Scholar]
- Sigurdsson EM, Wadghiri YZ, et al. A non-toxic ligand for voxel-based MRI analysis of plaques in AD transgenic mice. Neurobiol Aging. 2008;29(6):836–847. doi: 10.1016/j.neurobiolaging.2006.12.018. [DOI] [PMC free article] [PubMed] [Google Scholar]
- Song J, Liu Y, et al. Least-square NUFFT methods applied to 2-D and 3-D radially encoded MR image reconstruction. IEEE Trans Biomed Eng. 2009;56(4):1134–1142. doi: 10.1109/TBME.2009.2012721. [DOI] [PMC free article] [PubMed] [Google Scholar]
- Stein JL, Hua X, et al. Voxelwise genome-wide association study (vGWAS) Neuroimage. 2010;53(3):1160–1174. doi: 10.1016/j.neuroimage.2010.02.032. [DOI] [PMC free article] [PubMed] [Google Scholar]
- Suddarth SA, Johnson GA. Three-dimensional MR microscopy with large arrays. Magnetic Resonance in Medicine. 1991;18(1):132–141. doi: 10.1002/mrm.1910180114. [DOI] [PubMed] [Google Scholar]
- Sutton BP, Ciobanu L, et al. Parallel imaging for NMR microscopy at 14.1 Tesla. Magn Reson Med. 2005;54(1):9–13. doi: 10.1002/mrm.20531. [DOI] [PubMed] [Google Scholar]
- Swanson SD, Rosen MS, et al. Brain MRI with laser-polarized 129 xe. Wiley Subscription Services, Inc., A Wiley Company; 1997. [Google Scholar]
- Terreno E, Castelli DD, et al. Challenges for molecular magnetic resonance imaging. Chem Rev. 2010;110(5):3019–3042. doi: 10.1021/cr100025t. [DOI] [PubMed] [Google Scholar]
- Tuor UI, Malisza K, et al. Functional magnetic resonance imaging in rats subjected to intense electrical and noxious chemical stimulation of the forepaw. Pain. 2000;87(3):315–324. doi: 10.1016/S0304-3959(00)00293-1. [DOI] [PubMed] [Google Scholar]
- Tyszka JM, Fraser SE, et al. Magnetic resonance microscopy: recent advances and applications. Curr Opin Biotechnol. 2005;16(1):93–99. doi: 10.1016/j.copbio.2004.11.004. [DOI] [PubMed] [Google Scholar]
- Viale A, Reineri F, et al. Hyperpolarized agents for advanced MRI investigations. Q J Nucl Med Mol Imaging. 2009;53(6):604–617. [PubMed] [Google Scholar]
- Vlaardingerbroek MT, Boer JAd. Magnetic resonance imaging : theory and practice. Berlin; New York: Springer; 2003. [Google Scholar]
- Wadghiri YZ, Sigurdsson EM, et al. Detection of Alzheimer’s amyloid in transgenic mice using magnetic resonance microimaging. Magn Reson Med. 2003;50(2):293–302. doi: 10.1002/mrm.10529. [DOI] [PubMed] [Google Scholar]
- Weissleder R, Elizondo G, et al. Ultrasmall superparamagnetic iron oxide: characterization of a new class of contrast agents for MR imaging. Radiology. 1990;175(2):489–493. doi: 10.1148/radiology.175.2.2326474. [DOI] [PubMed] [Google Scholar]
- Weng J, Chen J, et al. Functional mapping of rat barrel activation following whisker stimulation using. Neuroimage 2007. 2007 Jul 15;36(4):1179–88. doi: 10.1016/j.neuroimage.2007.04.010. Epub 2007 Apr 18.(1053–8119 (Print)): 1179–1188. [DOI] [PubMed] [Google Scholar]
- Wolber J, Cherubini A, et al. Hyperpolarized 129Xe NMR as a probe for blood oxygenation. Magn Reson Med. 2000;43(4):491–496. doi: 10.1002/(sici)1522-2594(200004)43:4<491::aid-mrm1>3.0.co;2-6. [DOI] [PubMed] [Google Scholar]
- Yang Z, Berr SS, et al. Simultaneous evaluation of infarct size and cardiac function in intact mice by contrast-enhanced cardiac magnetic resonance imaging reveals contractile dysfunction in noninfarcted regions early after myocardial infarction. Circulation. 2004;109(9):1161–1167. doi: 10.1161/01.CIR.0000118495.88442.32. [DOI] [PubMed] [Google Scholar]
- Yu X, Wadghiri YZ, et al. In vivo auditory brain mapping in mice with Mn-enhanced MRI. Nature Neuroscience. 2005;8(7):961–968. doi: 10.1038/nn1477. [DOI] [PMC free article] [PubMed] [Google Scholar]
- Yu X, Zou J, et al. Statistical mapping of sound-evoked activity in the mouse auditory midbrain using Mn-enhanced MRI. Neuroimage. 2008;39(1):223–230. doi: 10.1016/j.neuroimage.2007.08.029. [DOI] [PMC free article] [PubMed] [Google Scholar]
- Zhou X, Sun Y, et al. MRI of stroke using hyperpolarized (129)Xe. NMR Biomed. 2010 doi: 10.1002/nbm.1568. [DOI] [PubMed] [Google Scholar]


