

Abstract
Gap junctions in retinal photoreceptors suppress voltage noise and facilitate input of rod signals into the cone pathway during mesopic vision. These synapses are highly plastic and regulated by light and circadian clocks. Recent studies have revealed an important role for connexin36 (Cx36) phosphorylation by protein kinase A (PKA) in regulating cell-cell coupling. Dopamine is a light-adaptive signal in the retina, causing uncoupling of photoreceptors via D4 receptors (D4R), which inhibits adenylyl cyclase (AC) and reduces PKA activity. We hypothesized that adenosine, with its extracellular levels increasing in darkness, may serve as a dark signal to co-regulate photoreceptor coupling through modulation of gap junction phosphorylation. Both D4R and A2a receptor (A2aR) mRNAs were present in photoreceptors, inner nuclear layer neurons, and ganglion cells in C57BL/6 mouse retina, and showed cyclic expression with partially overlapping rhythms. Pharmacologically activating A2aR or inhibiting D4R in light-adapted daytime retina increased photoreceptor coupling. Cx36 among photoreceptor terminals, representing predominantly rod-cone gap junctions but possibly including some rod-rod and cone-cone gap junctions, was phosphorylated in a PKA-dependent manner by the same treatments. Conversely, inhibiting A2aR or activating D4R in daytime dark-adapted retina decreased Cx36 phosphorylation with similar PKA dependence. A2a-deficient mouse retina showed defective regulation of photoreceptor gap junction phosphorylation, fairly regular dopamine release, and moderately down-regulated expression of D4R and AC type I mRNA. We conclude that adenosine and dopamine co-regulate photoreceptor coupling through opposite action on the PKA pathway and Cx36 phosphorylation. In addition, loss of the A2aR hampered D4R gene expression and function.
Introduction
Gap junctions are fundamental elements of neuronal wiring in the retina (Bloomfield and Volgyi, 2009). Photoreceptor gap junctions have critical functions in visual information processing. Cell-cell coupling improves the signal/noise ratio over much of the photoreceptor operating range (Lamb and Simon, 1976) and may improve contrast detection and detection of small stimuli (Lebedev et al., 1998; Li et al., 2012). Rod-cone coupling allows pathway convergence (Nelson, 1977; Schneeweis and Schnapf, 1995; Trumpler et al., 2008), forming a medium-sensitivity pathway that functions during mesopic vision when the rod pathway becomes saturated (DeVries and Baylor, 1995).
Photoreceptor coupling depends on a circadian rhythm and light/dark adaptation. It is maximal at night in dark-adapted conditions and minimal under light-adapted conditions (Wang and Mangel, 1996; Ribelayga et al., 2008). Changes in photoreceptor coupling are driven by gap junction phosphorylation and dependent on PKA activity (Li et al., 2009). There is a direct correlation between Cx35 (the fish homolog of mammalian Cx36) phosphorylation and photoreceptor coupling such that both are high in darkness at night, and low under daytime illumination (Li et al., 2009; Li and O’Brien, 2012).
The catecholamine dopamine is released from dopaminergic amacrine cells. Dopamine displays light-adaptive effects, acting both as a neurotransmitter and a neurohormone on a variety of retinal neurons (Pierce and Besharse, 1985; Weiler et al., 1988; Dearry and Burnside, 1989). Dopamine synthesis and release are stimulated by light, and in some species, controlled by a circadian clock so that dopamine release is highest during the daytime in light and lowest at night in darkness (Kramer, 1971; Iuvone et al., 1978; Nir et al., 2000; Doyle et al., 2002b; Ribelayga et al., 2004). In photoreceptors, activation of dopamine D4 receptors (D4R) suppresses the light-sensitive pool of cAMP (Cohen and Blazynski, 1990; Cohen et al., 1992), reduces PKA activity, and down-regulates type1 adenylyl cyclase (AC1) expression (Jackson et al., 2009). A circadian rhythm of extracellular adenosine in the retina has the opposite phase as does dopamine, displaying an increased level in darkness and at night compared to illumination (Ribelayga and Mangel, 2005). Adenosine regulates a largely overlapping suite of photoreceptor functions in the opposite manner as does dopamine (Rey and Burnside, 1999; Stella et al., 2002; Stella et al., 2003). Activation of A2a receptors (A2aR), which are expressed on photoreceptors (Blazynski, 1990; Kvanta et al., 1997), stimulates intracellular AC and thus increases cAMP level (Londos et al., 1980; Friedman et al., 1989).
In the current study we examined the hypothesis that D4R and A2aR may co-regulate photoreceptor coupling through antagonizing actions on gap junction phosphorylation using C57BL/6 mice. In this animal model, melatonin synthesis is constitutively low due to a natural mutation in the arylalkylamine N-acetyltransferase gene (Roseboom et al., 1998), and thus dopamine release is mainly controlled by light (Doyle et al., 2002a). We found that A2aR played a dark-adaptive role in regulating photoreceptor coupling. The regulation is primarily direct through the control of PKA activity in the photoreceptor, but may also be partially indirect, through the modulation of D4R gene expression.
Materials and Methods
Animals
The wild type (WT) mice utilized in the current study were C57BL/6 from Jackson Laboratory (stock# 000664; Bar Harbor, ME). The A2aR-deficient mice have a hybrid genetic background of 129-Steel and C57BL/6 (Chen et al., 1999). All mice used in this study were 1.5–4 months old. Within the same types of experiment, mice at matched ages were chosen to avoid the possible variability in gap junction physiology caused by aging (Fujisawa et al., 1976; Hansen et al., 2005). Animals of both sexes were used. Animals were maintained on a daily 12 hr light/12 hr dark (L/D) cycle. Zeitgeber time zero (ZT0) is defined as time of lights on (7 am); while ZT12 is defined as time of lights off (7 pm). Procedures were approved by the Animal Welfare Committee at the University of Texas Health Science Center at Houston.
Materials
Reagents were purchased from the following sources: Ames’ medium w/L-glutamine was from USBiological (Swampscott, MA). The D4R agonist PD168077 maleate (PD) and antagonist L-745870 trihydrochloride, the A2aR agonist CGS21680 hydrochloride (CGS) and antagonist 8-(3-Chlorostyryl) caffeine (CSC) were purchased from Tocris Bioscience (Minneapolis, MN). Cyclic AMP analogs, PKA activator Sp-8-CPT-cAMPS (Sp) and PKA inhibitor Rp-8-CPT-cAMPS (Rp) were from Axxora (San Diego, CA). In studies employing PD, CGS or CSC, 0.1% dimethyl sulfoxide (DMSO; Sigma-Aldrich, St. Louis, MO) was used to increase the solubility of drugs. The corresponding control utilized 0.1% DMSO as well.
Tracer coupling measurements
We estimated gap junction coupling between photoreceptors by measuring tracer diffusion of Neurobiotin (Vector Laboratories, Burlingame, CA) using the cut loading technique as described in detail previously (Ribelayga et al., 2008; Li et al., 2009; Choi et al., 2012). In brief, mice were sacrificed by cervical dislocation and eyes were quickly dissected in oxygenated Ames’ medium (supplemented with 12 mM NaHCO3, pH 7.4) at 37°C, and the retinas were flat mounted onto nitrocellulose filter paper (EMD Millipore, Billerica, MA). The flat mount retina was incubated in Ames’ for 45 min, followed by an additional 20 min with or without drugs at 37°C. Then the retina was cut with a de-waxed feather blade that had been dipped in 5% Neurobiotin with or without 2% lysine fixable dextran conjugated to fluorescein (10,000 MW; Life Technologies, Grand Island, NY). Retina pieces were incubated with Ames’ medium with or without drugs for 15 min at 37°C and subsequently fixed with 4% paraformaldehyde in 0.1 M phosphate buffer, pH 7.5 (PB) overnight at 4°C. All experiments involving dark-adapted retina were conducted in darkness or under infrared light. During all steps before fixation was completed, lighting conditions remained the same.
Fixed, washed retina tissue was labeled with 0.75 μg/ml Cy3-conjugated streptavidin (Jackson ImmunoResearch, West Grove, PA) at 4°C overnight or together with 25 μg/ml fluorescein-labeled peanut agglutinin (PNA; Vector Laboratories) for 3 days. Retina tissue was flat-mounted on slides with Vectashield mounting medium (Vector Laboratories). Cut loading fills cells non-selectively throughout the retina along the slice plane. To study photoreceptor coupling, digital images at the level of photoreceptor inner segments were taken using a Zeiss LSM 510 Meta confocal microscope (Thornwood, NY). Similar settings of pinhole, contrast, and brightness parameters were utilized for all experimental conditions. Projections of two adjacent confocal images comprising 0.9 μm focal depth were used for analysis. Under each condition, samples were collected from 3–5 different animals from least 2 separate experiments.
Images were analyzed using SimplePCI (Hamamatsu Photonics, Bridgewater, NJ) and MatLab (Mathworks, Natick, MA) software as previously described (Li et al., 2009). Intensity of Neurobiotin-positive signal was measured in 0.3 μm-diameter circles centered on photoreceptor inner segments. Cell-cell spacings were estimated based upon an average of at least 10 measurements. We estimated tracer diffusion using a linear compartmental diffusion model (Zimmerman and Rose, 1985) as applied to neural networks in retina (Mills and Massey, 1998; O’Brien et al., 2004). This model assumes that the photoreceptor array behaves as a linear chain of compartments connected by identical gap junctions characterized by a rate-limiting diffusion coefficient (k). Since the model is linear and presumes that loading occurs in a single compartment, we analyzed narrow clusters of cells extending perpendicular to the cut edge. Means of diffusion coefficients from several different clusters in a pair of retinas were used to represent one animal.
In vitro eyecup incubations
In order to use pharmacological interventions to study signaling pathways that control phosphorylation of Cx36, we used an in vitro eyecup preparation. Mice were sacrificed and the eyes collected. Eyecups were quickly prepared by removing the anterior segment and lens and then incubated in oxygenated Ames’ medium at 37°C. After 45 min resting, the culture medium was changed into fresh Ames’ and eyecups were incubated for another 20 min with or without drugs, if applicable. The eyecup was immediately fixed with 1.5% N-(3-dimethylaminopropyl)-N′-ethylcarbodiimide hydrochloride (‘carbodiimide’; Sigma-Aldrich) in 0.1M PB, pH 7.5 for 30 min at room temperature and cryoprotected in 30% sucrose at 4°C.
In preliminary studies, we compared the phosphorylation levels of Cx36 in the outer plexiform layer (OPL – the synaptic layer containing photoreceptor synapses) in acutely isolated eyes at various states of dark adaptation to those from in vitro eyecup preparations treated as described above. In the acute group, mice were sacrificed and eyes were quickly collected in ice-cold PBS. A small puncture was made in the center of the cornea with a sharp needle for easy access of fixative. The eyes were then immediately fixed with 1.5% carbodiimide in 0.1 M PB for 30 min at room temperature. Sectioning and immunocytochemistry (see below) were performed in the same manner for both groups. Results with daytime light-adapted, and 2 hr, 4 hr and 6 hr dark-adapted retina showed no difference between the two methods in the phosphorylation levels (two way ANOVA: methods, P=0.71; lighting, P=0.01; n=3/condition), supporting the contention that data from the excised eyecup preparation are representative of processes occurring in the intact eye.
Immunocytochemistry, image acquisition, and phosphorylation level estimation
For immunofluorescence localization of Cx36 in the photoreceptor layer, mouse eyes were dissected in PBS and lenses were removed. The eyecup was fixed at room temperature with 2% carbodiimide in 0.1M PB for 40 min followed by 2% paraformaldhyde in 0.1M PB for another 10 min. Fixed tissue was cryoprotected in 30% sucrose overnight at 4°C, and embedded in OCT. Tissue was sectioned into 16 μm slices using a cryostat and blocked with 10% donkey serum (Jackson ImmunoResearch) in PBST (PBS with 0.1% Triton X-100) at room temperature for 30 min. Sections were incubated with a variety of antibodies in PBST overnight at room temperature. Antibodies used included rabbit anti-syntaxin3 (1/100; gift of Dr. Roger Janz), mouse IgG1 anti-Cx36 (mCx36; 10 μg/ml, EMD Millipore MAB3045), goat anti-arrestin (2 μg/ml, Santa Cruz Biotechnology, Santa Cruz, CA), mouse IgG2a anti-PSD-95 clone K28/43 (1/100, UC Davis/NIH NeuroMab Facility, Davis, CA). Following extensive washing with PBS, sections were incubated with suitable secondary antibodies including 3.75 μg/ml Alexa Fluor 647 donkey anti-rabbit (Jackson ImmunoResearch; for sytaxin3), 5 μg/ml Alexa Fluor 555 goat anti-mouse IgG1 (Life technologies; recognizing Cx36 while co-labeling with mouse IgG2a PSD-95) or 3.5 μg/ml Cy3 donkey anti-mouse IgG (Jackson ImmunoResearch; for Cx36), 5 μg/ml Alexa Fluor 488 donkey anti-goat IgG (Life technologies; for arrestin), and 5 μg/ml Alexa Fluor 488 goat anti-mouse IgG2a (Life technologies; for PSD-95). The secondary antibodies were incubated at room temperature for 3 hr. Nuclei were counterstained by mounting sections with Vectashield mounting medium with DAPI (Vector Labs).
The phosphorylation state of Cx36 gap junctions was measured by immunocytochemistry as described previously (Kothmann et al., 2007; Kothmann et al., 2009; Li et al., 2009). Briefly, cryostat sections of eyecups fixed with 1.5% carbodiimide were rehydrated with PBST and blocked with 10% donkey serum in PBST for 1 hr at room temperature. The sections were probed at 4°C overnight with mCx36 at 2.5 μg/ml and rabbit anti-Cx36 phospho-Ser293 (Kothmann et al., 2007) at 0.8 μg/ml in 10% donkey serum with PBST. The sections were then incubated with Cy3-conjugated donkey anti-mouse IgG (2.1 μg/ml; Jackson ImmunoResearch) and Alexa 488-conjugated donkey anti-rabbit IgG (2.0 μg/ml; Life Technologies) at room temperature for 2 hr. Sections were preserved in Vectashield mounting medium.
Image acquisition and data analysis were described previously (Kothmann et al., 2007; Kothmann et al., 2009; Li et al., 2009). In brief, 12-bit photomicrographs were taken using the confocal microscope with fixed laser power settings. The detector gain and offset parameters were adjusted so that the intensity of most pixels fell within the dynamic range of the detector and the intensity of the most brightly labeled conditions showed very limited saturation. For each experiment, once settings were optimized, they remained unchanged for all conditions and treatments to avoid imaging biases. Images were taken in the OPL randomly selected within the region from 50% to 80% of the distance from the optic nerve head to the periphery. Three neighboring scans at 0.3 μm intervals were stacked to generate a 35 × 16 × 0.9 μm volume, which was exported into one 12-bit tiff image. Five images were collected from two cryosections of one eyecup to represent one animal.
The confocal images were analyzed with Simple PCI software (Hamamatsu) as described previously (Li et al., 2009). In each image, regions of interest (ROI) were selected to circle mCx36 immunoreactive puncta by applying a 20% threshold. Ideally one ROI represented one gap junction plaque, although occasionally adjacent gap junctions were merged into a single ROI. The number of Cx36 plaques was estimated by counting the total number of ROI in each image. The average ROI count over 5 images was used to represent one animal. The phosphorylation level was estimated by taking a ratio of the intensity of phospho-S293 to that of mCx36 labeling within each ROI. Since the population of phosphorylation state ratios is not normally distributed, the median was calculated from all Cx36 plaques in 5 images to represent the phosphorylation level of one animal (Li et al., 2009).
In situ hybridization
To localize the A2aR and D4R in the mouse retina, we performed in situ hybridization (ISH) for each gene. A probe for the D4R was designed based upon NCBI reference sequence NM 007878.2. To make D4R RNA probes, a 281 bp DNA template was amplified by PCR using a cDNA clone (Cat# MMM1013-99622152, Thermo Fisher Scientific, Waltham, MA) as template and the following primer set: forward ACCCTACTCAGGGTCCCTTC, reverse GATGTGCACCACGAAGAAAG. Probes for A2aR were designed based upon NCBI reference sequence NM 009630.2. The DNA template for generating RNA probes was a 32-mer oligonucleotide (Life Technologies). The antisense sequence is as follows: ATCATCAACTGCTTCACCTTCTTCTGCTCCAC. T7 or SP6 RNA polymerase promoters were incorporated into the oligos, and digoxigenin-labeled RNA probes were synthesized by in vitro transcription (Life Technologies MAXIscript kit) in the presence of digoxigenin-dUTP (Roche, Basel, Switzerland) following the manufacturer’s instructions.
We wanted to compare the transcript levels throughout a L/D cycle. To accomplish this, mouse eyes were collected at 4 different time points: ZT23.5 (dark), ZT5.5 (light), ZT11.5 (light) and ZT17.5 (dark). Eyes were quickly fixed with 4% paraformaldehyde in 0.1 M PB for 48 hr at 4°C, and then embedded in paraffin and cut into 9 μm sections using a microtome. Retina sections were de-waxed, treated with 30 μg/ml proteinase K (Roche) at 37°C for 20 min, and post-fixed in 4% paraformaldehyde in 0.1 M PB for 20 min. To reduce non-specific background, sections were incubated with 0.5% acetic anhydride in 0.1M triethanolamine for 10 min twice, with rinsing in PBS between incubations. Hybridization was performed overnight with riboprobes for A2aR at 48°C or for D4R at 60°C. Sections were then washed at hybridization temperature with buffers at high stringency: 50% formamide with 2x SSC (300 mM NaCl, 30 mM Na3Citrate, pH 7.0) for 30 min, 1x SSC for 30 min, and 0.2x SSC for 30 min. Non-hybridized RNA probes were deactivated by treatment of 0.2 μg/ml RNase A (Sigma-Aldrich) at 37°C for 30 min. Hybridization signals were detected by incubating retina sections with 7.5 mU/ml antibody against digoxigenin conjugated with horseradish peroxidase (Roche) at 4°C overnight. On the third day, color was developed with TSA plus Cy3 system (PerkinElmer, Waltham, MA) for various time periods ranging from 30 min to 2 hr.
Some retina sections with ISH completed were subsequently immunostained. Sections were rinsed in PBST for 1hr and blocked with 10% donkey serum in PBST for 1hr at room temperature. Sections were incubated with 1/1000 sheep polyclonal antibody against tyrosine hydroxylase (EMD Millipore) overnight at room temperature. After rinsing with PBS, sections were incubated with 5 μg/ml Alexa Fluor 488 donkey anti-sheep IgG (Invitrogen) for 3 hr at room temperature. Images were taken using a confocal microscope.
Real time-PCR
After mice were sacrificed, eyes were quickly frozen with liquid nitrogen and stored at -80°C. Retinas were collected in ice-cold PBS and homogenized in TRI reagent (Sigma-Aldrich). For each animal, RNA was extracted from retinas of both eyes and treated with TURBO DNase (Life Technologies) following manufacturer’s instructions. First strand cDNA was synthesized using SuperScript III Transcriptase (Life Technologies). Real time-PCR was performed using SYBR Green PCR master mix (Life Technologies) and the following program: 95°C for 2 min, 40 cycles of 95°C for 30 sec, 57°C for 30 sec, 72°C for 30 sec in the Mastercycler EP Gradient PCR machine (Eppendorf, Germany). Each sample was assayed in duplicate. The threshold cycle (CT) of A2aR, D4R, and AC1 gene amplification was normalized with the CT of 18S rRNA, and relative to the CT of each gene at ZT5.5 in the WT mouse retina using the comparative CT method (Schmittgen and Livak, 2008). Information for primers is provided in Table 1.
Table 1.
Primers for real time-PCR study.
| Name | Primer sequence | References |
|---|---|---|
| 18S rRNA-forward | TAGAGTGTTCAAAGCAGGCCCGA | (Jackson et al., 2009) |
| 18S rRNA-reverse | ATGCTTTCGCTCTGGTCCGTCTT | |
| A2aR-forward | CCGAATTCCACTCCGGTACA | (Streitová et al., 2010) |
| A2aR-reverse | CAGTTGTTCCAGCCCAGCAT | |
| D4R-forward | TGCCCTCAACCCCATCATCTACAC | Designed using http://frodo.wi.mit.edu/primer3 |
| D4R-reverse | CAACCCCCAGCCTTCATAAGTGGT | |
| AC1-forward | CACAGCAGGAACCAAGGCTAAGAA | (Jackson et al., 2009) |
| AC1-reverse | TGCCAACTCGGAGAACAAAGTCGT |
High-performance liquid chromatography
The concentrations of dopamine and its metabolite dihydroxyphenylacetic acid (DOPAC) were assayed in mouse retina by HPLC. Frozen mouse eyes were homogenized by sonication in the presence of 0.1 M perchloric acid and 0.5 mM ascorbic acid. Homogenate was centrifuged at 15000 rpm twice for a total of 50 min. The extract from one eye was assayed to represent one animal. Samples were resolved in a Shimadzu HPLC system (Shimadzu Scientific Instruments, Columbia, MD) using a C18 column (150 mm × 4.6 mm, 5 μm porous silica) with an isocratic mobile phase containing 50 mM KH2PO4, 0.02% octyl sodium sulfate, 15% methanol, and 0.1 mM Na2-EDTA, pH 3.1. Dopamine and DOPAC were detected by an amperometric detector (BASi, West Lafayette, IN) and normalized to a standard solution containing dopamine and DOPAC with known concentration in the same HPLC assay.
Results
Dark adaptation resembles the nighttime state in C57BL/6 mice
Photoreceptor gap junction coupling is controlled by a circadian rhythm of dopamine secretion and light conditions (Yang and Wu, 1989; Wang and Mangel, 1996; Krizaj et al., 1998; Ribelayga et al., 2008; Li et al., 2009). The dopamine rhythm is in turn controlled partially by a potent circadian rhythm in photoreceptor melatonin secretion (Dubocovich, 1983; Dubocovich and Takahashi, 1987; Nowak et al., 1992). In C57BL/6 mice, melatonin secretion is constitutively low due to a mutation in the gene for rate-limiting enzyme of the melatonin synthetic pathway, arylalkylamine N-acetyl transferase ((Roseboom et al., 1998). In these animals, dopamine secretion is controlled by light conditions (Doyle et al., 2002a), suggesting that dark adaptation may recapitulate the nighttime state. To test this hypothesis, we compared photoreceptor coupling and dopamine secretion in darkness at night to that in dark-adapted conditions in the daytime.
As previously found in zebrafish (Li et al., 2009), daytime light-adapted mouse retina displayed weak tracer diffusion among photoreceptors, limited to loaded cells along the cut edge of the retina and occasionally another row of tracer coupled cells (Fig. 1A). In contrast, nighttime dark-adapted mouse retina showed extensive tracer diffusion beyond the loaded cells of the cut edge, indicating much more extensive coupling within the photoreceptor network (Fig. 1B). Dark adaptation for 2, 4, and 6 hr in the daytime also increased tracer diffusion through the photoreceptor network (Fig. 1C, D, E). No sign of diffusion was observed in labeling of the lysine fixable dextran (10,000 MW), which was co-applied with Neurobiotin (data not shown). The majority of Neurobiotin-loaded cells were not co-localized with PNA (Fig. 1D), indicating that they are rods. The fraction of PNA-labeled cones within the Neurobiotin-loaded photoreceptor network was 7± 0.7% (mean ± SEM, n=5) in the daytime 6 hr dark-adapted mouse retina. This is about twice the expected amount based on the abundance of cones in C57BL/6 mouse retina (Jeon et al., 1998), suggesting that there is some preference for cones in loading or tracer diffusion. This could simply reflect the larger size of cone pedicles and a proportionally increased probability of being damaged by the cut, but may also reflect isolation of some rods in the network, preventing them from acquiring tracer.
Figure 1.

Photoreceptor coupling and dopamine release in light- and dark-adapted mouse retina in daytime and at night. Cut loading was conducted in mouse retina using Neurobiotin (red; A-D) followed by post-fixation labeling of cones with PNA (green; A, D). Images show flat-mounted retina at the plane of the photoreceptor inner segments. Under light exposure in the daytime (A), tracer diffusion was limited to the cut edge (dashed line). The majority of neurobiotin-loaded cells were not co-localized with PNA. In the nighttime 6 hr dark-adapted retina (B), Neurobiotin tracer diffusion was much more extensive among the photoreceptor matrix. Daytime photoreceptor coupling was increased by dark adaptation for 2 hr (C), 4 hr, and 6 hr (D), with a small fraction of cones among the coupled cells (green PNA label in D). (E) Summary of tracer coupling data for day, night, and 2, 4 and 6 hr dark adaptation in the daytime (n=5–11 per condition). (F) HPLC analysis of dopamine and DOPAC in whole eyes from animals collected under the same conditions as for tracer coupling measurements (n=4–6 per condition). Data in E and F are mean± SEM; * P<0.05; ** P<0.01; ns not significant. Images A and D are projections comprising 4 μm focal depth; images B and C are projections comprising 0.9 μm focal depth.
Tracer diffusion was quantified by fitting Neurobiotin label intensity in individual photoreceptors arrayed perpendicular to the cut edge to a compartmental diffusion model (Mills and Massey, 1998; Li et al., 2009). The increase in calculated Neurobiotin diffusion coefficient over the daytime, light-adapted condition was significant in each dark-adapted condition (Fig. 1E), with 6 hr dark adaptation increasing coupling close to the extent seen in dark-adapted retina at night (one way ANOVA, P=0.0003; followed by Bonferroni’s multiple comparison tests; n=5–11/condition).
Since dopamine is considered a primary factor controlling photoreceptor coupling and dopamine release is controlled by light/dark adaptation, we examined dopamine release under each lighting condition by measuring the retinal DOPAC/DA ratio. DOPAC is the product of dopamine oxidation by monoamine oxidase, and is made from the pool of dopamine that is taken up into cells from the extracellular space. Therefore the DOPAC/DA ratio is a good index of dopamine turnover and release (Witkovsky, 2004). As expected, dopamine release was highest in the daytime light-adapted retina, and reduced in the nighttime dark-adapted retina (Fig. 1F). Dark adaptation in the daytime suppressed dopamine release, with 6 hr dark adaptation resulting in about half the DOPAC/DA ratio as that of light-adapted retina. The reduction in dopamine secretion was significant at night and in all dark-adapted daytime conditions examined (one way ANOVA: P<0.001; followed by Bonferroni’s multiple comparison tests; n=4–6/condition). These results show that dark adaptation of C57BL/6 mice in the daytime results in a state that is qualitatively similar to the nighttime state in that photoreceptor coupling is increased and dopamine release is reduced.
Photoreceptor gap junctions contain connexin 36
In order to study the molecular mechanisms that control photoreceptor coupling, it is necessary to identify the connexins involved. Connexin 36 (Cx36) has long been associated with photoreceptor coupling. Deletion of the Cx36 gene in mice leads to visual transmission deficits in the rod pathway consistent with loss of rod-cone coupling (Guldenagel et al., 2001; Deans et al., 2002; Volgyi et al., 2004). A longstanding controversy remains in the field regarding which photoreceptors express Cx36. Cx36 has been detected on cone pedicles in the mouse (Feigenspan et al., 2004). This is consistent with its localization at cone-cone gap junctions in fish, amphibian, and chicken retina (O’Brien et al., 2004; Zhang and Wu, 2004; Kihara et al., 2009; Li et al., 2009) and at rod-cone gap junctions in amphibian, fish and primate retina (Zhang and Wu, 2004; Li et al., 2009; O’Brien et al., 2012). However, an immunoelectron microscopy study has found Cx36 only on the cone side of rod-cone gap junctions in guinea pig (Lee et al., 2003) and marker gene expression in one of the three Cx36 knockout lines shows expression in the outer nuclear layer (ONL) limited to a group of cells at the outer edge of the ONL, consistent with localization only in cones (Degen et al., 2004; Feigenspan et al., 2004). Marker gene expression in other Cx36 knockout lines is more widespread, consistent with expression in both rods and cones (Deans et al., 2002) and Cx36 is clearly present at rod-rod gap junctions in the salamander retina (Zhang and Wu, 2004), making an evolutionary argument in favor of its expression in rods in other vertebrates.
To contribute to this controversy, we performed confocal immunofluorescence experiments in mouse retina designed to localize Cx36 in the photoreceptor layer. Consistent with previous studies, the majority of Cx36 immunoreactive puncta (red) were present among photoreceptor terminals and in the OPL, with smaller numbers of gap junctions apparent among photoreceptor somata in the ONL (Fig. 2A–C). Outlines of both rod and cone photoreceptor terminals were visualized with antibodies either to PSD-95 (green, Fig. 2B) or syntaxin 3 (blue, Fig. 2A, C–H), with cones identified by labeling with a cone arrestin antibody (green, Fig. 2A, C–H). In figure 2B, cones can also be identified by the broader and more irregular outline in PSD-95 immunostaining (white x’s in Fig. 2B). In these experiments, much of the Cx36 labeling was found on the borders of rod spherules (small green circles in Fig. 2B and blue circles in C), consistent with either rod-rod or rod-cone gap junctions. Some Cx36 labeling in the OPL beneath cone terminals is presumed to belong to unidentified cone bipolar cells (arrowheads, Fig. 2B–D, F, H). Labeling of cones with a cone arrestin antibody revealed that many of the gap junctions among rod spherules actually represent contacts of rods onto cones (arrows, Fig. 2C–H; identical cone pedicles labeled with dark stars in Fig. 2D, E). A small number of Cx36 gap junctions associated with cone terminals appeared to be at contacts with telodendrial processes from neighboring cones (“+”, Fig. 2G, H), but none of these could be resolved unambiguously. Finally, gap junctions scattered through the ONL occasionally appeared to be associated with a cone axon, representing rod-cone contacts, but most appeared to be between somata of adjacent rods (white stars, Fig 2A, C). This suggests that rod-rod gap junctions likely contain Cx36, though we cannot exclude the possibility that undetected cone telodendria make contacts with rods at these points.
Figure 2.

Immunostaining of Cx36 in the mouse outer retina. (A) View of the full photoreceptor layer from outer segments (top) to outer plexiform layer (OPL; bottom) labeled for syntaxin 3 (blue), cone arrestin (green), Cx36 (red), and DAPI (purple). The same color scheme is used in C-H. Cx36 plaques were abundant in the OPL and infrequent between somata in the outer nuclear layer (ONL; star). (B) High magnification view of the OPL labeled for PSD-95 (green), Cx36 (red) and DAPI (purple). Numerous rod spherules appear as small circles while fewer cone pedicles are larger, dimmer, and more irregular in shape (“x”). Cx36 plaques were found associated with rod and cone membranes, as well as below cone pedicles (arrowheads). (C) Cone arrestin labeling (green) revealed that many Cx36 plaques associated with rod membranes also contacted with cone telodendria or axons (arrows). Some small Cx36 puncta in the lower level of ONL seemed not to be associated with a cone, suggesting possible rod-rod connections (stars). (D) High magnification view of three cone pedicles showing labeling only for cone arrestin and Cx36. Fine telodendria extending from the cone pedicle reach out to contact many Cx36 gap junctions within the OPL. Cx36 gap junctions were also found by the cone axon and inside and underneath the pedicles. The cone pedicle indicated with black star is shown again in (E) with syntaxin 3 labeling (blue) revealing rod terminals. Arrows show contacts between rod spherules and cone telodendria via Cx36. (F–G) Additional views of cones in the OPL showing rod-cone gap junctions (arrows) and potential cone-cone gap junctions (“+” in G and H). Scale bars in A and B are 5μm and in C–H are 2 μm.
In an EM reconstruction of mouse OPL, Tsukamoto et al. (2001) identified both rod-cone (~57% of the total) and rod-rod (~42% of the total) gap junctions among photoreceptor terminals, axons and somata in and adjacent to the OPL. A very small remaining fraction of gap junctions were cone-cone. Our immunostaining of Cx36 in the mouse retina is consistent with all of these gap junctions being composed of Cx36. In the subsequent experiments, we examine the changes in phosphorylation state of this heterogeneous pool of Cx36 gap junctions in the immediate proximity of the OPL. This pool appears to contain a dominant contribution from rod-cone gap junctions, but likely also contains rod-rod, cone-cone, and a small pool of bipolar cell gap junctions.
Gap junction phosphorylation changes in concert with photoreceptor coupling
Gap junction coupling is controlled by phosphorylation at two critical regulatory sites in Cx35/36, Ser110 and Ser276/293 (Ser276 in Cx35 is homologous to Ser293 in Cx36) (Ouyang et al., 2005; Patel et al., 2006; Kothmann et al., 2007; Li et al., 2009). A strong, positive correlation between Cx35/36 phosphorylation and neuronal coupling has been demonstrated in both rabbit and zebrafish retina (Kothmann et al., 2009; Li et al., 2009; Li and O’Brien, 2012). To test if mouse photoreceptors follow this pattern, we measured the phosphorylation levels of Cx36 in mouse OPL, where most photoreceptor gap junctions are located. Figures 3A and 3B show that in the OPL the phospho-S293 labeling was weak in the daytime light-adapted retina and strong in the nighttime dark-adapted retina. Two hour dark adaptation in the daytime led to increased phospho-S293 labeling (Fig. 3C), and the phosphorylation signal increased with dark adaptation extended to 4 hr and 6 hr (Fig 3D, 4 hr not shown). Histograms of counts of individual gap junctions vs. phosphorylation level, as measured by the ratio of phospho-S293/mCx36, for daytime light-adapted and nighttime dark-adapted conditions revealed strongly skewed distributions (Fig. 3E). It was not feasible to discriminate individual populations of gap junctions from these data. However, it was apparent that light adaptation in the daytime resulted in a leftward shift of the entire distribution, suggesting that the majority of gap junctions behaved in a similar manner. In order to quantitatively compare conditions, we calculated the median of the distribution for each animal in each condition. These comparisons revealed a significant increase in median phosphorylation level of nighttime dark-adapted condition vs. daytime light adapted (Fig. 3F bottom). Dark adaptation in the daytime also led to a significant increase in phosphorylation over light-adapted control at 6 hr dark adaptation (Fig. 3F-bottom; one way ANOVA, P=0.0094; followed with Bonferroni’s multiple comparison tests; n=6–9/condition). There was no difference between 6 hr dark adaptation in daytime and nighttime.
Figure 3.

Phosphorylation state of Cx36 in the OPL in light- or dark-adapted mouse retina in daytime and at night. Phosphorylated Cx36 was labeled with a phospho-specific antibody against S293 of Cx36 (green), in reference to the total Cx36 (mCx36; red). Cx36 was poorly phosphorylated in daytime light-adapted retina (A, S293-P alone; A′, phospho-S293 and mCx36 merged). In contrast, 6 hr dark-adapted retina at night (B, B′) displayed strongly phosphorylated Cx36. In daytime, dark adaptation for 2 hr (C, C′) or 6 hr (D, D′) enhanced phosphorylation of Cx36. (E) Histogram of phosphorylation states (phospho-S293/mCx36) of individual gap junctions in nighttime dark-adapted retina (black symbols) and daytime light-adapted retina (white symbols). Data are pooled from 6 nighttime and 6 daytime animals. (F, lower panel) Summary of the median phosphorylation states of OPL Cx36 in daytime, nighttime and 2, 4, and 6 hr dark adaptation in daytime. In the upper panel, the total number of Cx36 plaques per 504 μm3 sampling volume for the same samples is plotted. Data in F are means ± SEM, n=6–9 per condition; * P<0.05; ** P<0.01; ns not significant.
The phosphorylation level of Cx36 represents the median state of the gap junctions, regardless of any variation in size of the population. We also evaluated the total number of Cx36 plaques per unit volume and compared the Cx36 density among the conditions. There was no significant change in the number of Cx36 gap junctions among any of the conditions examined (Fig. 3F-top; one way ANOVA, P=0.691). This suggests that changes in photoreceptor coupling were dominated by changes in gap junction phosphorylation state, without significant changes in the number of gap junctions present. We plotted phosphorylation level of Cx36 as a function of the diffusion coefficient data from the tracer coupling experiment. Consistent with previous studies in zebrafish (Li and O’Brien, 2012), there is a positive correlation between tracer coupling and phosphorylation in mouse photoreceptors (Fig. 4).
Figure 4.
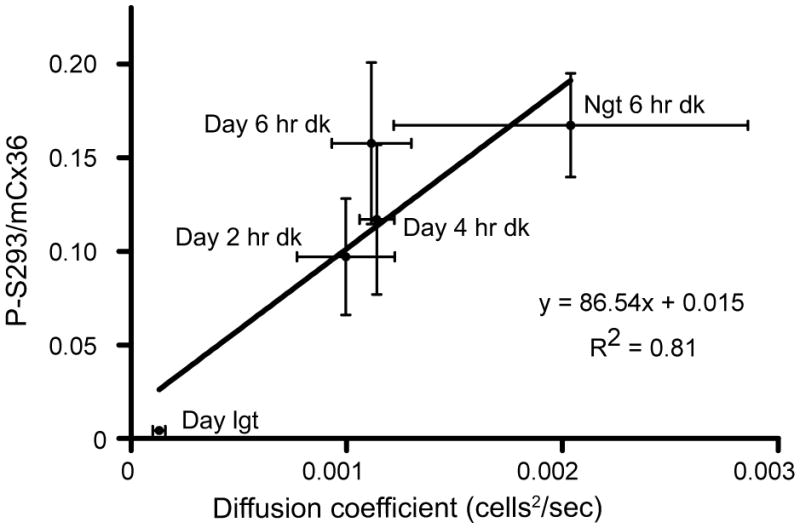
Cx36 phosphorylation and tracer coupling of photoreceptors are positively correlated. Based upon data shown in Figures 1 and 3, the relationship between phospho-S293/mCx36 ratio and diffusion coefficient during cut loading under comparable conditions was analyzed. The linear regression with R2=0.81 suggested a fairly strong, positive correlation between phosphorylation level of Cx36 and photoreceptor coupling.
Dopamine and adenosine receptors control Cx36 phosphorylation in an opposing manner
In zebrafish retina, the changes in photoreceptor coupling and Cx35 phosphorylation associated with daytime and nighttime states were dependent on PKA activity (Li et al., 2009). Since dopamine suppresses AC activity by activating D4R, we hypothesized that adenosine may stimulate AC activity through A2aR. Activation of A2aR should increase cAMP level, activate PKA, and enhance Cx36 phosphorylation and photoreceptor coupling. We used an isolated mouse eyecup preparation to test this hypothesis. Figure 5A shows dose-response curves for the effects of the A2aR agonist CGS21680 and the D4R antagonist L-745870 on Cx36 phosphorylation level in daytime, under light-adapted conditions. Both inhibiting D4R and activating A2aR increased Cx36 phosphorylation level in the OPL in a dose-dependent manner (Fig. 5A; n=3/condition). The half maximal effective concentration (EC50) for CGS21680 was 3.2 μM, 16 times higher than the EC50=0.2 μM for elongation of isolated green sunfish cone inner segment-outer segment preparations (Rey and Burnside, 1999). The half maximal inhibitory concentration (IC50) for L-745870 was 0.3 μM, about 34 times higher than the IC50=8.7 nM for reversal of sulpiride suppression of 3H-GABA release from rat subthalamic nucleus slices (Floran et al., 2004). These differences could be due to diffusional barriers in the isolated eyecup preparation and the relatively short time course of the experiments, or they could reflect differences in the receptor properties.
Figure 5.

Adenosine A2aR and dopamine D4R regulation of photoreceptor Cx36 phosphorylation in a mouse eyecup preparation. (A) Dose-response curves for the A2aR agonist CGS21680 and the D4R antagonist L-745870 to phosphorylate Cx36 in light-adapted daytime retina. Data are means ± SEM; n=3 per condition. (B) In daytime under photopic light exposure, activating A2aR with 10 μM CGS21680 or blocking D4R with 3 μM L-745870 increased Cx36 phosphorylation. These effects were blocked by concurrently applying 10 μM PKA inhibitor Rp-8-CPT-cAMPS. Applying only 10 μM Rp showed no changes from the control group. Data are means ± SEM; n=3–12 per condition. (C) In daytime dark-adapted retina, inhibiting A2aR with 75 nM CSC or stimulating D4R with 200 nM PD168077 inhibited Cx36 phosphorylation. These inhibitory effects were reversed by 10 μM PKA activator Sp-8-cpt-cAMPS. 10 μM Sp alone showed no changes from the dark-adapted control retina, while 10 μM Rp significantly reduced phosphorylation of Cx36 in the OPL. Data are means ± SEM; n=5–8 per condition. * P<0.05; ** P<0.01; ns not significant.
If the increased phosphorylation level resulted from activation of PKA through A2aR activation or D4R inhibition, we hypothesized that suppressing PKA activity concurrently would prevent the increase in phosphorylation. Indeed, as shown in figure 5B, while 10 μM CGS21680 or 3 μM L-745870 significantly increased phosphorylation, concurrently applying either drug with 10 μM PKA inhibitor Rp-8-cpt-cAMPS brought phosphorylation down to the control level (one way ANOVA: P<0.0001; followed with Bonferroni’s multiple comparison test; n=3–12/condition).
In the reciprocal daytime, 6 hr dark adaptation experiment (Fig. 5C), applying 75 nM A2aR antagonist CSC or 200 nM D4R agonist PD168077 led to dephosphorylation of Cx36 in the mouse OPL. This dephosphorylation was inhibited by 10 μM PKA activator Sp-8-cpt-cAMPS (Fig. 5C; one way ANOVA: P<0.0001; followed with Bonferroni’s multiple comparison test; n=5–8/condition), again suggesting that effects of D4 and A2a receptors on Cx36 phosphorylation in the dark are mediated by changes in PKA activity.
Provided the positive correlation between Cx36 phosphorylation and photoreceptor coupling in mouse, we expected that the high phosphorylation level induced by D4R inhibition and A2aR activation would be sufficient to increase photoreceptor coupling in the light-adapted state. Indeed, application of 3 μM L-745870 or 10 μM CGS21680 under photopic light exposure in daytime resulted in significantly increased spread of Neurobiotin through the photoreceptor matrix, to an extent similar to that observed during daytime 6 hr dark adaptation (Fig. 6 bottom; One way ANOVA, P<0.0001; followed with Bonferroni’s test; n=4–11/condition). Among the extensively coupled photoreceptor matrix, PNA labeling identified about 5 ± 0.5% cones in the L-745870-treated retina and about 8 ± 1% in CGS-treated retina (Fig. 6 top). Neither L-745870 nor CGS21680 treatment significantly altered the proportion of coupled photoreceptor subtypes compared to daytime dark-adapted retina (t tests; P=0.06 and P=0.44 respectively; n=4–5/condition) although a reduction in proportion of cones with the D4R antagonist treatment was almost significant.
Figure 6.

Effects of D4R antagonist and A2aR agonist on photoreceptor tracer coupling. Lower panel: 3 μM D4R antagonist L-745870 and 10 μM A2aR agonist CGS21680 increased the diffusion coefficient of Neurobiotin tracer coupling in daytime light-adapted retina. Data are means ± SEM, n=4–11 per condition; ** represent significance vs. daytime light-adapted condition at p<0.01. No difference was detected among daytime dark-adapted condition and either drug treatment in light-adapted condition (dark-adapted data are re-plotted from Fig. 1E). Upper panel: The proportion of coupled cones identified by PNA staining in the same experiments (scatter plot of raw data with mean± SEM).
To summarize, manipulating the activity of D4R and A2aR pharmacologically, either in light or dark adaptation in daytime, is sufficient to change both the phosphorylation state of Cx36 and photoreceptor coupling. If these effects occur directly through D4R and A2aR on the photoreceptor membrane, the two G-protein coupled receptors would provide forces antagonistic to each other to regulate AC activity, cAMP level and PKA activity. The balance of these opposing forces provides for tight control of photoreceptor coupling.
Both dopamine D4R and adenosine A2aR are expressed in photoreceptors in a rhythmic fashion
Both dopamine D4 and adenosine A2a receptors have previously been localized to photoreceptors (Blazynski, 1990; Blazynski and Perez, 1991; Cohen et al., 1992; Nguyen-Legros et al., 1996; Kvanta et al., 1997; Nguyen-Legros et al., 1999; Klitten et al., 2008). Furthermore, the D4R mRNA displays a diurnal and circadian rhythm in the rodent retina (Storch et al., 2007; Bai et al., 2008; Jackson et al., 2011). If D4R and A2aR coordinately regulate photoreceptor coupling, their rhythmic expression may have an important influence on the balance of receptor activities that imposes this regulation. To examine the pattern and rhythmicity of D4R and A2aR expression, we conducted ISH in mouse retina sampled every 6 hr during a L/D cycle. Figure 7 shows that the D4R transcript signal resided in the photoreceptor layer, mostly within inner segments (Fig. 7D, D′, arrows) and some signal immediately adjacent to photoreceptor nuclei (Fig. 7D′, arrowheads), as well as inner nuclear and ganglion cell layers (Fig. 7A, D). The sense probe resulted in no signals at all time points (Fig. 7D″; ZT17.5 shown). In the INL, some neurons were co-labeled with an antibody against tyrosine hydroxylase, suggesting that the dopaminergic amacrine cells express D4R (Fig. 7A, inset). The localization of D4R is consistent with previous reports by ISH in rodents (Cohen et al., 1992; Klitten et al., 2008). Moreover the D4R transcript displayed a strong rhythmicity during the course of the day-night cycle: high in the darkness near the middle of the night and declining to a minimum near the end of the daytime. This pattern was observed in most of the D4R-positive retinal neurons and has been previously described (Storch et al., 2007; Bai et al., 2008; Jackson et al., 2011).
Fig. 7.

In situ hybridization for dopamine D4R and adenosine A2aR in mouse retina at different time points during a L/D cycle. (A–D) D4R mRNA signal (red) was located in photoreceptors, most inner nuclear layer neurons, and ganglion cells. The sense probe resulted in negative labeling at all time points (ZT17.5 shown in D″). Some cells in the INL showed positive tyrosine hydroxylase antibody co-labeling (green; inset in A). DAPI was used as nuclear counterstain (blue). The D4R transcript level was high at night (A, D) and low during the day (B, C). (E–H) A similar distribution pattern was observed for the A2aR transcript (red), with signal observed in the upper outer nuclear layer (arrowheads), most cells in the INL, and some ganglion cells. Sense probe labeled negatively at all time points (ZT23.5 shown in E″). The A2aR transcript seemed high before light onset and during midday. Interestingly the A2aR mRNA was mainly located surrounding the somata in the upper ONL (arrowheads in E, F, and E′), with some mRNA signal in the inner segments (arrow in E′). In contrast, the majority of D4R mRNA was located in the inner segments (arrows in D and D′), with minor signal surrounding photoreceptor somata (arrowheads in D′). Merged images combining bright field and fluorescence microscopy to provide image of photoreceptor outer segments (D′, E′).
Interestingly, the cellular distribution pattern of A2aR transcript seemed similar to that of D4R (Fig. 7E–H), with the sense probe providing negative signals (Fig. 7E″; ZT23.5 shown). Most inner nuclear layer neurons and some ganglion cells showed prominent A2aR transcript signal. The antibody against tyrosine hydroxylase failed to label dopaminergic cells in this preparation, possibly due to the prolonged TSA incubation required to detect the short cRNA probe for A2aR. A2aR mRNA transcript in photoreceptors was mainly localized to the cytoplasmic space surrounding the soma (Fig. 7E′, arrowheads), in contrast to the inner segment localization of D4R mRNA hybridization (Fig. 7D′, arrows). This is similar to the pattern of A2aR mRNA localization reported in rat retina (Kvanta et al., 1997). The temporal expression of A2aR partially overlapped with D4R mRNA, with ISH labeling being highest before light onset and declining to a minimum near the end of the daytime. This expression pattern seems to occur in most A2aR-positive neurons in the retina.
Adenosine receptor 2a−/− mice have defects in the regulation of photoreceptor coupling and gap junction phosphorylation
The pharmacological data thus far support the hypothesis that A2aR and D4R regulate photoreceptor coupling in an opposing manner. If the A2aR provides the positive driving force, it is expected that loss of the A2aR will lead to uncoupling of photoreceptors and dephosphorylation of Cx36 due to the dominance of the D4R-dependent negative driving force. However, Neurobiotin tracer coupling was significantly higher in the daytime under light exposure in the A2a−/− mouse than in WT mouse retina (Fig. 8A; one way ANOVA, P=0.0003; followed with Bonferroni’s multiple comparison test; n=4–18/condition). As expected, the A2aR agonist CGS21680 (10 μM) had no effect on A2a−/− mouse retina, while it significantly increased coupling in the photoreceptor network of WT mice. The fraction of coupled cones in A2a−/− retina was 6± 1.1 %, not statistically different from the daytime dark-adapted WT retina (t test, P=0.45, n=5/condition).
Fig. 8.

The A2a−/− mouse retina showed abnormal photoreceptor coupling and Cx36 phosphorylation. (A) Neurobiotin tracer coupling in daytime light-adapted conditions in WT and A2a−/− photoreceptors either in control conditions or with 10 μM A2aR agonist CGS21680. Asterisks represent significance compared to the WT control condition (* P<0.05; ** P<0.01; ***P<0.001; ns not significant). CGS21680 induced expanded tracer coupling in WT but had no effect in the A2a−/− mouse retina. WT data are re-plotted from Fig. 6. (B) Cx36 phosphorylation state in daytime light-adapted conditions in WT and A2a−/− OPL. A2a−/− mouse retina displayed significantly elevated Cx36 phosphorylation. This high phosphorylation did not respond to 10 μM A2aR agonist CGS21680, 3 μM D4R antagonist L-745870, or 10 μM PKA activator Sp-8-CPT-cAMPS, but was reduced by 10 μM PKA inhibitor Rp-8-CPT-cAMPS. Compared with the light-adapted state, 6 hr dark adaptation in the daytime in A2a−/− retina failed to induce any change in Cx36 phosphorylation. Significance of pairwise comparisons is noted above brackets identifying the pairs. (C) The phosphorylation state of OPL Cx36 in retinas collected every 6 hr during a L/D cycle. Both WT and A2a−/− retina displayed rhythmicity, peaking at ZT17.5 in the WT while peaking at ZT5.5 in the A2a−/−. Compared with the WT retina, the A2a−/− retina showed abnormally high phosphorylation at ZT5.5 and lower phosphorylation at ZT17.5. Significance of pairwise comparisons is noted above brackets identifying the pairs.
In keeping with the unusually high photoreceptor coupling, light-adapted A2a−/− retina displayed an unusually high level of Cx36 phosphorylation in the OPL (Fig. 8B). The phosphorylation level was not changed by application of the A2aR agonist CGS21680 (10 μM), the D4R antagonist L-745870 (3 μM), or the PKA activator Sp-8-CPT-cAMPS (10 μM), although phosphorylation was significantly reduced by 10 μM PKA inhibitor Rp-8-CPT-cAMPS (one-way ANOVA: P<0.0001; followed with Bonferroni’s multiple comparison test; n=5–13/condition). This suggests that PKA activity was nearly maximal and not effectively suppressed by D4R activation in the light-adapted state. Cx36 was significantly less phosphorylated in A2a−/− retina compared to WT retina following 6 hr dark adaptation in the daytime (Student’s t-test, P=0.026; n=5–6/condition), suggesting that PKA activity could not increase during dark adaptation. Finally, there was no difference in Cx36 phosphorylation level between light- and dark-adapted states at a comparable time in day in A2a−/− mice (Student’s t-test, p=0.33).
We also examined the Cx36 phosphorylation level in the OPL of WT and A2a−/− mouse retina sampled every 6 hr through a L/D cycle. The WT retina displayed a rhythmic pattern of Cx36 phosphorylation with a minimum prior to light onset and a maximum near midnight (ZT17.5; Fig. 8C). A2a−/− retina displayed a significantly disrupted rhythm with a small peak during the day (ZT5.5) and depressed phosphorylation near midnight (Fig 8C; two way ANOVA: time of the day: P=0.012, mouse strain: P<0.0001; n=3–7/condition).
These results show that the A2aR is essential for regulation of photoreceptor gap junction coupling and phosphorylation. The unusually high photoreceptor coupling and Cx36 phosphorylation in light-adapted retina and the lack of response to D4R antagonists suggest two possibilities: 1) the loss of the A2aR leads to a low dopamine release so that PKA activity is not suppressed by activation of the D4R, or 2) the loss of the A2aR may result in down regulation of the D4R signaling cascade in photoreceptors.
To examine the first hypothesis, we measured dopamine and DOPAC in the A2a−/− and WT mice throughout the course of a L/D cycle, as well as during light or dark adaptation in the daytime. A2a−/− mice showed a rhythm that was statistically indistinguishable from the WT mouse retina (Fig. 9A; Two way ANOVA: time of day, P=0.0023; mouse strain, P=0.37; n=3/condition). The dopamine release rhythm in WT mouse retina showed elevated DOPAC/DA in the daytime in the presence of light and reduced DOPAC/DA in darkness (Bonferroni’s tests: P<0.05, ZT23.5 vs ZT5.5, ZT23.5 vs ZT11.5; P<0.01, ZT5.5 vs ZT17.5, ZT11.5 vs ZT17.5). A2a−/− mouse retina showed a similar rhythmicity, however with only one pair of time points being significantly different (Bonferroni’s tests: P<0.05, ZT5.5 vs ZT17.5), suggesting that the dopamine release rhythm may be slightly dampened in the A2a−/− mouse. Among all conditions examined, there was no significant difference in the sum of dopamine and DOPAC (Two way ANOVA: time of the day, P=0.07; mouse strain, P=0.18), indicating normal dopamine synthesis in the A2a−/− mouse.
Fig. 9.

HPLC analysis of dopamine release in A2a−/− and WT mouse retina. (A) Both A2a−/− and WT mouse retina displayed rhythmic dopamine release, as measured by DOPAC/dopamine during a L/D cycle. Significance of pairwise comparisons is noted above brackets identifying the pairs. There was no statistically significant difference in rhythm of dopamine release between WT and A2a−/− mouse retina (see text). (B) During daytime, 6 hr dark adaptation significantly reduced dopamine release in both WT and A2a−/− mouse retina. No significant difference in dopamine release was detected in either condition between the WT and the A2a−/− mouse retina. (* P<0.05; ** P<0.01; ***P<0.001).
In the 6 hr dark adaptation paradigm, no difference in DOPAC/DA was observed between the WT and A2a−/− mouse retina in either daytime, light-adapted control or dark-adapted conditions (Fig. 9B; Two way ANOVA: lighting, P<0.0001; mouse strain, P=0.81; n=4–6/condition). Dark adaptation significantly reduced DOPAC/DA in WT and A2a−/− mouse retina (Student t-tests: WT, P<0.001; A2a−/−, P<0.01). In each of these conditions, the total amount of dopamine plus DOPAC remained constant in both animal types (Two way ANOVA: lighting, P=0.29; mouse strain, P=0.13). These results provide evidence that the A2aR had little or no influence on dopamine synthesis or the control of dopamine release. Since dopamine release in the A2a−/− mouse was not significantly different than in the WT while regulation of photoreceptor coupling and Cx36 phosphorylation were significantly different (Fig. 8), and in the A2a−/− mouse retina dopamine release was significantly decreased by dark adaptation compared to light adaptation while Cx36 phosphorylation remained indistinguishable (Figs. 9, 8), it is likely that dopamine release is not a major contributor to the effects of A2aR knockout on control of photoreceptor gap junction phosphorylation.
D4R and AC1 gene expression are down-regulated in the A2a−/− mouse retina
To test the hypothesis that the D4R signaling cascade may be compromised in the A2a−/−animals we examined transcript levels of D4R, A2aR, and AC1 by real time-rtPCR (Fig. 10). Both A2a−/− and WT mice showed rhythmicity in D4R gene expression (Fig. 10A; two way ANOVA: time of the day, P<0.0001; mouse strain, P=0.04; n=3–5/condition; followed with Bonferroni’s test). Consistent with the ISH data in figure 7 and previous reports with WT mouse and rat retina (Bai et al., 2008; Klitten et al., 2008; Jackson et al., 2011), D4R transcript was higher at ZT17.5 and ZT23.5 during darkness at night compared to the levels at ZT5.5 and ZT11.5 during the day (Fig. 10A; Bonferroni’s tests: P<0.001, ZT23.5 vs ZT5.5, ZT23.5 vs ZT11.5; ZT5.5 vs ZT17.5; P<0.01, ZT11.5 vs ZT17.5). The D4R gene expression in A2a−/−mouse retina peaked at ZT17.5 and remained low the rest of the day (Bonferroni’s test: P<0.01, ZT23.5 vs ZT17.5, ZT11.5 vs ZT17.5; P<0.001, ZT5.5 vs ZT17.5). There was a significant reduction of D4R gene expression at ZT23.5 in the A2a−/− mouse retina compared to the WT (Bonferroni’s test: P<0.001).
Fig. 10.

Gene expression of D4R, A2aR, and AC1 in the WT and A2a−/− mouse retina. (A) Real time rtPCR data of D4R mRNA displayed rhythmicity during a L/D cycle in both WT and A2a−/−mouse retinas. In WT retina it was high at ZT17.5 and ZT23.5 in the darkness during nighttime, and remained low under the daytime light. In the A2a−/− mouse retina the D4R mRNA peaked at ZT17.5 and remained low during rest of the day. Pairwise comparisons of relative D4R mRNA level showed a significant reduction in the A2a−/− mouse retina at ZT23.5. (B) Level of A2aR mRNA in WT mouse retina was rhythmic during a L/D cycle, peaking at ZT23.5 and remaining low at subsequent time points. A2aR transcript was negative in the A2a−/− mouse retina. (C) The AC1 mRNA in the WT mouse retina displayed its peak level at ZT23.5 and remained relatively low at other time points. No rhythmicity was observed in the A2a−/− mouse retina, and the AC1 transcript was significantly diminished at ZT23.5 compared to WT mouse retina. (D-G) In situ hybridization for D4R mRNA in the A2a−/− mouse retina. Scattered D4R signal (red) was detected in the photoreceptor and inner nuclear layers, and some ganglion cells. The expression of D4R seemed relatively high at ZT17.5 (G), while remaining low at other time points during the L/D cycle (D–F). DAPI (blue) nuclear counterstain suggested that the general morphology of the A2a−/− seemed normal.
Expression of A2aR was also rhythmic in the WT mouse retina. It peaked at ZT23.5 and declined at subsequent times throughout the light cycle (Fig. 10B; one way ANOVA: P=0.008; followed with Bonferroni’s test: P<0.05, ZT23.5 vs ZT5.5, ZT23.5 vs ZT11.5, ZT23.5 vs ZT17.5; n=4–5/condition). The A2aR mRNA remained undetectable in the A2a−/− animals at all time points (n=3/condition).
Expression of AC1 displayed a similar pattern to that observed for A2aR in WT, peaking at ZT23.5 and declining for the rest of the day (Fig. 10C; two way ANOVA: time of day, P=0.048; mouse, P=0.05; followed with Bonferroni’s test: WT, P<0.01, ZT23.5 vs ZT5.5, P<0.001, ZT23.5 vs ZT17.5; n=3–4/condition). In the A2a−/− mouse retina, AC1 mRNA was significantly down-regulated at ZT23.5 compared to the WT retina (Bonferroni’s tests, P<0.01), with the result that there was no significant fluctuation of AC1 mRNA through the day (Bonferroni’s tests, P=0.47).
We further examined the expression pattern of D4R in the A2a−/− retina using ISH. Weak D4R mRNA signal close to background was observed in the inner segments, ONL, and INL (Fig. 10D–G). Compared to the WT retina (Fig. 7A–D), signal at ZT23.5 was substantially reduced in the A2a−/− mouse retina (Fig. 10D). The reduction in D4R mRNA signal was more dramatic than that suggested by rtPCR, requiring different confocal parameters during imaging. The differences between ISH and rtPCR signals may result from different sensitivity of the probes, which were non-overlapping, or possibly to mRNA degradation. Nonetheless, these results support the hypothesis that D4R expression is compromised in the A2a−/− mouse. The down-regulated D4R and AC1 expression could explain the abnormal regulation of photoreceptor coupling and gap junction phosphorylation observed in the A2a−/− animals.
Discussion
Light adaptation in the retina involves a number of mechanisms that collectively allow the nearly 10 log unit daily variation in environmental lighting intensity to be captured and coded into useful information by the retinal output neurons, the retinal ganglion cells. No single adaptation mechanism works throughout the range of environmental light intensity; each operates in a certain range to effect the nearly linear increment threshold relationship described by Weber’s Law (ΔI/I = constant) (Dowling, 2012). Changes in photoreceptor coupling constitute one of these adaptation mechanisms. These changes are most apparent as changes in rod input into the cone pathway, or cone input into the rod pathway, via rod-cone gap junctions. This plasticity was first described in amphibian retina, in which cone input into the rod pathway increases with background illumination (Yang and Wu, 1989), a change controlled by D2-like dopamine receptors (Krizaj et al., 1998). In contrast, in teleost fish and mammalian retinas, rod input into the cone pathway is suppressed by light adaptation and D2-like dopamine receptor activation (Mangel et al., 1994; Wang and Mangel, 1996; Ribelayga et al., 2002; Ribelayga et al., 2008; Ribelayga and Mangel, 2010). This difference is likely related to the distinct physiological differences in retinas with large rods and a coarse cone matrix (amphibian and turtle retinas that have been studied) vs. those with fine rods optimized to transmit single photon signals (Berntson et al., 2004; Sampath and Rieke, 2004). In the latter, changes in rod-cone coupling appear to occur in a relatively narrow range of light intensities in the mesopic state, the transition zone from rod-mediated scotopic vision to cone-mediated photopic vision (Krizaj, 2000). In this range, the suppression of rod-cone coupling has the fairly obvious benefit of preventing saturated rod signals from invading the cone pathway. Cones are also extensively coupled under the same scotopic conditions (Li et al., 2009). The value of extensive cone-cone coupling in scotopic conditions is less apparent, and we have suggested that it serves the rod pathway as a mechanism to integrate and code rod responses to bright lights (Li et al., 2009) while also extending the dynamic range of rod output synapses (Attwell et al., 1987; Li et al., 2012). It should be noted that some electrophysiological studies of mammalian photoreceptors have failed to find any modulation of coupling (Schneeweis and Schnapf, 1999; Li and DeVries, 2004). It is not clear why this is the case, but could be a result of potent circadian control of photoreceptor coupling (Ribelayga et al., 2008) or strong Ca2+ buffering in whole-cell recording configurations (see discussion below).
Regulating rod-cone coupling within a narrow range of light adaptation requires a finely tuned synaptic mechanism. For mouse photoreceptors, we find that this mechanism depends on the phosphorylation and dephosphorylation of Cx36, as found previously for zebrafish photoreceptors (Li et al., 2009). Cx36 phosphorylation state correlated well with photoreceptor tracer coupling through a nearly 20-fold dynamic range, with no change in numbers of gap junctions (e.g. Figs. 3 and 4), a finding very similar to that in rabbit AII amacrine cells (Kothmann et al., 2009). In photoreceptors, phosphorylation depends on the activity of PKA which functions as the central point of regulatory control. In this study, we have found that PKA activity is coordinately controlled by opposing actions of dopamine D4R and adenosine A2aR. These receptors sample extracellular cues that are regulated in an opposing fashion with respect to light adaptation and circadian time, providing reinforcing stimuli that will steepen the change in AC activity with light or dark adaptation.
D4R and A2aR canonically couple via Gi and Gs, respectively, G-proteins that have opposing effects on AC (Olah and Stiles, 1992; Chio et al., 1994). The theoretically simplest mechanism to regulate coupling would involve competition between the two G proteins to activate or inhibit the cyclase. However, the AC that has been shown to couple to D4R in photoreceptors, AC1, is a Ca2+-calmodulin stimulated adenylyl cyclase that is quite sensitive to intracellular Ca2+ concentration but rather poorly activated by Gs (Sadana and Dessauer, 2009). Furthermore, mouse cone photoreceptor synaptic terminals have been found to undergo a large drop in intracellular Ca2+ in response to light adaptation (Johnson et al., 2007), a change that should reinforce the inhibitory effect of Gi on AC1 activity. Thus fluctuations of intracellular Ca2+ during light- and dark-adaptation may reinforce the effects G proteins to regulate coupling.
The signaling mechanism of A2aR and D4R may be complicated by the potential for direct physical interaction of the two. Adenosine A2a and dopamine D2 receptors (D2R) have been found to dimerize in a variety of expression systems and neurons (Kull et al., 1999; Canals et al., 2003; Fuxe et al., 2007). This results in allosteric modulation of receptor function. For example, activation of A2aR reduces the affinity of D2R for dopamine and other agonists, while not affecting binding of antagonists (Ferre et al., 1991; Dasgupta et al., 1996; Ferraro et al., 2012). Interactions of A2aR with D4R are largely unstudied, although peptides corresponding to the receptor interaction domains of A2aR and D4R do form stable complexes, as do A2aR and D2R peptides (Woods, 2010). Thus it is likely that these receptors interact to modify their signaling properties.
There are further interactions of A2aR and D4R at the level of gene expression. This is exemplified by the down regulation of D4R transcript and loss of D4R antagonist responsiveness in the A2a−/− mice. It was previously noted that knockout of the D4R resulted in reduction of AC1 expression (Jackson et al., 2009; Jackson et al., 2011). Indeed, AC1 expression was reduced at its daily peak time in A2a−/− mice in concert with the reduction of D4R expression at its peak time, suggesting that expression of several elements of this signaling pathway are co-regulated. A2aR activity has also been reported to regulate gene expression of other G-protein-coupled receptors such as adenosine A1R in chicken retina (Pereira et al., 2010) and D2R in PC-12 cells (Stonehouse et al., 2003). What mechanisms control these compensatory changes in gene expression remain to be elucidated.
Rhythmic expression of D4R and A2aR contributes to the regulation of coupling at the transitions between night and day. The minimum Cx36 phosphorylation state occurred at ZT23.5, in anticipation of daylight and following the nocturnal peak in D4R transcript level (Fig. 8C). Since C57Bl/6 mice lack substantial circadian control of dopamine secretion (Pozdeyev et al., 2008), this minimum is likely to be driven by buildup of D4R sensing dopamine released in the dark. In similar fashion, the increase in Cx36 phosphorylation before nightfall may result from removal of D4R receptors as a result of normal protein turnover, and consequent reduction in inhibitory signaling to AC. The slight phase lag in A2aR transcript levels may also result in a relative increase in A2aR abundance compared to D4R later in the day, priming the system to respond to the nocturnal increase in adenosine.
Electrical synapses are found throughout the central nervous system. It has become abundantly clear that plasticity is a fundamental property of electrical synapses composed of Cx36 and should be considered in all electrically connected circuits. This plasticity is driven by a number of complex signaling mechanisms that differ among cell types. Activity-dependent potentiation dependent on NMDA receptors has been observed in Mauthner cell and AII amacrine cell electrical synapses (Yang and Faber, 1991; Pereda and Faber, 1996; Kothmann et al., 2012). This mechanism depends on the activation of CamKII and phosphorylation of the connexin (Pereda et al., 1998; Kothmann et al., 2012). The close association of Cx36 with NMDA receptors has been observed ultrastructurally in a number of other locations in the CNS as well (Rash et al., 2004), suggesting that this is a widespread mechanism. An activity-dependent depression of electrical coupling has also been observed in Mauthner cells and in thalamic reticular neurons (TRN) and requires metabotropic glutamate receptors in the TRN (Yang and Faber, 1991; Landisman and Connors, 2005; Haas et al., 2011). The molecular mechanism that effects the electrical synaptic depression has not been explored, though it likely involves activation of a phosphatase to reduce gap junction phosphorylation.
Plasticity dependent on neurohormones, such as that in the photoreceptor, is also a widespread phenomenon. Dopamine modulation of electrical coupling has been documented in many systems, but its mechanisms and outputs can vary. While activation of D4R in the photoreceptor reduces coupling by suppressing PKA activity and reducing Cx36 phosphorylation, activation of D1R in AII amacrine cells reduces coupling by increasing PKA activity (Hampson et al., 1992; Mills and Massey, 1995). This depends on activation of protein phosphatase 2A and reduction in Cx36 phosphorylation (Kothmann et al., 2009). In contrast, dopamine increases electrical synaptic transmission at the Mauthner cell mixed synapse via D1R activation in a PKA-dependent manner (Pereda et al., 1992; Pereda et al., 1994). The latter system functions as do photoreceptors, with coupling and presumably Cx35 phosphorylation directly linked to PKA activity. In each of these neural systems, an integrated signaling pathway controls the phosphorylation state of the gap junctions so that electrical synaptic connectivity can be regulated by the local environment.
Acknowledgments
The work was supported by the National Institutes of Health Grants EY012857 (JO), EY018640 (CPR), EY018352 (SWW), HL070952 (MRB) and core grant EY010608. We thank Dr. Jaroslaw Aronowski and Dr. Xiurong Zhao for assistance with real time-PCR, Dr. Roger Janz for donating the antibody against syntaxin3, Mr. Jose G Molina and Ms. Ya-Ping Lin for help with animal maintenance and breeding, Dr. Stephen C. Massey for help with confocal microscopy, and Dr. Carmen W. Dessauer for helpful discussion on this study.
Footnotes
Conflicts of interest: none (all authors)
References
- Attwell D, Borges S, Wu SM, Wilson M. Signal clipping by the rod output synapse. Nature. 1987;328:522–524. doi: 10.1038/328522a0. [DOI] [PubMed] [Google Scholar]
- Bai L, Zimmer S, Rickes O, Rohleder N, Holthues H, Engel L, Leube R, Spessert R. Daily oscillation of gene expression in the retina is phase-advanced with respect to the pineal gland. Brain Res. 2008;1203:89–96. doi: 10.1016/j.brainres.2008.01.073. [DOI] [PubMed] [Google Scholar]
- Berntson A, Smith RG, Taylor WR. Transmission of single photon signals through a binary synapse in the mammalian retina. Vis Neurosci. 2004;21:693–702. doi: 10.1017/S0952523804215048. [DOI] [PubMed] [Google Scholar]
- Blazynski C. Discrete distributions of adenosine receptors in mammalian retina. J Neurochem. 1990;54:648–655. doi: 10.1111/j.1471-4159.1990.tb01920.x. [DOI] [PubMed] [Google Scholar]
- Blazynski C, Perez MT. Adenosine in vertebrate retina: localization, receptor characterization, and function. Cell Mol Neurobiol. 1991;11:463–484. doi: 10.1007/BF00734810. [DOI] [PubMed] [Google Scholar]
- Bloomfield SA, Volgyi B. The diverse functional roles and regulation of neuronal gap junctions in the retina. Nat Rev Neurosci. 2009;10:495–506. doi: 10.1038/nrn2636. [DOI] [PMC free article] [PubMed] [Google Scholar]
- Canals M, Marcellino D, Fanelli F, Ciruela F, de Benedetti P, Goldberg SR, Neve K, Fuxe K, Agnati LF, Woods AS, Ferre S, Lluis C, Bouvier M, Franco R. Adenosine A2A-dopamine D2 receptor-receptor heteromerization: qualitative and quantitative assessment by fluorescence and bioluminescence energy transfer. J Biol Chem. 2003;278:46741–46749. doi: 10.1074/jbc.M306451200. [DOI] [PubMed] [Google Scholar]
- Chen JF, Huang Z, Ma J, Zhu J, Moratalla R, Standaert D, Moskowitz MA, Fink JS, Schwarzschild MA. A(2A) adenosine receptor deficiency attenuates brain injury induced by transient focal ischemia in mice. J Neurosci. 1999;19:9192–9200. doi: 10.1523/JNEUROSCI.19-21-09192.1999. [DOI] [PMC free article] [PubMed] [Google Scholar]
- Chio CL, Drong RF, Riley DT, Gill GS, Slightom JL, Huff RM. D4 dopamine receptor-mediated signaling events determined in transfected Chinese hamster ovary cells. J Biol Chem. 1994;269:11813–11819. [PubMed] [Google Scholar]
- Choi HJ, Ribelayga CP, Mangel SC. Cut-loading: a useful tool for examining the extent of gap junction tracer coupling between retinal neurons. J Vis Exp. 2012 doi: 10.3791/3180. [DOI] [PMC free article] [PubMed] [Google Scholar]
- Cohen AI, Blazynski C. Dopamine and its agonists reduce a light-sensitive pool of cyclic AMP in mouse photoreceptors. Vis Neurosci. 1990;4:43–52. doi: 10.1017/s0952523800002753. [DOI] [PubMed] [Google Scholar]
- Cohen AI, Todd RD, Harmon S, O’Malley KL. Photoreceptors of mouse retinas possess D4 receptors coupled to adenylate cyclase. Proc Natl Acad Sci U S A. 1992;89:12093–12097. doi: 10.1073/pnas.89.24.12093. [DOI] [PMC free article] [PubMed] [Google Scholar]
- Dasgupta S, Ferre S, Kull B, Hedlund PB, Finnman UB, Ahlberg S, Arenas E, Fredholm BB, Fuxe K. Adenosine A2A receptors modulate the binding characteristics of dopamine D2 receptors in stably cotransfected fibroblast cells. Eur J Pharmacol. 1996;316:325–331. doi: 10.1016/s0014-2999(96)00665-6. [DOI] [PubMed] [Google Scholar]
- Deans MR, Volgyi B, Goodenough DA, Bloomfield SA, Paul DL. Connexin36 is essential for transmission of rod-mediated visual signals in the mammalian retina. Neuron. 2002;36:703–712. doi: 10.1016/s0896-6273(02)01046-2. [DOI] [PMC free article] [PubMed] [Google Scholar]
- Dearry A, Burnside B. Light-induced dopamine release from teleost retinas acts as a light-adaptive signal to the retinal pigment epithelium. J Neurochem. 1989;53:870–878. doi: 10.1111/j.1471-4159.1989.tb11785.x. [DOI] [PubMed] [Google Scholar]
- Degen J, Meier C, Van Der Giessen RS, Sohl G, Petrasch-Parwez E, Urschel S, Dermietzel R, Schilling K, De Zeeuw CI, Willecke K. Expression pattern of lacZ reporter gene representing connexin36 in transgenic mice. J Comp Neurol. 2004;473:511–525. doi: 10.1002/cne.20085. [DOI] [PubMed] [Google Scholar]
- DeVries SH, Baylor DA. An alternative pathway for signal flow from rod photoreceptors to ganglion cells in mammalian retina. Proc Natl Acad Sci U S A. 1995;92:10658–10662. doi: 10.1073/pnas.92.23.10658. [DOI] [PMC free article] [PubMed] [Google Scholar]
- Dowling JE. The Retina: An Approachable Part of the Brain. Cambridge, MA: Belknap of Harvard UP; 2012. Revised Edition Edition. [Google Scholar]
- Doyle SE, Grace MS, McIvor W, Menaker M. Circadian rhythms of dopamine in mouse retina: the role of melatonin. Vis Neurosci. 2002a;19:593–601. doi: 10.1017/s0952523802195058. [DOI] [PubMed] [Google Scholar]
- Doyle SE, McIvor WE, Menaker M. Circadian rhythmicity in dopamine content of mammalian retina: role of the photoreceptors. J Neurochem. 2002b;83:211–219. doi: 10.1046/j.1471-4159.2002.01149.x. [DOI] [PubMed] [Google Scholar]
- Dubocovich ML. Melatonin is a potent modulator of dopamine release in the retina. Nature. 1983;306:782–784. doi: 10.1038/306782a0. [DOI] [PubMed] [Google Scholar]
- Dubocovich ML, Takahashi JS. Use of 2-[125I]iodomelatonin to characterize melatonin binding sites in chicken retina. Proc Natl Acad Sci U S A. 1987;84:3916–3920. doi: 10.1073/pnas.84.11.3916. [DOI] [PMC free article] [PubMed] [Google Scholar]
- Feigenspan A, Janssen-Bienhold U, Hormuzdi S, Monyer H, Degen J, Sohl G, Willecke K, Ammermuller J, Weiler R. Expression of connexin36 in cone pedicles and OFF-cone bipolar cells of the mouse retina. J Neurosci. 2004;24:3325–3334. doi: 10.1523/JNEUROSCI.5598-03.2004. [DOI] [PMC free article] [PubMed] [Google Scholar]
- Ferraro L, Beggiato S, Tomasini MC, Fuxe K, Antonelli T, Tanganelli S. A(2A)/D(2) receptor heteromerization in a model of Parkinson’s disease. Focus on striatal aminoacidergic signaling. Brain Res. 2012 doi: 10.1016/j.brainres.2012.01.032. [DOI] [PubMed] [Google Scholar]
- Ferre S, von Euler G, Johansson B, Fredholm BB, Fuxe K. Stimulation of high-affinity adenosine A2 receptors decreases the affinity of dopamine D2 receptors in rat striatal membranes. Proc Natl Acad Sci U S A. 1991;88:7238–7241. doi: 10.1073/pnas.88.16.7238. [DOI] [PMC free article] [PubMed] [Google Scholar]
- Floran B, Floran L, Erlij D, Aceves J. Dopamine D4 receptors inhibit depolarization-induced [3H]GABA release in the rat subthalamic nucleus. Eur J Pharmacol. 2004;498:97–102. doi: 10.1016/j.ejphar.2004.07.078. [DOI] [PubMed] [Google Scholar]
- Friedman Z, Hackett SF, Linden J, Campochiaro PA. Human retinal pigment epithelial cells in culture possess A2-adenosine receptors. Brain Res. 1989;492:29–35. doi: 10.1016/0006-8993(89)90885-8. [DOI] [PubMed] [Google Scholar]
- Fujisawa H, Morioka H, Watanabe K, Nakamura H. A decay of gap junctions in association with cell differentiation of neural retina in chick embryonic development. J Cell Sci. 1976;22:585–596. doi: 10.1242/jcs.22.3.585. [DOI] [PubMed] [Google Scholar]
- Fuxe K, Ferre S, Genedani S, Franco R, Agnati LF. Adenosine receptor-dopamine receptor interactions in the basal ganglia and their relevance for brain function. Physiol Behav. 2007;92:210–217. doi: 10.1016/j.physbeh.2007.05.034. [DOI] [PubMed] [Google Scholar]
- Guldenagel M, Ammermuller J, Feigenspan A, Teubner B, Degen J, Sohl G, Willecke K, Weiler R. Visual transmission deficits in mice with targeted disruption of the gap junction gene connexin36. J Neurosci. 2001;21:6036–6044. doi: 10.1523/JNEUROSCI.21-16-06036.2001. [DOI] [PMC free article] [PubMed] [Google Scholar]
- Haas JS, Zavala B, Landisman CE. Activity-dependent long-term depression of electrical synapses. Science. 2011;334:389–393. doi: 10.1126/science.1207502. [DOI] [PMC free article] [PubMed] [Google Scholar]
- Hampson EC, Vaney DI, Weiler R. Dopaminergic modulation of gap junction permeability between amacrine cells in mammalian retina. Journal of Neuroscience. 1992;12:4911–4922. doi: 10.1523/JNEUROSCI.12-12-04911.1992. [DOI] [PMC free article] [PubMed] [Google Scholar]
- Hansen KA, Torborg CL, Elstrott J, Feller MB. Expression and function of the neuronal gap junction protein connexin 36 in developing mammalian retina. J Comp Neurol. 2005;493:309–320. doi: 10.1002/cne.20759. [DOI] [PubMed] [Google Scholar]
- Iuvone PM, Galli CL, Garrison-Gund CK, Neff NH. Light stimulates tyrosine hydroxylase activity and dopamine synthesis in retinal amacrine neurons. Science. 1978;202:901–902. doi: 10.1126/science.30997. [DOI] [PubMed] [Google Scholar]
- Jackson CR, Chaurasia SS, Zhou H, Haque R, Storm DR, Iuvone PM. Essential roles of dopamine D4 receptors and the type 1 adenylyl cyclase in photic control of cyclic AMP in photoreceptor cells. J Neurochem. 2009;109:148–157. doi: 10.1111/j.1471-4159.2009.05920.x. [DOI] [PMC free article] [PubMed] [Google Scholar]
- Jackson CR, Chaurasia SS, Hwang CK, Iuvone PM. Dopamine D receptor activation controls circadian timing of the adenylyl cyclase 1/cyclic AMP signaling system in mouse retina. Eur J Neurosci. 2011;34:57–64. doi: 10.1111/j.1460-9568.2011.07734.x. [DOI] [PMC free article] [PubMed] [Google Scholar]
- Jeon CJ, Strettoi E, Masland RH. The major cell populations of the mouse retina. J Neurosci. 1998;18:8936–8946. doi: 10.1523/JNEUROSCI.18-21-08936.1998. [DOI] [PMC free article] [PubMed] [Google Scholar]
- Johnson JE, Jr, Perkins GA, Giddabasappa A, Chaney S, Xiao W, White AD, Brown JM, Waggoner J, Ellisman MH, Fox DA. Spatiotemporal regulation of ATP and Ca2+ dynamics in vertebrate rod and cone ribbon synapses. Mol Vis. 2007;13:887–919. [PMC free article] [PubMed] [Google Scholar]
- Kihara AH, Paschon V, Cardoso CM, Higa GS, Castro LM, Hamassaki DE, Britto LR. Connexin36, an essential element in the rod pathway, is highly expressed in the essentially rodless retina of Gallus gallus. J Comp Neurol. 2009;512:651–663. doi: 10.1002/cne.21920. [DOI] [PubMed] [Google Scholar]
- Klitten LL, Rath MF, Coon SL, Kim JS, Klein DC, Moller M. Localization and regulation of dopamine receptor D4 expression in the adult and developing rat retina. Exp Eye Res. 2008;87:471–477. doi: 10.1016/j.exer.2008.08.004. [DOI] [PMC free article] [PubMed] [Google Scholar]
- Kothmann WW, Li X, Burr GS, O’Brien J. Connexin 35/36 is phosphorylated at regulatory sites in the retina. Vis Neurosci. 2007;24:363–375. doi: 10.1017/S095252380707037X. [DOI] [PMC free article] [PubMed] [Google Scholar]
- Kothmann WW, Massey SC, O’Brien J. Dopamine-stimulated dephosphorylation of connexin 36 mediates AII amacrine cell uncoupling. J Neurosci. 2009;29:14903–14911. doi: 10.1523/JNEUROSCI.3436-09.2009. [DOI] [PMC free article] [PubMed] [Google Scholar]
- Kothmann WW, Trexler EB, Whitaker CM, Li W, Massey SC, O’Brien J. Nonsynaptic NMDA Receptors Mediate Activity-Dependent Plasticity of Gap Junctional Coupling in the AII Amacrine Cell Network. J Neurosci. 2012;32:6747–6759. doi: 10.1523/JNEUROSCI.5087-11.2012. [DOI] [PMC free article] [PubMed] [Google Scholar]
- Kramer SG. Dopamine: A retinal neurotransmitter. I. Retinal uptake, storage, and light-stimulated release of H3-dopamine in vivo. Invest Ophthalmol. 1971;10:438–452. [PubMed] [Google Scholar]
- Krizaj D, Gabriel R, Owen WG, Witkovsky P. Dopamine D2 receptor-mediated modulation of rod-cone coupling in the Xenopus retina. J Comp Neurol. 1998;398:529–538. [PMC free article] [PubMed] [Google Scholar]
- Krizaj D. Mesopic state: cellular mechanisms involved in pre- and post-synaptic mixing of rod and cone signals. Microsc Res Tech. 2000;50:347–359. doi: 10.1002/1097-0029(20000901)50:5<347::AID-JEMT4>3.0.CO;2-D. [DOI] [PMC free article] [PubMed] [Google Scholar]
- Kull B, Ferre S, Arslan G, Svenningsson P, Fuxe K, Owman C, Fredholm BB. Reciprocal interactions between adenosine A2A and dopamine D2 receptors in Chinese hamster ovary cells co-transfected with the two receptors. Biochem Pharmacol. 1999;58:1035–1045. doi: 10.1016/s0006-2952(99)00184-7. [DOI] [PubMed] [Google Scholar]
- Kvanta A, Seregard S, Sejersen S, Kull B, Fredholm BB. Localization of adenosine receptor messenger RNAs in the rat eye. Exp Eye Res. 1997;65:595–602. doi: 10.1006/exer.1996.0352. [DOI] [PubMed] [Google Scholar]
- Lamb TD, Simon EJ. The relation between intercellular coupling and electrical noise in turtle photoreceptors. J Physiol (Lond) 1976;263:257–286. doi: 10.1113/jphysiol.1976.sp011631. [DOI] [PMC free article] [PubMed] [Google Scholar]
- Landisman CE, Connors BW. Long-term modulation of electrical synapses in the mammalian thalamus. Science. 2005;310:1809–1813. doi: 10.1126/science.1114655. [DOI] [PubMed] [Google Scholar]
- Lebedev DS, Byzov AL, Govardovskii VI. Photoreceptor coupling and boundary detection. Vision Res. 1998;38:3161–3169. doi: 10.1016/s0042-6989(98)00017-0. [DOI] [PubMed] [Google Scholar]
- Lee EJ, Han JW, Kim HJ, Kim IB, Lee MY, Oh SJ, Chung JW, Chun MH. The immunocytochemical localization of connexin 36 at rod and cone gap junctions in the guinea pig retina. Eur J Neurosci. 2003;18:2925–2934. doi: 10.1046/j.1460-9568.2003.03049.x. [DOI] [PubMed] [Google Scholar]
- Li H, Chuang AZ, O’Brien J. Photoreceptor coupling is controlled by connexin 35 phosphorylation in zebrafish retina. J Neurosci. 2009;29:15178–15186. doi: 10.1523/JNEUROSCI.3517-09.2009. [DOI] [PMC free article] [PubMed] [Google Scholar]
- Li H, O’Brien J. Regulation of gap junctional coupling in photoreceptors. In: Akutagawa E, Ozaki K, editors. Photoreceptors: Physiology, Types and Abnormalities. Hauppauge, NY: Nova Science; 2012. [Google Scholar]
- Li PH, Verweij J, Long JH, Schnapf JL. Gap-junctional coupling of mammalian rod photoreceptors and its effect on visual detection. J Neurosci. 2012;32:3552–3562. doi: 10.1523/JNEUROSCI.2144-11.2012. [DOI] [PMC free article] [PubMed] [Google Scholar]
- Li W, DeVries SH. Separate blue and green cone networks in the mammalian retina. Nat Neurosci. 2004;7:751–756. doi: 10.1038/nn1275. [DOI] [PubMed] [Google Scholar]
- Londos C, Cooper DM, Wolff J. Subclasses of external adenosine receptors. Proc Natl Acad Sci U S A. 1980;77:2551–2554. doi: 10.1073/pnas.77.5.2551. [DOI] [PMC free article] [PubMed] [Google Scholar]
- Mangel SC, Baldridge WH, Weiler R, Dowling JE. Threshold and chromatic sensitivity changes in fish cone horizontal cells following prolonged darkness. Brain Res. 1994;659:55–61. doi: 10.1016/0006-8993(94)90862-1. [DOI] [PubMed] [Google Scholar]
- Mills SL, Massey SC. Differential properties of two gap junctional pathways made by AII amacrine cells. Nature. 1995;377:734–737. doi: 10.1038/377734a0. [DOI] [PubMed] [Google Scholar]
- Mills SL, Massey SC. The kinetics of tracer movement through homologous gap junctions in the rabbit retina. Vis Neurosci. 1998;15:765–777. doi: 10.1017/s0952523898154159. [DOI] [PMC free article] [PubMed] [Google Scholar]
- Nelson R. Cat cones have rod input: a comparison of the response properties of cones and horizontal cell bodies in the retina of the cat. J Comp Neurol. 1977;172:109–135. doi: 10.1002/cne.901720106. [DOI] [PubMed] [Google Scholar]
- Nguyen-Legros J, Chanut E, Versaux-Botteri C, Simon A, Trouvin JH. Dopamine inhibits melatonin synthesis in photoreceptor cells through a D2-like receptor subtype in the rat retina: biochemical and histochemical evidence. J Neurochem. 1996;67:2514–2520. doi: 10.1046/j.1471-4159.1996.67062514.x. [DOI] [PubMed] [Google Scholar]
- Nguyen-Legros J, Versaux-Botteri C, Vernier P. Dopamine receptor localization in the mammalian retina. Mol Neurobiol. 1999;19:181–204. doi: 10.1007/BF02821713. [DOI] [PubMed] [Google Scholar]
- Nir I, Haque R, Iuvone PM. Diurnal metabolism of dopamine in the mouse retina. Brain Res. 2000;870:118–125. doi: 10.1016/s0006-8993(00)02409-4. [DOI] [PubMed] [Google Scholar]
- Nowak JZ, Kazula A, Golembiowska K. Melatonin increases serotonin N-acetyltransferase activity and decreases dopamine synthesis in light-exposed chick retina: in vivo evidence supporting melatonin-dopamine interaction in retina. J Neurochem. 1992;59:1499–1505. doi: 10.1111/j.1471-4159.1992.tb08466.x. [DOI] [PubMed] [Google Scholar]
- O’Brien J, Nguyen HB, Mills SL. Cone photoreceptors in bass retina use two connexins to mediate electrical coupling. J Neurosci. 2004;24:5632–5642. doi: 10.1523/JNEUROSCI.1248-04.2004. [DOI] [PMC free article] [PubMed] [Google Scholar]
- O’Brien JJ, Chen X, Macleish PR, O’Brien J, Massey SC. Photoreceptor coupling mediated by connexin36 in the primate retina. J Neurosci. 2012;32:4675–4687. doi: 10.1523/JNEUROSCI.4749-11.2012. [DOI] [PMC free article] [PubMed] [Google Scholar]
- Olah ME, Stiles GL. Adenosine receptors. Annu Rev Physiol. 1992;54:211–225. doi: 10.1146/annurev.ph.54.030192.001235. [DOI] [PubMed] [Google Scholar]
- Ouyang X, Winbow VM, Patel LS, Burr GS, Mitchell CK, O’Brien J. Protein kinase A mediates regulation of gap junctions containing connexin35 through a complex pathway. Brain Res Mol Brain Res. 2005;135:1–11. doi: 10.1016/j.molbrainres.2004.10.045. [DOI] [PMC free article] [PubMed] [Google Scholar]
- Patel LS, Mitchell CK, Dubinsky WP, O’Brien J. Regulation of gap junction coupling through the neuronal connexin Cx35 by nitric oxide and cGMP. Cell Commun Adhes. 2006;13:41–54. doi: 10.1080/15419060600631474. [DOI] [PMC free article] [PubMed] [Google Scholar]
- Pereda A, Triller A, Korn H, Faber DS. Dopamine enhances both electrotonic coupling and chemical excitatory postsynaptic potentials at mixed synapses. Proc Natl Acad Sci U S A. 1992;89:12088–12092. doi: 10.1073/pnas.89.24.12088. [DOI] [PMC free article] [PubMed] [Google Scholar]
- Pereda AE, Nairn AC, Wolszon LR, Faber DS. Postsynaptic modulation of synaptic efficacy at mixed synapses on the Mauthner cell. J Neurosci. 1994;14:3704–3712. doi: 10.1523/JNEUROSCI.14-06-03704.1994. [DOI] [PMC free article] [PubMed] [Google Scholar]
- Pereda AE, Faber DS. Activity-dependent short-term enhancement of intercellular coupling. J Neurosci. 1996;16:983–992. doi: 10.1523/JNEUROSCI.16-03-00983.1996. [DOI] [PMC free article] [PubMed] [Google Scholar]
- Pereda AE, Bell TD, Chang BH, Czernik AJ, Nairn AC, Soderling TR, Faber DS. Ca2+/calmodulin-dependent kinase II mediates simultaneous enhancement of gap-junctional conductance and glutamatergic transmission. Proc Natl Acad Sci U S A. 1998;95:13272–13277. doi: 10.1073/pnas.95.22.13272. [DOI] [PMC free article] [PubMed] [Google Scholar]
- Pereira MR, Hang VR, Vardiero E, de Mello FG, Paes-de-Carvalho R. Modulation of A1 adenosine receptor expression by cell aggregation and long-term activation of A2a receptors in cultures of avian retinal cells: involvement of the cyclic AMP/PKA pathway. J Neurochem. 2010;113:661–673. doi: 10.1111/j.1471-4159.2010.06641.x. [DOI] [PubMed] [Google Scholar]
- Pierce ME, Besharse JC. Circadian regulation of retinomotor movements. I. Interaction of melatonin and dopamine in the control of cone length. J Gen Physiol. 1985;86:671–689. doi: 10.1085/jgp.86.5.671. [DOI] [PMC free article] [PubMed] [Google Scholar]
- Pozdeyev N, Tosini G, Li L, Ali F, Rozov S, Lee RH, Iuvone PM. Dopamine modulates diurnal and circadian rhythms of protein phosphorylation in photoreceptor cells of mouse retina. Eur J Neurosci. 2008;27:2691–2700. doi: 10.1111/j.1460-9568.2008.06224.x. [DOI] [PMC free article] [PubMed] [Google Scholar]
- Rash JE, Pereda A, Kamasawa N, Furman CS, Yasumura T, Davidson KG, Dudek FE, Olson C, Li X, Nagy JI. High-resolution proteomic mapping in the vertebrate central nervous system: Close proximity of connexin35 to NMDA glutamate receptor clusters and co-localization of connexin36 with immunoreactivity for zonula occludens protein-1 (ZO-1) J Neurocytol. 2004;33:131–151. doi: 10.1023/B:NEUR.0000029653.34094.0b. [DOI] [PMC free article] [PubMed] [Google Scholar]
- Rey HL, Burnside B. Adenosine stimulates cone photoreceptor myoid elongation via an adenosine A2-like receptor. J Neurochem. 1999;72:2345–2355. doi: 10.1046/j.1471-4159.1999.0722345.x. [DOI] [PubMed] [Google Scholar]
- Ribelayga C, Wang Y, Mangel SC. Dopamine mediates circadian clock regulation of rod and cone input to fish retinal horizontal cells. J Physiol. 2002;544:801–816. doi: 10.1113/jphysiol.2002.023671. [DOI] [PMC free article] [PubMed] [Google Scholar]
- Ribelayga C, Wang Y, Mangel SC. A circadian clock in the fish retina regulates dopamine release via activation of melatonin receptors. J Physiol. 2004;554:467–482. doi: 10.1113/jphysiol.2003.053710. [DOI] [PMC free article] [PubMed] [Google Scholar]
- Ribelayga C, Mangel SC. A circadian clock and light/dark adaptation differentially regulate adenosine in the mammalian retina. J Neurosci. 2005;25:215–222. doi: 10.1523/JNEUROSCI.3138-04.2005. [DOI] [PMC free article] [PubMed] [Google Scholar]
- Ribelayga C, Cao Y, Mangel SC. The circadian clock in the retina controls rod-cone coupling. Neuron. 2008;59:790–801. doi: 10.1016/j.neuron.2008.07.017. [DOI] [PMC free article] [PubMed] [Google Scholar]
- Ribelayga C, Mangel SC. Identification of a circadian clock-controlled neural pathway in the rabbit retina. PLoS One. 2010;5:e11020. doi: 10.1371/journal.pone.0011020. [DOI] [PMC free article] [PubMed] [Google Scholar]
- Roseboom PH, Namboodiri MA, Zimonjic DB, Popescu NC, Rodriguez IR, Gastel JA, Klein DC. Natural melatonin ‘knockdown’ in C57BL/6J mice: rare mechanism truncates serotonin N-acetyltransferase. Brain Res Mol Brain Res. 1998;63:189–197. doi: 10.1016/s0169-328x(98)00273-3. [DOI] [PubMed] [Google Scholar]
- Sadana R, Dessauer CW. Physiological roles for G protein-regulated adenylyl cyclase isoforms: insights from knockout and overexpression studies. Neurosignals. 2009;17:5–22. doi: 10.1159/000166277. [DOI] [PMC free article] [PubMed] [Google Scholar]
- Sampath AP, Rieke F. Selective transmission of single photon responses by saturation at the rod-to-rod bipolar synapse. Neuron. 2004;41:431–443. doi: 10.1016/s0896-6273(04)00005-4. [DOI] [PubMed] [Google Scholar]
- Schmittgen TD, Livak KJ. Analyzing real-time PCR data by the comparative C(T) method. Nat Protoc. 2008;3:1101–1108. doi: 10.1038/nprot.2008.73. [DOI] [PubMed] [Google Scholar]
- Schneeweis DM, Schnapf JL. Photovoltage of rods and cones in the macaque retina. Science. 1995;268:1053–1056. doi: 10.1126/science.7754386. [DOI] [PubMed] [Google Scholar]
- Schneeweis DM, Schnapf JL. The photovoltage of macaque cone photoreceptors: adaptation, noise, and kinetics. J Neurosci. 1999;19:1203–1216. doi: 10.1523/JNEUROSCI.19-04-01203.1999. [DOI] [PMC free article] [PubMed] [Google Scholar]
- Stella SL, Jr, Bryson EJ, Thoreson WB. A2 adenosine receptors inhibit calcium influx through L-type calcium channels in rod photoreceptors of the salamander retina. J Neurophysiol. 2002;87:351–360. doi: 10.1152/jn.00010.2001. [DOI] [PubMed] [Google Scholar]
- Stella SL, Jr, Bryson EJ, Cadetti L, Thoreson WB. Endogenous Adenosine Reduces Glutamatergic Output From Rods Through Activation of A2-Like Adenosine Receptors. J Neurophysiol. 2003;90:165–174. doi: 10.1152/jn.00671.2002. [DOI] [PubMed] [Google Scholar]
- Stonehouse AH, Adachi M, Walcott EC, Jones FS. Caffeine regulates neuronal expression of the dopamine 2 receptor gene. Mol Pharmacol. 2003;64:1463–1473. doi: 10.1124/mol.64.6.1463. [DOI] [PubMed] [Google Scholar]
- Storch KF, Paz C, Signorovitch J, Raviola E, Pawlyk B, Li T, Weitz CJ. Intrinsic circadian clock of the mammalian retina: importance for retinal processing of visual information. Cell. 2007;130:730–741. doi: 10.1016/j.cell.2007.06.045. [DOI] [PMC free article] [PubMed] [Google Scholar]
- Streitová D, Sefc L, Savvulidi F, Pospísil M, Holá J, Hofer M. Adenosine A(1), A(2a), A(2b), and A(3) receptors in hematopoiesis. 1. Expression of receptor mRNA in four mouse hematopoietic precursor cells. Physiol Res. 2010;59:133–137. doi: 10.33549/physiolres.931723. [DOI] [PubMed] [Google Scholar]
- Trumpler J, Dedek K, Schubert T, de Sevilla Muller LP, Seeliger M, Humphries P, Biel M, Weiler R. Rod and cone contributions to horizontal cell light responses in the mouse retina. J Neurosci. 2008;28:6818–6825. doi: 10.1523/JNEUROSCI.1564-08.2008. [DOI] [PMC free article] [PubMed] [Google Scholar]
- Tsukamoto Y, Morigiwa K, Ueda M, Sterling P. Microcircuits for night vision in mouse retina. J Neurosci. 2001;21:8616–8623. doi: 10.1523/JNEUROSCI.21-21-08616.2001. [DOI] [PMC free article] [PubMed] [Google Scholar]
- Volgyi B, Deans MR, Paul DL, Bloomfield SA. Convergence and segregation of the multiple rod pathways in mammalian retina. J Neurosci. 2004;24:11182–11192. doi: 10.1523/JNEUROSCI.3096-04.2004. [DOI] [PMC free article] [PubMed] [Google Scholar]
- Wang Y, Mangel SC. A circadian clock regulates rod and cone input to fish retinal cone horizontal cells. Proc Natl Acad Sci U S A. 1996;93:4655–4660. doi: 10.1073/pnas.93.10.4655. [DOI] [PMC free article] [PubMed] [Google Scholar]
- Weiler R, Kohler K, Kirsch M, Wagner HJ. Glutamate and dopamine modulate synaptic plasticity in horizontal cell dendrites of fish retina. Neurosci Lett. 1988;87:205–209. doi: 10.1016/0304-3940(88)90449-1. [DOI] [PubMed] [Google Scholar]
- Witkovsky P. Dopamine and retinal function. Doc Ophthalmol. 2004;108:17–40. doi: 10.1023/b:doop.0000019487.88486.0a. [DOI] [PubMed] [Google Scholar]
- Woods AS. The dopamine D(4) receptor, the ultimate disordered protein. J Recept Signal Transduct Res. 2010;30:331–336. doi: 10.3109/10799893.2010.513842. [DOI] [PMC free article] [PubMed] [Google Scholar]
- Yang XD, Faber DS. Initial synaptic efficacy influences induction and expression of long-term changes in transmission. Proc Natl Acad Sci U S A. 1991;88:4299–4303. doi: 10.1073/pnas.88.10.4299. [DOI] [PMC free article] [PubMed] [Google Scholar]
- Yang XL, Wu SM. Modulation of rod-cone coupling by light. Science. 1989;244:352–354. doi: 10.1126/science.2711185. [DOI] [PubMed] [Google Scholar]
- Zhang J, Wu SM. Connexin35/36 gap junction proteins are expressed in photoreceptors of the tiger salamander retina. J Comp Neurol. 2004;470:1–12. doi: 10.1002/cne.10967. [DOI] [PubMed] [Google Scholar]
- Zimmerman AL, Rose B. Permeability properties of cell-to-cell channels: kinetics of fluorescent tracer diffusion through a cell junction. J Membr Biol. 1985;84:269–283. doi: 10.1007/BF01871390. [DOI] [PubMed] [Google Scholar]