Abstract
Ribbon synapses release neurotransmitter continuously at high rates, and the ribbons tether a large pool of synaptic vesicles. To determine if the tethered vesicles are actually released, we tracked vesicles labeled with FM4-64 dye in mouse retinal bipolar cell terminals whose ribbons had been labeled with a fluorescent peptide. We photobleached vesicles in regions with ribbons and without them and then followed recovery of fluorescence as bleached regions were repopulated by labeled vesicles. In the resting terminal, fluorescence recovered by ~50% in non-ribbon regions, but by only ~20% at ribbons. Thus, at rest, vesicles associated with ribbons cannot exchange freely with cytoplasmic vesicles. Depolarization stimulated vesicle turnover at ribbons as bleached, immobile vesicles were released by exocytosis and were then replaced by fluorescent vesicles from the cytoplasm, producing a further increase in fluorescence specifically at the ribbon location. We conclude that vesicles immobilized at synaptic ribbons participate in the readily releasable pool that is tapped rapidly during depolarization.
Keywords: retina, ribbon synapse, retinal bipolar cell, synaptic transmission, exocytosis, neurotransmitter release
Introduction
The ribbon synapse releases neurotransmitter continuously and at high rates (Sterling and Matthews, 2005; Moser et al., 2006). The ribbon itself is necessary for this process, as evidenced by severe disruption of neurotransmission at ribbon synapses in mutant animals whose ribbons do not localize properly at the active zone (Allwardt et al., 2001; Dick et al., 2003; Van Epps et al., 2004). The static snapshot provided by electron microscopy shows the ribbon surrounded by a halo of vesicles that are tethered by fine filaments to its surface, and at retinal ribbon synapses, these tethered vesicles may constitute the readily releasable pool that supports prolonged release (von Gersdorff et al., 1996; Mennerick and Matthews, 1996; Thoreson et al., 2004; however, see Midorikawa et al., 2007 for a contrary view). Despite their presumed importance in ribbon synapse function, however, the dynamics of these ribbon-associated vesicles have not been examined directly in living cells, leaving some basic questions unanswered. First, are vesicles associated with the ribbon truly immobile, or are they in dynamic equilibrium with vesicles in the cytoplasm? Second, can vesicles on the ribbon be released during depolarization? Third, once released, are ribbon-associated vesicles replenished from mobile cytoplasmic pools, or by local recycling of recently endocytosed vesicles? Fourth, to what extent is depolarization-triggered vesicle turnover spatially localized to the vicinity of the ribbon?
To approach these questions regarding vesicle dynamics, we labeled vesicles and ribbons in mouse retinal bipolar neurons with different fluorescent tags, whose specificity was confirmed by electron microscopy (EM). Then we photobleached vesicles in a subregion of a terminal and measured their mobility at two locations: near the ribbon and away from it. We found that the immobile fraction of vesicles is larger at ribbons than at non-ribbon locations. Using EM, we observed photobleached vesicles attached to ribbons, which suggests that vesicles tethered to ribbons account for the excess immobile vesicles at ribbons compared to cytoplasmic locations. In the resting terminal, vesicles associated with the ribbon do not readily exchange with those in the cytoplasm, on a time scale of minutes. However, in the stimulated terminal, as vesicles leave the ribbon to fuse with the plasma membrane, they appear to be replenished with vesicles from the cytoplasm. Finally, turnover of photobleached vesicles triggered by depolarization occurred within an approximately diffraction-limited region around the ribbon location, which suggests that depolarization mobilized previously immobile vesicles that are very near, and probably attached to, synaptic ribbons. These experiments establish that vesicles are in fact immobilized near ribbons, from which they are released rapidly during depolarization.
Materials and Methods
Bipolar cell isolation and vesicle loading with FM dye
We used adult male mice of strain C57BL/6J. A mouse was killed by CO2 inhalation, and both eyes were removed and hemisected. Neural retinas were detached and cut into 6 pieces. To isolate bipolar cells, retinal pieces were dissociated by mechanical trituration after papain digestion for 30 min at RT (Heidelberger and Matthews, 1992). Cells were then plated on flame-polished glass coverslips in a solution containing 135 mM NaCl, 5 mM KCl, 1 mM MgCl2, 2.5 mM CaCl2, and 10 mM Hepes and briefly washed with the same solution prior to recording. To load vesicles, cells were either bathed in a solution of high K+ containing FM4-64 (15 μM) or FM1-43 (5 μM) for 90 s, or repetitively stimulated with focal application of the same solution for 5 minutes with a 50% duty cycle. All experiments were done at room temperature. Electron microscopy after photoconversion of FM1-43 showed that the former protocol labeled ~5% of the total number of synaptic vesicles, and the latter protocol labeled ~20%.
Electrophysiology
Isolated bipolar cells were identified as rod bipolar cells based on their distinctive morphology (Ghosh et al., 2004). Cells were voltage clamped using an EPC-9 amplifier controlled by Pulse software. Bipolar cell bodies were patch clamped, held at –60 mV, and dialyzed with a Cs-gluconate solution (120 mM Cs-gluconate, 10 mM TEA-Cl, 20 mM Hepes, 0.2 mM NMDG–EGTA, 3 mM MgCl2, 2 mM Na2ATP, 0.5 mM GTP) containing 35 μM fluorescent peptide (fluor-EQTVPVDLSVARPR-COOH; kind gift of Dr. David Zenisek, Yale Medical School) with affinity for the CtBP2 domain of the synaptic ribbon protein RIBEYE (Zenisek et al., 2004). Glutathione (2 mM) was added to the solution to reduce photodamage (Meister and Anderson, 1983). The extracellular bath solution contained 135 mM NaCl, 5 mM KCl, 1 mM MgCl2, 2.5 mM CaCl2, and 10 mM Hepes. The pH of the solution was adjusted to ~7.4 with NaOH.
Confocal Imaging
All fluorescence ima ges were acquired using an Olympus FV-300 laser-scanning confocal microscope and Fluoview software (Olympus America, Center Valley, PA). The fluorescein-tagged peptide and FM4-64 labeling were sequentially scanned to reduce channel cross-talk. Coordination with the patch-clamp amplifier and programming of sequences of image acquisitions were accomplished using Tiempo software extension to Fluoview. Subsequent analysis and processing of images was carried out in Fluoview, Image J, or Igor Pro software.
Electron microscopy
Cells were plated on Aclar instead of glass coverslips and were stimulated with high K+ in the presence of FM1-43 (5 μM). They were then washed and lightly fixed in 4% paraformaldehyde and 0.2% glutaraldehyde in 0.13 M PB at room temperature for 25 min, washed, and bathed in DAB. Photoconversion was achieved by illumination with high intensity blue light through a 50x objective for 20 min. The cells were washed once again in a 0.13 M PB solution and fixed with 2.5% paraformaldehyde and 2.5% glutaraldehyde for 30 min at RT, then processed for EM as previously described (Paillart et al., 2003). Uranyl acetate and lead, typically used to stain the sections, were omitted to preserve the contrast between labeled and unlabeled vesicles (Brumback et al., 2004).
Fluorescence recovery after photobleaching
Regions of interest (ROI) for measuring recovery after photobleaching were ~1.0 μm × 0.5 μm in size and contained at least one synaptic ribbon and a cytoplasmic region of similar FM4-64 fluorescence intensity. The standard FRAP protocol involved 5 pre-bleach images at 2 s intervals (5% laser intensity, 543 nm), 5 bleach iterations (100% intensity, 543 nm, 0 interval, ~1 s), and 30–40 post-bleach images at 2 s intervals (5% intensity, 543 nm). Recovery curves at the ribbon and at a non-ribbon location were acquired simultaneously by measuring average fluorescence intensity in two 0.5-μm-square boxes, one centered on the ribbon and one displaced 0.5 μm to the side. Curves were fit with a single exponential equation to determine the time constant and asymptotic level of recovery. Fluorescence during recovery was also corrected for the bleaching produced by the 5%-intensity acquisition illumination, which was measured in control experiments using the same imaging protocol but omitting the intense bleaching stimulus.
Estimation of mobile fraction
We estimated the mobile fraction of vesicles (m) from the asymptotic fluorescence intensity (f∞; normalized by dividing by pre-bleach intensity) achieved at steady state after recovery from bleaching of FM4-64-labeled synaptic vesicles in a subregion of the synaptic terminal. If all vesicles in the terminal were mobile, the dim vesicles from the bleached region and the bright vesicles from the unbleached region would distribute equally throughout the terminal, and at each location bleached and unbleached labeled vesicles would be present in proportions reflecting their overall proportions in the terminal as a whole. Thus, the normalized fluorescence in the bleached region would equilibrate at ftot, where ftot is the proportion of the total initial fluorescence of the entire terminal remaining after bleaching the targeted subregion. In our experiments, ftot was typically 0.6 to 0.75, which sets the maximum normalized intensity that would be achieved in the bleached region after full recovery, if m = 1.0. Conversely, if m were 0 (no mobile vesicles), there would be no recovery in the bleached region, and the normalized intensity in the bleached region would remain at its value immediately after the bleach, fb. In our experiments, fb ≈ 0.2. Therefore, m is given by the fractional recovery of normalized fluorescence between these two extremes:
In the figures presenting FRAP data, fluorescence recovery is plotted directly in units of m, ranging from 0 to 1.0, which was calculated for each terminal based on the individual values for ftot, f∞, and fb.
Stimulation-induced changes in FM4-64 fluorescence
A portion of a synaptic terminal containing one or more ribbons was photobleached as described for FRAP measurements and allowed to recover fully. Series of 2–5 images were then taken before and after a 500-ms depolarization from –60 mV to 0 mV to trigger exocytosis. To measure the fluorescence change at ribbon locations in bleached and unbleached subregions, a 0.5 μm × 0.5 μm box was centered on each ribbon, defined by fluorescent peptide labeling, and the average FM4-64 fluorescence in the box before and after stimulation was measured using ImageJ software. Fluorescence at non-ribbon locations was measured similarly by moving the box to 2–4 surrounding positions that lacked punctate fluorescence of RIBEYE-binding peptide in any z-axis confocal plane. The difference between pre- and post-stimulus fluorescence was then expressed as a percentage of the pre-stimulus fluorescence. The spatial profile of the fluorescence change at ribbons was measured using the Plot Profile function of ImageJ within a 0.5 μm × 1.5 μm box centered on each ribbon, with the long axis parallel to the plasma membrane.
Results
Visualizing synaptic ribbons
To label synaptic ribbons in the living neuron we used a fluorescent peptide that binds to RIBEYE (Zenisek et al., 2004), the main structural component of synaptic ribbons (Schmitz et al., 2000). Because previous experiments with the RIBEYE-binding peptide (Rpep) showed it to label ribbons in goldfish, we needed to determine if it also binds to ribbons in our experimental system, the mouse. Figure 1 shows that it does. When the peptide was introduced into a mouse bipolar cell via a whole-cell patch pipette placed on the cell body, it diffused down the axon and bound to synaptic ribbons, which were then seen as fluorescent spots in the terminals (Fig. 1). On average, there were 8 ± 0.6 fluorescent spots per terminal swelling (mean ± s.e.m.; N = 19) and 1–5 terminal swellings per cell (e.g., Figs. 1B–D). In addition, fluorescent spots were sometimes observed in the distal part of the axon.
Figure 1. Fluorescent peptide with affinity for RIBEYE labels synaptic ribbons in live mouse bipolar cells.
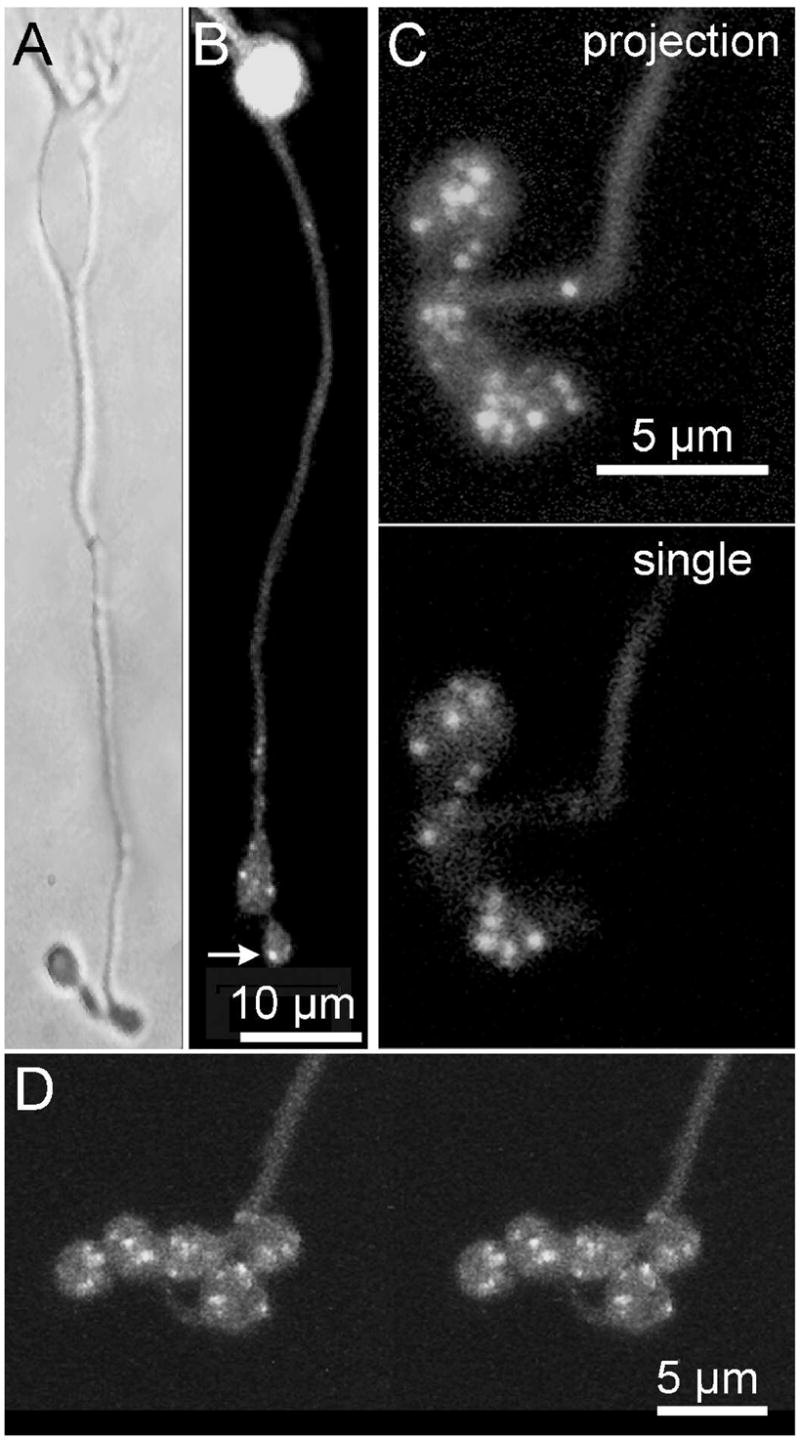
A Bright-field image of an isolated mouse bipolar cell B. Confocal image of a different cell loaded with RIBEYE -binding peptide (Rpep). Bright spots (e.g., arrow) mark the positions of synaptic ribbons. C. Rpep-labeled bipolar cell terminal at higher magnification. Top panel shows a projection of a series of z-axis confocal optical sections through the depth of the terminal. Spots varied in size, suggesting that they might represent clusters with multiple ribbons. Bottom panel shows a single optical section of the same cell. D. A stereo pair showing a 3D reconstruction from optical sections through a bipolar cell synaptic terminal loaded with Rpep.
To confirm that the bright spots observed by confocal microscopy were in fact synaptic ribbons, we acquired confocal images of cells loaded with fluorescein-conjugated Rpep, then fixed and processed them for electron microscopy (EM). Figure 2 shows individual examples of the correspondence between spots and ribbons. In Fig. 2A,B, a single thin section (~90 nm) for EM fortuitously caught three synaptic ribbons (black arrows, Fig. 2B) that were visible in the same locations in a single confocal optical section from the living cell (white arrows, Fig. 2A), despite the much greater thickness of the confocal section (~1.6 μm; Zenisek et al., 2004). Note that the more diffuse accumulations of Rpep fluorescence visible in Fig. 2A correspond to other ribbons located out of the focal plane (see full Z-axis projection in the inset). Figure 2C shows two additional fluorescent Rpep spots in the distal axon, with corresponding ribbons observed in EM below. In two cells, we obtained serial thin sections through the terminals and counted 11 and 23 unique ribbons visible by EM. In the same cells, the identical number of unique Rpep spots (11 and 23) were counted in 3D reconstructions from series of Z-axis optical sections through the terminals. Therefore, we conclude that in living mouse bipolar terminals (as in goldfish; Zenisek et al., 2004), Rpep fluorescent puncta accurately indicate the location and number of synaptic ribbons.
Figure 2. RIBEYE-binding peptide fluorescent puncta mark the location of synaptic ribbons in living mouse bipolar cells.
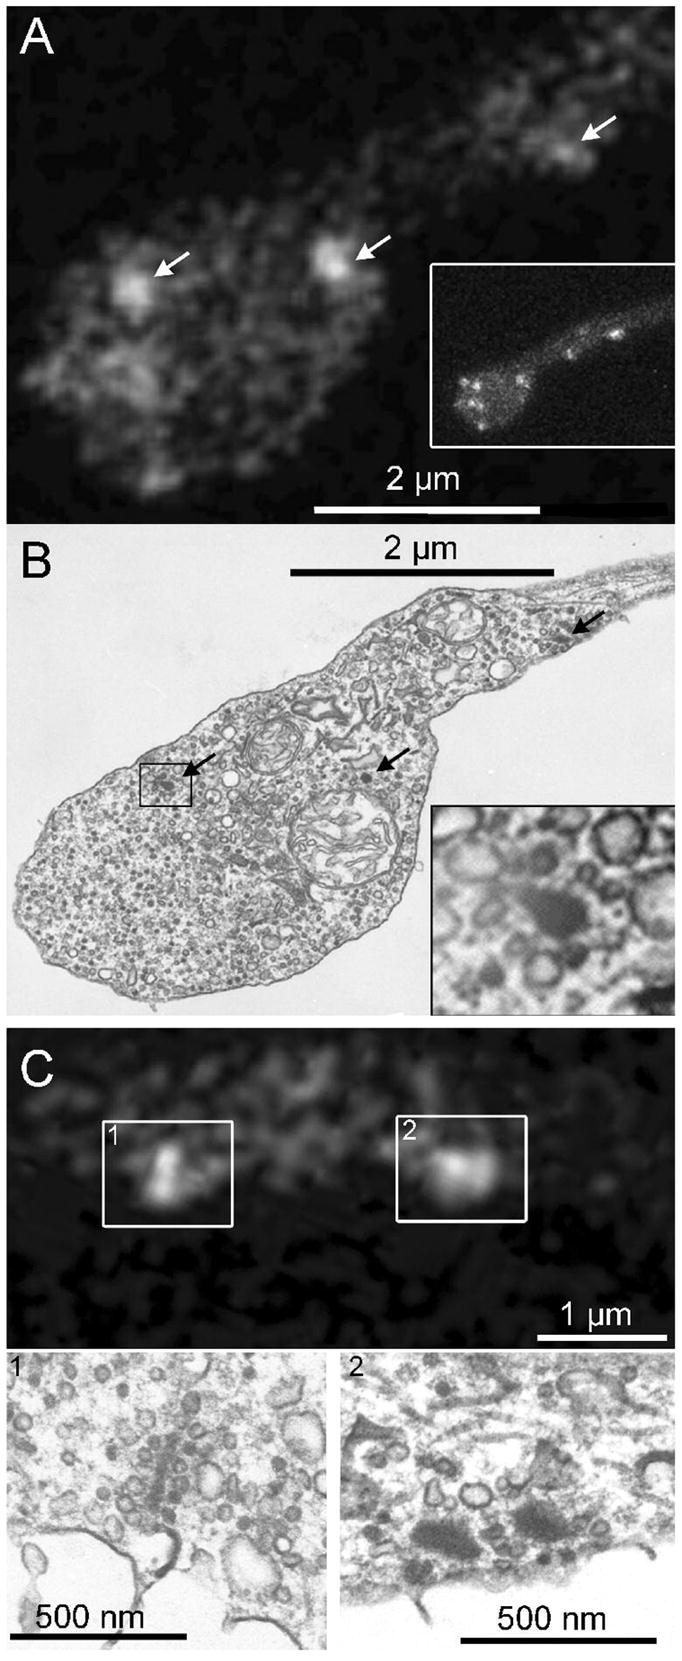
A. Ribbon positions (arrows) in a live synaptic terminal revealed by fluorescein-Rpep labeling in a single confocal optical section. The inset shows a projection of a series of z-axis sections through the entire terminal to illustrate the positions of ribbons in other focal planes, which contribute some of the dimmer Rpep fluorescence in the single-section in the main panel. B. The same terminal fixed and photographed by EM. Arrows indicate ribbons, and the inset shows a magnified view of the ribbon marked by a rectangle. C. Top panel shows a single confocal section with labeled synaptic ribbons. Box 1 contains a labeled synaptic ribbon that appears elongated. The synaptic ribbon in the corresponding EM section, C1, also has an elongated, plate-like structure. Box 2 in the top panel contains a broad fluorescent spot, perhaps indicating the presence of two side-by-side synaptic ribbons. Indeed, the corresponding EM image (C2) shows two adjacent synaptic ribbons.
The number of ribbons counted by EM (maximum 23) in our experiments is lower than the 43 ribbons reported by Tsukamoto et al. (2001) in a mouse rod bipolar cell reconstructed by EM from serial sections of intact retina. In living cells, the maximum number of Rpep puncta we observed in a single cell (46) is similar to the EM count from intact retina (43), but ~20 puncta is more typical (e.g., Fig. 1C,D). Because the number of puncta per individual terminal bouton revealed by Rpep fluorescence (8 ± 0.6) is comparable to the number of ribbons per terminal swelling shown by Tsukamoto et al. (see Figure 2 of Tsukamoto et al., 2001), the reduced number of ribbons or Rpep spots in our cells likely arises from the typical loss of one or more distal terminal boutons during cell isolation.
Visualizing synaptic vesicles
To label synaptic vesicles we stimulated bipolar cells in a solution of high K+ plus the styryl dye, FM4-64 or FM1-43, as described in Methods. After loading, cells were washed in dye-free external solution containing Advasep-7 to destain the plasma membrane. Dye internalized during depolarization was restricted to the synaptic terminals and distal axon, and cells incubated in FM dyes without high K+ did not accumulate dye, consistent with its activity-dependent uptake into recycling synaptic vesicles. However, it is possible that FM dye also accumulates in other endosomal structures. For instance, fused vesicle membrane in goldfish bipolar cell terminals is retrieved in large endosomes, which only later produce recycled synaptic vesicles (Paillart et al., 2003; Holt et al., 2003), and these large endosomes also take up and release FM dye upon stimulation (Coggins et al., 2007).
To identify the structures labeled by FM dye in our experiments, we photoconverted FM1-43 and examined the terminals by electron microscopy (Richards et al., 2000; Harata et al., 2001; Rea et al., 2004). The electron-dense photo-product marked structures that had accumulated FM1-43 during depolarization, and it was readily apparent that the dark structures resemble the surrounding unlabeled synaptic vesicles (Figs. 3A,B). Consistent with this visual impression, the size distributions of the labeled structures and unlabeled vesicles within a terminal were indistinguishable; mean diameter for both populations equaled ~33 nm (Figs. 3C,D). This confirms that FM dye fluorescence tracks the dynamics of synaptic vesicles and not large endosomes.
Figure 3. FM dyes taken up during synaptic activity label synaptic vesicles in mouse bipolar terminals.
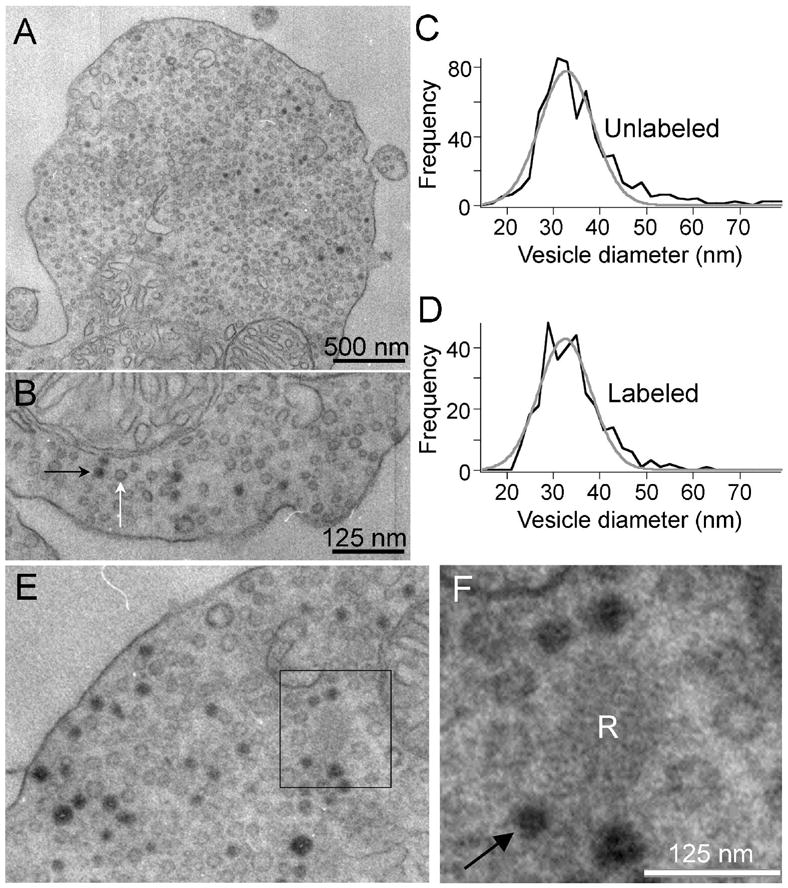
Depolarization-induced uptake of FM1-43 is visible in EM after photoconversion in synaptic vesicles. A. EM image of a synaptic terminal after photoconversion. Some vesicles are filled with dark reaction product. B. Higher magnification view of the same cell as A. Black and white arrows indicate labeled and unlabeled vesicles, respectively. Sections were not stained with uranyl acetate or lead. C, D. Size distributions of unlabeled and labeled vesicles were identical, with a mean diameter of 33 nm. E, F. Labeled vesicles recycle back to the synaptic ribbon. EM images of a mouse bipolar cell terminal after photoconversion of FM1-43. Black box identifies a synaptic ribbon shown at higher magnification in F. Arrow in F points to one of the four labeled vesicles immediately adjacent to the ribbon. Sections were not stained with uranyl acetate or lead, and so ribbons are pale and filaments that tether vesicles to the ribbon surface are not readily visible.
Because our goal was to measure the mobility of vesicles associated with the synaptic ribbon, we also examined whether recycled vesicles labeled with FM dye would re-enter the pool of vesicles attached to the ribbons. To preserve the contrast between labeled and unlabeled vesicles, lead and uranyl acetate staining of the ultrathin sections was omitted, leaving the ribbons pale but still distinguishable (Figs. 3E,F). Ribbons tethered mixtures of labeled and unlabeled vesicles, indicating that in these experiments labeled synaptic vesicles did indeed recycle back to the ribbons (Fig. 3F).
To examine explicitly the spatial relation between FM-labeled vesicles and synaptic ribbons, we introduced fluorescein-conjugated Rpep into cells via a whole-cell patch pipette (Fig. 4A) after loading cells with red-fluorescing FM4-64. Synaptic ribbons (green) and internalized FM4-64 (red) co-localized extensively in terminal boutons (Fig. 4B). Therefore, uptake of FM4-64 is associated with depolarization-triggered release and recycling of vesicles in the vicinity of ribbon-type active zones. The spatial profiles of ribbon and vesicle fluorescence, acquired approximately 10 min after activity-dependent loading with FM4-64, show that labeled vesicles remain closely associated with ribbons (Fig. 4B). Therefore, dye-labeled vesicles are spatially stable and do not readily diffuse along the terminal process. To determine directly the stability of synaptic ribbons and their associated FM-labeled vesicles, we imaged dual-labeled synapses at 10 min and again at 15 min after activity-dependent uptake of FM4-64 (Figs. 4C,D). Clusters of FM4-64 fluorescence (arrows, Fig. 4C) coincided with Rpep-labeled ribbons and remained at the same position over at least 5 min (compare red and black traces in Fig. 4D). Therefore, FM-labeled vesicles associate stably with synaptic ribbons on a time scale of several minutes.
Figure 4. FM dyes taken up during synaptic activity concentrate near ribbons in live mouse bipolar terminals.
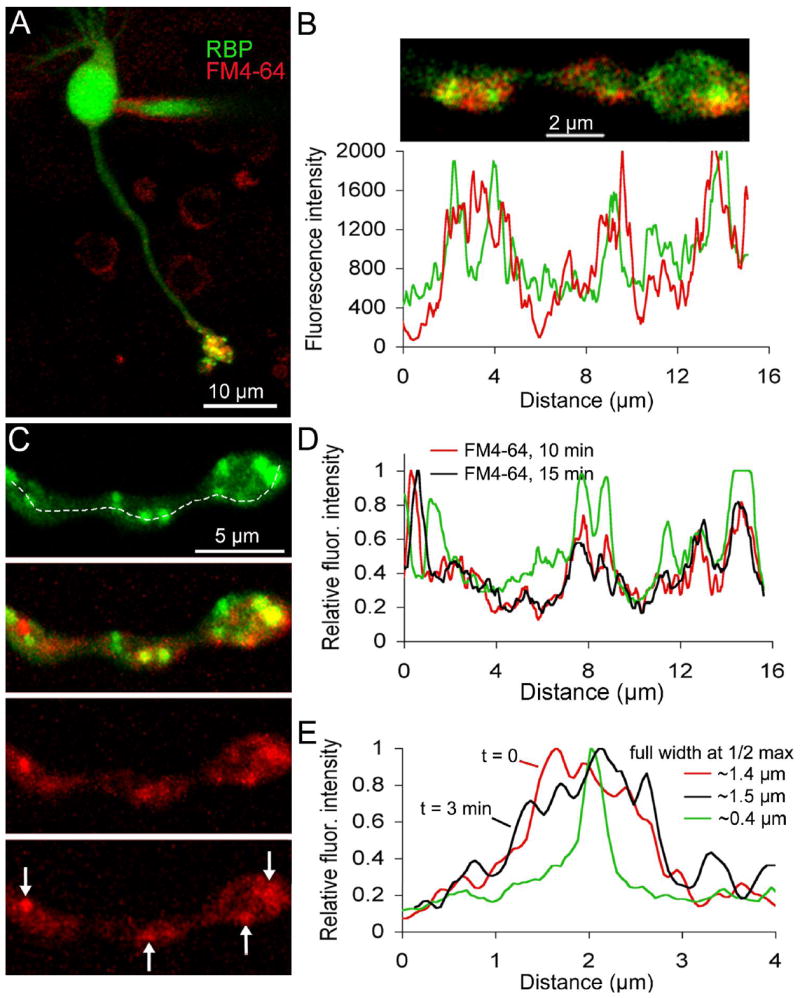
A Confocal image of a live bipolar cell loaded with FM4-64 (red) and RIBEYE-binding peptide (Rpep; green). The peptide was dialyzed via a whole-cell patch pipette visible on the cell body. The image is the z-axis projection of a series of confocal optical sections through the entire cell. B. Single confocal optical section of a live bipolar cell terminal loaded with FM4-64 (red) and Rpep (green). Cell was loaded with FM4-64 approximately 10 min before peptide dialysis and imaging. The graph below the image is the fluorescence intensity profile of the bottom half of the synaptic terminal (Fluoview software). The red trace indicates the fluorescence intensity of FM4-64 and the green trace indicates the fluorescence intensity of the peptide. C. Confocal image of a live bipolar cell axon and terminal loaded with FM4-64 (red) and Rpep (green). The top panel shows peptide labeling and the panel just below it shows the overlay of the peptide and FM4-64 fluorescence. The bottom two panels show FM4-64 labeling approximately 10 minutes and 15 minutes after activity-dependent loading with FM4-64, respectively. Arrows in the bottom panel indicate clusters of FM4-64 labeling that remained stable over time. D. Fluorescence intensity profile along the dashed line shown in panel C for Rpep (green trace) and FM4-64 10 minutes (red trace) and 15 minutes (black trace) after activity-dependent loading. E. Fluorescence intensity profile through a single synaptic ribbon (green) and FM4-64 labeling taken at t = 0 min (red) and t = 3 min (black). The full width at half maximum of the ribbon fluorescence is ~400 nm. The full width at half maximum of the cluster of FM4-64 fluorescence at 0 and 3 minutes is ~1.4 and 1.5 μm, respectively.
We showed in Fig. 3 that some of the labeled vesicles are closely associated with synaptic ribbons, which accounts in part for the stability of FM4-64 fluorescence at ribbon locations. However, the stable clusters of FM fluorescence were sometimes broader than the ribbon itself (e.g., Fig. 4E). The spatial extent of the ribbon (green trace, Fig. 4E) resembled the point spread function of the microscope, measured using 27-nm fluorescent beads (see supplemental material, Fig. S1), which is consistent with the submicroscopic size of ribbons in bipolar neurons. On the other hand, the full-width at half maximum of the ribbon-associated FM4-64 fluorescence was wider by ~1 μm than that of the ribbon fluorescence itself, which suggests that additional vesicles, beyond those attached to the ribbon, are stabilized in the vicinity of ribbons. In the next section, we describe experiments to examine the mobility of vesicles at both ribbon and non-ribbon locations within this stable cluster of ribbon-associated FM4-64 fluorescence.
The ribbon immobilizes vesicles
To measure the overall mobility of vesicles in the cytoplasm, we used Fluorescence Recovery After Photobleaching (FRAP). When fluorescent vesicles are bleached by focal application of intense excitation light, the bleached vesicles exchange with unbleached vesicles from surrounding regions, partially restoring the lost fluorescence (e.g., Rea et al 2004; Gaffield et al., 2006). The degree of recovery estimates the fraction of vesicles free to move, and the rate of recovery estimates vesicle mobility. We bleached a strip across part of a terminal bulb by scanning the subregion 5 times in 1 s with the exciting laser stepped up from its usual 5% of maximum intensity to 100%; then we tracked recovery of fluorescence in the bleached strip by re-imaging every 2 s. Recovery followed an exponential time course with a time constant, τ = 16.6 s in the example shown in Fig. 5A,B. This is similar to the FRAP time constant of ~20 s in similar experiments on goldfish bipolar cell synaptic terminals (Holt et al., 2004), but somewhat slower than in cone photoreceptor terminals (biexponential time constants ~2 s and 9 s; Rea et al., 2004). Taking into account the amount of total fluorescence lost during the bleach (see Methods), we estimated that ~50% of cytoplasmic vesicles were mobile. By comparison, the mobile fraction in cone photoreceptor synaptic terminals is estimated to be 87% (Rea et al., 2004), whereas it is ~0% at the neuromuscular junction (Henkel et al., 1996).
Figure 5. Vesicle mobility is reduced at synaptic ribbons.
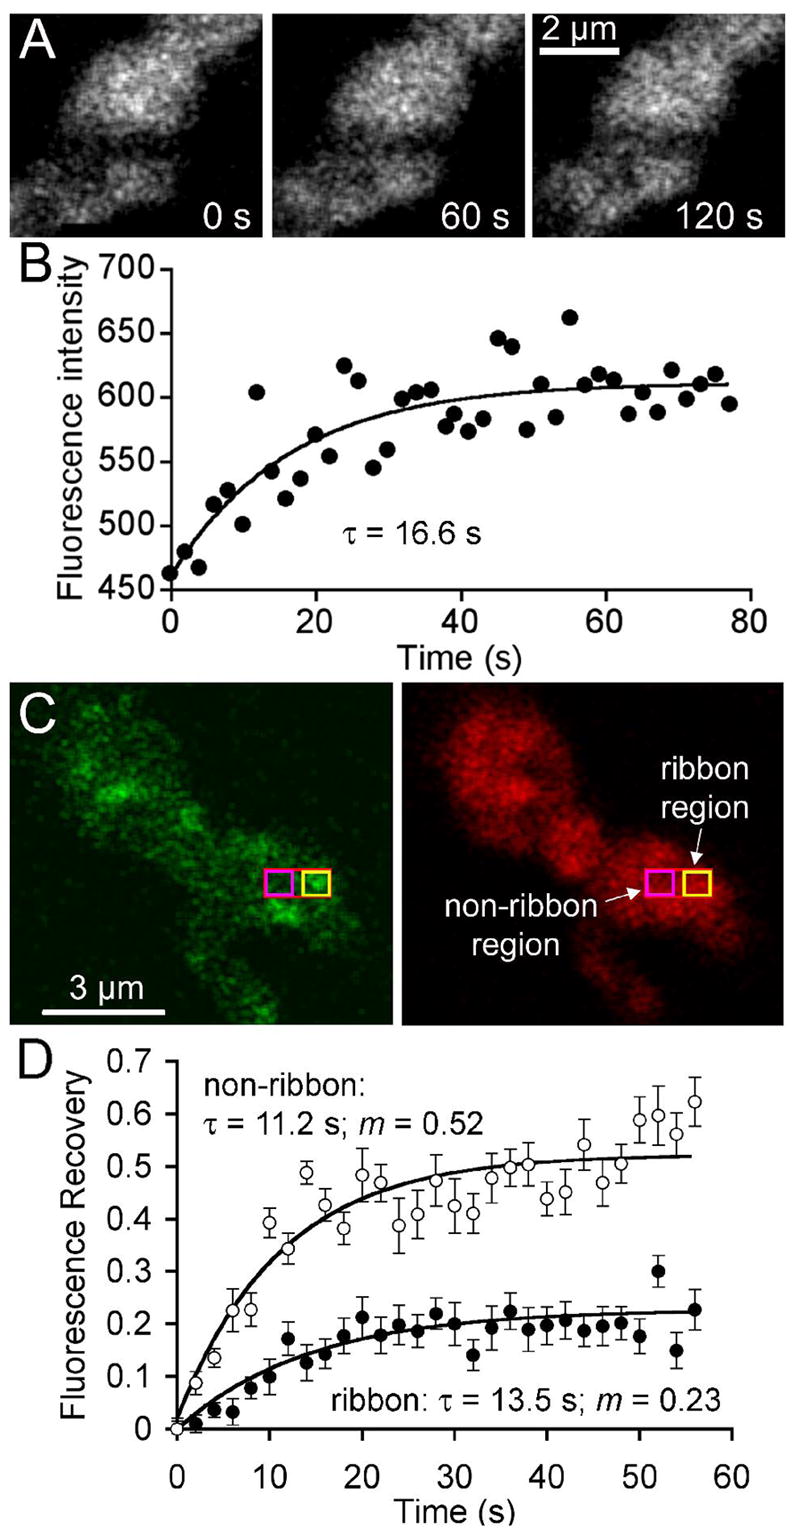
A Confocal images of a terminal loaded with FM4-64 immediately after bleaching a stripe nominally 0.5 μm wide across the terminal (left), and after asymptotic recovery at 60 s (middle) and 120 s (right) after the bleach. B. Time course of fluorescence recovery in the bleached region shown in A. Curve indicates the best-fitting exponential rise. C. Terminal loaded with RIBEYE-binding peptide (left) and FM4-64 (right). Red rectangle indicates the photobleached region; yellow box shows where fluorescence was measured at a ribbon site; magenta box shows where fluorescence was measured at a non-ribbon site. D. Average fluorescence recovery at ribbon and non-ribbon sites in 12 cells. The mobile fraction of vesicles in the measured area surrounding the ribbon (filled circles) was 0.23, and the recovery τ was 13.5 s. The mobile fraction at non-ribbon regions (open circles) was 0.52 and the recovery τ was 11.2 s. On average, the initial bleach reduced fluorescence in the entire terminal by 38%. The recovery curves have been normalized accordingly (see Materials and Methods).
Next, we compared vesicle mobility in areas with a ribbon and without one, using cells loaded with FM4-64 and dialyzed with fluorescein-Rpep. A square region of interest (ROI), 0.5 μm × 0.5 μm, was centered on a well-isolated ribbon using Rpep fluorescence as a guide (Fig 5C; yellow square), and second ROI of the same size was placed in a neighboring ribbon-free zone (Fig. 5C; magenta square), with ~0.75 μm separating the centers of the two ROIs. The subregion containing the ROIs was then selectively bleached, and confocal scans were acquired every 2 s to simultaneously track the rate and fractional recovery in both the ribbon and non-ribbon ROI (Fig. 5D). Bleaching reduced fluorescence at both sites to ~20% of the pre-bleach intensity (12 cells), quenching the terminals’ total fluorescence by an average of 38%. At the non-ribbon ROI, recovery was exponential (τ =11.2 s), and the estimated mobile fraction, m, was 0.52 (Fig. 5D). Both measures from the small ROI are similar to the estimates of cytoplasmic vesicle mobility obtained when fluorescence in the entire bleached region was measured (Fig. 5B). At the ribbon ROI, recovery was similar in form (exponential) and time course (τ = 13.5 s), but the estimated mobile fraction was significantly smaller (0.23; Fig. 5D).
The similar time constants at ribbon and non-ribbon ROIs suggest that both represent the mobility of free vesicles unattached to cytoskeletal elements. Because the effective voxel depth (~1.6 μm; Zenisek et al., 2004) is substantially larger than a ribbon, some of the fluorescence at a ribbon location comes from vesicles not associated with it, and we assume that this component has the same mobility as vesicles at non-ribbon sites. However, at ribbon sites, immobile vesicles represent ~80% of the vesicles vs. ~50% at non-ribbon sites. A simple interpretation is that the extra immobile vesicles at ribbon sites include those attached to the ribbon, like the labeled vesicles shown previously in Fig. 3F. Fluorescence recovery at ribbons remained steady at the asymptotic photobleached state for >60 s, indicating that the ribbon-associated vesicles do not exchange with the cytoplasmic pool on a time scale of minutes, consistent with the stability of FM4-64 fluorescence demonstrated in Fig. 4.
Stimulus-dependent changes in vesicle fluorescence at ribbons
What effect would depolarization have on the additional immobilized vesicles at photobleached ribbons (Fig. 5D)? If the releasable pool contains the ribbon-tethered vesicles (Mennerick and Matthews, 1996; von Gersdorff et al., 1996; Zhou et al., 2006), a depolarization sufficient to deplete the pool should cause bleached vesicles immobilized at ribbons to be replaced with some unbleached vesicles that entered the bleached zone during prior FRAP. This would stably increase fluorescence at sites with ribbons. To test this, we first needed to determine if ribbons remain competent for exocytosis after photobleaching of FM4-64 in a subregion of a terminal bouton.
We bleached a ROI encompassing a ribbon and allowed asymptotic recovery. Then, after measuring fluorescence at ribbon sites in the bleached and unbleached region (see Methods), we briefly depolarized the cell under voltage-clamp to trigger exocytosis and re-measured the fluorescence. Figure 6A shows that bleaching did not affect the calcium current elicited by a 500-ms depolarization from –60 mV to 0 mV. Therefore, there was no detectable photodamage of the calcium channels that drive exocytosis. To monitor exocytosis, we measured the percentage of FM dye unloading triggered by the second of two post-bleach depolarizations at bleached and unbleached ribbons in the same terminal. In six cells, bleaching did not significantly affect the degree of stimulus-induced unloading in the bleached zone (bleached: −9.5 ± 2%, N = 11 ribbons; unbleached: −11.6 ± 1.7%, N = 19 ribbons; p=0.61, two-tailed Mann-Whitney U test). This suggests that bleaching FM4-64 to the degree used in our mobility measurements did not compromise the ability of ribbons in the bleached subregion to generate vesicle turnover in response to depolarization.
Figure 6. Effects of stimulation on FM4-64 fluorescence at synaptic ribbons.
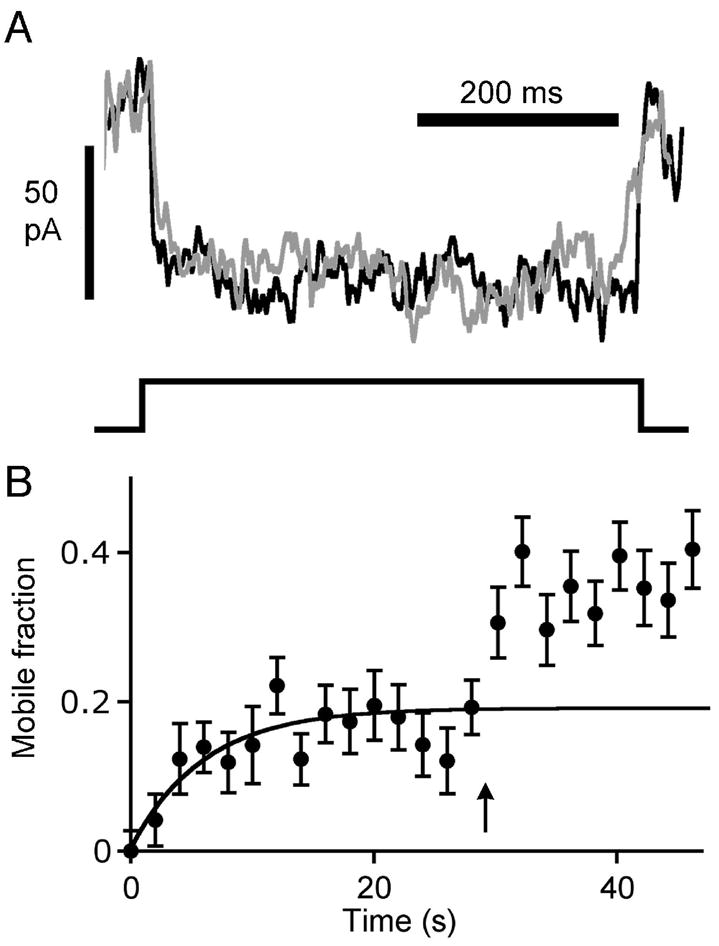
A Voltage-dependent calcium current recorded from dissociated retinal bipolar cells before and after photobleaching. The gray trace is the average calcium current evoked by a 500-ms depolarizing pulse from –60 mV to 0 mV, recorded from five cells prior to photobleaching. The black trace is the average calcium current, recorded from the same five cells, after photobleaching FM4-64 fluorescence in a ribbon-containing region of the cell to ~ 25% of its initial intensity. Calcium current amplitude ranged from 40 pA to 100 pA, and bleaching had no effect on the current. B. Recovery of fluorescence at ribbon locations after photobleaching at t = 0 (N = 8). The arrow marks timing of a 500-ms depolarizing pulse, which elicited a stable increase in mobile fraction from 0.19 to 0.36.
Armed with this information about the fusion competence of bleached ribbons, we returned to the question of the effect of the first post-bleach depolarization on the excess immobile vesicles at ribbon sites. A portion of a terminal loaded with FM4-64 was photobleached, and after asymptotic recovery, 2–5 confocal images were acquired for measurement of FM4-64 fluorescence within 0.25-μm2 ROIs centered on ribbons in both the bleached and unbleached subregions of the terminal. Then, we triggered release by a 500-ms depolarization and several seconds later measured the fluorescence at the same locations in 2–5 images. In the unbleached part of the terminal, FM-dye fluorescence at ribbons decreased after the stimulus (percent change = −5.4 ± 1.4%; mean ± s.e.m.; N = 18), consistent with stimulation-dependent destaining (Betz and Bewick, 1993). However, in the bleached region, fluorescence at ribbons increased following the first post-bleach stimulus (percent change = +4.7 ± 2.7%; mean ± s.e.m.; N = 14). This difference between the fluorescence changes at bleached vs. unbleached ribbons was statistically significant (p<0.001; two-tailed Mann-Whitney U test). We interpret the stimulation-induced increase in fluorescence at bleached ribbons to indicate that bleached vesicles immobilized at ribbons were released during exocytosis and replaced by new vesicles that included fully fluorescent labeled vesicles.
To examine the stimulation-induced change in mobile fraction at ribbons, we measured the full FRAP time course at ribbons, in the same manner shown previously in Fig. 5C,D. In this set of experiments, summarized in Fig. 6B, the mobile fraction at the ribbon sites was 0.19, which is similar to the value estimated previously (see Fig. 5D). Subsequently, a 500-ms depolarizing stimulus (arrow, Fig. 6B) was given to trigger exocytosis, which caused a stable increase of normalized fluorescence intensity (from 0.19 to 0.36, on average) in the region containing the ribbon. Apparently, the stimulus released bleached vesicles immobilized at the ribbon — which were then replenished by a mix of labeled, unlabeled, and bleached vesicles from surrounding regions. This indicates that releasable vesicles are immobilized by the ribbon until depolarization triggers exocytosis.
Where with respect to ribbons does the stimulation-induced increase in FM4-64 fluorescence occur? To answer this, we examined the spatial profile of the increase in fluorescence triggered by the initial depolarization following asymptotic recovery from photobleaching. Figure 7A–B shows an example of the spatial pattern in an individual experiment in which 20 confocal images of FM4-64 fluorescence before stimulation were averaged (Fig. 7A) and compared with the average of 20 images at the same location after a 500-ms depolarization (Fig. 7B). After stimulation, fluorescence increased most strongly at the ribbon position (upper left corner). Figure 7C presents the average spatial profile of the fluorescence change triggered by stimulation at 8 photobleached ribbons, measured parallel to the plasma membrane. The stimulus-induced increase in FM4-64 fluorescence coincided with the ribbon location, which was marked by Rpep-fluorescein fluorescence (dashed line, Fig. 7C). This spatial pattern suggests that the bleached vesicles released upon depolarization reside at the same location as the ribbon, with both fluorescence profiles being limited by the point-spread function of the microscope (see Fig. S1). A simple interpretation is that the vesicles released by stimulation are the labeled vesicles observed to be attached to ribbons in EM (Fig. 3).
Figure 7. Bleached ribbon-associated vesicles are replaced after a depolarizing pulse.
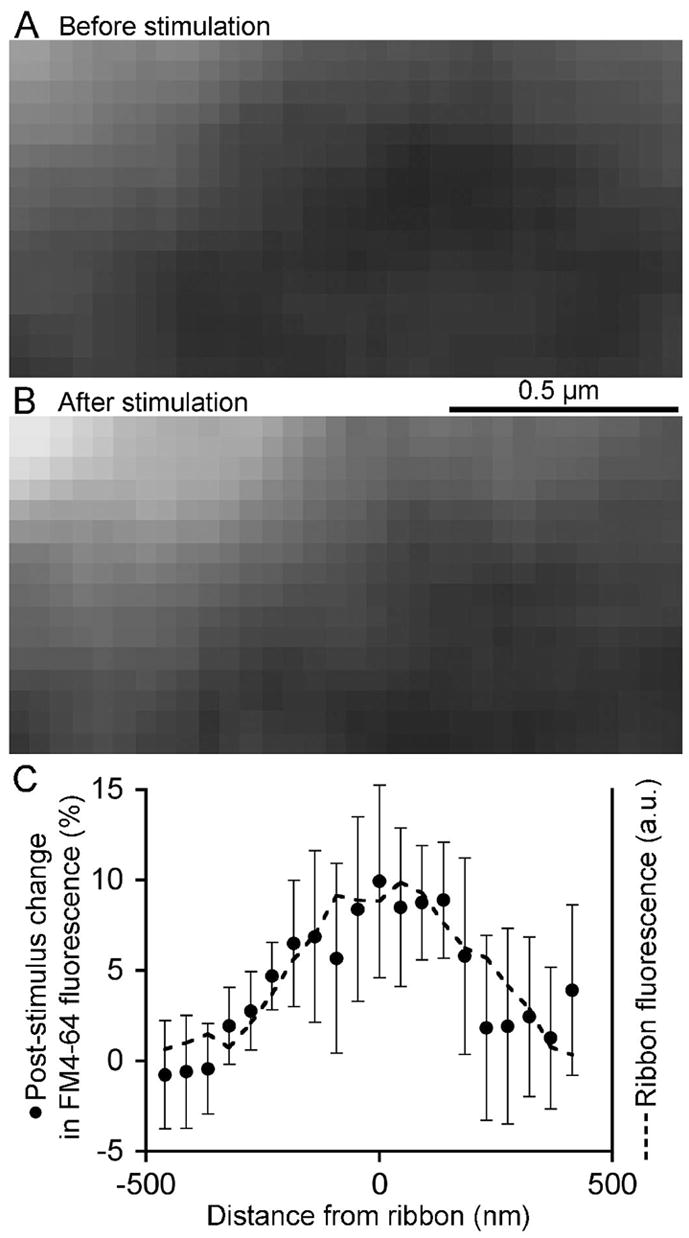
A Confocal image of FM4-64 fluorescence near a ribbon, located at the upper left, after asymptotic recovery from a prior photobleach. B. Same region after a 500-ms depolarizing pulse. A and B are averages of 20 frames taken at 2-s intervals. C. Spatial profile of the average stimulation-induced change in FM4-64 fluorescence (filled circles) at 8 photobleached ribbons with respect to ribbon position. Dashed line shows the profile of the average Rpep fluorescence to mark the ribbon position. Distance is measured from the center of the Rpep fluorescence peak.
Discussion
The present experiments, by simultaneously visualizing both vesicles and ribbons in the living cell, have answered several basic questions about vesicle dynamics at ribbon synapses. First, absent a depolarizing stimulus, vesicles associated with the ribbon do not exchange dynamically with vesicles in the cytoplasm. Rather, they behave as though they are stuck firmly to the ribbon, like a tennis ball to Velcro, to be released only during exocytosis at the presynaptic active zone. Previous work on effects of the nonhydrolyzable ATP analog, ATP-γS, on capacitance responses in goldfish bipolar neurons (Heidelberger et al., 2002) suggested that vesicles in the releasable pool turn over slowly in the absence of stimulation, but did not directly connect the “releasable pool” with vesicles at ribbons. The present results explicitly establish that connection, by directly quantifying vesicle mobility and by relating reduced mobility selectively to visualized sites of ribbons.
Second, vesicles immobilized at ribbons do turn over during depolarization. Previously, an EM probe for release of ribbon-attached vesicles in the goldfish bipolar cell found no stimulus-induced change in overall vesicle density on ribbons and only partial depletion of vesicles near the plasma membrane (Holt et al., 2004), which calls into question whether vesicles on ribbons actually participate in release. Here, however, by photobleaching fluorescent vesicles at the ribbon and following their replacement (during depolarization) with unbleached vesicles, we established that depolarization does in fact release immobilized vesicles at ribbon locations. This locus for vesicle fusion makes functional sense, given that the glutamate receptors mediating postsynaptic responses are located directly across the synapse from the ribbons (Brandstätter et al., 1996, 1997; Ghosh et al., 2001). Therefore, the ribbon ensures that release-ready vesicles will dock and fuse in the appropriate location relative to the postsynaptic receptors.
Third, we have shown that vesicles released at ribbons are replaced by vesicles from cytoplasmic pools, because fluorescence at ribbons increases after stimulation at photobleached ribbons, as bleached vesicles are replaced by fluorescent vesicles that entered the bleached area during recovery after photobleaching. The results also suggest that this stimulus-dependent turnover of immobile vesicles occurs at the ribbon (or very near it) because the increase in FM4-64 fluorescence elicited by depolarization at photobleached ribbon sites coincided with the diffraction-limited image of the ribbon itself (Fig. 7; c.f., Supplemental Fig. S1). EM analysis of FM-labeled synaptic terminals after photoconversion showed labeled vesicles immediately surrounding ribbons (Fig. 3), in position to be tethered to the surface of the ribbon. Plausibly, the release of this halo of ribbon-associated vesicles during depolarization accounts for the observed post-stimulus changes in FM4-64 fluorescence at ribbon sites, as shown schematically in Fig. 8. Prior to bleaching (Fig. 8A), mobile, labeled vesicles (red) and immobile, labeled vesicles (red, with anchor) are present in the cytoplasm surrounding the ribbon. Additional labeled vesicles are immobile because they are attached to the ribbon. At non-ribbon locations, the mobile fraction of vesicles is ~0.5, indicating that cytoplasmic mobile and immobile pools are approximately equal, whereas at ribbons the mobile fraction is ~0.2. Therefore, we conclude that mobile and immobile vesicles in the cytoplasm within 0.5 μm of the ribbon each constitute 20% of the labeled population. This leaves ~60% for the immobile vesicles attached to the ribbon.
Figure 8. Schematic representation of fluorescence recovery after photobleaching and stimulation-induced recovery at a synaptic ribbon.
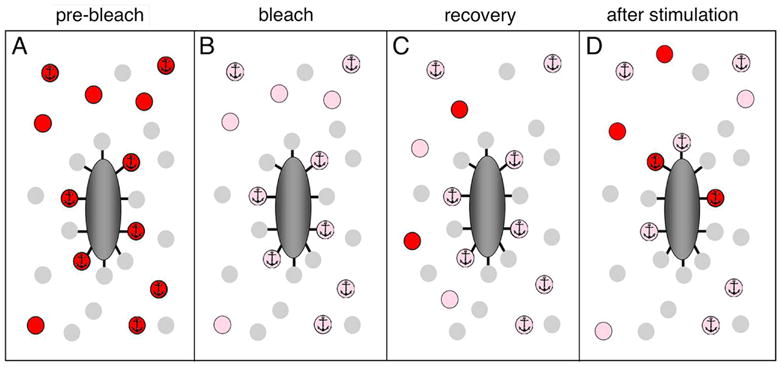
A The condition prior to photobleaching of vesicles labeled with FM4-64 (red). Immobile vesicles are marked with an anchor symbol. A subgroup of immobile vesicles is attached to the synaptic ribbon (dark gray). Unlabeled vesicles (light gray) are not visible in our experiments and are shown for completeness only. B. The condition immediately after photobleaching but before recovery. Pink indicates photobleached, labeled vesicles. C. After asymptotic recovery, mobile vesicles equilibrate between the bleached and unbleached regions of the terminal, restoring a fraction of the pre-bleach fluorescence intensity. D. After a depolarizing stimulus to release the vesicles attached to the ribbon, the bleached vesicles on the ribbon are replaced by a mixture of unbleached and bleached labeled vesicles, resulting in a further increase in fluorescence.
Immediately after bleaching (Fig. 8B), most of the fluorescence is lost from the labeled vesicles (pink). With time, recovery from bleaching occurs as the mobile bleached and mobile unbleached vesicles equilibrate in proportion to their representation in the terminal as a whole. This is indicated in Fig. 8C by the appearance of two unbleached, labeled vesicles (red) and two bleached, labeled vesicles, accounting for the recovery observed at ribbons. The immobile vesicles, both ribbon-attached and cytoplasmic, are fixed in place and make up ~80% of the total at the ribbon location. When depolarization evokes exocytosis (Fig. 8D), vesicles associated with the ribbon are released, allowing unbleached, labeled vesicles to attach to the ribbon. The result is what we observed: an increase in fluorescence after stimulation—as though the ribbon-attached vesicles were rendered “mobile” by the depolarization.
What does depolarization-triggered vesicle turnover at the ribbon imply about mechanisms of transmitter release at ribbon synapses? Following depolarization, the fractional recovery of vesicle fluorescence at ribbons increased by approximately 0.2, but this is only about one-third of the expected vesicles immobilized by ribbons (see above). This shortfall of stimulus-evoked increase in fluorescence has several possible interpretations: (i) repopulation occurs preferentially from the immobile, bleached vesicles near the ribbon, restricting the opportunity for repopulation by unbleached vesicles; (ii) some vesicles attached to the ribbon may be unreleasable; (iii) the unreleasable subgroup of bleached vesicles may be immobilized near the ribbon but not precisely coincide with it. In support of the latter, the increase in FM4-64 fluorescence after depolarization fell within the diffraction-limited ribbon locus (Fig. 7C), whereas stable clusters of labeled vesicles extended beyond the ribbon itself (e.g., Fig. 4E). With regard to the second scenario, Singer and Diamond (2005) also found the readily releasable pool in rat bipolar neurons was smaller than the expected number of vesicles per ribbon, consistent with partial participation of ribbon-attached vesicles in rapid release. If correct, this scenario would imply that the releasable pool includes a contribution from exocytosis at non-ribbon sites, as suggested for goldfish bipolar neurons (Zenisek et al., 2000; Coggins et al., 2007; Midorikawa et al., 2007). Our experiments were not designed to test for this possibility.
Our primary goal here was to determine if the vesicles attached to ribbons are stably immobile in the resting state and then released by stimulation. The results strongly support this conjecture: in mouse bipolar terminals, vesicles labeled with FM dye associate stably with synaptic ribbons and remain immobilized until released by depolarization. Furthermore, by directly visualizing the stimulus-induced turnover of ribbon-associated vesicles, we have established that the vesicles immobilized at the ribbon contribute a major fraction of the readily releasable pool.
Supplementary Material
Acknowledgments
We thank Dr. Jian Li for electron microscopy. We thank Dr. David Zenisek of Yale Medical School for his kind gift of fluorescent RIBEYE-binding peptide and for helpful discussions. Supported by NIH grants EY003821 (GM) and EY008124 (PS).
References
- Allwardt BA, Lall AB, Brockerhoff SE, Dowling JE. Synapse formation is arrested in retinal photoreceptors of the zebrafish nrc mutant. J Neurosci. 2001;21:2330–2342. doi: 10.1523/JNEUROSCI.21-07-02330.2001. [DOI] [PMC free article] [PubMed] [Google Scholar]
- Betz WJ, Bewick GS. Optical monitoring of transmitter release and synaptic vesicle recycling at the frog neuromuscular junction. J Physiol (Lond) 1993;460:287–309. doi: 10.1113/jphysiol.1993.sp019472. [DOI] [PMC free article] [PubMed] [Google Scholar]
- Brandstätter JH, Koulen P, Kuhn R, van der Putten H, Wässle H. Compartmental localization of a metabotropic glutamate receptor (mGluR7): two different active sites at a retinal synapse. J Neurosci. 1996;16:4749–4756. doi: 10.1523/JNEUROSCI.16-15-04749.1996. [DOI] [PMC free article] [PubMed] [Google Scholar]
- Brandstätter JH, Koulen P, Wässle H. Selective synaptic distribution of kainate receptor subunits in the two plexiform layers of the rat retina. J Neurosci. 1997;17:9298–9307. doi: 10.1523/JNEUROSCI.17-23-09298.1997. [DOI] [PMC free article] [PubMed] [Google Scholar]
- Brumback AC, Lieber JL, Angleson JK, Betz WJ. Using FM1-43 to study neuropeptide granule dynamics and exocytosis. Methods. 2004;33:287–294. doi: 10.1016/j.ymeth.2004.01.002. [DOI] [PubMed] [Google Scholar]
- Coggins MR, Grabner CP, Almers W, Zenisek D. Stimulated exocytosis of endosomes in goldfish retinal bipolar neurons. J Physiol (Lond) 2007;584:853–865. doi: 10.1113/jphysiol.2007.140848. [DOI] [PMC free article] [PubMed] [Google Scholar]
- Dick O, tom Dieck S, Altrock WD, Ammermüller J, Weiler R, Garner CC, Gundelfinger ED, Brandstätter JH. The presynaptic active zone protein bassoon is essential for photoreceptor ribbon synapse formation in the retina. Neuron. 2003;37:775–786. doi: 10.1016/s0896-6273(03)00086-2. [DOI] [PubMed] [Google Scholar]
- Gaffield MA, Rizzoli SO, Betz WJ. Mobility of synaptic vesicles in different pools in resting and stimulated frog motor nerve terminals. Neuron. 2006;51:317–325. doi: 10.1016/j.neuron.2006.06.031. [DOI] [PubMed] [Google Scholar]
- Ghosh KK, Haverkamp S, Wässle H. Glutamate receptors in the rod pathway of the mammalian retina. J Neurosci. 2001;21:8636–8647. doi: 10.1523/JNEUROSCI.21-21-08636.2001. [DOI] [PMC free article] [PubMed] [Google Scholar]
- Ghosh KK, Bujan S, Haverkamp S, Feigenspan A, Wässle H. Types of bipolar cells in the mouse retina. J Comp Neurol. 2004;469:70–82. doi: 10.1002/cne.10985. [DOI] [PubMed] [Google Scholar]
- Harata N, Ryan TA, Smith SJ, Buchanan J, Tsien RW. Visualizing recycling synaptic vesicles in hippocampal neurons by FM 1–43 photoconversion. Proc Natl Acad Sci USA. 2001;98:12748–12753. doi: 10.1073/pnas.171442798. [DOI] [PMC free article] [PubMed] [Google Scholar]
- Heidelberger R, Matthews G. Calcium influx and calcium current in single synaptic terminals of goldfish retinal bipolar neurons. J Physiol (Lond) 1992;447:235–256. doi: 10.1113/jphysiol.1992.sp019000. [DOI] [PMC free article] [PubMed] [Google Scholar]
- Heidelberger R, Sterling P, Matthews G. Roles of ATP in depletion and replenishment of the releasable pool of synaptic vesicles. J Neurophysiol. 2002;88:98–106. doi: 10.1152/jn.2002.88.1.98. [DOI] [PubMed] [Google Scholar]
- Henkel AW, Simpson LL, Ridge RM, Betz WJ. Synaptic vesicle movements monitored by fluorescence recovery after photobleaching in nerve terminals stained with FM1–43. J Neurosci. 1996;16:3960–3967. doi: 10.1523/JNEUROSCI.16-12-03960.1996. [DOI] [PMC free article] [PubMed] [Google Scholar]
- Holt M, Cooke A, Wu MM, Lagnado L. Bulk membrane retrieval in the synaptic terminal of retinal bipolar cells. J Neurosci. 2003;23:1329–1339. doi: 10.1523/JNEUROSCI.23-04-01329.2003. [DOI] [PMC free article] [PubMed] [Google Scholar]
- Holt M, Cooke A, Neef A, Lagnado L. High mobility of vesicles supports continuous exocytosis at a ribbon synapse. Curr Biol. 2004;14:173–183. doi: 10.1016/j.cub.2003.12.053. [DOI] [PubMed] [Google Scholar]
- Meister A, Anderson ME. Glutathione. Annu Rev Biochem. 1983;52:711–760. doi: 10.1146/annurev.bi.52.070183.003431. [DOI] [PubMed] [Google Scholar]
- Mennerick S, Matthews G. Ultrafast exocytosis elicited by calcium current in synaptic terminals of retinal bipolar neurons. Neuron. 1996;17:1241–1249. doi: 10.1016/s0896-6273(00)80254-8. [DOI] [PubMed] [Google Scholar]
- Midorikawa M, Tsukamoto Y, Berglund K, Ishii M, Tachibana M. Different roles of ribbon-associated and ribbon-free active zones in retinal bipolar cells. Nat Neurosci. 2007;10:1268–1276. doi: 10.1038/nn1963. [DOI] [PubMed] [Google Scholar]
- Moser T, Brandt A, Lysakowski A. Hair cell ribbon synapses. Cell Tissue Res. 2006;326:347–359. doi: 10.1007/s00441-006-0276-3. [DOI] [PMC free article] [PubMed] [Google Scholar]
- Paillart C, Li J, Matthews G, Sterling P. Endocytosis and vesicle recycling at a ribbon synapse. J Neurosci. 2003;23:4092–4099. doi: 10.1523/JNEUROSCI.23-10-04092.2003. [DOI] [PMC free article] [PubMed] [Google Scholar]
- Rea R, Li J, Dharia A, Levitan ES, Sterling P, Kramer RH. Streamlined synaptic vesicle cycle in cone photoreceptor terminals. Neuron. 2004;41:755–766. doi: 10.1016/s0896-6273(04)00088-1. [DOI] [PubMed] [Google Scholar]
- Richards DA, Guatimosim C, Betz WJ. Two endocytic recycling routes selectively fill two vesicle pools in frog motor nerve terminals. Neuron. 2000;27:551–559. doi: 10.1016/s0896-6273(00)00065-9. [DOI] [PubMed] [Google Scholar]
- Schmitz F, Konigstorfer A, Sudhof TC. RIBEYE, a component of synaptic ribbons: a protein’s journey through evolution provides insight into synaptic ribbon function. Neuron. 2000;28:857–872. doi: 10.1016/s0896-6273(00)00159-8. [DOI] [PubMed] [Google Scholar]
- Singer JH, Diamond JS. Vesicle depletion and synaptic depression at a mammalian ribbon synapse. J Neurophysiol. 2006;95:3191–3198. doi: 10.1152/jn.01309.2005. [DOI] [PubMed] [Google Scholar]
- Sterling P, Matthews G. Structure and function of ribbon synapses. Trends Neurosci. 2005;28:20–29. doi: 10.1016/j.tins.2004.11.009. [DOI] [PubMed] [Google Scholar]
- Thoreson WB, Rabl K, Townes–Anderson E, Heidelberger R. A highly Ca2+-sensitive pool of vesicles contributes to linearity at the rod photoreceptor ribbon synapse. Neuron. 2004;42:595–605. doi: 10.1016/s0896-6273(04)00254-5. [DOI] [PMC free article] [PubMed] [Google Scholar]
- Tsukamoto Y, Morigiwa K, Ueda M, Sterling P. Microcircuits for night vision in mouse retina. J Neurosci. 2001;21:8616–8623. doi: 10.1523/JNEUROSCI.21-21-08616.2001. [DOI] [PMC free article] [PubMed] [Google Scholar]
- Van Epps HA, Hayashi M, Lucast L, Stearns GW, Hurley JB, De Camilli P, Brockerhoff SE. The zebrafish nrc mutant reveals a role for the polyphosphoinositide phosphatase synaptojanin 1 in cone photoreceptor ribbon anchoring. J Neurosci. 2004;24:8641–8650. doi: 10.1523/JNEUROSCI.2892-04.2004. [DOI] [PMC free article] [PubMed] [Google Scholar]
- von Gersdorff H, Vardi E, Matthews G, Sterling P. Evidence that vesicles on the synaptic ribbon of retinal bipolar neurons can be rapidly released. Neuron. 1996;16:1221–1227. doi: 10.1016/s0896-6273(00)80148-8. [DOI] [PubMed] [Google Scholar]
- Zenisek D, Steyer JA, Almers W. Transport, capture and exocytosis of single synaptic vesicles at active zones. Nature. 2000;406:849–854. doi: 10.1038/35022500. [DOI] [PubMed] [Google Scholar]
- Zenisek D, Horst NK, Merrifield C, Sterling P, Matthews G. Visualizing synaptic ribbons in the living cell. J Neurosci. 2004;24:9752–9759. doi: 10.1523/JNEUROSCI.2886-04.2004. [DOI] [PMC free article] [PubMed] [Google Scholar]
- Zhou ZY, Wan QF, Thakur P, Heidelberger R. Capacitance measurements in the mouse rod bipolar cell identify a pool of releasable synaptic vesicles. J Neurophysiol. 2006;96:2539–2548. doi: 10.1152/jn.00688.2006. [DOI] [PubMed] [Google Scholar]
Associated Data
This section collects any data citations, data availability statements, or supplementary materials included in this article.


