Abstract
When ultrasonic transducers with large detecting areas and/or compact measurement geometries are employed in photoacoustic computed tomography (PACT), the spatial resolution of reconstructed images can be significantly degraded. Our goal in this work is to clarify the domain of validity of an imaging model that mitigates such effects by use of a far-field approximation. Computer-simulation studies are described that demonstrate the far-field-based imaging model is highly accurate for a practical 3D PACT imaging geometry employed in an existing small animal imaging system. For use in special cases where the far-field approximation is violated, an extension of the far-field-based imaging model is proposed that divides the transducer face into a small number of rectangular patches that are each described accurately by use of the far-field approximation.
Keywords: Photoacoustic computed tomography, image reconstruction
1. Introduction
Photoacoustic computed tomography (PACT), also known as optoacoustic tomography, is a hybrid computed imaging modality that combines the rich contrast of optical imaging methods with the deep penetration and high spatial resolution of ultrasound imaging methods [1, 2, 3]. In PACT, a shortlaser pulse is employed to irradiate an object and pressure waves are produced via the thermoacoustic effect and are subsequently measured outside the object by use of ultrasonic transducers. From these data, a PACT image reconstruction algorithm is employed to produce an image that depicts the spatially variant absorbed optical energy density within the object.
When ultrasonic transducers with large detecting areas and/or compact measurement geometries are employed in photoacoustic computed tomography (PACT), the spatial resolution of PACT images reconstructed by use of algorithms that assume point-like ultrasonic transducers can be significantly degraded [4, 5]. To mitigate this effect, a description of the transducers’ spatial impulse responses (SIRs) [6] can be incorporated into a discrete imaging model that approximately describes the action of the imaging system. In recent studies, algorithms based on such imaging models have been developed for reconstructing PACT images [7, 8, 9, 10]. For three-dimensional (3D) PACT studies, these algorithms are generally optimization-based and iterative in nature [9]. Even when implemented on high-performance computing platforms [11], 3D PACT reconstruction algorithms that compensate for the SIR can be computationally burdensome.
For ultrasonic transducers that have flat circular or rectangular detection surfaces, a far-field approximation can result in a closed-form expression for the SIR [12]. It has been demonstrated that this allows for the construction of discrete PACT imaging models that have desirable computational characteristics [7]. In particular, based on the far-field SIR approximation, a 3D PACT imaging model was proposed and investigated for use in an optimization-based iterative image reconstruction method [7]. While the far-field-based imaging model possesses attractive computational characteristics that facilitate 3D iterative image reconstruction, there remains an important need to clarify its domain of validity within the context of practical 3D PACT imaging system configurations.
In this article, computer-simulation studies are described that confirm the far-field-based 3D PACT imaging model is highly accurate for a 3D PACT imaging geometry employed in an existing small animal imaging system [13]. We also demonstrate that when an ultra-compact imaging geometry is employed, use of this imaging model can result in image artifacts associated with the violation of the far-field approximation. For use in such cases, an extension of the far-field-based imaging model is proposed that divides the transducer face into a small number (e.g. 2 × 2) of rectangular patches that are each described accurately by use of the far-field approximation. The performance of the far-field-based and patch-based algorithms are quantitatively investigated in terms of the accuracy of the reconstructed images. A preliminary investigation of the noise robustness of the far-field-based imaging models is also reported.
2. Background
Below we review the salient features of the imaging physics, discrete PACT imaging model, and reconstruction method that will employed in our studies. The reader is referred to references [3] and [7] for additional details.
2.1. Canonical imaging physics
In PACT, a pulsed laser source is used to irradiate an object, and the photoacoustic effect results in the generation of a pressure field p(r, t) [1, 2], where r ∈ ℝ3 and t is the temporal coordinate. In this work, the to-be-imaged object and surrounding medium are assumed to have homogeneous and lossless acoustic properties. Additionally, the optical illumination of the object is assumed to be instantaneous, i.e. the laser pulse width is negligible. Under these conditions, the photoacoustic field p(r, t) satisfies the wave equation [1]:
| (1) |
subject to the initial conditions
| (2) |
where A(r) is a compactly supported and bounded function that represents the absorbed optical energy density, Δ is the 3D Laplacian operator, and β, c, Cp are the thermal expansion coefficient, the speed of sound, and the isobaric specific heat, respectively.
The pressure field p(r, t) is assumed to be measured with flat ultrasonic transducer elements arranged on an arbitrary surface enclosing the object. The transducer elements are assumed to have no disruptive influence on the pressure field and therefore the background medium can effectively be assumed to have an infinite extent. The solution of Eq. (1) subject to Eq. (2) is given by [1]
| (3) |
where V ⊂ ℝ3 contains the support of A(r), δ(t) is the one-dimensional Dirac delta function, and ||·|| is the Euclidean norm. In a mathematical sense, the goal of PACT is to determine A(r) from knowledge of p(r, t) on some measurement aperture outside the object.
2.2. Discrete imaging model
In practice, the photoacoustic pressure field p(r, t) is degraded by the response of the ultrasonic transducer and sampled during the measurement process. Consider that the ultrasonic transducers collect data at Q locations that are specified by the index q = 0, …, Q − 1 and K temporal samples, specified by the index k = 0, …, K − 1, are acquired at each location with a sampling interval ΔT. Let the vector u ∈ ℝQK denote a lexicographically ordered version of the sampled data. The notation [u]qK+k will be employed to denote the (qK + k)-th element of u, which is related to the pre-sampled voltage signal at location q, uq(t), as [u]qK+k:= uq(t)|t=kΔt. In this way, [u]qK+k represents the k-th temporal sample recorded by the transducer at location q.
A continuous-to-discrete (C-D) imaging model [3, 7] for PACT can be generally expressed as
| (4) |
where p(r, t) is determined by A(r) via Eq. (3), the surface integral is over the detecting area of the q-th transducer that is denoted by Ωq, he(t) denotes the acousto-electric impulse response (EIR) of the transducers, which is assumed to be the same for all transducers, and *t denotes a temporal convolution operation defined as
where f and g are arbitrary functions of t. Note that Eq. (4) is a C-D imaging model in the sense that it maps the function A(r) to the finite-dimensional vector u.
To obtain a discrete-to-discrete (D-D) imaging model for use with iterative image reconstruction algorithms, a finite-dimensional approximate representation of the object function A(r) can be introduced as [7, 9, 14, 15]
| (5) |
where the superscript ‘a’ denotes that Aa(r) is an approximation of A(r), represents a collection of expansion functions, and θ ∈ ℝN is a vector of expansion coeffcients. In this work, the expansion functions will be chosen as uniform spherical voxels:
| (6) |
where rn denotes the n-th voxel location and ε is the voxel radius. We assume that the voxels are non-overlapping. The imaging model described below, however, remains valid for any collection of radially symmetric expansion functions .
Let
denote the temporal Fourier transform of the pre-sampled voltage signal uq(t) at location q. In practice, the temporal frequency samples , l = 0, …, L − 1, can be estimated by computing the discrete Fourier transform of the measured samples of uq(t) with a frequency interval Δf. The vector ũ will denote a lexicographically ordered representation of the sampled temporal frequency data corresponding to all transducer locations, i.e. .
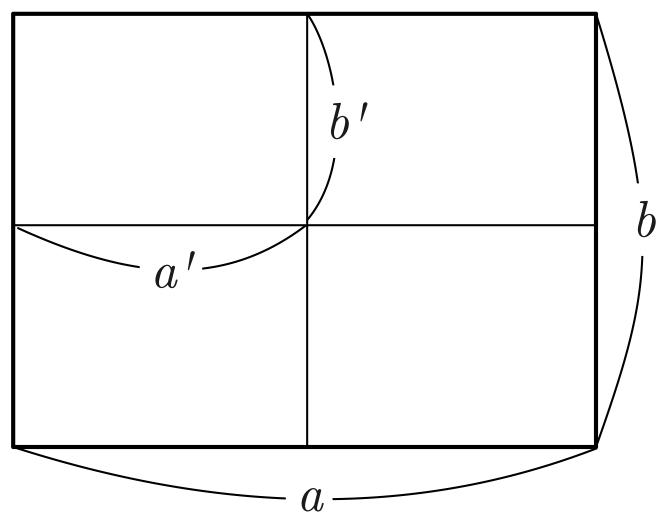
Consider the case where the detection surfaces of the ultrasonic transducers are rectangular and flat with area a × b (Fig. 1). A D-D imaging model can be expressed as [9]
| (7) |
where H is the system matrix of dimension QL × N, whose elements are defined as
| (8) |
Here,
| (9) |
denotes the temporal Fourier transform of the pressure signal produced by one of the spherical voxels, h̃e(f) is the temporal Fourier transform of the EIR he(t), and is the temporal Fourier transform of the spatial impulse response (SIR). Under a far-field approximation [9, 12], which is discussed later,
| (10) |
where , rn,q is the distance between the centers of the n-th voxel and the q-th transducer element, i.e. rn,q := ||rn − r0,q||, and Xn,q and Yn,q are the coordinates of the n-th voxel in the local coordinate system located at the center of the q-th transducer element, with the X- and Y -axes parallel to the edges of length a and b, respectively. The goal of PACT can now be restated in the context of the discrete imaging model: to determine θ from knowledge of ũ.
Figure 1.
The transducer face (a × b) is divided into small patches (a′ × b′) that are each described by the far-field approximation. The number of patches is arbitrary.
2.3. Image reconstruction
The idealized image reconstruction task is to determine θ, and hence an approximation of A(r), from the known û by inverting Eq. (7). However, in practice, the system matrix can be poorly conditioned [16]. A common strategy to mitigate noise amplification is to seek a penalized least-squares (PLS) estimate θ̂ of θ as
| (11) |
where R(θ) is a regularizing penalty term whose effect is controlled by the scalar regularization parameter α. The following quadratic penalty [17] was utilized in the studies described below:
| (12) |
where and are the indices for the voxels that are adjacent to the n-th (center) voxel along the x-axis, and , , , and are similarly defined.
3. Computer-Simulation Studies
Computer-simulation studies were conducted to quantitatively investigate the use of the far-field approximation for modeling the SIR in PACT.
3.1. Numerical details
3.1.1. Phantom and simulation data
Numerical phantoms were employed to represent the different forms of the absorbed optical energy density A(r) as described below. In all cases, the phantoms were comprised of uniform spheres. Accordingly, the photoacoustic field p(r, t) produced by the phantoms could be computed by use of a closed-form expression [18]. The simulated measurement data [u]qK+k were obtained as follows. First, the photoacoustic field produced by each sphere was computed by use of the closed-form expression and densely sampled at each transducer location r0,q with a sampling frequency of 200 MHz. A semi-analytical SIR [6], which was calculated as the length of the intersection of the transducer face and the spherical wavefront generated by an imaginary point source located at the center of the sphere, was similarly sampled and numerically convolved with the sampled photoacoustic field. Additional details regarding the semi-analytical SIR can be found in Appendix A and in reference [6]. This quantity will be referred to as the contribution from the sphere. The raw pressure samples were obtained as the sum of the contributions from all spheres. To reduce the high-frequency components of the raw pressure samples that could cause noise amplification later during reconstruction, the pressure samples were smoothed by convolving with a Gaussian kernel function with a full-width-at-half-maximum (FWHM) of 0.5 mm/c. This temporal low-pass filtering has been proved to be equivalent to the spatial low-pass filtering with an FWHM of 0.5 mm in the phantom space [5]. The sampled voltage signal [u]qK+k was obtained as the filtered pressure samples undersampled with a sampling frequency of 10 MHz. Here, the EIR (he(t) in Eq. (4)) was assumed to be a delta function and thus was intentionally ignored because our focus in this work is on the spatial response of the transducer, not on the electrical one. Notice that, despite its analytical accuracy, the SIR used above cannot readily be employed in reconstruction algorithms because of its computational complexity.
3.1.2. Algorithm implementation
Solutions of Eq. (11) were computed by use of the conjugate gradient (CG) method for least-squares problems [9, 19, 20]. Since the most computationally intensive component of the reconstruction algorithm is the calculation of the action of the imaging matrix (H) and its adjoint (H†), these operations were implemented as GPU-based massively parallel algorithms whose basic designs were inspired by [11, 21] and are briefly described as follows. The reader is referred to reference [11] for additional details.
Let G denote the number of GPU units. For calculating the action of H, the object vector θ is divided into G subvectors that are specified by the index g = 0, …, G−1. The subvectors are distributed to G CPU threads that each manage one GPU unit. In each thread, θg is further divided into H chunks that are specified with the index h = 0, … ,H − 1. The chunk size is chosen so that the chunk fits the constant memory of the GPU unit. Each chunk θg,h is loaded into the constant memory, and the partial voltage signal in the temporal frequency domain, ṽg,h is computed according to the following equation that is derived from Eq. (8):
| (13) |
where is the location of the voxel that corresponds to the n-th element of θg,h. The calculation is conducted with Q blocks of L GPU threads that each compute one element of ṽg,h. The full voltage signal ũ is obtained by accumulating {ṽg,h} over the indices g and h in the CPU threads: .
The action of H† can be computed similarly. The voltage signal vector ũ is divided into G subvectors so that each contain the voltage signals from Q/G transducer elements. The subvectors are distributed to G CPU threads that each manage one GPU unit. Each CPU thread further divides ũg into J chunks that are specified by the index j = 0, … , J − 1. Each chunk ũg,j is loaded into the constant memory, and the partial object vector, τg,j, is computed according to the following equation:
| (14) |
where ‘Re’ denotes the real-valued component of a complex-valued quantity, Qg is the collection of the transducer indices assigned to the g-th GPU, is the location of the voxel that corresponds to the n-th element of τg,j, and ‘*’ denotes the complex conjugate. The calculation is conducted with nynz blocks of nx GPU threads, where nx, ny, and nz are x, y, and z sizes of the object space, respectively, i.e. n = nxnynz. The full object vector θ is obtained by accumulating {τg,h} over the indices g and j in the CPU threads: .
All routines described above were implemented in CUDA (NVIDIA, USA), and executed on a GPU cluster with 8 GPU units (Tesla C1060; NVIDIA, USA).
3.2. Configuration #1: A currently-employed 3D imaging system
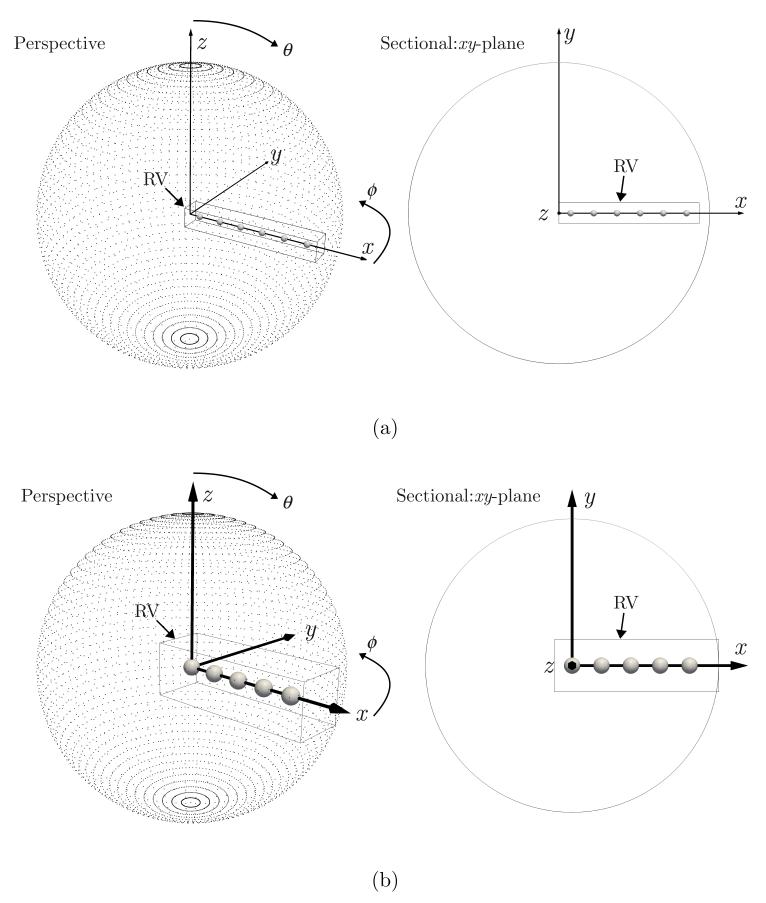
We first considered a realistic 3D imaging configuration that was based upon an existing small animal imaging system [13] (Fig. 2(a)). On a spherical surface with a radius of 65 mm, 48 × 96 (= 4608) transducer elements were evenly arranged. Each transducer element had a flat square face with a side length of 2 mm (a = b = 2 mm in Fig. 1) and center coordinates of ; i = 1, …, 48, j = 1, …, 96, where θ and ϕ are the polar and azimuthal angles, respectively. The normal of the detector face pointed to the origin of the spherical measurement surface. Let the z-axis be the axis that points to the origin of the polar angle (i.e. the north pole), the x-axis be the axis that points to the origin of the azimuthal angle, and the y-axis be the axis that forms a right-handed coordinate system with the x- and z-axes. The object consisted of 6 solid spheres, each of which had a radius of 1.4 mm and centered on the x-axis at x = 5, 15, 25, 35, 45, 55 mm, respectively. The value of A(r) was assigned a unity value inside each sphere, and zero outside. The acoustic properties were assumed as follows: c = 1530 m/s and βc2/Cp = 2000. The reconstruction volume was a rectangular solid with a size of 60.48 mm (x) × 8.96 mm (y) × 8.96 mm (z) that contained the object. It consisted of 432 (x) × 64 (y) × 64 (z) spherical voxels with a radius of 0.07 mm. A more detailed description of the use of spherical voxels is found in references [7, 9]. The object was reconstructed from the simulated measurement data by use of the far-field-based reconstruction algorithm as described in the previous section. For comparison, a reconstruction algorithm that employed the point-like transducer approximation, in which the pressure field was not averaged over each transducer element surface, but evaluated only at the center of each element, was also implemented and applied to the same pressure data. The point-like-transducer-based algorithm was obtained from the far-field-based algorithm by replacing the far-field-based SIR with the point-like-transducer-based SIR:
| (15) |
This replacement is equivalent to assuming that the SIR is a delta function in the time domain.
Figure 2.
The schematic illustration of the imaging system for (a) Configuration #1 (R = 65 mm) and (b) Configuration #2 (R = 25 mm). The solid spheres represent the object. The gray dots represent the center of the transducer elements. RV denotes the reconstruction volume. The polar angle θ and the azimuthal angle ϕ are measured from (0, 0, R) and (R, 0, 0), respectively. For Configuration #2, the voxels of the reconstruction volume that were located on and outside the measurement surface were given the value of 0 and kept constant during iterative reconstruction.
3.3. Configuration #2: An ultra-compact imaging system
When a region of the reconstruction volume is located in the near-field, the far-field-based SIR significantly di ers from the true SIR in that region. This model mismatch, however, does not always significantly degrade the reconstructed image. This is particularly true when only a limited number of transducer elements are within the near-field distance to the region of interest.
To illustrate the limitations of the far-field-based reconstruction algorithm, we considered an imaging system with a very compact measurement geometry in which the entire reconstruction volume is located in the near-field of all transducers (Fig. 2(b)). Since the far-field approximation employed in this work is mathematically equivalent to the Fraunhofer approximation in optics [22], the far-field distance is given by
| (16) |
where rmax is the maximum radius of the transducer element. Based on this condition, the following extreme configuration was considered. On a spherical surface with a radius of 25 mm, 48 × 96 (= 4608) transducer elements were evenly arranged. Each transducer element had a flat square face with a side length of 4 mm (a = b = 4 mm in Fig. 1) and center coordinates of ; i = 1, …, 48, j = 1, …, 96, where θ and ϕ are the polar and azimuthal angles, respectively. The normal of the detector face pointed to the origin of the spherical measurement surface. The object consisted of 5 solid spheres, each of which had a radius of 1.4 mm and centered on the x-axis at x = 0, 5, 10, 15, 20 mm, respectively. The reconstruction volume was a rectangular solid with a size of 28 mm (x) × 8.96 mm (y) × 8.96 mm (z) that contained the object. It consisted of 200 (x) × 64 (y) × 64 (z) spherical voxels with a radius of 0.07 mm. All other simulation parameters were chosen as described in Section 3.2. The far-field distance estimated by Eq. (16) was at most 26 mm because mm and λ ≥ 0.31 mm (= c/fmax; fmax = 5 MHz) for this case. Thus, the entire reconstruction volume was located in the near-field.
By contrast, Configuration #1 had all spherical objects in the far-field because the far-field distance for that case was at most 6.5 mm (a = b = 2mm; mm). Note that the outermost spherical object in Configuration #1 was located at x = 55 mm, while the measurement surface had a radius of 65 mm.
3.4. Patch model of SIR employing far-field approximations
When the entire reconstruction volume is within the near-field distance to each of the transducer elements, the far-field-based algorithm can result in patterned image artifacts (Fig. 5(c)). To mitigate these artifacts, a simple divide-and-integrate algorithm was developed. The algorithm divides each transducer element face into m × m identical patches that are each described by the far-field approximation (Fig. 1). Let a′ and b′ be the lengths of the patch, i.e. a′ = a/m and b′ = b/m. The far-field SIR formula for the original transducer face (Eq. (10)) is straightforwardly extended to the patch by replacing a and b with a′ and b′, respectively. Let be the resulting SIRs that are specified by the patch index i = 0, …, m2. The SIR for the original transducer face is then approximated by averaging the patch SIRs over all patches:
| (17) |
Let this approximation be called “patch approximation.” The patch-based reconstruction algorithm is obtained from the far-field-based reconstruction algorithm by replacing the far-field-based SIR (Eq. (10)) with the patch-based SIR (Eq. (17)).
Figure 5.
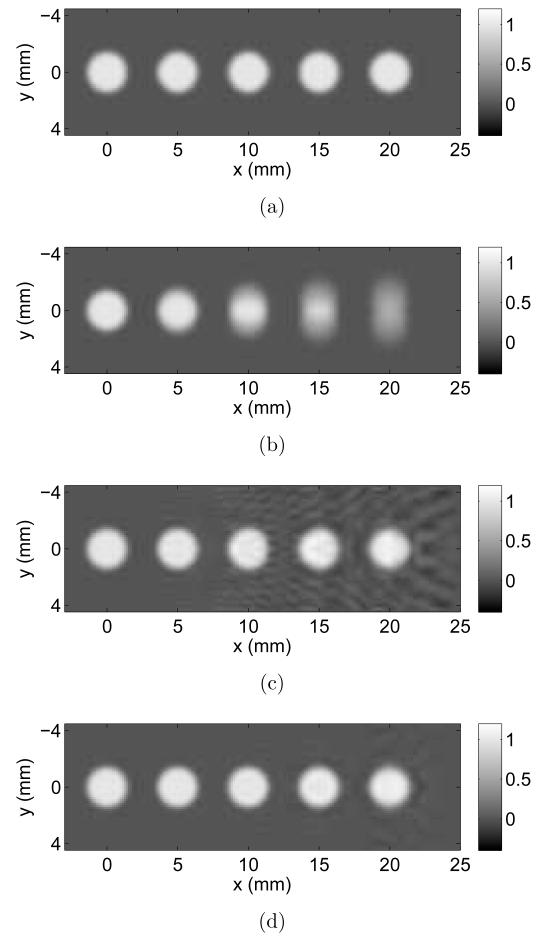
In an extremely compact imaging system, the far-field-based algorithm still exhibited a better resolution than the point-like-transducer-based algorithm did. However, it suffers from severe patterned artifacts (near-field artifacts). The patch-based algorithm (m = 2) mitigated the artifacts. (a) The original phantom in the z = 0 plane. The reconstruction results for (b) the point-like transducer approximation, (c) the far-field approximation, and (d) the patch approximation (m = 2), respectively.
The patch approximation is different from the approximation proposed in reference [8], which decomposes the transducer element face into a number of parallel straight lines whose SIRs are each described by a closed-form analytical formula. Let this algorithm be called “line detector approximation.” Although the line detector approximation has an analytical accuracy in the direction that the lines run, no integration is made in the perpendicular direction because the lines have no extent (zero thickness) in the direction. Thus, the line detector approximation is equivalent to the point-like transducer approximation in that direction. By contrast, our patch approximation employs the far-field approximation for both directions.
To systematically analyze the performance of the patch-based algorithm, the images reconstructed by use of the patch-based algorithms with different numbers of patches were compared. The image quality was assessed in terms of the root-mean-squared-error (RMSE) between the reconstructed image and the true phantom as
| (18) |
where N is the number of voxels, [θ]n is the value of the n-th voxel of the reconstructed image, and [θ]0,n is the value of the n-th voxel of the true phantom, respectively.
3.5. Accuracy of the far-field-based algorithms for a wide range of 3D PACT configurations
To further demonstrate the widespread applicability of the far-field-based reconstruction algorithm, we considered a variety of additional measurement geometries. The phantom employed in these studies was similar to that employed in the study of Configuration #2 above and was comprised of 5 uniform spheres. The spheres each had a radius of 1.4 mm and were located at positions x = 0, 5, 10, 15, 20 mm, respectively. The reconstruction volume was rectangular with dimensions 28 mm (x) × 8.96 mm (y) × 8.96 mm (z). The measurement surface was a sphere on which 48 × 96 (= 4608) flat transducer elements were evenly arranged as in the previous sections. A radius of the measurement surface will be referred to as a “scanning radius.” Five different scanning radii, i.e. R = 25, 45, 65, 85, 105 mm, and five different detector sizes, i.e. a = b = 1, 2, 3, 4, 5 mm, were investigated. In the study with the varying radii, the detector size was fixed at a = b = 4 mm. In the study with the varying detector sizes, the scanning radius was fixed at R = 25 mm. The image quality was assessed by use of the RMSE metric defined in Eq. (18).
3.6. Robustness to measurement noise
Finally, the robustness of the far-field-based algorithm to measurement noise was studied. All parameters were set as in the previous case with a detector radius of 25 mm, except for a band-limited (≤ 5 MHz) Gaussian noise added to the simulated pressure recordings. Let σs and σn be the standard deviation of the pressure recordings and the noise, respectively. The noise standard deviation σn was chosen so that the signal-to-noise ratio (SNR) was 15 dB, i.e. 20 log10 σs/σn = 15.
4. Results
4.1. Configuration #1: A currently-employed 3D imaging system
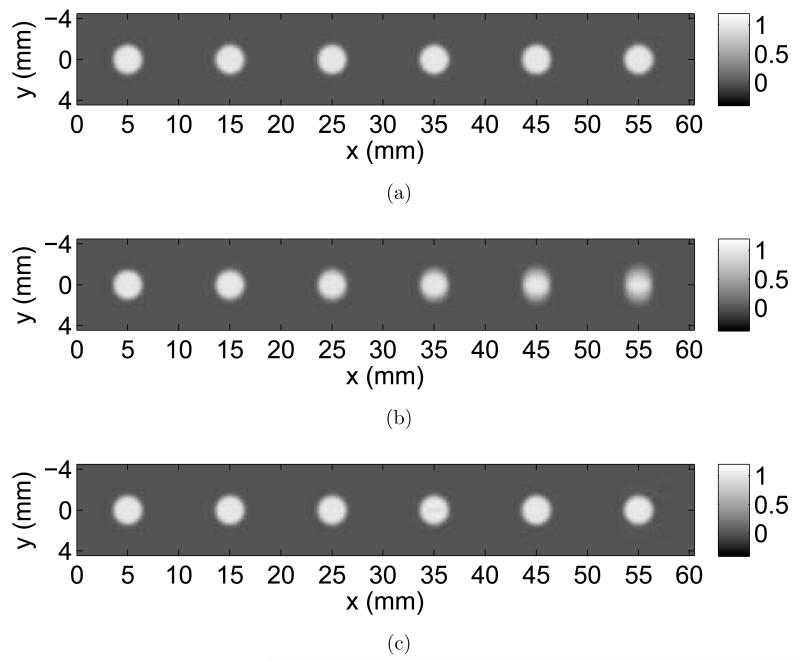
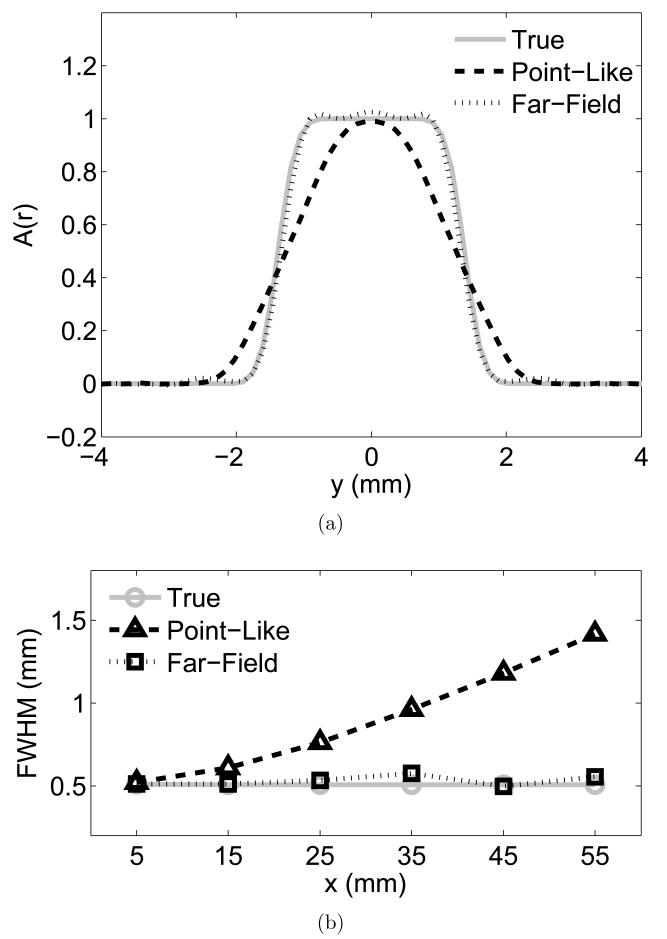
The image reconstructed by use of the far-field-based algorithm exhibited a better resolution than that reconstructed by use of the point-like-transducer-based algorithm (Figs. 3(b) and 3(c)). This observation was confirmed by comparing y-profiles at x = 55 (through the center of the outermost sphere) with each other (Fig. 4(a)). The algorithm with the far-field approximation retained sharp edges at y = ±1.4 mm, while the algorithm with the point-like transducer approximation showed blunt edges. To be more quantitative, the y-profiles of each sphere were fitted with a Gaussian-blurred rectangular function
| (19) |
where ρ is the distance from the center of the sphere, σ is the standard deviation of the Gaussian kernel, and ε is a radius of the sphere. The obtained σ’s were converted to FWHMs using the following formula
| (20) |
and plotted in Fig. 4(b). The reader is referred to Appendix B for additional details regarding the fitting method.
Figure 3.
In a realistic 3D imaging configuration that is based upon an existing small animal imaging system, the far-field-based algorithm exhibited a better resolution than the point-like-transducer-based algorithm did. (a) The original phantom in the z = 0 plane. The reconstruction results for (b) the point-like transducer approximation, and (c) the far-field approximation, respectively.
Figure 4.
In a realistic 3D imaging configuration that is based upon an existing small animal imaging system, the far-field-based algorithm exhibited a better resolution than the point-like-transducer-based algorithm did. (a) y-profiles at x = 55 (through the center of the outermost spheres in Figs. 3(a)-3(c)). (b) The result of the spatial resolution analysis.
The results confirm that the point-like-transducer-based algorithm produced images that exhibited a larger FWHM, and thus a poorer resolution, especially in the region with a large x (peripheral region). By contrast, the images produced by use of the far-field-based algorithm contained sharp edges even in the peripheral region. Note that the true object had an FWHM of 0.5 mm because it had been low-pass filtered with a Gaussian kernel with an FWHM of 0.5 mm. These results indicate that the far-field-based algorithm successfully removes the detector size effect, producing quantitative results in a realistic 3D configuration.
4.2. Configuration #2: An ultra-compact imaging system
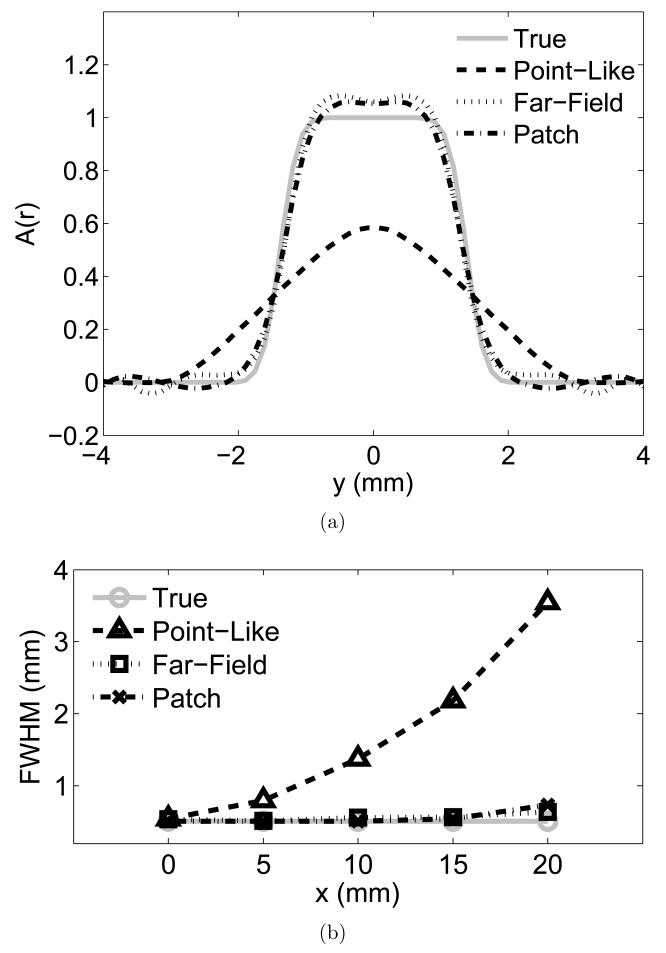
The image reconstructed by use of the far-field-based algorithm exhibited severe patterned artifacts as had been expected (Fig. 5(c)). However, the observed artifacts were different in nature from the blurring introduced by use of the point-like-transducer-based algorithm (Fig. 5(b)). The far-field-based algorithm still retained sharp edges of each sphere, while the point-like-transducer-based algorithm had lost them in the peripheral region. This was confirmed by comparing y-profiles at x = 20 mm with each other (Fig. 6(a)). To be more quantitative, each y-profile was fitted with a Gaussian-blurred rectangular function (Fig. 6(b)). The image reconstructed using the point-like-transducer-based algorithm exhibited poorer spatial resolution, especially in the peripheral region, than did the image reconstructed using the far-field-based algorithm. This is despite the fact that the latter image contained artifacts that we will refer to as “near-field artifacts.”
Figure 6.
In an extremely compact imaging system, the far-field-based algorithm still exhibited a better resolution than the point-like-transducer-based algorithm did. The reconstructed image by use of the patch-based algorithm (m = 2) possessed resolution comparable to that by use of the far-field-based algorithm. (a) y-profiles at x = 20 (through the center of the outermost spheres in Figs. 5(a)-5(d)). (b) The result of the spatial resolution analysis.
4.3. Mitigation of near-field artifacts by use of the patch-based algorithm
The image reconstructed by use of the patch-based algorithm with m = 2 is shown in Fig. 5(d). This image contains fewer and weaker artifacts than are present in the image produced by use of the far-field-based algorithm (Fig. 5(c)). Profiles through the reconstructed images shown in Fig. 5 are displayed in Fig. 6(a), and quantitative measures of spatial resolution are plotted as a function of radial position within the object in Fig. 6(b). These results reveal that the patch-based algorithm can mitigate the near-field artifacts while preserving sharp edges. Notice that a small number of patches (2 × 2) successfully removed the near-field artifacts. This is directly explained from Eq. (16), which depends on r2max. When the transducer element surface is divided into 2 × 2 patches the far-field distance is reduced by a factor of 4. In this particular case, the far-field distance was reduced to 6.5 mm, resulting in almost the entire object volume being located in the far-field of all transducers. This feature is not shared with the point-like-transducer-based algorithm because the far-field approximation is a first order approximation in terms of detector size, while the point-like transducer approximation is equivalent to a zeroth order approximation [22]. This means that, in the point-like transducer approximation, the far-field distance is proportional to rmax, not to r2max. Therefore, a similar divide-and-integrate algorithm with the point-like transducer approximation would require more patches to achieve the same accuracy. The aforementioned line detector approximation [8] also suffers from the same computational inefficiency because it is equivalent to the point-like transducer approximation in one direction, i.e. many lines would be required to achieve a comparable accuracy in 3D PACT imaging. Our patch-based algorithm is computationally e cient and will facilitate 3D PACT imaging.
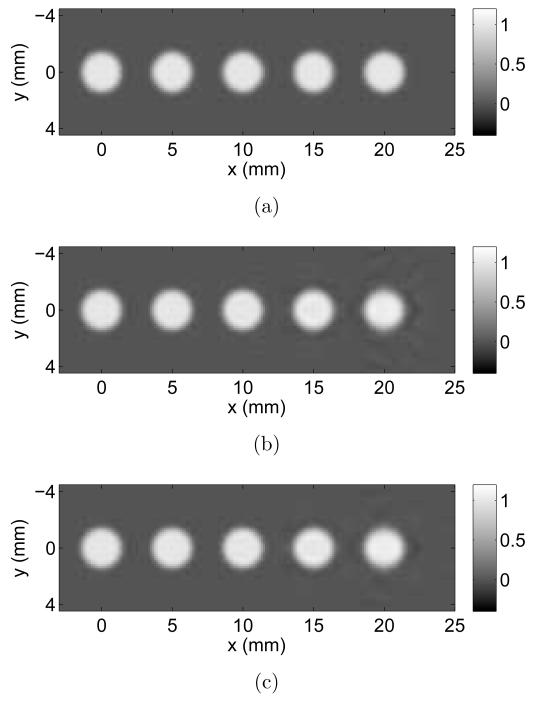
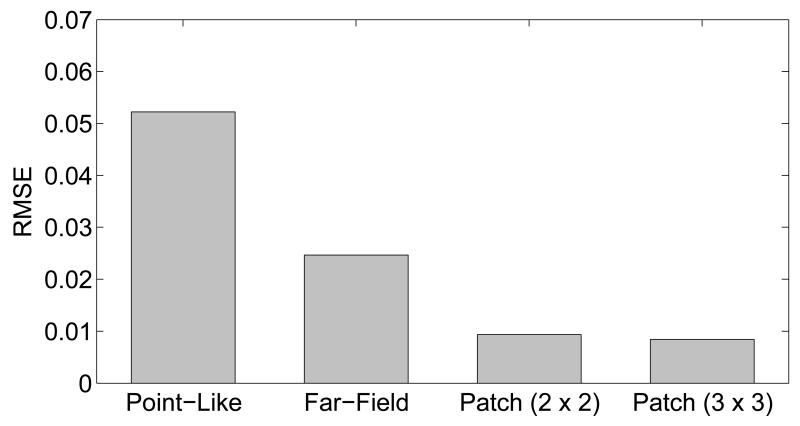
The discussion above suggests that a relatively small number of patches can effectively mitigate near-field artifacts. Fig. 7 displays images reconstructed by use of the patch-based algorithm with 2 × 2 patches (Fig. 7(b)) and 2 × 2 patches (Fig. 7(c)). The true phantom is re-displayed in Fig. 7(a). The images corresponding to use of 2 × 2 and 3 × 3 patches were visually similar. This observation was confirmed in a more quantitative manner by comparing the RMSEs of the reconstructed images, which are displayed in Fig. 8. The improvement in RMSE yielded by use of 3 × 3 patches instead of 2 × 2 patches was only 9.8 × 10⁻⁴. This was much smaller than the RMSE improvement 1.5 × 10⁻² obtained by employing 2 × 2 patches instead of 1 × 1 patch, i.e. the far-field-based algorithm.
Figure 7.
The image reconstructed by use of the patch-based algorithm (2 × 2) has a comparable image quality to the image reconstructed by use of the patch-based algorithm (3 × 3). (a) The original phantom in the z = 0 plane. The reconstruction results for (b) the patch approximation (m = 2) and (c) the patch approximation (m = 3), respectively.
Figure 8.
The image reconstructed by use of the patch-based algorithm (2 × 2) has a comparable image quality to the image reconstructed by use of the patch-based algorithm (3 × 3).
4.4. Accuracy of the far-field-based algorithms for a wide range of 3D PACT configurations
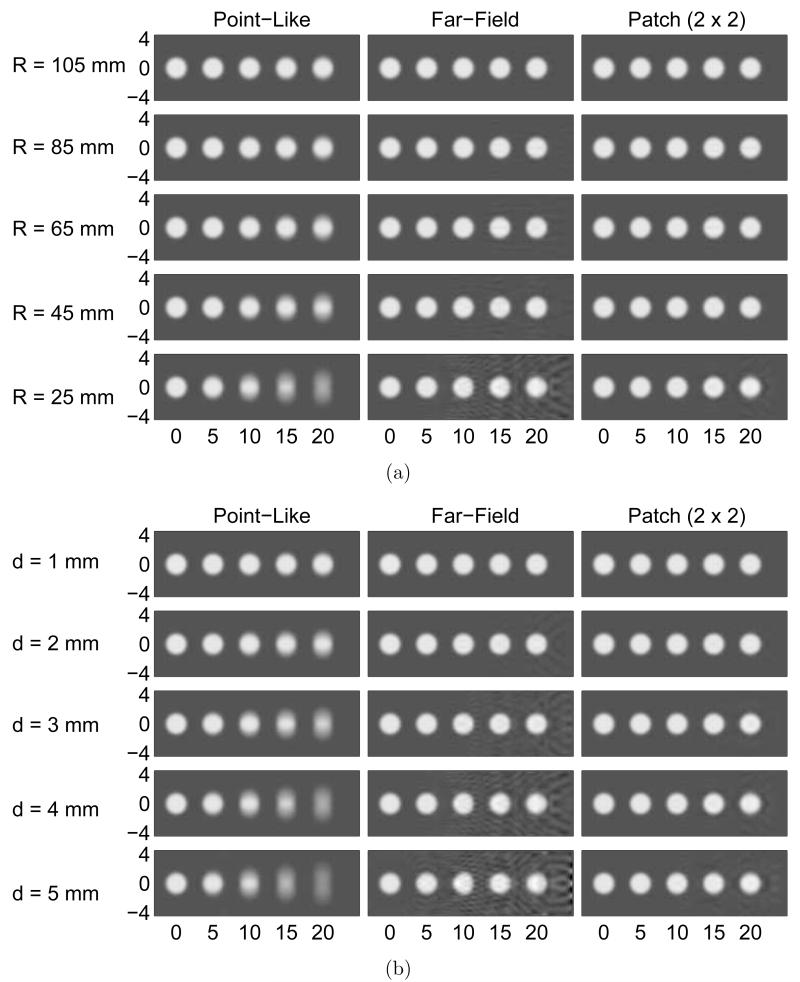
The reconstructed images corresponding to system configurations having different scanning radii and transducer sizes are displayed in Figs. 9(a) and 9(b), respectively. In both cases, the images reconstructed by use of the far-field-based algorithms exhibited sharp edges for a wide range of measurement geometries, i.e. R = 25–105 mm or a = b = 1–5 mm, while the images reconstructed by use of the point-like-transducer-based algorithm exhibited a severe blurring. Near-field artifacts were observed in some of the images that were reconstructed by use of the far-field-based algorithm without patches. However, these artifacts were mitigated by use of the patch-based algorithm with 2 × 2 patches.
Figure 9.
The far-field-based algorithms are highly accurate for a wide range of 3D PACT configurations with (a) different scanning radii and (b) different transducer sizes. The images are arranged so that the top figures are the most accurate.
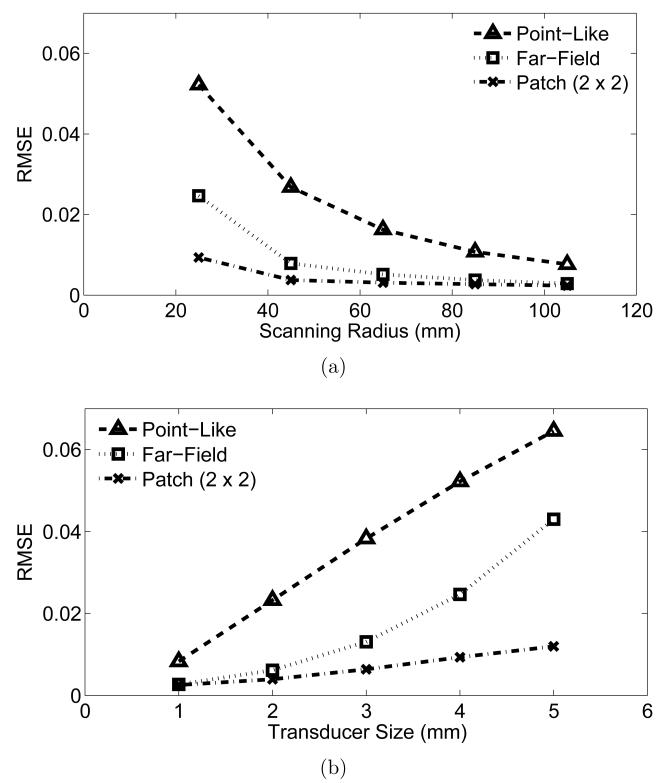
To be more quantitative, the RMSE of the images were computed and are displayed in Fig. 10. The images reconstructed by use of the far-field-based algorithm possessed a consistently smaller RMSE than the images reconstructed by use of the point-like-transducer-based algorithm. By use of the patch-based algorithm, the RMSE decreased to less than 1% of the peak value (= 1) of the object as near-field artifacts were mitigated. These results show the far-field-based algorithms effectively mitigate the detector size effect in a wide range of measurement geometries.
Figure 10.
The far-field-based algorithms are highly accurate for a wide range of 3D PACT configurations with (a) different scanning radii and (b) different transducer sizes.
4.5. Robustness of the far-field-based algorithms to measurement noise
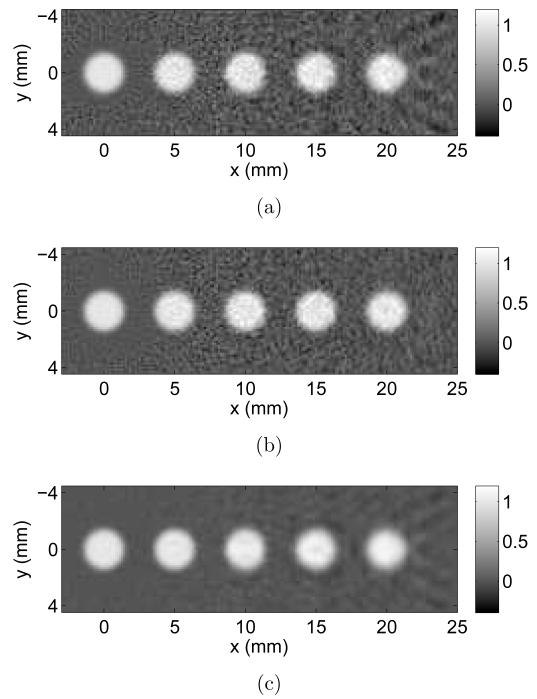
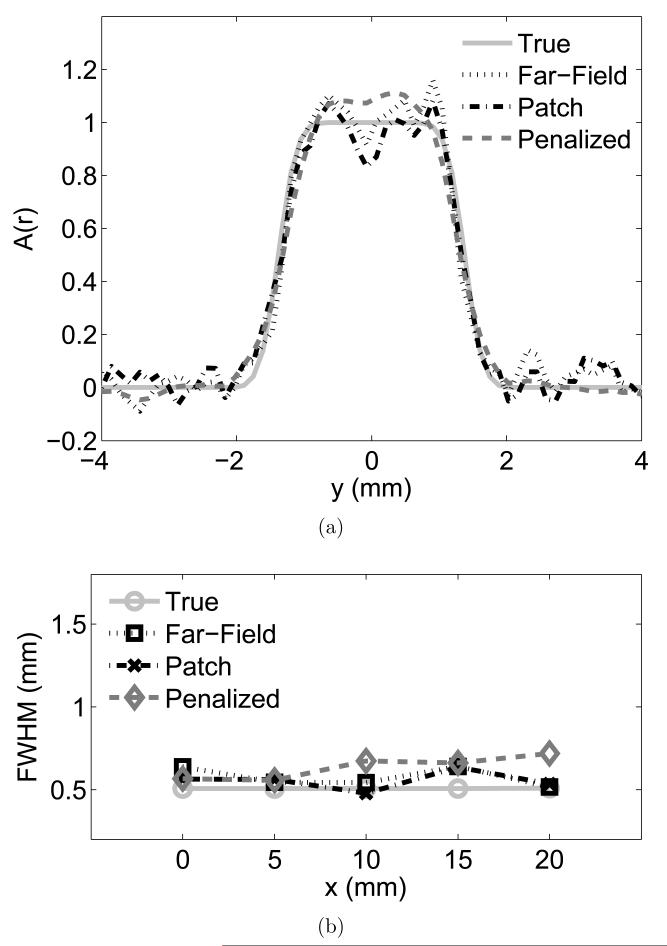
The image reconstructed by use of the far-field-based algorithm from the simulated measurement data that was degraded by a band-limited Gaussian noise still retained sharp edges (Figs. 11(a) and 12(a)). The patch-based algorithm also exhibited its robustness to measurement noise (Figs. 11(b) and 12(a)). No significant blurring was observed in y-profiles (Fig. 12(b)). These results indicate that both far-field-based and patch-based algorithms can effectively mitigate the detector size effect in the presence of noise.
Figure 11.
Both far-field-based and patch-based (m = 2) algorithms are robust to measurement noise. The effect of noise in reconstructed images can be alleviated by use of a conventional regularization technique. The reconstruction results for (a) the far-field approximation, (b) the patch approximation, and (c) the penalized far-field approximation (α = 100), respectively.
Figure 12.
Both far-field-based and patch-based (m = 2) algorithms are robust to measurement noise. The effect of noise in reconstructed images can be alleviated by use of a conventional regularization technique. (a) y-profiles at x = 20 (through the center of the outermost spheres in Figs. 11(a)-11(c)), (b) The result of the spatial resolution analysis.
Conventional regularization techniques can be used together with the far-field approximation to mitigate noise. To demonstrate this, a quadratic smoothness penalty [17] was used. The regularization parameter was set at 100. Noise was successfully reduced by the penalty, while minimal additional blurring was introduced in the y-profile (Figs. 12(a) and 12(b)).
4.6. Computational efficiency
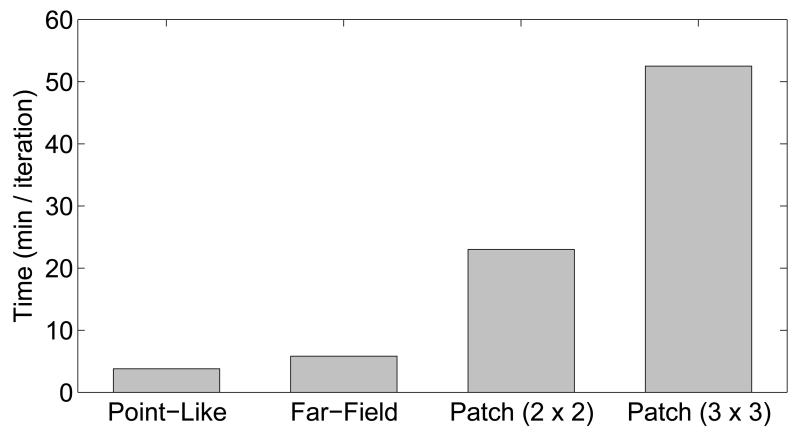
Typical execution times for the point-like-transducer-based, far-field-based, patch-based (2×2), and patch-based (3×3) algorithms were 3.8, 5.8, 23.0, and 52.5 min/iteration, respectively (Fig. 13). 50–150 iterations were needed for convergence. The use of the regularization technique with the far-field-based algorithm did not affect much in terms of execution time as it required 5.9 min/iteration. Since the patch-based algorithm requires computational time proportional to the number of patches, there is a trade-off between accuracy and computational time. However, a small number of patches will generally be sufficient to remove the near-field artifacts, and thus the trade-off does not significantly limit the applicability of the algorithm.
Figure 13.
Typical execution times for the point-like-transducer-based, the far-field-based, and the patch-based (m = 2, 3) algorithms.
5. Conclusions
It is often preferred to employ ultrasonic detectors with large detecting areas and/or compact measurement geometries to achieve a better SNR [23, 24]. However, the spatial resolution of images reconstructed from such data can be significantly degraded. The goal of this study was to demonstrate that the use of the far-field approximation with iterative reconstruction algorithms provides a computationally a ordable way to compensate for this degraded spatial resolution.
The computer-simulation studies described above quantitatively show that the far-field-based imaging model is highly accurate for a wide-range of 3D PACT imaging configurations that employ flat rectangular transducers. In cases in which a realistic 3D imaging configuration based on an existing small animal imaging system [13] was employed, the detector size effect was successfully removed without degrading spatial resolution. In special cases where the far-field approximation is violated, an extension of the far-field-based imaging model that divides the transducer face into a small number (e.g. 2 × 2) of patches effectively mitigated the detector size effect and the near-field artifacts. This extension is more preferable to existing divide-and-conquer strategies, such as one that uses the line detector approximation [8], because the far-field approximation reduces the number of required patches to achieve the same accuracy. The proposed algorithm was robust to noise and readily parallelized using GPU hardware. Therefore, the use of far-field-based imaging models may benefit a wide-range of 3D PACT applications.
Acknowledgments
This research was supported by NIH awards EB010049, CA1744601, and EB01696301.
Biographies

Kenji Mitsuhashi is a graduate student in the Department of Biomedical Engineering at Washington University in St. Louis. He received his B.S. and M.S. degrees in Physics from the University of Tokyo where he investigated the morphological changes of dendritic spines in hippocampus in response to a cytokine stimulus. He has been working for Canon Inc. since 2006 as a researcher of computational physics. His current research is focused on the optimization-based iterative reconstruction algorithm for three-dimensional photoacoustic computed tomography (3D PACT) that mitigates the image artifacts associated with limited-view configurations employed in 3D PACT imaging systems.

Mark A. Anastasio earned his PhD degree at the University of Chicage in 2001 and is currently a professor of biomedical engineering at Washngton University in St. Louis (WUSTL). Dr. Anastasio’s research interests include tomographic image reconstruction, imaging physics, and the development of novel computed biomedical imaging systems. He has conducted extensive research in the fields of diffraction tomography, x-ray phase-contrast X-ray imaging, and photoacoustic tomography.

Kun Wang received his PhD degree in biomedical engineering from Washington University in St. Louis (WUSTL) in 2012. He continued his postdoctoral research in the group of Prof. Mark A. Anastasio in WUSTL, where his research interests include tomographic reconstruction in photoacoustic computed tomography (PACT), ultrasound tomography and X-ray phase contrast imaging. He has firstly demonstrated the feasibility of iterative image reconstruction algorithm for PACT in practice. He has published 9 peer-reviewed articles, one book chapter and multiple conference proceedings.
Appendix A. Semi-analytical SIR for simulating the pressure data
In Section 3.1.1, we employed the semi-analytical SIR [6] to produce simulated pressure data. Here, we briefly review the method of calculating the semi-analytical SIR.
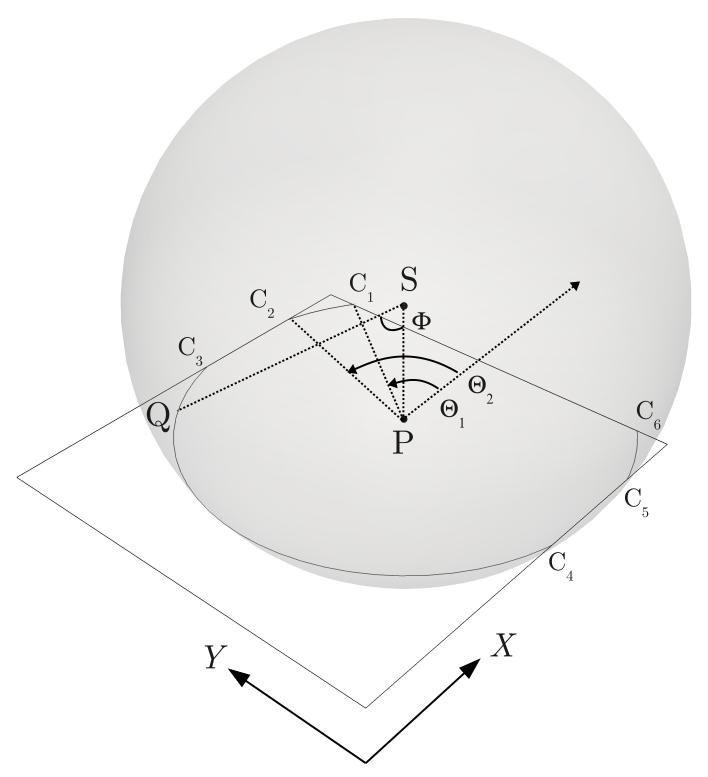
Since the point photoacoustic source located at rn produces a spherical wavefront at time t > 0, the intersection of the wavefront and the q-th transducer face is represented as a collection of arcs (Fig. A.1). Let Lq,n(t) denote the total length of the intersection arcs at time t. The SIR can be expressed as [12]
| (A.1) |
where Φq,n(t) is the angle defined by an arbitrary point on the arcs (Q in Fig. A.1), the point source (S), and the projection of the point source on the transducer face (P). This formula can further be simplified as [6]
| (A.2) |
where are the angles subtended by the intersection arcs that are specified by the index r = 1, …, R. Each angle ΔΘq,n,r(t) can be obtained from the angles of the end points of the r-th arc that are specified by the index e = 1, 2 as ΔΘq,n,r(t) =Θq,n,r,2(t) − Θq,n,r,1(t), where we assume that Θq,n,r,2(t) ≥ Θq,n,r,1(t). Thus, the SIR can be calculated from the angles of the intersections of the wavefront and the edges of the transducer face. Since the intersections of the wavefront (spherical shell) and the edges (line segments) can be calculated analytically by solving a quadratic equation, the SIR obtained from Eq. (A.2) has an analytical accuracy.
Notice that the analytical SIR described above is computationally burdensome and thus cannot readily be employed as a component of the system matrix. The analytical SIR was employed only for simulating the pressure data where the number of sources was limited, e.g. 6 for Configuration #1.
Figure A.1.
The schematic illustration of the method of calculating the semi-analytical SIR. The square at the center of the figure represents the transducer element face. X and Y denote the local coordinate system for the transducer element of interest. S denotes the point photoacoustic source. P denotes the projection of S on the transducer face. The gray spherical shell represents the wavefront at time t. represent the intersections of the wavefront and the edges of the transducer face. Θ1 and Θ2 denote the angle of the radius PC1 and PC2, respectively, measured from the positive X direction. Let Q be an arbitrary point on the intersection arcs. ∠QSP is denoted by Φ.
Appendix B. Quantification of spatial resolution
To quantitatively assess the spatial resolution of the reconstructed images, the y-profiles of the reconstructed spherical objects were fitted with a Gaussian-blurred rectangular function (Sections 4.1-4.5). Here, we explain the details of the fitting method.
The blur associated with transducers with a large detecting area is known to be described by the point response function (PRF) that extends in the angular direction of the measurement surface, but not in the radial direction, when a back-projection-based reconstruction formula is employed [4]. Thus, we assumed that the PRF extends in the y-direction at the location of each spherical object (Fig. 2). This assumption was confirmed by the observation of the reconstructed images (Figs. 3 and 5). We further assumed that the PRF had a Gaussian profile with a standard deviation of σ. Under these assumptions, the profile of the object that is blurred by the Gaussian PRF can be written as a spatial convolution
| (B.1) |
where ρ and ρ′ are the coordinate variables along the y-axis, A(ρ) is the y-profile of the true spherical object with a radius of ε defined as
| (B.2) |
is the blurred version of A(ρ), and Kσ(ρ) is the Gaussian PRF with a standard deviation of σ defined as
| (B.3) |
By use of the error function defined as
Eq. (B.1) immediately leads to Eq. (19). We solved the following least-squares problem to fit Eq. (19) to the y-profile via the fitting parameter ρ̂:
| (B.4) |
The built-in function of MATLAB (R2010b; The MathWorks, Inc., USA) for non-linear least-squares fitting was employed to solve the fitting problem. Notice that the fitting method estimates the standard deviation of the PRF, i.e. the width of the PRF, but not the width of the fitted profile.
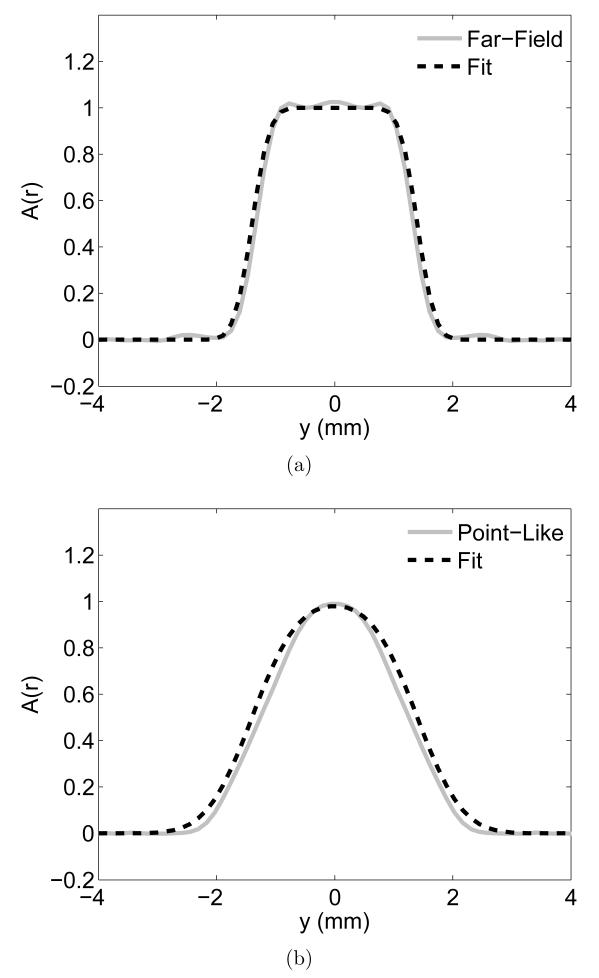
Examples of the fitting results are shown in Fig. B.1. The results show that the Gaussian-blurred rectangular function with a standard deviation σ̂ accurately reproduced the y-profile.
Figure B.1.
Examples of the fitting results. The y-profile of the reconstructed outermost spherical object in Configuration #1 (R = 65 mm; x = 55 mm) was fitted with a Gaussian-blurred rectangular function. The fitting result for the image reconstructed by use of (a) the far-field-based algorithm and (b) the point-like-transducer-based algorithm. The corresponding results of the resolution study are illustrated in Fig. 4.
Footnotes
Publisher's Disclaimer: This is a PDF file of an unedited manuscript that has been accepted for publication. As a service to our customers we are providing this early version of the manuscript. The manuscript will undergo copyediting, typesetting, and review of the resulting proof before it is published in its final citable form. Please note that during the production process errors may be discovered which could affect the content, and all legal disclaimers that apply to the journal pertain.
Conflict of Interest statement
Kenji Mitsuhashi is an employee of Canon, Inc. Kun Wang and Mark A. Anastasio declare that there are no conflicts of interest.
References
- [1].Xu M, Wang LV. Photoacoustic imaging in biomedicine. Rev. Sci. Instrum. 2006;77(4):041101. [Google Scholar]
- [2].Oraevsky AA, Karabutov AA, Vo-Dinh T. Biomedical photonics handbook. CRC Press; 2003. Optoacoustic tomography; pp. 34/1–34/34. [Google Scholar]
- [3].Wang K, Anastasio MA. Photoacoustic and thermoacoustic tomography: image formation principles. In: Scherzer O, editor. Handbook of mathematical methods in imaging. Springer; 2011. pp. 781–815. [Google Scholar]
- [4].Xu M, Wang LV. Analytic explanation of spatial resolution related to bandwidth and detector aperture size in thermoacoustic or photoacoustic reconstruction. Phys. Rev. E. 2003;67(5):056605. doi: 10.1103/PhysRevE.67.056605. [DOI] [PubMed] [Google Scholar]
- [5].Anastasio MA, Zhang J, Modgil D, La Riviére PJ. Application of inverse source concepts to photoacoustic tomography. Inverse Probl. 2007;23(6):S21. [Google Scholar]
- [6].Jensen JA. A new calculation procedure for spatial impulse responses in ultrasound. J. Acoust. Soc. Am. 1999;105(6):3266–3274. [Google Scholar]
- [7].Wang K, Ermilov SA, Su R, Brecht HP, Oraevsky AA, Anastasio MA. An imaging model incorporating ultrasonic transducer properties for three-dimensional optoacoustic tomography. IEEE T. Med. Imaging. 2011;30(2):203–214. doi: 10.1109/TMI.2010.2072514. [DOI] [PMC free article] [PubMed] [Google Scholar]
- [8].Rosenthal A, Ntziachristos V, Razansky D. Model-based optoacoustic inversion with arbitrary-shape detectors. Med. Phys. 2011;38(7):4285–4295. doi: 10.1118/1.3589141. [DOI] [PubMed] [Google Scholar]
- [9].Wang K, Su R, Oraevsky AA, Anastasio MA. Investigation of iterative image reconstruction in three-dimensional optoacoustic tomography. Phys. Med. Biol. 2012;57(17):5399. doi: 10.1088/0031-9155/57/17/5399. [DOI] [PMC free article] [PubMed] [Google Scholar]
- [10].Queirós D, Déan-Ben XL, Buehler A, Razansky D, Rosenthal A, Ntziachristos V. Modeling the shape of cylindrically focused transducers in three-dimensional optoacoustic tomography. J. Biomed. Opt. 2013;18(7):076014. doi: 10.1117/1.JBO.18.7.076014. [DOI] [PubMed] [Google Scholar]
- [11].Wang K, Huang C, Kao YJ, Chou CY, Oraevsky AA, Anastasio MA. Accelerating image reconstruction in three-dimensional optoacoustic tomography on graphics processing units. Med. Phys. 2013;40(2):023301. doi: 10.1118/1.4774361. [DOI] [PMC free article] [PubMed] [Google Scholar]
- [12].Stepanishen PR. Transient radiation from pistons in an infinite planar baffle. J. Acoust. Soc. Am. 1971;49(5B):1629–1638. [Google Scholar]
- [13].Fronheiser M, Ermilov SA, Brecht HP, Su R, Conjusteau A, Oraevsky AA. Whole-body three-dimensional optoacoustic tomography system for small animals. J. Biomed. Opt. 2009;14(6):064007. doi: 10.1117/1.3259361. [DOI] [PMC free article] [PubMed] [Google Scholar]
- [14].Barrett HH, Myers KJ. Foundations of image science. Wiley-Interscience; Hoboken: 2004. [Google Scholar]
- [15].Lewitt RM. Alternatives to voxels for image representation in iterative reconstruction algorithms. Phys. Med. Biol. 1992;37(3):705. doi: 10.1088/0031-9155/37/3/015. [DOI] [PubMed] [Google Scholar]
- [16].Roumeliotis M, Stodilka RZ, Anastasio MA, Chaudhary G, Al-Aabed H, Ng E, Immucci A, Carson JJL. Analysis of a photoacoustic imaging system by the crosstalk matrix and singular value decomposition. Opt. express. 2010;18(11):11406–11417. doi: 10.1364/OE.18.011406. [DOI] [PMC free article] [PubMed] [Google Scholar]
- [17].Fessler JA. Penalized weighted least-squares image reconstruction for positron emission tomography. IEEE T. Med. Imaging. 1994;13(2):290–300. doi: 10.1109/42.293921. [DOI] [PubMed] [Google Scholar]
- [18].Diebold GJ. Photoacoustic monopole radiation: waves from objects with symmetry in one, two, and three dimensions. In: Wang LV, editor. Photoacoustic imaging and spectroscopy. Vol. 144. CRC Press; 2009. pp. 3–17. [Google Scholar]
- [19].Golub GH, Van Loan CF. Matrix computations. Johns Hopkins University Press; Baltimore: 1996. [Google Scholar]
- [20].Wernick MN, Aarsvold JN. Emission tomography: the fundamentals of PET and SPECT. Academic Press; 2004. [Google Scholar]
- [21].Stone SS, Haldar JP, Tsao SC, Hwu W. m. W., Sutton BP, Liang ZP. Accelerating advanced MRI reconstructions on GPUs. J. Parallel Distr. Com. 2008;68(10):1307–1318. doi: 10.1016/j.jpdc.2008.05.013. [DOI] [PMC free article] [PubMed] [Google Scholar]
- [22].Born M, Wolf E. Principles of optics: electromagnetic theory of propagation, interference and diffraction of light, 7th Edition. Cambridge University Press; New York: 1999. [Google Scholar]
- [23].Oakley CG. Calculation of ultrasonic transducer signal-to-noise ratios using the KLM model. IEEE T. Ultrason. Ferr. 1997;44(5):1018–1026. [Google Scholar]
- [24].Szabo TL. Diagnostic ultrasound imaging: inside out, Biomedical engineering. Academic Press; Boston: 2004. [Google Scholar]


