Abstract
Cell-type specific gene regulation is key to gaining a full understanding of how the distinct phenotypes of differentiated cells are achieved and maintained. Here we examined how changes in transcriptional activation during alveolar epithelial cell (AEC) differentiation determine phenotype. We performed transcriptomic profiling using in vitro differentiation of human and rat primary AEC. This model recapitulates in vitro an in vivo process in which AEC transition from alveolar type 2 (AT2) cells to alveolar type 1 (AT1) cells during normal maintenance and regeneration following lung injury. Here we describe in detail the quality control, preprocessing, and normalization of microarray data presented within the associated study [1]. We also include R code for reproducibility of the referenced data and easily accessible processed data tables.
Keywords: AEC= alveolar epithelial cells, differentiation, transcriptomic analysis
Specifications
Direct link to deposited data SuperSeries (containing both datasets)
Experimental design, materials & methods
Human remnant lung selection and alveolar epithelial type 2 cell purification
Remnant human transplant lungs were obtained in compliance with Institutional Review Board-approved protocols for the use of human source material in research (HS-07-00660) and processed within 3 days of death. Rat AT2 cells were isolated in compliance with IACUC protocol #11360 from Sprague-Dawley male rats. Lungs were accepted from donors between 18 and 75 years of age with no history of smoking, negative serological cultures with the exception of CMV, EBV, and hepatitis (with confirmed vaccination record), not a current drug user, and a pO2 > 200 on 100% FIO2. Additionally, donor lungs were rejected for: heavy marijuana usage, any cancer present within the patient, and chest X-rays indicating pneumonia, asthma, emphysema, or chronic obstructive pulmonary disease (COPD). Also rejected were lungs on ventilators greater than 4 days, any presence of bacterial or viral meningitis, or the presence of MSRA. Human lung tissue was processed as previously described [2] and detailed cell purification techniques have also been described previously [1].
RNA Isolation
1 µg of RNA was converted into cRNA using the Illumina TotalPrep RNA amplification kit (Life Technologies, USA) and used for human (Illumina HT-12v4) or rat (RatRef-12) expression analysis at the Southern California Genotyping Consortium, University of California Los Angeles.
Basic Analysis
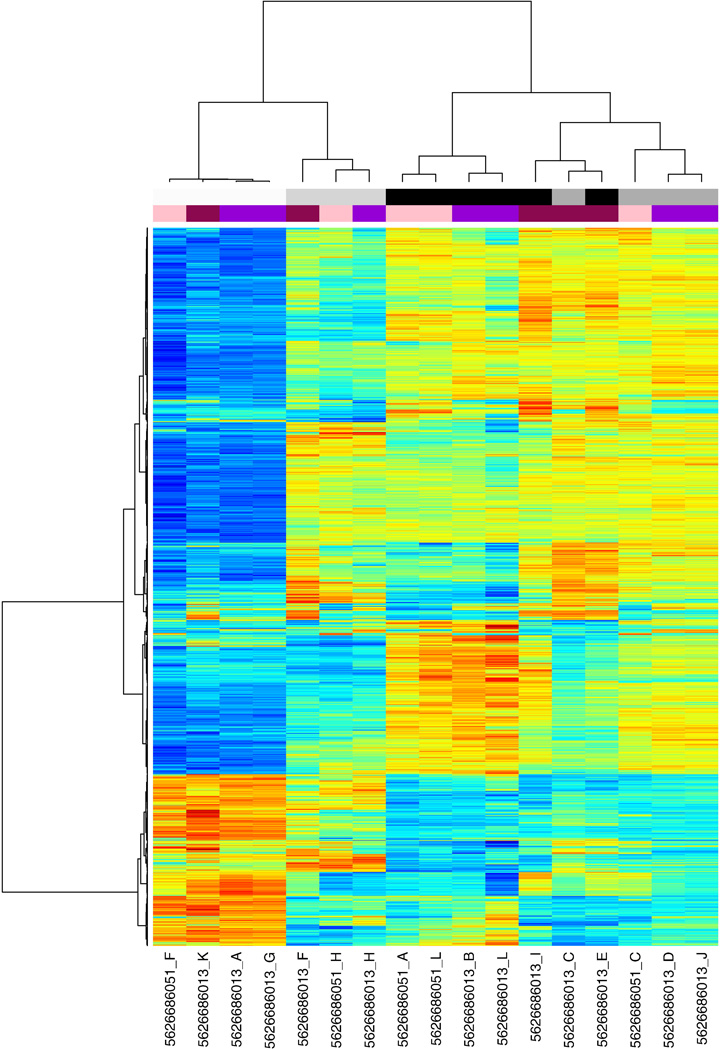
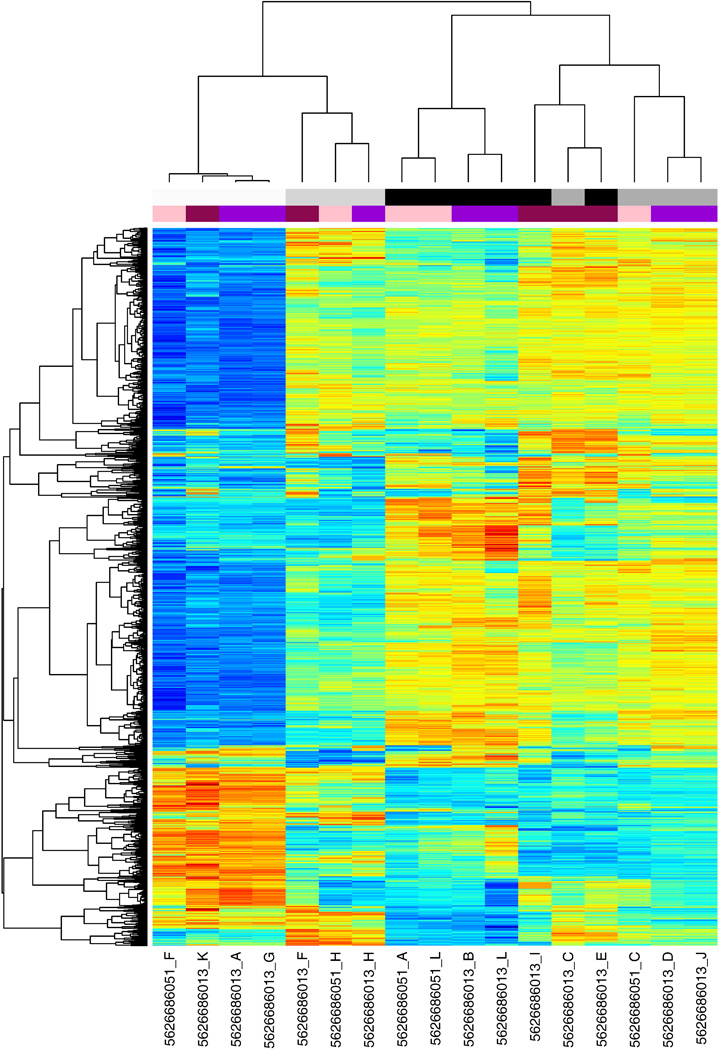
BeadStudio was used to convert images to raw signal data. Data files from BeadStudio were analyzed in R (version 2.11.1). Code for human expression analysis is included in Appendix A, code for expression analysis of rat is included in Appendix B. Briefly, the data was compiled into an eSet using the LUMI package [3] using metadata from Table 1 (human) and Table 5 (rat). Unique lumiIDs based on probe hybridization sequence were assigned to each probe using lumiHumanIDMapping. For the rat expression data, probes were filtered based on quality using the reMoat reannotation pipeline, available online at: http://www.compbio.group.cam.ac.uk/Resources/Annotation/ [4]. Raw data was checked for enrichment of p-values of less than 0.05, indicating significance above background false discovery using a matrix design (Table 2 for human and Table 6 for rat). Variant stabilization and normalization (VSN) was performed using the VSN package [5] to allow for a large number of differentially expressed genes. Statistical analyses were performed using LIMMA [6] with the technical replicates removed (Table 3, rat had no technical replicates). A linear regression model was fitted over the time-course of differentiation using lmFit, and t-tests performed between D0 and D8. False-discovery rate was controlled using the Benjamini-Hochberg (BH) correction [7]. R was used for principal component analysis and heatmap generation. Heatmaps were generated using Heatmap.plus in R by selecting the top 5% of probes most variant across the whole dataset and clustering with “average” linkage method. Clustering with different linkages, for example “ward” (Figure 1) and “complete” (Figure 2), resulted in comparable sample dendrograms. The list of significant differentially expressed genes is included as Table 4 (human) and Table 7 (rat). Pathways analysis was performed on genes with statistically significant differences in expression using IPA (Ingenuity Systems, www.ingenuity.com) or DAVID [8, 9]. Correlation of human and rat gene expression was performed using Entrez identifiers and the Mouse Genome Informatics (MGI) Web database [10], and the correlated microarrays (Table 8) were plotted against each other to reveal genes which were differentially expressed in human, rat, or both. Unique gene symbols were used to calculate overall numbers of genes significantly differentially expressed (Table 9).
Figure 1.
Unsupervised hierarchical clustering of human HT-12v4 normalized microarray data using the "ward" clustering method. The top 5% of variant probes across the dataset were included.
Figure 2.
Unsupervised hierarchical clustering of human HT-12v4 normalized microarray data using the "complete" clustering method. The top 5% of variant probes across the dataset were included.
Supplementary Material
Footnotes
Legends for Tables:
Table 1: Meta data for human AEC
Table 2: LIMMA design matrix human raw (includes technical replicates)
Table 3: LIMMA design matrix human clean (excludes technical replicates)
Table 4: List of differentially expressed genes in human AT2-> AT1 cell differentiation
Table 5: Meta data for rat AEC
Table 6: LIMMA design matrix rat
Table 7: List of differentially expressed genes in rat AT2-> AT1 cell differentiation
Table 8: Rat and human ENTREZ correlated probe information
Table 9: List of significantly differentially expressed genes in both human and rat
Legends to supplementary files:
Appendix A: Human Illumina HT12v4 Gene Expression data code in R
Appendix B: Rat RN1 Gene Expression data code in R
References
- 1.Marconett CN, Zhou B, Rieger ME, Selamat SA, Dubourd M, Fang X, Lynch SK, Stueve TR, Siegmund KD, Berman BP, Borok Z, Laird-Offringa IA. Integrated transcriptomic and epigenomic analysis of primary human lung epithelial cell differentiation. PLoS Genet. 2013;9:e1003513. doi: 10.1371/journal.pgen.1003513. [DOI] [PMC free article] [PubMed] [Google Scholar]
- 2.Ballard PL, Lee JW, Fang X, Chapin C, Allen L, Segal MR, Fischer H, Illek B, Gonzales LW, Kolla V, et al. Regulated gene expression in cultured type II cells of adult human lung. Am. J. Physiol. Lung Cell Mol. Physiol. 2010;299:L36–L50. doi: 10.1152/ajplung.00427.2009. [DOI] [PMC free article] [PubMed] [Google Scholar]
- 3.Du P, Kibbe WA, Lin SM. Lumi: A pipeline for processing Illumina microarray. Bioinformatics. 2008;24:1547–1548. doi: 10.1093/bioinformatics/btn224. [DOI] [PubMed] [Google Scholar]
- 4.Barbosa-Morais NL, Dunning MJ, Samarajiwa SA, Darot JF, Ritchie ME, Lynch AG, Tavaré S. A re-annotation pipeline for Illumina beadarrays: Improving the interpretation of gene expression data. Nucleic Acids Res. 2010;38:e17. doi: 10.1093/nar/gkp942. [DOI] [PMC free article] [PubMed] [Google Scholar]
- 5.Huber W, von Heydebreck A, Sültmann H, Poustka A, Vingron M. Variance stabilization applied to microarray data calibration and to the quantification of differential expression. Bioinformatics. 2002;18:S96–S104. doi: 10.1093/bioinformatics/18.suppl_1.s96. [DOI] [PubMed] [Google Scholar]
- 6.Smyth GK. Linear models and empirical Bayes methods for assessing differential expression in microarray experiments. Stat. Appl. Genet. Mol. Biol. 2004;3:Article3. doi: 10.2202/1544-6115.1027. [DOI] [PubMed] [Google Scholar]
- 7.Benjamini Y, Hochberg Y. Controlling the false discovery rate: a practical and powerful approach to multiple testing. J. R. Stat. Soc. 1995;57:289–300. [Google Scholar]
- 8.Huang DW, Sherman BT, Lempicki RA. Systematic and integrative analysis of large gene lists using DAVID bioinformatics resources. Nature Protoc. 2009;4:44–57. doi: 10.1038/nprot.2008.211. [DOI] [PubMed] [Google Scholar]
- 9.Huang DW, Sherman BT, Lempicki RA. Bioinformatics enrichment tools: paths toward the comprehensive functional analysis of large gene lists. Nucleic Acids Res. 2009;37:1–13. doi: 10.1093/nar/gkn923. [DOI] [PMC free article] [PubMed] [Google Scholar]
- 10.Mouse Genome Informatics (MGI) Web. The Jackson Laboratory; Bar Harbor, Maine: (URL: http://www.informatics.jax.org). [retrieved 2/2011]. [Google Scholar]
Associated Data
This section collects any data citations, data availability statements, or supplementary materials included in this article.


