Abstract
Recently, using the frog Xenopus laevis as a model system, we showed that transcription factor Rfx2 coordinates many genes involved in ciliogenesis and cell movement in multiciliated cells (Chung et al., 2014). To our knowledge, it was the first paper to utilize the genomic resources, including genome sequences and interim gene annotations, from the ongoing Xenopus laevis genome project. For researchers who are interested in the application of genomics and systems biology approaches in Xenopus studies, here we provide additional details about our dataset (NCBI GEO accession number GSE50593) and describe how we analyzed RNA-seq and ChIP-seq data to identify direct targets of Rfx2.
Keywords: Xenopus laevis, Rfx2, Ciliogenesis
Experimental Design, Materials and Methods
RNA-seq experiments
The detailed procedure for our sample preparation has been previously reported (Chung et al., 2014). Briefly, we injected 12 ng of morpholino into 4-cell stage X. laevis embryos to knock down Rfx2 expression; the morpholino sequence has been previously reported (Chung et al., 2014). We then prepared 100 animal caps (ectodermal explants of stage 10 X. laevis embryos, dissected with forceps), both for control samples and Rfx2 morphants, and cultured them until stage 20. The stage of animal caps was estimated by comparison against embryos from the same clutch. Total RNA was collected using the Trizol method, and then processed using a non-strand-specific Illumina RNA-seq library preparation kit with poly-A enrichment (TruSeq v2). We sequenced these libraries in a 2 × 50 bp paired-end configuration using an Illumina HiSeq 2000.
RNA-seq analysis
The Xenopus laevis genome project was ongoing when we collected these data, so for this study we used a draft genome sequence (JGI version 6.0 genome scaffolds; available at ftp://ftp.xenbase.org/pub/Genomics/JGI/Xenla6.0/) and annotation (‘Oktoberfest’ version of putative transcripts, mainly derived from RNA-seq de novo assembly and then confirmed against JGI version 6.0 genome scaffolds; see http://www.marcottelab.org/index.php/XENLA_Oktoberfest for more details). All scaffolds and transcripts are available at XenBase (ftp://xenbaseturbofrog.org/sequence_information/UTA/) and our supplementary website (http://www.marcottelab.org/index.php/ChungKwon2013_RFX2). Because it is easier for gene-level expression analysis, we conducted RNA-seq mapping against putative transcripts rather than the whole genome. Using bowtie1 (version 0.12.7)(Langmead et al., 2009), we mapped our RNA-seq reads to the Oktoberfest models (which contain 25,537 putative transcripts for each gene) using the longest transcript model for each locus. Then we used edgeR (Robinson et al., 2010) to identify differentially expressed genes, focusing on genes with greater than 2-fold difference and a false discovery rate less than 0.05.
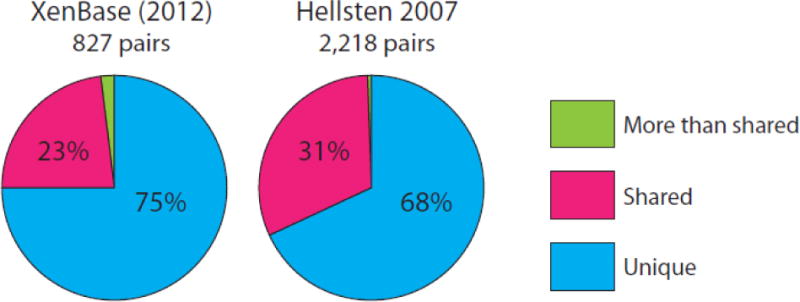
One of the challenges in X. laevis RNA-seq analysis is the presence of homoeologs, i.e. duplicated genes that arise as a result of allotetraploidy. Using an allowance of 2 mismatches within a 50-bp read (the ‘-v 2’ option in bowtie1), we evaluated how many reads were mapped interchangeably between homoeologs. We used two datasets for this test: (1) 827 gene pairs previously identified by a variety of labs and curated at XenBase using an ‘-a/-b’ gene name suffix (James-Zorn et al., 2013), and (2) 2,218 assembled EST pairs identified as involved in a trio relationship with X. tropicalis (Hellsten et al., 2007). As shown in Figure 1, 68 – 75% of reads were uniquely mapped and only 23 – 31% of reads were mapped to both duplicated genes. We were particularly interested in the differential expression between wild-type embryos and Rfx2 morphants. Thus, in order to maximize the expression signals in our analysis, we allowed for all possible hits in mapping with the ‘-a’ option (i.e. interchangeably mapped reads would be counted twice), and then conducted differential expression analysis. We also tested (1) randomly assigning multi-hit reads to a ‘best target’ and (2) using only uniquely mapped reads. Ultimately we found no major differences in differential analysis between these approaches (data not shown).
Figure 1.

Mapping results of RNA-seq reads on X. laevis homoeologs.
Out of 24,089 X. laevis transcripts detected in our RNA-seq experiments, 3,209 transcripts were down-regulated in the Rfx2 knockdown condition, and 1,523 transcripts were up-regulated. To perform functional network analysis using HumanNet (Lee et al., 2011), we converted these gene lists to human orthologs (based on EnsEMBL version 69). Note that initial orthology assignments are already captured by the X. laevis Oktoberfest transcript gene names, because as part of the transcript set construction, all X. laevis protein sequence candidates were compared to the reference proteome of five different species (human, mouse, zebrafish, chicken, and X. tropicalis) for the purpose of assigning gene names consistent with the human orthologs. For homoeologs, if only one of two duplicated genes was determined to be significantly differentially expressed but not the other, we still assigned the corresponding human gene as being differentially expressed. After converting all X. laevis genes into human orthologs, we identified 2,750 human candidate genes transcriptionally regulated by Rfx2.
ChIP-seq experiments
The detailed description of our ChIP-seq sample preparation has been previously reported (Chung et al., 2014). Briefly, we injected mRNA encoding GFP-tagged Rfx2 into 4-cell stage X. laevis embryos and then pulled down the tagged protein with α-GFP antibody (ab290) from 600 whole embryos (stage 20). Before immunoprecipitation, we cross-linked Rfx2-genomic DNA complexes with 1% formaldehyde and fragmented them with a Branson 450 Sonifier (expected fragment size was from 200 to 500 bp). As a control, we injected GFP messenger RNAs alone and conducted the same immunoprecipitation procedure. DNA fragments were extracted with phenol-chloroform and purified with a QIAquick PCR purification kit (Qiagen). Sequencing libraries were prepared with a standard Illumina genomic library construction kit (TruSeq) and sequenced with an Illumina HiSeq 2000 in 1 × 50 bp configuration.
ChIP-seq data analysis
Similar to the RNA-seq data analysis, we conducted ChIP-seq analysis to discriminate between homoeolog genes. We applied a more stringent criteria for ChIP-seq read mapping, requiring uniquely mapped reads to the genome scaffold (JGI version 6.0) and a maximum of 2 mismatches within the seed sequence (i.e. the ‘-m 1 -n 2’ options in bowtie1 (Langmead et al., 2009)). For peak calling, we used MACS (version 1.4.2) with default options (Zhang et al., 2008).
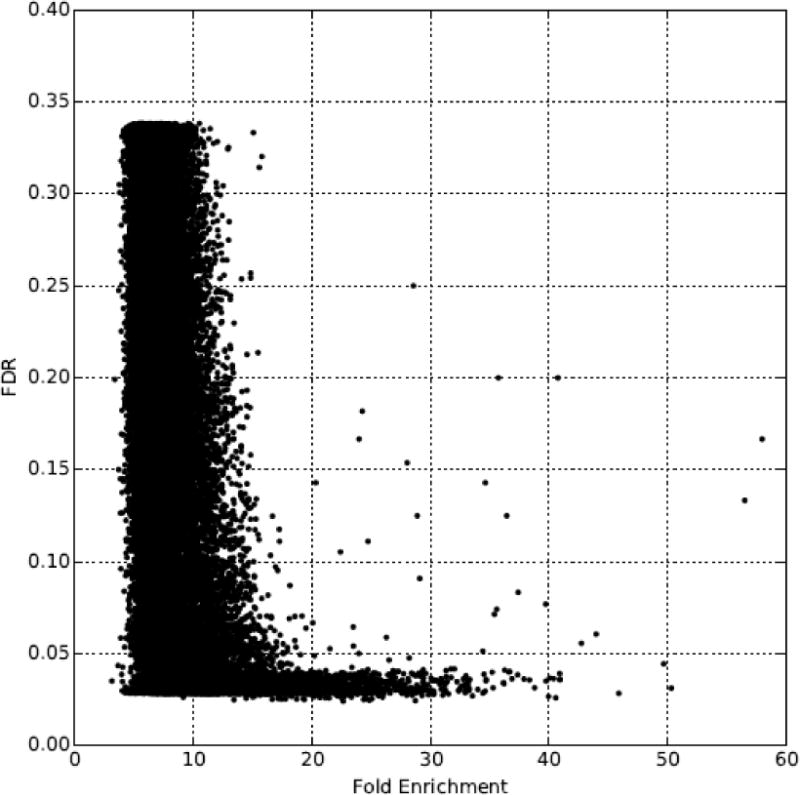
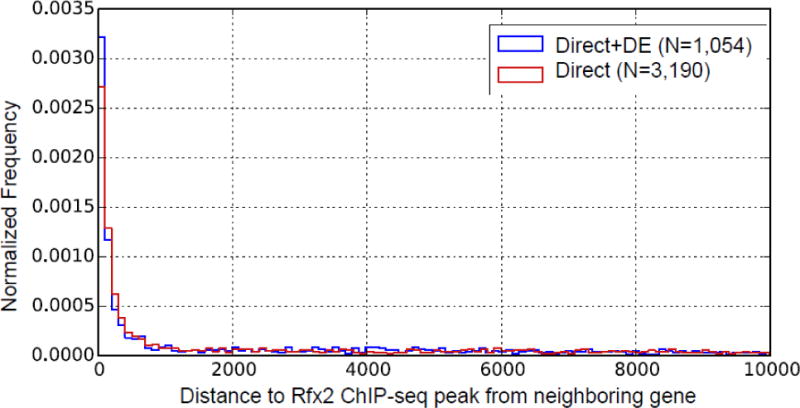
We initially determined significant Rfx2-bound peaks by using a false discovery rate (FDR) cutoff (< 0.05) reported by MACS. However, as shown in Figure 2, only a few peaks demonstrated an FDR above 0.05 if the fold enrichment of the peak was greater than 20, so we included these peaks as well in our further analysis. For each peak, we assigned the closest protein-coding gene as its target gene, so long as it was within 10 kb. As shown in Figure 3, most of these peaks were located less than 1,000 bp from the transcript start site of their assigned gene, suggesting that, if anything, our criteria for associating ChIP-seq peaks to target genes were over-generous.
Figure 2. Distribution of fold enrichment and false discovery rate (FDR) in ChIP-seq peak calling.

Most peaks with greater than 20 fold enrichment exhibit an FDR less than 0.05. Based on this observation, we included peaks with FDR greater than 0.05 in successive analyses if they exhibited a fold enrichment greater than 20.
Figure 3. Distance between ChIP-seq-identified Rfx2 binding sites and nearby genes.

“Direct+DE” represents genes that have an Rfx2 binding peak and a significantly differentially expressed pattern in the Rfx2 knockdown condition. “Direct” represents genes that have an Rfx2 binding peak but lack significant differential expression in Rfx2 knockdown. In both cases, however, most peaks are located less than 1,000 bp away from annotated genes.
Out of 29,448 peaks identified in total, 6,646 peaks were selected for further study that exhibited either an FDR < 5% or a fold-enrichment > 20, and 5,024 of those peaks were assigned to their neighboring genes. As with our RNA-seq data analysis, we converted the 5,024 X. laevis target gene IDs to human genes, collapsing duplicated genes into a single human ortholog based on their names. This analysis resulted in a final set of 911 putative directly bound Rfx2 target genes that also showed significantly differential gene expression after Rfx2 knockdown (Chung et al. 2014). A list of all 911 genes is available in Supplemental File 1 in our previous report (Chung et al., 2014).
Specifications.
| Organism/cell line/tissue | Xenopus laevis animal caps (dissected ectoderm) or whole embryos |
| Sex | Not specified |
| Sequencer or array type | Illumina HiSeq2000 |
| Data format | FASTQ (raw); tab-delimited text files (processed) |
| Experimental factors | RNA-seq: wild-type control vs Rfx2 morphants (100 animal caps at developmental stage 20) ChIP-seq: GFP vs Rfx2-GFP (600 whole embryos at developmental stage 20) |
| Experimental features | Very brief experimental description |
| Consent | All raw sequencing data are free to use. Genome and gene annotation data is free to use for high-throughput experiment data analysis, such as RNA-seq, ChIP-seq, or proteomics. Otherwise, please contact us (Edward Marcotte marcotte@icmb.utexas.edu) or a member of the International Xenopus Genome Consortium (Daniel Rokhsar dsrokhsar@lbl.gov or Masanori Taira m_taira@biol.s.u-tokyo.ac.jp). |
| Sample source location | N/A |
Acknowledgments
This work was supported by grants to J.B.W. from the NIH/NIGMS and NIH/NHLBI; to J.C.B. from the NIH/NIGMS; and to E.M.M. from the NIH/NIGMS, the NSF, the Cancer Prevention Research Institute of Texas, the U.S. Army (58343-MA), and the Welch Foundation (F1515). J.B.W. is an Early Career Scientist of the Howard Hughes Medical Institute.
Footnotes
Publisher's Disclaimer: This is a PDF file of an unedited manuscript that has been accepted for publication. As a service to our customers we are providing this early version of the manuscript. The manuscript will undergo copyediting, typesetting, and review of the resulting proof before it is published in its final citable form. Please note that during the production process errors may be discovered which could affect the content, and all legal disclaimers that apply to the journal pertain.
Direct link to deposited data
References
- Chung MI, Peyrot SM, LeBoeuf S, Park TJ, McGary KL, Marcotte EM, Wallingford JB. RFX2 is broadly required for ciliogenesis during vertebrate development. Dev Biol. 2012;363:155–165. doi: 10.1016/j.ydbio.2011.12.029. [DOI] [PMC free article] [PubMed] [Google Scholar]
- Chung MI, Kwon T, Tu F, Brooks ER, Gupta R, Meyer M, Baker JC, Marcotte EM, Wallingford JB. Coordinated genomic control of ciliogenesis and cell movement by RFX2. Elife. 2014;3:e01439. doi: 10.7554/eLife.01439. [DOI] [PMC free article] [PubMed] [Google Scholar]
- Harland RM, Grainger RM. Xenopus research: metamorphosed by genetics and genomics. Trends Genet. 2011;27:507–515. doi: 10.1016/j.tig.2011.08.003. [DOI] [PMC free article] [PubMed] [Google Scholar]
- Hellsten U, Khokha MK, Grammer TC, Harland RM, Richardson P, Rokhsar DS. Accelerated gene evolution and subfunctionalization in the pseudotetraploid frog Xenopus laevis. BMC Biol. 2007;5:31. doi: 10.1186/1741-7007-5-31. [DOI] [PMC free article] [PubMed] [Google Scholar]
- James-Zorn C, Ponferrada VG, Jarabek CJ, Burns Ka, Segerdell EJ, Lee J, Snyder K, Bhattacharyya B, Karpinka JB, Fortriede J, et al. Xenbase: expansion and updates of the Xenopus model organism database. Nucleic Acids Res. 2013;41:D865–70. doi: 10.1093/nar/gks1025. [DOI] [PMC free article] [PubMed] [Google Scholar]
- Langmead B, Trapnell C, Pop M, Salzberg SL. Ultrafast and memory-efficient alignment of short DNA sequences to the human genome. Genome Biol. 2009;10:R25. doi: 10.1186/gb-2009-10-3-r25. [DOI] [PMC free article] [PubMed] [Google Scholar]
- Lee I, Blom UM, Wang PI, Shim JE, Marcotte EM. Prioritizing candidate disease genes by network-based boosting of genome-wide association data. Genome Res. 2011;21:1109–1121. doi: 10.1101/gr.118992.110. [DOI] [PMC free article] [PubMed] [Google Scholar]
- Robinson MD, McCarthy DJ, Smyth GK. edgeR: a Bioconductor package for differential expression analysis of digital gene expression data. Bioinformatics. 2010;26:139–140. doi: 10.1093/bioinformatics/btp616. [DOI] [PMC free article] [PubMed] [Google Scholar]
- Stubbs JL, Oishi I, Izpisúa Belmonte JC, Kintner C. The forkhead protein Foxj1 specifies node-like cilia in Xenopus and zebrafish embryos. Nat Genet. 2008;40:1454–1460. doi: 10.1038/ng.267. [DOI] [PMC free article] [PubMed] [Google Scholar]
- Stubbs JL, Vladar EK, Axelrod JD, Kintner C. Multicilin promotes centriole assembly and ciliogenesis during multiciliate cell differentiation. Nat Cell Biol. 2012;14:140–147. doi: 10.1038/ncb2406. [DOI] [PMC free article] [PubMed] [Google Scholar]
- Zhang Y, Liu T, Meyer CA, Eeckhoute J, Johnson DS, Bernstein BE, Nusbaum C, Myers RM, Brown M, Li W, et al. Model-based analysis of ChIP-Seq (MACS) Genome Biol. 2008;9:R137. doi: 10.1186/gb-2008-9-9-r137. [DOI] [PMC free article] [PubMed] [Google Scholar]


