Abstract
In anthropoid primates, cells in the magnocellular and parvocellular layers of the dorsal lateral geniculate nucleus (dLGN) are distinguished by unique retinal inputs, receptive field properties and laminar terminations of their axons in visual cortex. To identify genes underlying these phenotypic differences, we screened RNA from magnocellular and parvocellular layers of adult macaque dLGN for layer-specific differences in gene expression. Real time quantitative RT-PCR and in situ hybridization were used to confirm gene expression in adult and fetal macaque. Cellular localization of gene expression revealed eleven new layer-specific markers, of which ten were enriched in magnocellular layers (BRD4, CAV1, EEF1A2, FAM108A1, INα, KCNA1, NEFH, NEFL, PPP2R2C, and SFRP2) and one was enriched in parvocellular and koniocellular layers (TCF7L2). These markers relate to functions involved in development, transcription and cell signaling, with Wnt/β-catenin and neurofilament pathways figuring prominently. A subset of markers was differentially expressed in the fetal dLGN during a developmental epoch critical for magno- and parvocellular pathway formation. These results provide new evidence for the molecular differentiation of magnocellular and parvocellular streams through the primate dLGN.
Keywords: Axon targeting, Cell signaling, Cytoarchitecture, Plasticity, Transcriptome, Vision
Introduction
In the primate visual system, information is conveyed to the cerebral cortex via the dorsal lateral geniculate nucleus (dLGN) of the thalamus along parallel pathways comprised of neurons with distinct morphologies, connections, neurochemical and physiological characteristics (Jones, 2007). The dLGN of old World monkeys, apes and humans is comprised of six distinct cellular layers recognizable on the basis of neuronal size and connections. The magnocellular layers, 1 and 2, which receive afferents from contralateral and ipsilateral retinas respectively, are innervated by axons of parasol retinal ganglion cells and project to layers 4Cα and 6 of primary visual cortex. The parvocellular layers, 3-6, which receive afferents from contralateral (layers 4 and 6) and ipsilateral (layers 3 and 5) retinas, are innervated by midget ganglion cells, and project to layers 4A and 4Cβ of primary visual cortex. A third set of cells, comprised of konicellular neurons localized in the S layers and interlaminar plexuses, receives input from other retinal ganglion cells and project to superficial layers of striate cortex as well as to extrastriate areas (Sincich et al., 2004; Sincich and Horton, 2005). An extensive literature has documented the physiological properties that differentiate magnocellular and parvocellular neurons of the macaque dorsal lateral geniculate nucleus and this has lead to the notion of parallel streams of visual function (for review: Kaplan, 2004). By comparison, much less is known about the konicellular pathway (Hendry and Reid, 2000; Callaway, 2005).
While considerable progress has been made in our understanding of underlying anatomical circuitry and functional properties that distinguish magnocellular from parvocellular layers of the macaque monkey dLGN, our knowledge of the molecular markers expressed by neurons in these layers is still rudimentary. Such information would be valuable for several reasons. It could provide a means by which homologies between magnocellular and parvocellular geniculate cells could be established among different species. Molecular markers differentiating neurons in the major layers of the monkey dLGN could also provide a means for monitoring visual system development and plasticity. Moreover, since magno- and parvocellular directed axons are segregated into their distinct cellular regions from the earliest period of development (Meissirel et al., 1997), such information could also prove relevant for unraveling the molecular cues that lead to the formation of these functional streams.
To probe the molecular basis of magno- and parvocellular pathways, in the present study we employed a genome wide transcriptional analysis of dLGN layers followed by confirmation of expression by RT-PCR and cellular mapping by in situ hybridization. We report identification of eleven new layer-specific dLGN markers in the adult macaque. Functional pathway analysis of these markers implicates Wnt/β-catenin and neurofilament signaling as fundamentally involved in the remarkable morphological and functional specificity of dLGN lamination. We also provide evidence for the differential expression of a subset of these markers in the fetal monkey during a period when retinal axons have been reported to selectively innervate magno- and parvocellular segments of the geniculate anlage (Meissirel et al., 1997).
Methods
Animals
Brains from seven adult male monkeys (Macaca mulatta) and two fetal monkeys (Macaca fascicularis) at embryonic day 55 (E55) were used. Timed-pregnancies were determined according to previously reported procedures (Warland et al., 2006). Gestational ages could be estimated to within ±2 days with E1 corresponding to the first 24 hrs following mating. All procedures were carried out using protocols approved by the Institutional Animal Care and Use Committee.
dLGN Microdissection
Freshly removed adult brains were chilled and cut into 5 mm thick coronal slices that were flash frozen between liquid nitrogen cooled aluminum plates. Punches, approximately 1 mm in diameter were taken from frozen slices containing the dLGN, using a sharpened, blunt ended 15 gauge hypodermic needle. The slices from which the punches were taken were brought to 4°C, immersed in 4% paraformaldehyde in 0.1 M phosphate buffer, cryoprotected in 30% sucrose, refrozen and later sectioned on a sliding microtome at 25 μm. Sections were stained by the Nissl method and used to localize punches to dLGN layers. Samples from the magnocellular layers were confined to those layers; samples from the parvocellular layers included cells of the interlaminar plexuses.
RNA Isolation
Total RNA was isolated from the tissue-punches using Trizol reagent (GibCo BRL, Gaithersburg, MD), followed by affinity column purification (Qiagen, Valencia, CA). RNA purity was determined by spectrophotometry and by using an Agilent 2100 Bioanalyzer (Agilent Technologies, Palo Alto, CA). To obtain enough probe for Affymetrix microarrays, 100 ng of total RNA from each sample was subjected to 2 rounds of T7-based linear amplification (Van Gelder et al., 1990) using the MessageAmp™ II aRNA Amplification Kit (Ambion, Austin, TX). A separate set of punches from magnocellular and parvocellular layers was used to isolate total RNA as above, but without amplification. This RNA was used in RT-PCR experiments. Frozen samples of visual cortex and dorsal thalamus, including both magno- and parvocellular layers of dLGN, were used to isolate total RNA as above, without the amplification step. This RNA was later utilized for generating riboprobes for in situ hybridization histochemistry.
Microarray Hybridization
RNA samples were processed for microarray analysis according to the sample labeling, hybridization and scanning procedures recommended by Affymetrix (Santa Clara, CA). This entails the synthesis of double stranded cDNA from the mRNA pool of isolated cellular total RNA, followed by in vitro transcription and labeling of cRNA. U133A Plus 2.0 human arrays were used for all samples. Three replicates of each set of layers from two monkeys for a total of 12 arrays were used.
Microarray Analysis
Initial analysis was performed using Affymetrix Microarray Suite 5.0 (MAS5) software to determine the quality of the microarray data. Percent present calls, background noise (Q), the scaling factor and the ratio of 3′/5′ hybridization for glyceraldehyde 3-phosphate dehydrogenase (GAPDH) were used to assess quality of hybridization (Table 1). Significant variability across samples was determined by ANOVA (Table 1). For subsequent analyses, Affymetrix Cel files were preprocessed by robust multichip analysis using GeneSpring GX (v. 7.3.1) software (Agilent Technologies, Foster City, CA) followed by “per gene” and “per chip” median polishing. Parvocellular and magnocellular enriched genes were identified using fold expression difference and p value cutoffs.
Table 1.
MAS5 Quality Control Measures
| Mean ± SEM | ANOVA P Value | |
|---|---|---|
| Percent present | 21 ± 0.5 | 0.6 |
| Noise (RawQ) | 3.9 ± 0.3 | 1.0 |
| Scaling Factor | 5.7 ± 0.3 | 0.4 |
| GAPDH (3′/5′) | 10.8 ± 0.8 | 0.3 |
Ingenuity Pathways Analysis (IPA)
A data set containing expression values and gene identifiers (microarray data) or gene identifiers alone (confirmed cell-specific dLGN markers) was uploaded into the online IPA software application. Each gene identifier was mapped to its corresponding gene object in the Ingenuity Pathways Knowledge Base. For microarray data, a fold difference of 1.5 and a p value of less than 0.05 were used to identify genes whose expression was significantly differentially regulated. These genes, called focus genes, were overlaid onto a global molecular network developed from information contained in the Ingenuity Pathways Knowledge Base. Networks of these focus genes were then algorithmically generated based on their connectivity. A second data set containing genes with known cellular expression patterns was also interrogated using IPA software.
Analysis of function identified biological processes and/or diseases that were significantly overrepresented by genes associated with the data set. Fisher’s exact test was used to calculate a p value determining the probability that each biological function and/or disease assigned to that data set was due to chance alone.
Real-time PCR
Real-time PCR was performed using an iCycler (BioRad, Hercules, CA) to measure incorporation of the fluorescent dye SYBR Green I. For each reaction a master mix of the following was made: 1X PCR buffer (Qiagen, Valencia, CA), 400 mM dNTP, 0.5 mM forward and reverse primers (Operon, Huntsville, AL), 0.01X SYBR Green I (Invitrogen Molecular Probes, Eugene, OR), 1.5 mM MgCl2, 10 nM FITC (BioRad, Hercules, CA), and 1 unit Taq DNA polymerase (Qiagen, Valencia, CA). All PCRs were optimal for the following cycle conditions, 94°C (15 min), 60°C (30 sec), 72°C, (30 sec) and were run for 40 cycles. Following the PCR a melting curve analysis was performed to confirm the specificity of the PCR reaction. In addition, samples of the PCR reactions were subjected to electrophoresis to verify product size and specificity. The relative quantification of RNA targets was performed as follows: The threshold cycle (Ct) at which a gene of interest first rose above background was determined and subtracted from that of the housekeeping gene, βActin, the PCR for which was performed in a separate reaction tube. This was termed ΔCt. The ΔCt for each reaction was then subtracted from the control tissue sample and this ΔΔCt value was plotted as 2-ΔΔCt. Therefore all values are for RNA expression normalized to βActin mRNA and a control tissue. Oligonucleotide primers used for PCR are listed in Table 2.
Table 2.
RT-PCR Primers
| Gene Symbol |
Acc. #1 | Sense Primer2 | Antisense Primer2 |
|---|---|---|---|
| TPBG | BC037161 | TCTCCCACCTCCTCGGCATCC | TGGGCAGATGCTCGAAGGCGC |
| TFE3 | BC026027 | GTCTCATGCGGCCGAACCAGC | TGGGCCCGCATTAGCTGCTGC |
| TCF7L2 | BC032656 | CGCCTCGCTCCGAAAGTTTCC | CCGGCGTGAAGTGTTCATTGC |
| SFRP2 | BC008666 | GCTCGCTGCTGCTGCTCTTCC | CAGAGCGAGTGGCATGGCTGG |
| PPP2R2C | BC032954 | TCCATCCGCACCACTGCAACC | TGACGCTGTCGCTCCCGTTCC |
| OPLAH | BC150206 | CGAGGGCCGCTTCCACTTTGC | GCTTGGGTGCCAATGTGCAGC |
| ODZ3 | AK001336 | CGCCCATCTTCGGAGTCCAGC | TGCCGTTCTCCAGCGCCTTGC |
| NEFM | NM_005382 | TCGAGCTTCAGCCGCGTCAGC | TCTCCTGGTCGTACGCGTCGC |
| NEFL | NM_006158 | CTCGACCTCCTACAAGCGGCG | AGCACCAGCAGCTCGGCTTCC |
| NEFH | NM_021076 | ATGATGAGCTTCGGCGGCG | ACCTTGTCGATGTACCCGGCG |
| KCNA1 | BC101733 | AGAACGTGGACGAGGCTTCGG | CCCGGAACTTCTCCATGGCC |
| INα | BC003659 | GCTTCGGCTCGGAGCACTACC | CGATGAACACGGCGAAGCGG |
| FAM108A1 | BC071644 | CTGCTGCCTCTTCTGCTGCCC | TGCCGTGCGAGAAGAGGACCG |
| EEF1A2 | BC018855 | TCAACATCGTGGTCATCGGCC | CCATTCTTGGAGATGCCCGCC |
| CAV1 | BC082246 | GCACAGCCCAGGGAAACCTCC | TCTCCTTGGTGTGCGCGTCG |
| BRUNOL4 | BC045711 | CCTCAGTACCAACGGGCTCGG | TCGCTGTCCGCAGGCTTCACC |
| BRD4 | BC091649 | GCATCGACTCCTCCGCAGACC | TTCACAGGCCGGCTGCTCTCC |
Public database source sequence accession numbers.
Oligonucleotide primers are listed in 5′ to 3′ orientation.
Riboprobes
Oligonucleotide primers flanking 300-400 bp of the coding region for each gene interrogated were designed using Vector NTi Advance software (version 10.3) (Invitrogen Corporation, Carlsbad, CA). Each primer pair and the associated GenBank accession number are listed in Table 2. Target genes were amplified by PCR using cDNA obtained from combined visual cortex and dorsal thalamic total RNA and subcloned into PCRII-Topo (Invitrogen Corporation, Carlsbad, CA). Antisense cRNA probes were generated from linearized plasmids using either T7 or SP6 RNA polymerase in the presence of 35S-UTP.
In situ hybridization histochemistry
Tissue from adult monkey brain, used for in situ hybridization, was generated from 5 mm thick coronal brain slices, obtained in the same manner as those used for dLGN punches, but raised to 4°C and fixed in fresh 4% paraformaldehyde for 24 hrs. The fixed slices were cryoprotected in 30% sucrose in 0.1 M phosphate buffer at 4°C and frozen sections, 25 μm thick, were cut on a sliding microtome and post-fixed in fresh 4% paraformaldehyde at 4°C for at least 7 days. Prior to hybridization, sections were rinsed in saline, sodium citrate (SSC; 1x SSC consists of 0.88% NaCl and 0.44% Na3C6H5O3·2H2O) and treated with proteinase K followed by acetic anhydride in 0.1M triethanolamine. After two brief rinses in SSC, sections were incubated in hybridization buffer containing 50% formamide, 10% dextran sulfate, 0.7% polyvinyl pyrolidone, 0.7% bovine serum albumin, 0.7% Ficoll, 0.15 mg/ml yeast tRNA, 0.33 mg/ml denatured herring sperm DNA, and 20 μM dithiothreitol and then transferred to fresh hybridization buffer containing an additional 20 μM dithiothreitol and the 35S -labeled antisense riboprobe at 10 × 106 cpm/ml (24 hours, 60°C). Following hybridization sections were rinsed in SSC, treated with ribonuclease A for 30 min at 45°C, and washed through a series of descending concentrations of SSC. Sections were mounted onto Vectabond (Vector Laboratories, Burlingame, CA)-treated slides and exposed to Kodak autoradiographic film (Amersham Biosciences, Piscataway, NJ). For each gene examined, sense strand specific cRNA probes were generated and hybridized to a series of sections as controls.
Tissue from embryonic monkey brain, processed for in situ hybridization, was obtained from fresh brain that had been removed and immediately immersed in fresh, ice-cold, 4% paraformaldehyde for four days. Following fixation, brains were rinsed in 0.1 M phosphate buffered saline and cryoprotected in 30% sucrose in phosphate buffered saline at 4°C. Prior to sectioning, brains were embedded in OCT (Ted Pella, Torrence, CA) and frozen. Brain sections were cut at 12 μm, on a Leica (Deerfield, IL) cryostat and mounted onto poly-L-lysine coated glass slides (Sigma, St Louis, MO) then stored at −80°C in desiccated containers until further processing. On the day of in situ hybridization slide mounted sections were warmed to room temperature and processed using solutions and incubation times detailed above for free floating adult tissue sections.
Digital images of film autoradiographs were acquired using a Power Phase FX digital camera (Phase One, Melville, NY). Images (10,500 × 12,600) were saved as TIFF files and optimized for contrast and size only in Adobe Photoshop (v6.0, Adobe Systems Inc, San Jose, CA). Subsequently, images were composed into figures using Adobe Illustrator CS2 (Adobe Systems Inc.).
Quantification of in situ hybridization histochemistry
Quantitative measurements of film autoradiographs were made by densitometric analysis using the MCID imaging system (Imaging Research, St. Catharine’s, Ontario). Optical density readings from each dLGN layer were normalized to 14C reference standards exposed on the same film. Mean values for each dLGN layer were obtained from 2-5 sections from 3-5 different animals. Statistical significance, p < 0.05, was determined by analysis of variance (ANOVA) with repeated measures and post-hoc students t-test using Excel software (Microsoft Corp., Redmond, WA).
Immunohistochemistry
Sections, 25 μm thick, were obtained from coronal brain slices as for in situ hybridization, but were placed directly into 0.1 M phosphate buffer, pH 7.4, and maintained at 4°C for no longer than 7 days. Sections were immersed for 1 hour in blocking buffer (0.1 M phosphate buffer, pH 7.4, 0.25% Triton X-100, 10 % normal horse serum) at room temperature then transferred to antibody incubation buffer (0.1 M phosphate buffer, pH 7.4, 0.25% Triton X-100, 5% normal horse serum) containing 1 or 2 primary antibody(ies) at empirically derived dilutions (Table 3) and incubated overnight at 4°C. The following day, sections were rinsed in 0.1 M phosphate buffer and transferred to antibody incubation buffer containing either biotin- (Vector Laboratories, Burlingame, CA), Alexa Fluor 488-(Invitrogen, Molecular Probes, Eugene, OR), or Alexa Fluor 568- (Invitrogen, Molecular Probes, Eugene, OR) conjugated secondary antibody(ies). After 1 hour incubation at room temperature, sections bound with biotinylated antibody were rinsed in 0.1 M phosphate buffer, incubated in avidin-biotin-peroxidase complex (ABC, Vector Laboratories, Burlingame, CA) for 1 hour at room temperature then rinsed and reacted with 0.02% 3, 3′-diaminobenzidine 4HCL (DAB, Sigma Aldrich, St. Louis, MO) and 0.03% hydrogen peroxidase in 0.1 M phosphate buffer, pH 7.4. After brief washes in 0.1 M phosphate buffer, sections were mounted onto glass slides, air dried, dehydrated in ascending alcohols, cleared with xylene and finally coverslipped with DPX mounting medium (BDH, Poole, UK). Sections incubated in fluorescently conjugated secondary antibody(ies) were washed in 0.1 M phosphate buffer, mounted onto glass slides and coverslipped with Prolong Antifade (Invitrogen, Molecular Probes, Eugene, OR) supplemented with Hoechst 33342 (Invitrogen, Molecular Probes, Eugene, OR). Immunoperoxidase staining of sections through the dLGN was carried out using monoclonal antibodies SMI-32 and Cat-301 and a polyclonal antibody raised against transcription factor 7-like-2 (TCF7L2) (Table 3). Selected sections through the dLGN were used for double immunofluorescent staining with antibodies against TCF7L2 and the alpha subunit of type II calcium/calmodulin-dependent protein kinase (CAMK2A) (Table 3).
Table 3.
Primary Antibodies
| Antibody | Ab Type | Host | Source | Cat. # | Dilution | Antigen | Reference(s) |
|---|---|---|---|---|---|---|---|
| SMI-32 | Monoclonal | mouse | Covance1 | SMI-32R | 1:1000 | Non-phosphorylated neurofilament-H and —M from dissected hypothalamus |
(Sternberger et al., 1982; Sternberger and Sternberger, 1983) |
| Cat-301 | Monoclonal | mouse | Chemicon2 | MAB5284 | 1:2000 | Chondroitin sulfate proteoglycan from dissected, formaldehyde fixed, spinal cord gray matter |
(McKay and Hockfield, 1982; Zaremba et al., 1989) |
| CAMK2A | Monoclonal | mouse | Chemicon2 | 05-532 | 1:1000 | Affinity column purified rat CAMK2A | (Erondu and Kennedy, 1985) |
| TCF7L2 | Polyclonal | Rabbit | Zymed3 | 34-3800 | 1:200 | Human TCF7L2 N-terminal (aa 31-331) synthetic peptide |
(Barker et al., 1999) |
Covance; Princeton, NJ
Millipore (formerly Chemicon International), Temecula, CA
Zymed Laboratories Inc., South San Francisco, CA.
Digital images of immunoperoxidase stained sections were acquired either by scanning slides at high resolution (0.5 μm/pixel) using a Aperio T3 ScanScope (Aperio, Vista, CA) or by using a Nikon Eclipse 1000 microscope (Nikon Inc., Melville, NY), equipped with a Quantix CCD digital camera (Photometrics, Tuscon, AZ). Acquired images were saved as TIFF files. Images of fluorescently labeled sections were obtained with a Zeiss LSM 510 META laser scanning confocal microscope (Carl Zeiss Microimaging Inc., Thornwood, NY) using a Zeiss Plan-Neofluar 25X/0.8 Corr DIC objective with oil immersion. Sections were imaged at optical resolutions of 0.31 μm (Alexa 488 channel) and 0.35 μm (Alexa 568 channel) in the x and y axes. Stacks of 0.7 μm optical slices (z axis optical resolution ∼ 2 μm) were collapsed and saved as single TIFF image files. All digital images obtained were exported into Adobe Photoshop CS2 (Adobe Systems, San Jose, CA) where they were cropped and adjusted for brightness and contrast only. Final editing was performed using Adobe Illustrator CS2 (Adobe Systems).
Results
Molecular differentiation of magnocellular and parvocellular layers of the adult monkey dLGN
RNA isolated from punches confined to either magnocellular or parvocellular (with koniocellular) layers of monkey dLGN (Figure 1) and hybridized to Affymetrix human microarrays identified a set of differentially expressed genes. The characteristics of hybridization were similar to those previously observed for monkey RNA on human Affymetrix microarrays (Murray et al., 2007). Qualitative control measures detected no significant differences across individual microarrays as judged by percent present calls, the scaling factor or level of noise (RawQ) determined using Affymetrix MAS5 software (Table 1). The distribution of normalized expression data was not different across GeneChips (Figure 2).
Figure 1.
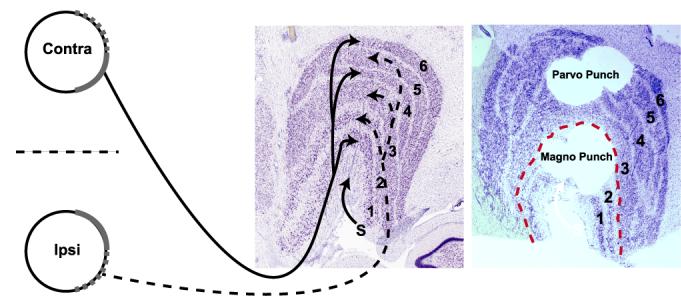
A schematic diagram identifying the target dLGN layers harvested for microarray analysis (Left). Contralateral and ipsilateral retinal ganglion cell axons originate from nasal and temporal retinal ganglion cells respectively and terminate in layers 1, 4 and 6 (contralateral) or 2, 3 and 5 (ipsilateral) of the dLGN, visualized here by Nissl staining. Axons terminating in outer (1 and 2) and inner (3-6) layers form the magno- and parvocellular visual streams respectively. The S layers are indicated (arrow). Magnocellular and parvocellular layers after microdissection with tissue punches is shown by post—hoc Nissl staining (Right).
Figure 2.
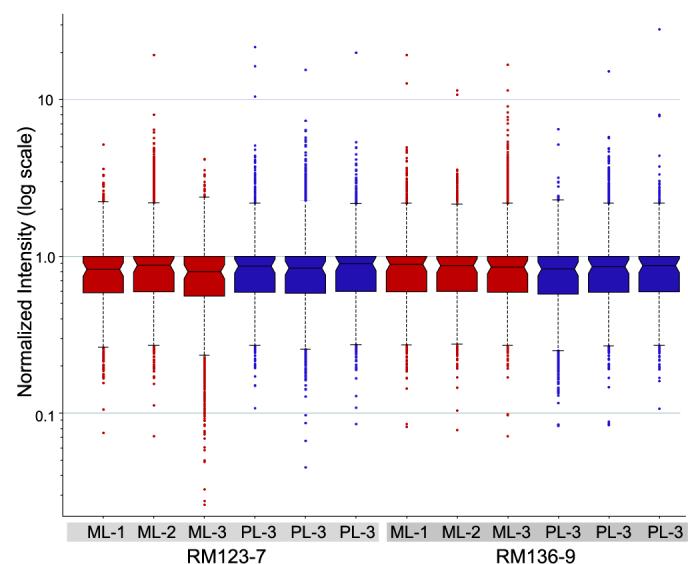
Distribution of normalized microarray data. Box plots representing robust multichip analysis and median polished gene expression data show a lack of variability in distribution between individual GeneChips. Samples from magnocellular (ML, red) or parvocellular (PL, blue) layers showed similar distributions in biological replicates (monkey RM123-7 versus monkey RM136-9) and between technical replicates within the same monkey.
Genes that were overrepresented in magnocellular or parvocellular (with koniocellular) layers by a fold difference of at least 1.5 and a p value less than 0.05 were identified by volcano plot analysis (Figure 3, Supplemental Table 1). A total of 50 genes met these criteria and the overwhelming majority was greater in magnocellular than in parvocellular layers (Figure 3).
Figure 3.
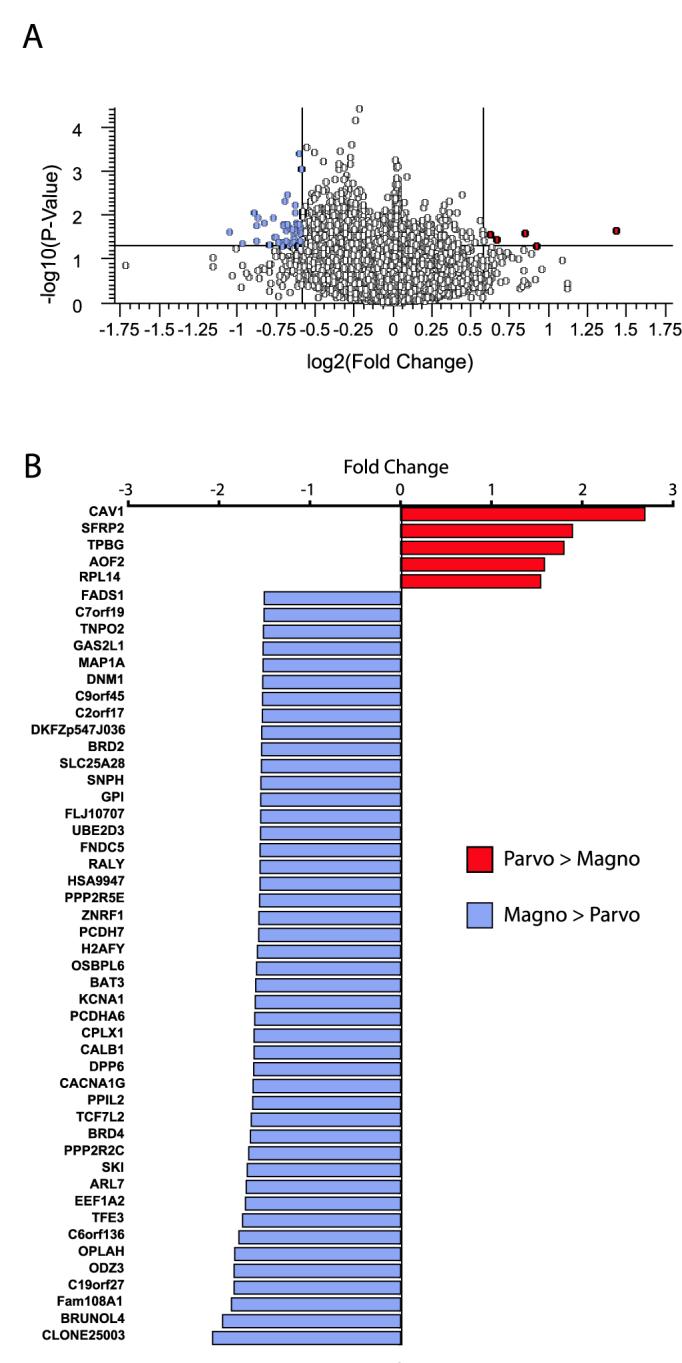
Genes differentially expressed in dLGN layers identified by microarray analysis. (A) Volcano plot of robust multichip analysis and median polished Affymetrix GeneChip data. Fold expression levels between magno- and parvocellular layers are plotted on the X-axis (log2 transformed) and t statistic p values are plotted on the Y-axis (−log10 transformed). Genes that displayed at least a 1.5 fold difference and a p value less than 0.05 are indicated in the upper left and right quadrants of the plot. (B) Genes identified in the volcano plot as having matched the cutoff criteria are hierarchically listed here by fold increase in parvocellular layers (red) compared with magnocellular layers (blue).
Analysis of differentially expressed genes using IPA software revealed an overabundance of sets of genes in over 70 categories related to molecular and cellular functions, physiological system development and function, or diseases and disorders (Supplemental Table 2). Among the top categories identified were those involving functions related to development, gene expression, cell growth and tissue morphology. In addition, analysis of genes for potential interactions identified several putative protein networks involving functions related to cellular signaling, development, and motility (Supplemental Table 3 and Supplemental Figure 1). Several canonical pathways were overrepresented. Among these the Wnt/β-catenin, Toll-like receptor signaling, calcium signaling and cAMP signaling pathways were the most statistically significant.
RT-PCR
In order to confirm the microarray results we performed RT-PCR analysis on 13 of the top differentially expressed genes and ranked them according to fold increase (Figure 4). Of these, 10 genes (BRD4, BRUNOL4, EEF1A2, FAM108A1, KCNA1, OD23, OPLAH, PPP2R2C, TEF3 and TPBG) showed a fold increase in the same direction observed by microarray analysis. Three genes, (TCF7L2, SFRP2 and CAV1) showed a fold increase in the direction opposite to that observed by microarray. Eleven genes (BRD4, BRUNOL4, CAV1, EEF1A2, FAM108A1, KCNA1, ODZ3, OPLAH, PPP2R2C, SFRP2, and TFE3) were identified as enriched in magnocellular layers (Figure 4, blue bars) and 2 (TCF7L2 and TPBG) as enriched in parvocellular layers (Figure 4, red bars) according to RT-PCR.
Figure 4.
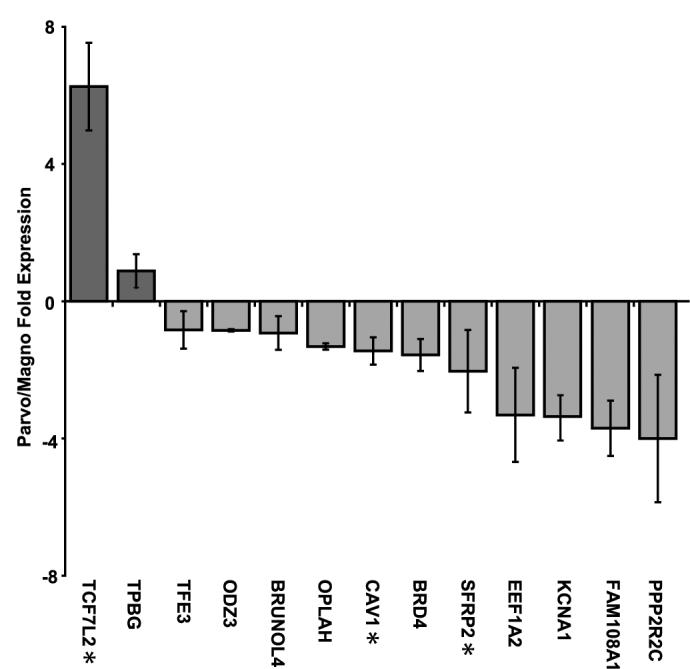
RT-PCR confirmation of microarray measures. Twelve of the top genes identified by microarray were analyzed independently by RT-PCR. Each gene was measured in triplicate and plotted as fold increase in parvocellular (red) expression levels over magnocellular (blue) expression. Genes with fold differences opposite those observed by microarray are indicated (*). Bars indicate mean values ±SEM.
Cellular Confirmation of Differential Gene Expression
To determine the cellular gene expression patterns in dLGN, we performed in situ hybridization on all 13 differentially expressed genes identified through RT-PCR. Differential patterns of gene expression are described in detail below.
Magnocellular Enriched Gene Expression
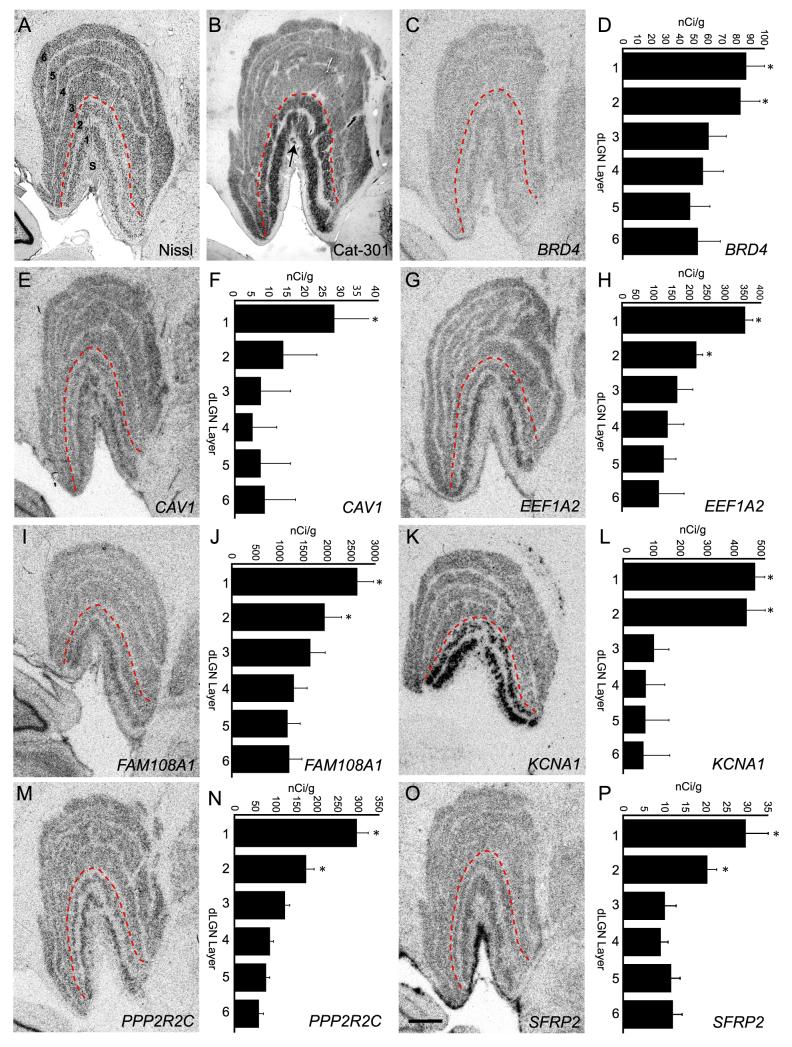
The genes, BRD4, CAV1, EEF1A2, FAM108A1, KCNA1, PPP2R2C and SFRP2, identified as magnocellular enriched by RT-PCR were confirmed by in situ hybridization (Figure 5). All 7 genes displayed a similar pattern of expression throughout the dLGN although their level of expression varied dramatically. Overall levels of hybridization were much lower for CAV1, SFRP2 and BRD4 compared with EEF1A2, FAM108A1, KCNA1 and PPP2R2C (compare scales in Figure 5).
Figure 5.
In situ hybridization confirmation of magnocellular enriched gene expression. (A) Coronal Nissl stained section through monkey dLGN illustrating the cytoarchitecture, including the 6 principal cell layers and the S layers (S). The red dashed line indicates the separation between magnocellular (1 and 2) and parvocellular (3-6) layers. (B) Coronal section through monkey dLGN immunostained with monoclonal antibody Cat-301 which recognizes an epitope on the protein aggrecan and is known to be elevated in magnocellular dLGN layers (Hendry et al., 1984). Some staining in S layers is also present (arrow). (C, E, G, I, K, M, O) Images of film autoradiograms illustrating hybridization of radioactive cRNA probes specific to the genes BRD4 (C), CAV1 (E), EEF1A2 (G), FAM108A1 (I), KCNA1 (K), PPP2R2C (M), and SFRP2 (O) on coronal sections of monkey dLGN. Consistent with RT-PCR results each gene displayed elevated expression in one or both magnocellular layers. Laminar differences in mRNA expression were quantified from film autoradiograms of sections processed for in situ hybridization for BRD4 (D), CAV1 (F), EEF1A2 (H), FAM108A1 (J), KCNA1 (L), PPP2R2C (N), and SFRP2 (P). Calibrated densitometric measures were obtained from the principal layers (1-6) of the dLGN. Measures are means ±S.E.M. *, p < .01 (n=5) ANOVA, post-hoc Student’s t-test. Scale bar in O = 1 mm (applies to C, E, G, I, K and M).
Both CAV1 and SFRP displayed hybridization patterns consistent with RT-PCR although not microarray. Autoradiograms revealed positive hybridization over all principal layers of the dLGN, but stronger hybridization was observed over the magnocellular layers (Figure 5). Only background levels of hybridization were observed over the S layers or over the interlaminar zones for either CAV1 or SFRP2. Densitometric analysis of hybridization levels confirmed CAV1 and SFRP2 expression levels were elevated in magnocellular layers of the dLGN (Figure 5).
Five genes, BRD4, EEF1A2, FAM108A1, KCNA1, and PPP2R2C displayed patterns of hybridization consistent with both microarray and RT-PCR results. Expression of BRD4 was rather low, but EEF1A2, KCNA1, FAM108A1 and PPP2R2C were expressed at high levels within the magnocellular layers of the dLGN (Figure 5). Autoradiographs for all 5 genes revealed hybridization signal overlying the principal layers of the dLGN, but only low or no signal over the S layers or interlaminar zones (Figure 5). Densitometric analysis confirmed that expression of these genes was greater in magnocellular layers compared to parvocellular layers (Figure 5). Statistically higher expression of BRD4, EEF1A2, FAM108A1, KCNA1, PPP2R2C and SFRP2 was observed in magnocellular layers 1 and 2 compared with parvocellular layers and of CAV1 in magnocellular layer 1 compared with parvocellular layers, according to ANOVA and pot-hoc Student’s t-test (Figure 5).
Parvocellular (and koniocellular) Enriched TCF7L2 Expression
A single gene, TCF7L2, was found to be enriched in parvocellular/koniocellular relative to magnocellular layers of the dLGN. Expression of TCF7L2 mRNA was previously observed to be restricted to nuclei of the dorsal thalamus including the dLGN (Murray et al., 2007). Within the dLGN, TCF7L2 mRNA levels were appreciable in cells of all principal layers and in scattered cells throughout the S layers (Figure 6). As predicted by RT-PCR analysis, mRNA expression was greater in parvocellular than in magnocellular layers. Densitometric analysis revealed that expression of TCF7L2 mRNA in magnocellular layers 1 and 2 was significantly lower than in parvocellular (with koniocellular) layers as determined by ANOVA and post-hoc Student’s t-test (Figure 6). TCF7L2 expression was up to 3 times greater in the parvocellular compared with the magnocellular layers (Figure 6F). Differential expression between parvocellular and magnocellular layers was observed along the rostrocaudal axis of the dLGN (data not shown).
Figure 6.
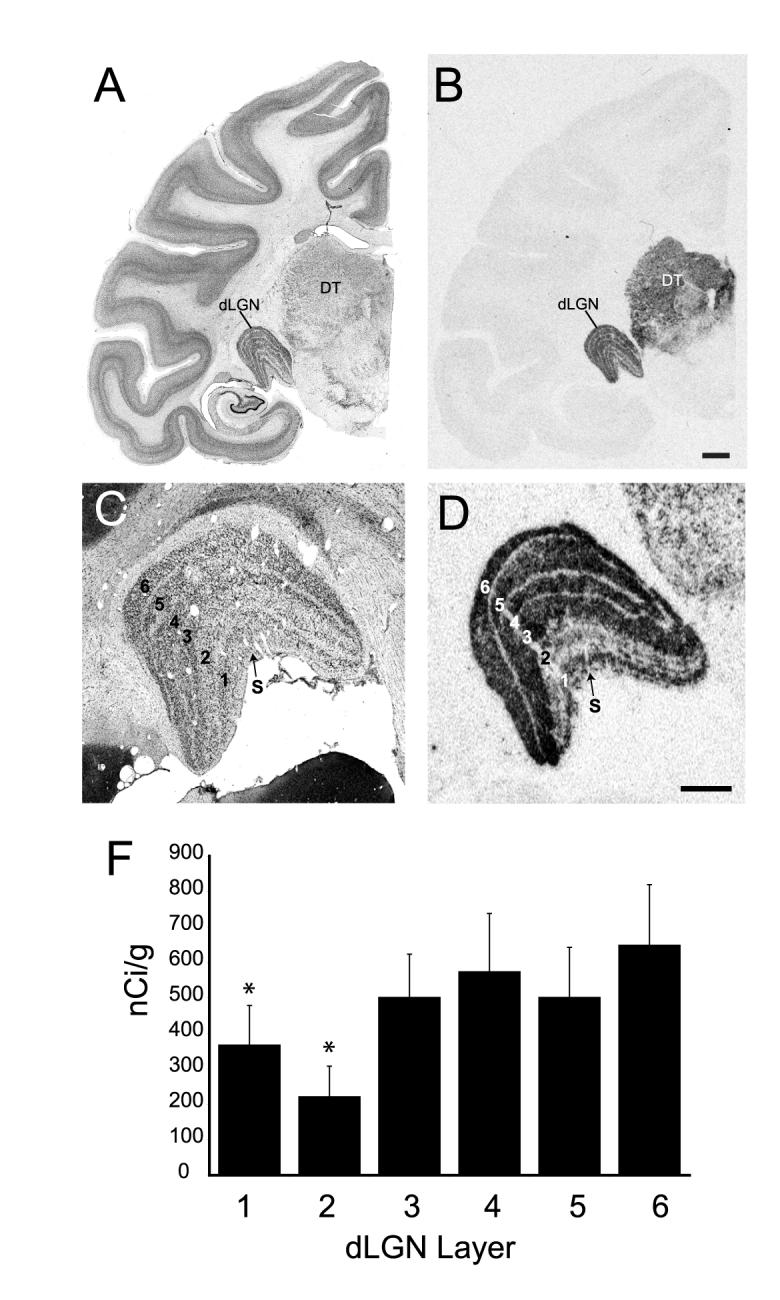
TCF7L2 mRNA expression is overrepresented in parvocellular layers of monkey dLGN. (A) Brightfield image of a Nissl stained coronal section of monkey brain at the level of mid dLGN. (B) Image from a film autoradiogram illustrating in situ hybridization for TCF7L2 mRNA in a coronal section adjacent to that in (A). TCF7L2 mRNA is mostly restricted to dorsal thalamus (DT) and shows prominent expression in dLGN. (C) Higher power image of Nissl stained dLGN showing the principal relay layers (1-6) and the S layers. (D) Higher power image of a section adjacent to that in (C) showing TCF7L2 in situ hybridization. TCF7L2 mRNA expression is greater in the parvocellular layers (3-6) compared to magnocellular layers (1, 2). Hybridization to TCF7L2 mRNA is also observed in the S layers. (F) Calibrated densitometric measures of film autoradiographs illustrate the enrichment for TCF7L2 hybridization in parvocellular layers compared with magnocellular layers. Measures are means ±S.E.M. *, p < .01 (n=5) ANOVA, post hoc students t-test. Scale bar = 2 mm in B (applies to A and B) and 1 mm in D (applies to C and D).
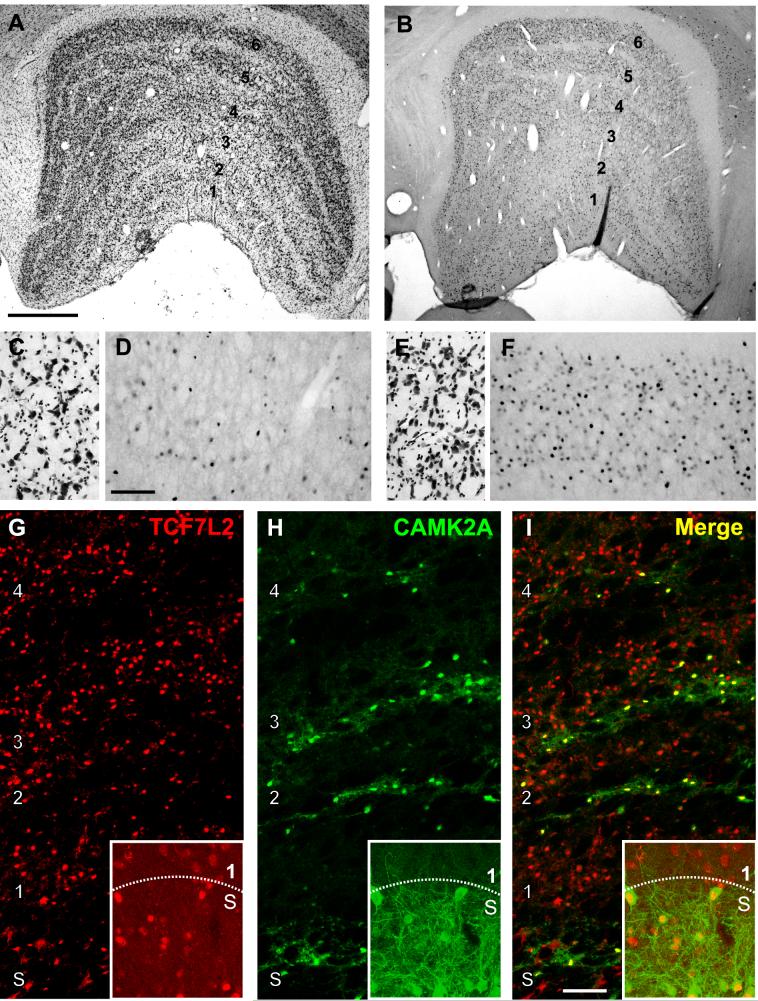
The distribution of TCF7L2 protein was consistent with the pattern of mRNA expression. Immunocytochemical detection of TCF7L2 protein was restricted to nuclei of neurons. TCF7L2 protein expression was qualitatively higher in parvocellular than in magnocellular layers (Figure 7). This appeared to be the effect of a larger number of cells expressing TCF7L2 (Figure 7D, F). Expression of TCF7L2 protein was also observed in the S layers and throughout the interlaminar zones where koniocellular neurons are situated. Colocalization with immunostaining for CAMK2A, a marker of koniocellular neurons (Benson et al., 1991), confirmed that TCF7L2 was expressed in these neurons (Figure 7G-I). Levels of TCF7L2 were greater in koniocellular neurons of the S layers than in neurons of the magnocellular layers (Figure 7G-I).
Figure 7.
TCF7L2 protein is enriched in parvocellular, S and intercalated layers of the monkey dLGN. (A) Nissl stained coronal section of monkey dLGN illustrating the principal relay layers (1-6) and the intercalated layers that separate them. The S layers are not readily visible in this section (B) Immunohistochemical labeling of TCF7L2 protein in a coronal section of monkey dLGN adjacent to that in (A). (C) and (E) Higher power images of Nissl stained cells in layer 1 (C) and 6 (E) of dLGN. (D and F) Higher power images from sections adjacent to those in C and E show immunoreactivity for TCF7L2 protein in layers 1 (D) and 6 (F) of dLGN. More immunoreactive cells are observed in layer 6 compared with layer 1. (G-I) Double immunofluorescent labeling of TCF7L2 (red) and type II alpha calcium/calmodulin-dependent protein kinase (CAMK2A) (green) in dLGN. Merged images (I) show colocalization of TCF7L2 and CAMK2A in the intercalated layers of the dLGN and in the S layers (insets). Scale bars = 1 mm in A (applies to A, and B), 250 μM in D (applies to C-F) and 200 μM in I (applies to G-I).
In general, cellular patterns of differential gene expression in laminae of the adult dLGN can be summed up as follows: All but 3 genes displayed appreciable levels of autoradiographic signal in dLGN. Eight genes, BRD4, CAV1, EEF1A2, FAM108A1, KCNA1, PPP2R2C SFRP2 and TCF7L2, displayed differential expression between magnocellular and parvocellular layers that was consistent with the RT-PCR results. The first 7 were enriched in magnocellular layers and the other, TCF7L2, was enriched in parvocellular and koniocellular layers. Two of the genes, TPBG and OPLAH, displayed no difference between magnocellular and parvocellular layers (not shown).
Interrelatedness of Confirmed Cell-Specific Laminar dLGN Markers
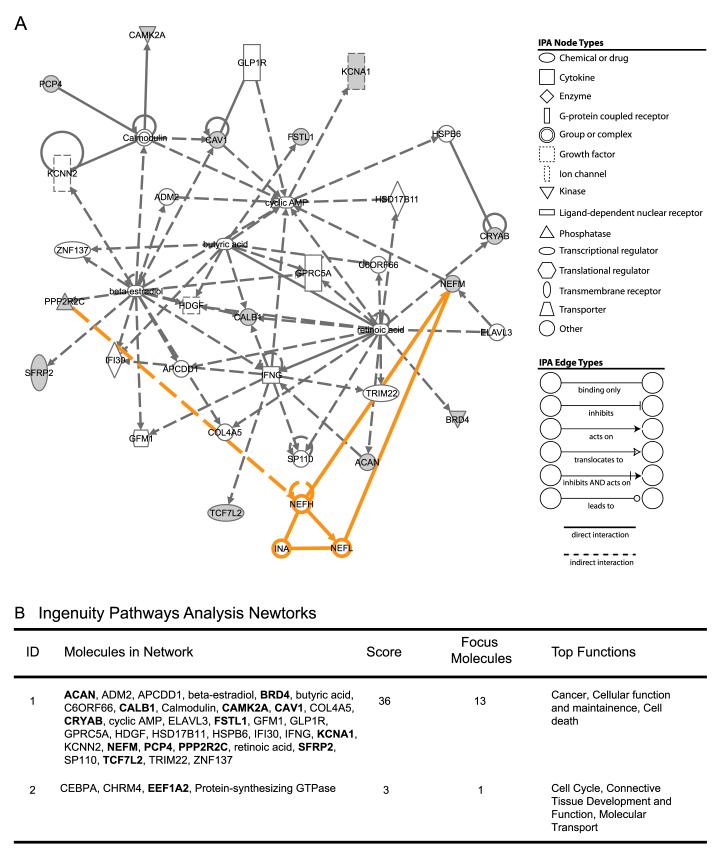
We investigated the potential interrelatedness of the layer specific dLGN markers, identified at the cellular level, with previously characterized markers (Table 4). In a confirmed cell-specific marker list, we included all the known markers of dLGN except for the monoclonal antibodies SMI-32 which recognizes a post-translational modification of neurofilament proteins (Sternberger et al., 1982; Sternberger and Sternberger, 1983) and Cat-301 which recognizes a surface proteoglycan (Zaremba et al., 1989). Immunoreactivity for these does not necessarily reflect the abundance of corresponding mRNA. In particular, Cat-301 immunoreactivity is enriched in, but not restricted to, magnocellular neurons (Hendry et al., 1984). Of 15 molecules interrogated, no less than 13 (ACAN, BRD4, CALB1, CAMK2A, CAV1, CRYAB, FSTL1 KCNA1, NEFM, PCP4, PPP2R2C, SFRP2 and TCF7L2) mapped to a single IPA network (Figure 8).
Table 4.
Cellular Markers of dLGN Laminae
| Marker | Name/Antigen | Layer Specificity |
Function | Reference |
|---|---|---|---|---|
| BRD4 | Bromodomain containing 4 | Magno | Unknown | This manuscript |
| CALB1 | Calbindin 1 | Konio | Calcium ion binding | This manuscript; (Yan et al., 1996) |
| CAMK2A | Alpha subunit of calcium/calmodulin- dependent protein kinase type II |
Konio | Protein serine/threonine kinase activity | (Benson et al., 1991) |
| CAV1 | Caveolin 1 | Magno | Integral membrane/structural molecule activity |
This manuscript |
| CRYAB | Alpha B-crystallin | Magno | Protein folding | (Prasad et al., 2002) |
| EEF1A2 | Eukaryotic translation elongation factor 1 a 2 | Magno | Translation initiation | This manuscript |
| FAM108A | Family with sequence similarity 108, member A1 |
Magno | Unknown | This manuscript |
| KCNA1 | potassium voltage-gated channel, shaker- related subfamily, member 1 |
Magno | Delayed rectifier potassium channel activity |
This manuscript |
| mAb Cat-301 | Aggrecan | Magno | Extracellular matrix organization and biogenesis |
(Hendry et al., 1984) |
| mAb SMI-32 | Non phosphorylated forms of medium and heavy neurofilament chains |
Magno | - | (Gutierrez et al., 1995; Chaudhuri et al., 1996) |
| NEFM | Neurofilament heavy chain | Magno | Structural constituent of cytoskeleton | (Prasad et al., 2002) |
| OCC1 | Follistatin-like-1 | Magno | Calcium ion binding/extracellular space | (Tochitani et al., 2001) |
| PCP4 | Purkinje cell protein 4 | Magno | Calcium ion binding | (Kawasaki et al., 2004) |
| PPP2R2C | Protein phosphatase 2A B1γ subunit | Magno | Protein phosphatase activity-Wnt signaling pathway |
This manuscript |
| SFRP2 | Secreted frizzled-related protein 2 | Magno | Wnt signaling pathway-receptor | This manuscript |
| TCF7L2 | Transcription factor 7-like 2 | Parvo/Konio | Wnt signaling pathway-transcription factor |
This manuscript |
Figure 8.
Ingenuity Pathways Analysis (IPA) was performed using a gene set combined of the novel cell-specific dLGN layer markers identified and those previously reported. (A) Thirteen of 15 molecules queried were mapped to a single IPA network. Manual expansion of the network (nodes and edges in orange) identified a connection between the phosphatase subunit, PPP2R2C and the neurofilament protein NEFM via the neurofilament molecules NEFH, NEFL and INα. Nodes and edge symbols are explained in legends at right. Open symbols = network molecules identified by IPA. Filled symbols = confirmed dLGN layer specific markers (focus molecules). (B) Two networks of proteins associated through direct and indirect interactions at a level greater than chance were identified and scored based on the number of input genes (focus molecules) linked with the network. The top functions and/or diseases significantly overrepresented by molecules in these networks are listed.
Functions associated with cellular growth and with development were significantly overrepresented in this network, consistent with IPA networks generated from the larger gene sets identified through microarray analysis (Supplemental Table 4). Of the canonical pathways significantly overrepresented in the gene set identified through microarray, the Wnt/β-catenin pathway was also overrepresented in the more focused confirmed cellular marker gene set (Supplemental Figure 2). Three genes identified in this study, PPP2R2C, TCF7L2 and SFRP2, were associated with the Wnt/β-catenin canonical signaling pathway, contributing to its significant overrepresentation amongst the genes in Table 4.
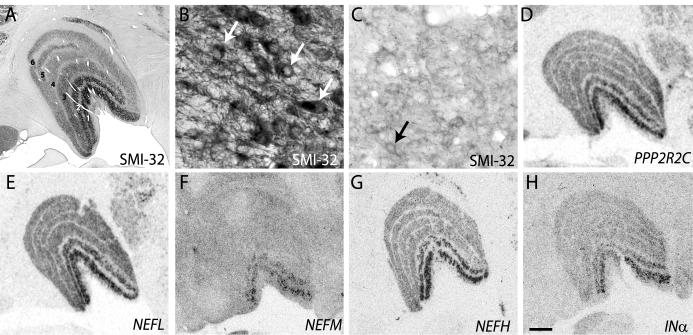
Because immuno-labeling with the monoclonal antibody SMI-32, which recognizes non-phosphorylated forms of intermediate neurofilament proteins, is specific to magnocellular layers of the dLGN, we asked whether there was a relationship between PPP2R2C, which encodes a subunit of phopsphatase 2A (Baek and Seeling, 2007) and NEFM, which encodes an intermediate neurofilament protein (Lee and Cleveland, 1996) (Figure 8). Manual expansion of the nodes around these molecules revealed additional links with other known members of neurofilament complexes, INα, NEFL and NEFH, as well as a connection to PPP2R2C protein (Figure 8A). To determine whether these other molecules were also expressed in a layer-specific manner we performed in situ hybridization with riboprobes specific for their mRNAs. Autoradiographs of in situ hybridization for NEFL, NEFH and INα revealed expression throughout the principal relay layers of the dLGN (Figure 9). Little or no hybridization was observed over the S layers or interlaminar zones. Similar to expression of PPP2R2C and NEFM, expression of NEFL, NEFH and INα was greater in the magnocellular layers.
Figure 9.
Phosphatase activity and neurofilament expression is greater in magnocellular layers of monkey dLGN. (A) Immunohistochemical staining of a coronal dLGN section with SMI-32 monoclonal antibody showing increased staining of the magnocellular layers (1, 2) of the dLGN compared with parvocellular layers (3-6). (B, C) Higher power images of SMI-32 immunostaining shows denser reaction product over layer 1 (B) compared with layer 6 (C) and illustrate positive immunoreactivity within cell bodies (arrows). (D-H) Autoradiographic images of coronal dLGN sections processed for in situ hybridization showing increased hybridization of riboprobes specific to PPP2R2C (D), NEFL (E), NEFM (F), NEFH (G) and INα (H) mRNA in magnocellular layers of the dLGN. Scale bar = 1 mm in H (applies to A-H).
Expression in the Fetal Monkey
To investigate whether lamina-specific gene expression observed in adult dLGN could play a role in establishing layers, we examined the expression of NEFL, INα, NEFM and TCF7L2 at E55, a period during which formation of magno- and parvocellular laminae is ongoing (Meissirel et al., 1997). In situ hybridization to both NEFL and INα displayed dense signal overlying nuclei of the dorsal thalamus, including the dLGN (Figure 10). Expression levels of NEFM were lower, but positive signal was also observed throughout the dLGN (not shown). As was the case in adult brain, expression of TCF7L2 was primarily restricted to nuclei of the dorsal thalamus (Figure 10D). Strong hybridization signal to TCF7L2 mRNA was observed over most dorsal thalamic nuclei, but no signal was detected over nuclei of the epithalamus or other brain regions including neocortex or ganglionic eminence (compare Figures 10B and 10D). In contrast to expression of TCF7L2 in parvocellular laminae of adult dLGN or to the robust expression of NEFL and INα mRNA in E55 dLGN (Figure 10), only low levels of TCF7L2 hybridization signal was observed in dLGN at E55 (Figure 10D).
Figure 10.
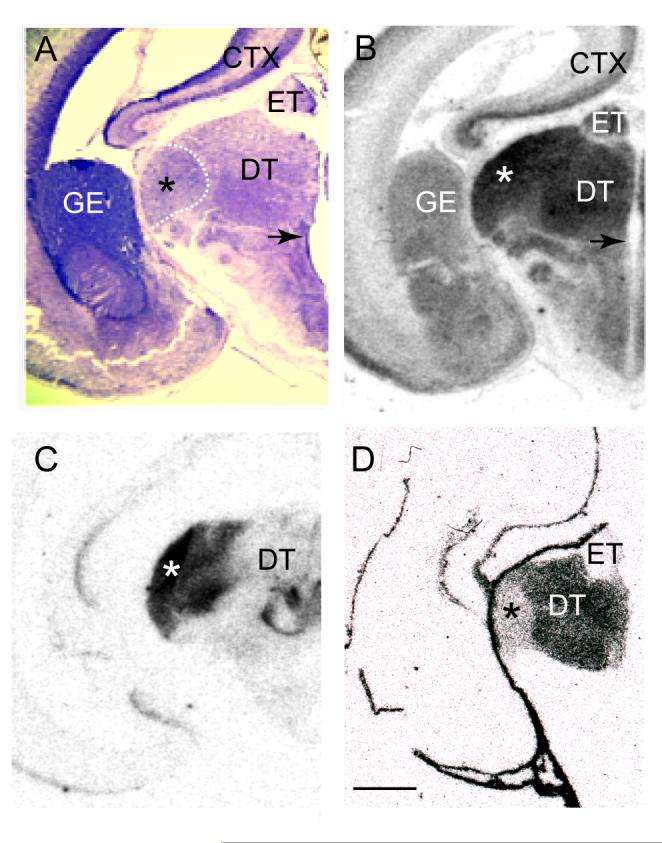
Markers of dLGN laminae in adult brain are expressed in embryonic day 55 (E55) thalamus. (A) Coronal Nissl stained section through an E55 monkey thalamus illustrating cytoarchitectural differentiation of thalamic nuclei. The location of the dLGN (*) in relation to the anlagen of dorsal thalamus (DT) and epithalamus (ET) is indicated by the dashed bounding box. M, P or K laminae cannot be reliably identified at this age (Huberman et al., 2005). An arrow indicates the location of the third ventricle. (B-D) Autoradiographic images of coronal sections adjacent to that in (A) processed for in situ hybridization with riboprobes specific to the genes NEFL (B), INα (C) and TCF7L2 (D). NEFL and INα are both heavily expressed in the developing dLGN while TCF7L2 displays relatively low levels of expression. Scale bar in (D) = 1 mm (applies to A-D). Abbreviations: CTX, neocortex; DT, dorsal thalamus; ET, epithalamus; GE, ganglionic eminence.
Discussion
In this study we have identified 10 new cellular markers for magnocellular neurons and one new marker for parvocellular and koniocellular neurons. The genes whose expression these markers represent are associated with neuronal development and cell signaling and may play important functional roles in the establishment and maintenance of the remarkable morphological, physiological and connectional specificity exhibited by the cellular layers of the dLGN. The observation that a subset of these markers is differentially expression during a period of embryogenesis when magno- and parvocellular pathways are formed lends support to this notion. Prior to discussing the significance of these findings, some technical issues will be considered.
Technical considerations
The cellular expression patterns revealed by in situ hybridization agreed well with the differential pattern identified by microarray analysis. However, expression of three genes, CAV1, SFRP2 and TCF7L2 was opposite that of the microarray analysis (compare Figures 3 and 4). Two factors may contribute to this observation. First, RNA amplification could produce results opposite those seen with non-amplified conventional array hybridization strategies and/or RT-PCR (Puskas et al., 2002; Li et al., 2003; van Haaften et al., 2006). Although the mechanism(s) is unknown, this effect is greater on lower abundance RNAs such as CAV1 and SFRP2 (Figure 5). Second, microdissection could introduce a sampling bias. This is especially true for primate dLGN, where variable numbers koniocellular neurons interleafed between magno- and parvocellular layers could account for differences between microarray and RT-PCR observations.
We identified eleven novel dLGN laminar markers, but no commonly used dLGN markers. Both Cat-301 (Hendry et al., 1984) and SMI-32 (Gutierrez et al., 1995; Chaudhuri et al., 1996), are monoclonal antibodies that recognize structural components of proteins and do not necessarily reflect the abundance of corresponding mRNA. Also, these markers are not exclusive to magnocellular laminae which could further limit their detection using the methods employed herein (Hendry et al., 1984). Despite prior validation of monkey RNA on human Affymetrix microarrays (Murray et al., 2007; Lachance and Chaudhuri, 2007) other markers such as OCC1 (Tochitani et al., 2001), or NEFM (Prasad et al., 2002), may not cross hybridize well enough for detection.
Comparison with previous findings
Three previous studies addressed the issue of molecular specificity of dLGN layers (Prasad et al., 2000; Kawasaki et al., 2004; Lachance and Chaudhuri, 2007) and we have also provided preliminary data relevant to the present study (Murray et al., 2007). In an earlier genome-wide screen for thalamus-specific genes, we identified osteopontin (SPP1) and osteonectin (SPARC) as genes expressed only in dLGN (SPP1) or within subsets of dLGN neurons (SPARC). Prasad et al. (2000) found a greater number of magnocellular enriched genes (300) compared with parvocellular (107) in the dLGN of vervet (Chlorocebus pygerythrus) monkey, however no cellular confirmation was obtained. None of the genes they listed were found here (compare their Table 4 with our Figure 3) and this is likely due to many of their top candidates corresponding to expressed sequence tags that had not yet been mapped to specific genes. Kawasaki et al. (2004) describe PCP4 as a magno-enriched gene in monkey dLGN, although our own observations suggest laminar differences are likely below the cutoff criteria set in the present study. A recent study by Lachance and Chaudhuri (2007), identified neuron and glia-specific genes in macaque dLGN, but none showed magno- or parvocellular layer enrichment.
Wnt signaling and layer specific patterning in monkey dLGN (PPP2R2C, SFRP2, TCF7L2)
PPP2R2C, SFRP2, and TCF7L2 are members of the developmentally important, canonical Wnt/β-catenin signaling pathway. The protein product of PPP2R2C is part of the phosphatase 2 regulatory subunit B family of serine/threonine phosphatases that has been shown to modulate β-catenin activity (Seeling et al., 1999; Li et al., 2001; Baek and Seeling, 2007). TCF7L2 is a member of the T cell factor/lymphoid enhancer factor (Tcf/Lef) subfamily of transcription factors (Korinek et al., 1997; for review: Ciani and Salinas, 2005). SFRP2 is part of a family of proteins that contains domains homologous to the Wnt binding site on frizzled receptor (Rattner et al., 1997). Collectively these proteins can modulate Wnt signaling at a variety of levels.
IPA analysis indicates that identification of the genes described above is not likely to be due to chance and implicates the Wnt/β-catenin pathway in the formation of functionally distinct dLGN layers. Canonical signaling through the Wnt/β-catenin pathway has primarily been associated with progenitor zones that delineate neural boundaries in early embryogenesis (Puelles and Rubenstein, 2003; Lim and Golden, 2007). A number of studies have shown that early expression of Wnt genes in the anlage of the dorsal thalamus and in the zona limitans intrathalamica, is necessary for proper differentiation of thalamic nuclei (Garda et al., 2002; Braun et al., 2003; Zhou et al., 2004). Wnt signaling can determine neuronal connectivity directly through axon guidance mechanisms (Ille and Sommer, 2005; Endo and Rubin, 2007). In particular, loss of the Wnt receptor frizzled-3 leads to severe defects of mouse thalamocortical and corticothalamic pathways, implying that thalamic connectivity is dependent on Wnt signaling (Wang et al., 2002). Our results extend these studies, showing that many of the genes identified in the adult dLGN are also expressed as early as E55 in the fetal brain, and implicate Wnt signaling in the maintenance of functional segregation of visual pathways in monkey dLGN into adulthood.
Neurofilament signaling and layer specific patterning in monkey dLGN (NEFL, PPP2R2C, SMI-32, NEFM, NEFH, INα)
We describe for the first time magnocellular-specific expression of NEFL, NEFH, INα and PPP2R2C in monkey dLGN. Coupled with the previously reported expression of NEFM in magnocellular dLGN layers (Prasad et al., 2002) this suggests a pattern of neurofilament signaling specific to magnocellular layers of the monkey dLGN.
Specific labeling of non-phosphorylated neurofilament (NEFH and NEFM) proteins by the monoclonal antibody, SMI-32, in neurons within magnocellular layers of the dLGN (Figure 9) suggests a pattern of post-translational modification specific to these layers. The overexpression of PPP2R2C, which encodes the B1g subunit of protein phosphatase 2A (PP2A) (Hu et al., 2000), in magnocellular layers reported here supports this idea and provides a mechanism by which SMI-32 specifies magnocellular dLGN neurons. It is unknown whether other subunits of the PP2A holoenzyme complex are specifically localized to magnocellular layers. However, enrichment of the B1g subunit, responsible for subcellular movement of the holoenzyme, could be related to neurofilament targeting and subsequent development of neurites (Lechward et al., 2001). Indeed overexpression of PPP2R2C in a heterologous cell line enhances growth factor induced neurite outgrowth and increases expression of NEFH (Strack, 2002). Similar links between the other well known marker Cat-301 and lamina-enriched genes are not obvious. However, chondroitin sulfate proteoglycans, the target moiety which Cat-301 recognizes, are well documented regulators of neurite outgrowth (Margolis and Margolis, 1997).
Laminar markers in fetal monkey
A subset of adult monkey dLGN lamina-specific markers was observed to be expressed in the embryonic monkey dLGN at E55, a critical period of development when retinal axons are terminating selectively in magno- and parvocellular specific zones (Meissirel et al., 1997). The subset of markers investigated in the adult dLGN (NEFL, INα, NEFM and TCF7L2), are representative of the functional pathways associated with the adult markers and were significantly enriched in magno- or parvocellular lamina in adult dLGN. Rather than obvious regional differences, magnocellular enriched markers (NEFL, INα, NEFM) at E55 were found to be expressed throughout the fetal dLGN. At this age, TCF7L2, which in the adult labeled prominently the parvocellular layers, was barely above background levels. Classic work by Rakic on fetal monkey (Rakic, 1977) showed a clear gradient of neurogenesis, with neurons in the presumed magnocellular layers born before those in the parvocellular layers during the period from E36 to E45. Thus, the pattern of expression observed in the E55 monkey reflects maturational differences between magno- and parvocellular cells. Importantly, our data reveal one subset of markers that appear to identify magnocellular cells of the dLGN at a time shortly after their generation.
Implications for Development
The present observations implicate Wnt/β-catenin signaling and neurofilament regulation in the development of lamina-specificity in the monkey dLGN. The morphological development of the retinogeniculate pathway in the fetal macaque has been well-documented and certain key phases have been identified. These include an early fetal period during which magno- and parvocellular pathways are initially formed (Meissirel et al., 1997), a subsequent establishment of eye-specific terminations (Huberman et al., 2005), as well as a period during which retinogeniculate axon arbors are elaborated (Snider et al., 1999). The dynamics of spontaneous retinal activity in the fetal monkey have also been documented (Warland et al., 2006) and may play a role in the activity-dependent refinement of retinogeniculate projections (Chalupa, 2007). The linkage of the gene expression profiles identified in the present study with the onset of correlated retinal discharges will clearly be an important issue in future work. The present study lays the foundation for assessing how expression of layer-specific markers correlates with key developmental events and how perturbations of these molecules will impact the formation of layer-specific retinogeniculate projections.
Supplementary Material
Acknowledgements
This research was supported by grants from Research to Prevent Blindness, the National Institutes of Health EY003991 (L.M.C.), EY016182 (L.M.C.), P30 EY12576 (L.M.C.), NS21377 (E.G.J.) NS39094 (E.G.J.) and the W.M. Keck Program in Cellular and Molecular Neuroscience Imaging. K.D.M. is the recipient of a young investigator award from the National Alliance for Research in Schizophrenia and Depression and the Sunshine from Darkness Gala. We would like to thank Ms. Lien Le and Mr. Phong Nguyen for expert technical assistance.
References
- Baek S, Seeling JM. Identification of a novel conserved mixed-isoform B56 regulatory subunit and spatiotemporal regulation of protein phosphatase 2A during Xenopus laevis development. BMC Dev Biol. 2007;7:139. doi: 10.1186/1471-213X-7-139. [DOI] [PMC free article] [PubMed] [Google Scholar]
- Barker N, Huls G, Korinek V, Clevers H. Restricted high level expression of Tcf-4 protein in intestinal and mammary gland epithelium. Am J Pathol. 1999;154:29–35. doi: 10.1016/S0002-9440(10)65247-9. [DOI] [PMC free article] [PubMed] [Google Scholar]
- Benson DL, Isackson PJ, Hendry SH, Jones EG. Differential gene expression for glutamic acid decarboxylase and type II calcium-calmodulin-dependent protein kinase in basal ganglia, thalamus, and hypothalamus of the monkey. J Neurosci. 1991;11:1540–1564. doi: 10.1523/JNEUROSCI.11-06-01540.1991. [DOI] [PMC free article] [PubMed] [Google Scholar]
- Braun MM, Etheridge A, Bernard A, Robertson CP, Roelink H. Wnt signaling is required at distinct stages of development for the induction of the posterior forebrain. Development. 2003;130:5579–5587. doi: 10.1242/dev.00685. [DOI] [PubMed] [Google Scholar]
- Callaway EM. Structure and function of parallel pathways in the primate early visual system. J Physiol. 2005;566:13–19. doi: 10.1113/jphysiol.2005.088047. [DOI] [PMC free article] [PubMed] [Google Scholar]
- Chalupa LM. A reassessment of the role of activity in the formation of eye-specific retinogeniculate projections. Brain Res Rev. 2007;55:228–236. doi: 10.1016/j.brainresrev.2007.03.003. [DOI] [PubMed] [Google Scholar]
- Chaudhuri A, Zangenehpour S, Matsubara JA, Cynader MS. Differential expression of neurofilament protein in the visual system of the vervet monkey. Brain Res. 1996;709:17–26. doi: 10.1016/0006-8993(95)01217-6. [DOI] [PubMed] [Google Scholar]
- Ciani L, Salinas PC. WNTs in the vertebrate nervous system: from patterning to neuronal connectivity. Nat Rev Neurosci. 2005;6:351–362. doi: 10.1038/nrn1665. [DOI] [PubMed] [Google Scholar]
- Endo Y, Rubin JS. Wnt signaling and neurite outgrowth: insights and questions. Cancer Sci. 2007;98:1311–1317. doi: 10.1111/j.1349-7006.2007.00536.x. [DOI] [PMC free article] [PubMed] [Google Scholar]
- Erondu NE, Kennedy MB. Regional distribution of type II Ca2+/calmodulin-dependent protein kinase in rat brain. J Neurosci. 1985;5:3270–3277. doi: 10.1523/JNEUROSCI.05-12-03270.1985. [DOI] [PMC free article] [PubMed] [Google Scholar]
- Garda AL, Puelles L, Rubenstein JL, Medina L. Expression patterns of Wnt8b and Wnt7b in the chicken embryonic brain suggest a correlation with forebrain patterning centers and morphogenesis. Neuroscience. 2002;113:689–698. doi: 10.1016/s0306-4522(02)00171-9. [DOI] [PubMed] [Google Scholar]
- Gutierrez C, Yaun A, Cusick CG. Neurochemical subdivisions of the inferior pulvinar in macaque monkeys. J Comp Neurol. 1995;363:545–562. doi: 10.1002/cne.903630404. [DOI] [PubMed] [Google Scholar]
- Hendry SH, Hockfield S, Jones EG, McKay R. Monoclonal antibody that identifies subsets of neurones in the central visual system of monkey and cat. Nature. 1984;307:267–269. doi: 10.1038/307267a0. [DOI] [PubMed] [Google Scholar]
- Hendry SH, Reid RC. The koniocellular pathway in primate vision. Annu Rev Neurosci. 2000;23:127–153. doi: 10.1146/annurev.neuro.23.1.127. [DOI] [PubMed] [Google Scholar]
- Hu P, Yu L, Zhang M, Zheng L, Zhao Y, Fu Q, Zhao S. Molecular cloning and mapping of the brain-abundant B1gamma subunit of protein phosphatase 2A, PPP2R2C, to human chromosome 4p16. Genomics. 2000;67:83–86. doi: 10.1006/geno.2000.6219. [DOI] [PubMed] [Google Scholar]
- Huberman AD, Dehay C, Berland M, Chalupa LM, Kennedy H. Early and rapid targeting of eye-specific axonal projections to the dorsal lateral geniculate nucleus in the fetal macaque. J Neurosci. 2005;25:4014–4023. doi: 10.1523/JNEUROSCI.4292-04.2005. [DOI] [PMC free article] [PubMed] [Google Scholar]
- Ille F, Sommer L. Wnt signaling: multiple functions in neural development. Cell Mol Life Sci. 2005;62:1100–1108. doi: 10.1007/s00018-005-4552-2. [DOI] [PMC free article] [PubMed] [Google Scholar]
- Jones EG. The thalamus. 2nd Cambridge University Press; Cambridge: 2007. [Google Scholar]
- Kaplan E. The M, P and K pathways of the primate visual system. In: Werner JS, Chalupa LM, editors. The Visual Neurosciences. MIT Press; Cambridge, Mass: 2004. pp. 481–493. [Google Scholar]
- Kawasaki H, Crowley JC, Livesey FJ, Katz LC. Molecular organization of the ferret visual thalamus. J Neurosci. 2004;24:9962–9970. doi: 10.1523/JNEUROSCI.2165-04.2004. [DOI] [PMC free article] [PubMed] [Google Scholar]
- Korinek V, Barker N, Morin PJ, van WD, de WR, Kinzler KW, Vogelstein B, Clevers H. Constitutive transcriptional activation by a beta-catenin-Tcf complex in APC-/- colon carcinoma. Science. 1997;275:1784–1787. doi: 10.1126/science.275.5307.1784. [DOI] [PubMed] [Google Scholar]
- Lachance PE, Chaudhuri A. Gene profiling of pooled single neuronal cell bodies from laser capture microdissected vervet monkey lateral geniculate nucleus hybridized to the Rhesus Macaque Genome Array. Brain Res. 2007;1185:33–44. doi: 10.1016/j.brainres.2007.09.080. [DOI] [PubMed] [Google Scholar]
- Lechward K, Awotunde OS, Swiatek W, Muszynska G. Protein phosphatase 2A: variety of forms and diversity of functions. Acta Biochim Pol. 2001;48:921–933. [PubMed] [Google Scholar]
- Lee MK, Cleveland DW. Neuronal intermediate filaments. Annu Rev Neurosci. 1996;19:187–217. doi: 10.1146/annurev.ne.19.030196.001155. [DOI] [PubMed] [Google Scholar]
- Li J, Adams L, Schwartz SM, Bumgarner RE. RNA amplification, fidelity and reproducibility of expression profiling. C R Biol. 2003;326:1021–1030. doi: 10.1016/j.crvi.2003.09.015. [DOI] [PubMed] [Google Scholar]
- Li X, Yost HJ, Virshup DM, Seeling JM. Protein phosphatase 2A and its B56 regulatory subunit inhibit Wnt signaling in Xenopus. EMBO J. 2001;20:4122–4131. doi: 10.1093/emboj/20.15.4122. [DOI] [PMC free article] [PubMed] [Google Scholar]
- Lim Y, Golden JA. Patterning the developing diencephalon. Brain Res Rev. 2007;53:17–26. doi: 10.1016/j.brainresrev.2006.06.004. [DOI] [PubMed] [Google Scholar]
- Margolis RU, Margolis RK. Chondroitin sulfate proteoglycans as mediators of axon growth and pathfinding. Cell Tissue Res. 1997;290:343–348. doi: 10.1007/s004410050939. [DOI] [PubMed] [Google Scholar]
- McKay RD, Hockfield SJ. Monoclonal antibodies distinguish antigenically discrete neuronal types in the vertebrate central nervous system. Proc Natl Acad Sci U S A. 1982;79:6747–6751. doi: 10.1073/pnas.79.21.6747. [DOI] [PMC free article] [PubMed] [Google Scholar]
- Meissirel C, Wikler KC, Chalupa LM, Rakic P. Early divergence of magnocellular and parvocellular functional subsystems in the embryonic primate visual system. Proc Natl Acad Sci U S A. 1997;94:5900–5905. doi: 10.1073/pnas.94.11.5900. [DOI] [PMC free article] [PubMed] [Google Scholar]
- Murray KD, Choudary PV, Jones EG. Nucleus- and cell-specific gene expression in monkey thalamus. Proc Natl Acad Sci U S A. 2007;104:1989–1994. doi: 10.1073/pnas.0610742104. [DOI] [PMC free article] [PubMed] [Google Scholar]
- Prasad SS, Kojic LZ, Lee SS, Chaudhuri A, Hetherington P, Cynader MS. Identification of differentially expressed genes in the visual structures of brain using high-density cDNA grids. Brain Res Mol Brain Res. 2000;82:11–24. doi: 10.1016/s0169-328x(00)00172-8. [DOI] [PubMed] [Google Scholar]
- Prasad SS, Schnerch A, Lam DY, To E, Jim J, Kaufman PL, Matsubara JA. Immunohistochemical investigations of neurofilament M’ and alphabeta-crystallin in the magnocellular layers of the primate lateral geniculate nucleus. Brain Res Mol Brain Res. 2002;109:216–220. doi: 10.1016/s0169-328x(02)00564-8. [DOI] [PubMed] [Google Scholar]
- Puelles L, Rubenstein JL. Forebrain gene expression domains and the evolving prosomeric model. Trends Neurosci. 2003;26:469–476. doi: 10.1016/S0166-2236(03)00234-0. [DOI] [PubMed] [Google Scholar]
- Puskas LG, Zvara A, Hackler L, Jr., van HP. RNA amplification results in reproducible microarray data with slight ratio bias. Biotechniques. 2002;32:1330–4. doi: 10.2144/02326mt04., 1336, 1338, 1340.
- Rakic P. Genesis of the dorsal lateral geniculate nucleus in the rhesus monkey: site and time of origin, kinetics of proliferation, routes of migration and pattern of distribution of neurons. J Comp Neurol. 1977;176:23–52. doi: 10.1002/cne.901760103. [DOI] [PubMed] [Google Scholar]
- Rattner A, Hsieh JC, Smallwood PM, Gilbert DJ, Copeland NG, Jenkins NA, Nathans J. A family of secreted proteins contains homology to the cysteine-rich ligand-binding domain of frizzled receptors. Proc Natl Acad Sci U S A. 1997;94:2859–2863. doi: 10.1073/pnas.94.7.2859. [DOI] [PMC free article] [PubMed] [Google Scholar]
- Seeling JM, Miller JR, Gil R, Moon RT, White R, Virshup DM. Regulation of beta-catenin signaling by the B56 subunit of protein phosphatase 2A. Science. 1999;283:2089–2091. doi: 10.1126/science.283.5410.2089. [DOI] [PubMed] [Google Scholar]
- Sincich LC, Horton JC. The circuitry of V1 and V2: integration of color, form, and motion. Annu Rev Neurosci. 2005;28:303–326. doi: 10.1146/annurev.neuro.28.061604.135731. [DOI] [PubMed] [Google Scholar]
- Sincich LC, Park KF, Wohlgemuth MJ, Horton JC. Bypassing V1: a direct geniculate input to area MT. Nat Neurosci. 2004;7:1123–1128. doi: 10.1038/nn1318. [DOI] [PubMed] [Google Scholar]
- Snider CJ, Dehay C, Berland M, Kennedy H, Chalupa LM. Prenatal development of retinogeniculate axons in the macaque monkey during segregation of binocular inputs. J Neurosci. 1999;19:220–228. doi: 10.1523/JNEUROSCI.19-01-00220.1999. [DOI] [PMC free article] [PubMed] [Google Scholar]
- Sternberger LA, Harwell LW, Sternberger NH. Neurotypy: regional individuality in rat brain detected by immunocytochemistry with monoclonal antibodies. Proc Natl Acad Sci U S A. 1982;79:1326–1330. doi: 10.1073/pnas.79.4.1326. [DOI] [PMC free article] [PubMed] [Google Scholar]
- Sternberger LA, Sternberger NH. Monoclonal antibodies distinguish phosphorylated and nonphosphorylated forms of neurofilaments in situ. Proc Natl Acad Sci U S A. 1983;80:6126–6130. doi: 10.1073/pnas.80.19.6126. [DOI] [PMC free article] [PubMed] [Google Scholar]
- Strack S. Overexpression of the protein phosphatase 2A regulatory subunit Bgamma promotes neuronal differentiation by activating the MAP kinase (MAPK) cascade. J Biol Chem. 2002;277:41525–41532. doi: 10.1074/jbc.M203767200. [DOI] [PubMed] [Google Scholar]
- Tochitani S, Liang F, Watakabe A, Hashikawa T, Yamamori T. The occ1 gene is preferentially expressed in the primary visual cortex in an activity-dependent manner: a pattern of gene expression related to the cytoarchitectonic area in adult macaque neocortex. Eur J Neurosci. 2001;13:297–307. doi: 10.1046/j.0953-816x.2000.01390.x. [DOI] [PubMed] [Google Scholar]
- Van Gelder RN, von Zastrow ME, Yool A, Dement WC, Barchas JD, Eberwine JH. Amplified RNA synthesized from limited quantities of heterogeneous cDNA. Proc Natl Acad Sci U S A. 1990;87:1663–1667. doi: 10.1073/pnas.87.5.1663. [DOI] [PMC free article] [PubMed] [Google Scholar]
- van Haaften RI, Schroen B, Janssen BJ, van EA, Debets JJ, Smeets HJ, Smits JF, van den WA, Pinto YM, Evelo CT. Biologically relevant effects of mRNA amplification on gene expression profiles. BMC Bioinformatics. 2006;7:200. doi: 10.1186/1471-2105-7-200. [DOI] [PMC free article] [PubMed] [Google Scholar]
- Wang Y, Thekdi N, Smallwood PM, Macke JP, Nathans J. Frizzled-3 is required for the development of major fiber tracts in the rostral CNS. J Neurosci. 2002;22:8563–8573. doi: 10.1523/JNEUROSCI.22-19-08563.2002. [DOI] [PMC free article] [PubMed] [Google Scholar]
- Warland DK, Huberman AD, Chalupa LM. Dynamics of spontaneous activity in the fetal macaque retina during development of retinogeniculate pathways. J Neurosci. 2006;26:5190–5197. doi: 10.1523/JNEUROSCI.0328-06.2006. [DOI] [PMC free article] [PubMed] [Google Scholar]
- Yan YH, Winarto A, Mansjoer I, Hendrickson A. Parvalbumin, calbindin, and calretinin mark distinct pathways during development of monkey dorsal lateral geniculate nucleus. J Neurobiol. 1996;31:189–209. doi: 10.1002/(SICI)1097-4695(199610)31:2<189::AID-NEU5>3.0.CO;2-7. [DOI] [PubMed] [Google Scholar]
- Zaremba S, Guimaraes A, Kalb RG, Hockfield S. Characterization of an activity-dependent, neuronal surface proteoglycan identified with monoclonal antibody Cat-301. Neuron. 1989;2:1207–1219. doi: 10.1016/0896-6273(89)90305-x. [DOI] [PubMed] [Google Scholar]
- Zhou CJ, Pinson KI, Pleasure SJ. Severe defects in dorsal thalamic development in low-density lipoprotein receptor-related protein-6 mutants. J Neurosci. 2004;24:7632–7639. doi: 10.1523/JNEUROSCI.2123-04.2004. [DOI] [PMC free article] [PubMed] [Google Scholar]
Associated Data
This section collects any data citations, data availability statements, or supplementary materials included in this article.


