

Abstract
Interest in implementation science and recent calls for consequentialist epidemiology urge epidemiologists to produce work more immediately applicable to public health practice. A clear vocabulary for such approaches is lacking. Here, we present a potential taxonomy of causal effects, distinguishing between “exposure effects” more relevant to patients and individuals; and “population intervention effects” more relevant to public health policy. We discuss this range of effects using figures and a simple numerical example.
Keywords: causal inference, cost-effectiveness models, estimates, generalized impact fractions, implementation science, population attributable fractions, program science, public health
INTRODUCTION
Recent years have seen a marked increase in interest around the translation of research findings into public health policy and practice, often discussed under the heading of “implementation” or “program” science[1–5]. While most discussions of translating research into practice regard epidemiology as critical to that process, to date the role of epidemiology has been left largely implicit, with some exceptions[6–10]. In this age of calls for more consequentialist epidemiology[11, 12], it is vital to have common vocabulary with which to discuss different types of effect estimates, and their relevance to clinical practice on one hand and intervention planning on another. Here, we synthesize work by numerous authors[6, 13–16] to describe a range of contrasts that can be produced by epidemiologic analysis. For conceptual clarity, here we consider causal effects in a closed population with a binary, time-fixed, harmful exposure (equivalently, treatment); a dichotomous, time-fixed outcome which can be summarized as a risk[17]; and no competing risks[15, 17]. Further we largely concentrate on issues of internal validity, ignoring issues of generalizability and transportability[15, 18]. Finally, the main text is conceptual; formal definitions of effects are proposed in the Technical eAppendix.
SELECTED EPIDEMIOLOGIC EFFECTS
Figure 1 shows several possible contrasts in a single population under real and hypothetical exposure distributions; this Figure owes a debt of influence to Figures 1.1 and 4.1 in Hernán and Robins[13].
Figure 1. Several possible contrasts in real and hypothetic popluations.
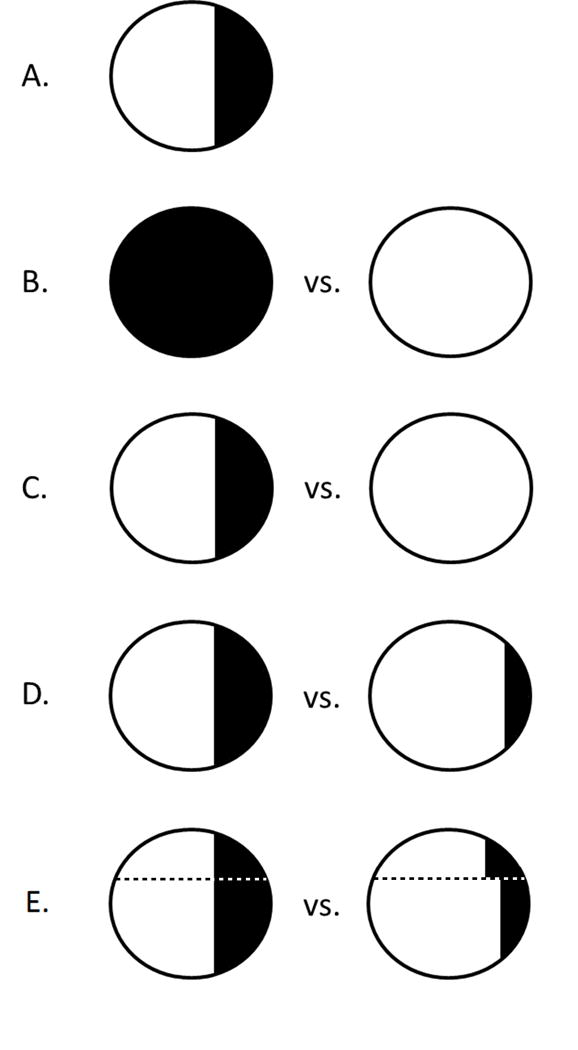
A: an observed population, showing two levels of an exposure as shaded/unshaded. B: population average causal effect, comparing “entirely exposed” and “entirely unexposed.” C: population attributable effect, comparing those observed to be exposed to a population in which no one was exposed. D: generalized intervention effect, comparing those observed to be exposed to a population in which fewer individuals were exposed. E: dynamic intervention effect, comparing those observed to be exposed to a population in which fewer individuals were exposed at different levels with heterogeneity by the value of an additional variable (above and below the dotted line). Broadly we refer to B as an “exposure effect,” and C, D, and E as “population intervention effects.”
Figure 1A shows an observed population as a circle in which a minority of individuals are exposed (shaded) and the remainder are unexposed (unshaded); the risk of the outcome is not indicated here.
In Figure 1B, we show what is sometimes called a population average causal effect[19] (alternately, average causal effect[13], average treatment effect[20–22], and other names[20, 23]). The two contrasting exposure distributions in Figure 1B (all exposed; none exposed) are both counterfactual in the literal sense of not corresponding to the factual exposure distribution in the observed sample (1A). In part because neither exposure distribution in Figure 1B coincides with a population in the real world, all/none comparisons may not be directly applicable in setting policy[14, 24].
In Figure 1C, we show a population attributable average causal effect (hereafter population attributable effect), which compares disease risk in the observed population (with the observed level of an exposure) with the risk that would be observed in the same population under a counterfactual exposure distribution in which 100% of the exposure was removed[25–29]. The best known population attributable effect is the population attributable fraction[15, 30]; closely related quantities have been referred to by other names elsewhere[15, 23, 31]. In passing we note that Greenland and Robins[30] distinguished between the excess and etiologic fractions; here we are interested in their “excess” usage[30, 32].
In contrast to population average causal effects (1B), population attributable effects require only a single counterfactual exposure distribution, as one of the two groups being compared is an observed population (1A). Population attributable effects may therefore be more readily applicable to questions of population interventions, which seek to alter the (observed, factual) exposure distribution of the world to improve population health[14]. Unlike the population average causal effect, however, population attributable effects depend on the population prevalence of the exposure[14], which may be a particular consideration in transporting a population attributable effect to an external target population[14, 15].
Figure 1D shows a generalized intervention average causal effect (hereafter, generalized intervention effect) which compares observed exposure distribution (again identical to the observed exposure in Figure 1A) to a counterfactual in which there is less exposure. Because “no exposure” is a special case of “less exposure”, the population attributable effect (1C) is a special case of the generalized intervention effect (1D). Generalized impact (or attributable) fractions were described by several authors[33–35] in the 1980s; the estimation of the quantity in complex data was explored by Greenland[36], and can proceed either stochastically[10, 37] or deterministically[33].
A generalized intervention effect assumes that the intervention removes exposure with an equal probability among all participants (homogenously with respect to participant characteristics). This is frequently not true: an intervention may incidentally succeed at removing a harmful exposure at a higher rate in one group (e.g., younger people) than another (older people), or may be delibrately targeted at a higher-risk group. In such a situation, the dynamic intervention average causal effect (hereafter, dynamic intervention effect) may be useful: the dynamic intervention effect compares the observed exposure distribution (1A) to a counterfactual in which there are fewer exposed participants, allowing for heterogeneity in amount of exposure removed by the intervention within covariate-defined subpopulations[10]. Figure 1E shows a dynamic intervention effect: heterogeneity in the study sample is shown with the dotted line, and different amounts of exposure are removed on each side of the line. In general, for a fixed percentage of exposure removed (e.g., 20%) and a fixed intervention the generalized and dynamic intervention effects can be expected to differ if (i) there is heterogeneity of the causal effect of the exposure on the outcome by some set of covariates Z, and (ii) the effectiveness of the intervention at removing the harmful exposure differs by Z, either by design or happenstance (see Numerical eAppendix for an example.) The generalized intervention effect can thus be thought of as a special case of the dynamic intervention effect, under at least one homogeneity assumption (or in which the set of covariates Z is empty). Similar methods and concepts under varying names have been described and applied elsewhere[6–8, 16, 38, 39] (see Technical eAppendix for discussion).
REMARKS
We remind the reader that for didactic purposes we are focusing on a binary, time-fixed, harmful exposure. With such an exposure, the population average causal effect (contrasting an entire population under all-exposed, all-unexposed conditions) is the default target of estimation in the bulk of the population health literature. Such a contrast was of primary interest to Neyman[40], and is estimated by the vast majority of randomized trials[41, 42]. In particular, an intent-to-treat analysis of a randomized trial with a dichotomous exposure frequently estimates this contrast for treatment assignment, while compliance-corrected (or as-treated) analysis estimates this contrast for treatment received. Such “all/none” effects are typically what are estimated in observational analysis as well, using the default tools: standard regression approaches estimate covariate-conditional population average causal effects, while inverse probability weighting generally estimates marginal population average causal effects in a manner equivalent to total-population standardization[43, 44].
The fact that population average causal effects are the result of a contrast in two counterfactual exposure distributions may mean that they have less immediate and direct applicability to questions of setting policy at the population level[14, 22], differing from measures which compare the factual exposure distribution with a counterfactual one. In broad terms we therefore consider the population attributable, and generalized and dynamic intervention effects to be population intervention effects [6, 14] (in that they are tied to potential interventions on real-world exposure distributions), while we might think of the population average causal effect as an exposure effect (in that it contrasts all-exposed to none-exposed). These designations have fuzzy boundaries, and may coincide in certain settings: a smoking cessation intervention (which naturally targets only smokers) is an intervention in a population with 100% exposure prevalence (and thus the population average causal effect would coincide with the population attributable effect). Such measures may also coincide in community randomized trials of realistic interventions that may be immediately deployed on a large scale. This fuzziness aside, population intervention effects, especially when explicitly tied to real-world interventions[15], may better reflect real world impacts than exposure effects; thus, population intervention effects may be of relatively higher utility to cost-effectiveness modelers and policy planners trying to understand how a particular intervention may affect total population health.
All contrasts discussed here will be interpretable as causal effects only under the usual causal identifiability assumptions. These include exchangeability or conditional exchangeability[44] with positivity[45], no versions of treatment or treatment variation irrelevance[46] or an alternative[47], and correct model specification including attention to dependent happenings[48]. The interpretation of population intervention effects as causal may require additional assumptions (or refinements in thinking about those assumptions). One key issue is the correct modeling of all consequences of an intervention, including (critically) assumptions about size of the population at risk ([15] and [49] (p.297)). Careful articulation of identifiability conditions for population intervention effects is a subject for future work, as are discussions of methods for estimation of such effects (although interested readers should see [10, 25, 29]).
Here we have reviewed two broad categories (and sevearal subtypes) of epidemiologic effect estimates: exposure effects and population intervention effects. While there is room for refinement, improvement, and expansion of this categorization, we believe that this vocabulary will help clarify discussions of causal effect estimation in epidemiology. This work may also help answer recent calls to focus on more “consequentialist” epidemiology[50], which looks beyond individual causes of disease to interventions which improve population health, building bridges from exposures to population interventions, and thereby from patients to policy.
Supplementary Material
Acknowledgments
We thank Michael G. Hudgens, Jessie K. Edwards, Stephen R. Cole for their comments on drafts of this work, and Charles Poole and Jennifer Ahern for discussions of many of these concepts.
FUNDING
This research was supported by the Eunice Kennedy Shriver National Institute Of Child Health & Human Development of the National Institutes of Health under Award Numbers DP2-HD-08-4070 and 4R00-HD-06-3961, and the University of North Carolina at Chapel Hill Center for AIDS Research (CFAR), an NIH funded program P30 AI50410. The content is solely the responsibility of the author and does not necessarily represent the official views of the National Institutes of Health.
Footnotes
CONFLICTS
DW has previously engaged in ad hoc consulting with NIH/NICHD on epidemiologic methods. There is no overlap with the present work.
References
- 1.Galea S. Values, compelling ideas, the pace of science, and the implementation of evidence-based policy. Addiction. 2013;108(5):847–848. doi: 10.1111/add.12058. [DOI] [PubMed] [Google Scholar]
- 2.Solomon SS, Lucas GM, Celentano DD, Sifakis F, Mehta SH. Beyond Surveillance: A Role for Respondent-driven Sampling in Implementation Science. Am J Epidemiol. 2013;178(2):260–267. doi: 10.1093/aje/kws432. [DOI] [PMC free article] [PubMed] [Google Scholar]
- 3.Schackman BR. Implementation science for the prevention and treatment of HIV/AIDS. J Acquir Immune Defic Syndr. 2010;55(Suppl 1):S27–31. doi: 10.1097/QAI.0b013e3181f9c1da. [DOI] [PMC free article] [PubMed] [Google Scholar]
- 4.Cazap E, Distelhorst SR, Anderson BO. Implementation science and breast cancer control: a Breast Health Global Initiative (BHGI) perspective from the 2010 Global Summit. Breast. 2011;20(Suppl 2):S1–2. doi: 10.1016/j.breast.2011.02.013. [DOI] [PubMed] [Google Scholar]
- 5.Aral SO, Blanchard JF. The Program Science initiative: improving the planning, implementation and evaluation of HIV/STI prevention programs. Sex Transm Infect. 2012;88(3):157–159. doi: 10.1136/sextrans-2011-050389. [DOI] [PubMed] [Google Scholar]
- 6.Hubbard AE, Laan MJ. Population intervention models in causal inference. Biometrika. 2008;95(1):35–47. doi: 10.1093/biomet/asm097. [DOI] [PMC free article] [PubMed] [Google Scholar]
- 7.Ahern J, Hubbard A, Galea S. Estimating the effects of potential public health interventions on population disease burden: a step-by-step illustration of causal inference methods. Am J Epidemiol. 2009;169(9):1140–1147. doi: 10.1093/aje/kwp015. [DOI] [PMC free article] [PubMed] [Google Scholar]
- 8.Taubman SL, Robins JM, Mittleman MA, Hernan MA. Intervening on risk factors for coronary heart disease: an application of the parametric g-formula. Int J Epidemiol. 2009;38(6):1599–1611. doi: 10.1093/ije/dyp192. [DOI] [PMC free article] [PubMed] [Google Scholar]
- 9.Khoury MJ, Gwinn M, Ioannidis JP. The emergence of translational epidemiology: from scientific discovery to population health impact. Am J Epidemiol. 2010;172(5):517–524. doi: 10.1093/aje/kwq211. [DOI] [PMC free article] [PubMed] [Google Scholar]
- 10.Westreich D. From exposures to population interventions: pregnancy and response to HIV therapy. Am J Epidemiol. 2014;179(7):797–806. doi: 10.1093/aje/kwt328. [DOI] [PMC free article] [PubMed] [Google Scholar]
- 11.Galea S. An argument for a consequentialist epidemiology. Am J Epidemiol. 2013;178(8):1185–1191. doi: 10.1093/aje/kwt172. [DOI] [PubMed] [Google Scholar]
- 12.Cates W., Jr Invited commentary: consequential(ist) epidemiology: let’s seize the day. Am J Epidemiol. 2013;178(8):1192–1194. doi: 10.1093/aje/kwt173. [DOI] [PubMed] [Google Scholar]
- 13.Hernán MA, Robins J. Causal Inference. 2013 doi: 10.1515/jci-2012-0002. http://www.hsph.harvard.edu/miguel-hernan/causal-inference-book/ [DOI] [PMC free article] [PubMed]
- 14.Fleischer NL, Fernald LC, Hubbard AE. Estimating the potential impacts of intervention from observational data: methods for estimating causal attributable risk in a cross-sectional analysis of depressive symptoms in Latin America. J Epidemiol Community Health. 2010;64(1):16–21. doi: 10.1136/jech.2008.085985. [DOI] [PubMed] [Google Scholar]
- 15.Greenland S. Concepts and pitfalls in measuring and interpreting attributable fractions, prevented fractions, and causation probabilities. Ann Epidemiol. 2015;25(3):155–161. doi: 10.1016/j.annepidem.2014.11.005. [DOI] [PubMed] [Google Scholar]
- 16.Young JG, Hernán MA, Robins JM. Epidemiol Methods. Vol. 3. De Gruyter; 2014. Identification, Estimation and Approximation of Risk under Interventions that Depend on the Natural Value of Treatment Using Observational Data; pp. 1–19. [DOI] [PMC free article] [PubMed] [Google Scholar]
- 17.Cole SR, Hudgens MG, Brookhart MA, Westreich D. Risk. Am J Epidemiol. 2015;181(4):246–250. doi: 10.1093/aje/kwv001. [DOI] [PMC free article] [PubMed] [Google Scholar]
- 18.Cole SR, Stuart EA. Generalizing evidence from randomized clinical trials to target populations: The ACTG 320 trial. Am J Epidemiol. 2010;172(1):107–115. doi: 10.1093/aje/kwq084. [DOI] [PMC free article] [PubMed] [Google Scholar]
- 19.Hernán MA. A definition of causal effect for epidemiological research. J Epidemiol Community Health. 2004;58(4):265–271. doi: 10.1136/jech.2002.006361. [DOI] [PMC free article] [PubMed] [Google Scholar]
- 20.Imbens G. Nonparametric Estimation of Average Treatment Effects Under Exogeneity: a Review. The Review of Economics and Statistics. 2004;86(1):4–29. [Google Scholar]
- 21.Imbens G, Wooldridge J. Recent Developments in the Econometrics of Program Evaluation. Journal of Economic Literature. 2009;47(1):5–86. [Google Scholar]
- 22.Petersen ML, van der Laan MJ. Causal models and learning from data: integrating causal modeling and statistical estimation. Epidemiology. 2014;25(3):418–426. doi: 10.1097/EDE.0000000000000078. [DOI] [PMC free article] [PubMed] [Google Scholar]
- 23.Koepsell T, Weiss N. Epidemiologic Methods: Studying the Occurrence of Illness. New York: Oxford University Press; 2003. [Google Scholar]
- 24.Poole C. Generalized effect estimation: An antidote to utopian preventive fantasies. (Abstract) Am J Epidemiol. 2003;157:S59. [Google Scholar]
- 25.Levin ML. The occurrence of lung cancer in man. Acta Unio Int Contra Cancrum. 1953;9(3):531–541. [PubMed] [Google Scholar]
- 26.Cole P, MacMahon B. Attributable risk percent in case-control studies. British journal of preventive & social medicine. 1971;25(4):242–244. doi: 10.1136/jech.25.4.242. [DOI] [PMC free article] [PubMed] [Google Scholar]
- 27.Miettinen OS. Proportion of disease caused or prevented by a given exposure, trait or intervention. Am J Epidemiol. 1974;99(5):325–332. doi: 10.1093/oxfordjournals.aje.a121617. [DOI] [PubMed] [Google Scholar]
- 28.Sturmans F, Mulder PG, Valkenburg HA. Estimation of the possible effect of interventive measures in the area of ischemic heart diseases by the attributable risk percentage. Am J Epidemiol. 1977;105(3):281–289. doi: 10.1093/oxfordjournals.aje.a112384. [DOI] [PubMed] [Google Scholar]
- 29.Ouellet BL, Romeder JM, Lance JM. Premature mortality attributable to smoking and hazardous drinking in Canada. Am J Epidemiol. 1979;109(4):451–463. doi: 10.1093/oxfordjournals.aje.a112703. [DOI] [PubMed] [Google Scholar]
- 30.Greenland S, Robins JM. Conceptual problems in the definition and interpretation of attributable fractions. Am J Epidemiol. 1988;128(6):1185–1197. doi: 10.1093/oxfordjournals.aje.a115073. [DOI] [PubMed] [Google Scholar]
- 31.Wacholder S. The impact of a prevention effort on the community. Epidemiology. 2005;16(1):1–3. doi: 10.1097/01.ede.0000147633.09891.16. [DOI] [PubMed] [Google Scholar]
- 32.Suzuki E, Yamamoto E, Tsuda T. On the relations between excess fraction, attributable fraction, and etiologic fraction. Am J Epidemiol. 2012;175(6):567–575. doi: 10.1093/aje/kwr333. [DOI] [PubMed] [Google Scholar]
- 33.Walter SD. Prevention for multifactorial diseases. Am J Epidemiol. 1980;112(3):409–416. doi: 10.1093/oxfordjournals.aje.a113007. [DOI] [PubMed] [Google Scholar]
- 34.Morgenstern H, Bursic ES. A method for using epidemiologic data to estimate the potential impact of an intervention on the health status of a target population. J Community Health. 1982;7(4):292–309. doi: 10.1007/BF01318961. [DOI] [PubMed] [Google Scholar]
- 35.Browner WS. Estimating the impact of risk factor modification programs. Am J Epidemiol. 1986;123(1):143–153. doi: 10.1093/oxfordjournals.aje.a114208. [DOI] [PubMed] [Google Scholar]
- 36.Greenland S, Drescher K. Maximum likelihood estimation of the attributable fraction from logistic models. Biometrics. 1993;49(3):865–872. [PubMed] [Google Scholar]
- 37.Muñoz ID, van der Laan M. Population intervention causal effects based on stochastic interventions. Biometrics. 2012;68(2):541–549. doi: 10.1111/j.1541-0420.2011.01685.x. [DOI] [PMC free article] [PubMed] [Google Scholar]
- 38.Danaei G, Pan A, Hu FB, Hernan MA. Hypothetical midlife interventions in women and risk of type 2 diabetes. Epidemiology. 2013;24(1):122–128. doi: 10.1097/EDE.0b013e318276c98a. [DOI] [PMC free article] [PubMed] [Google Scholar]
- 39.Moore KL, Neugebauer R, van der Laan MJ, Tager IB. Causal inference in epidemiological studies with strong confounding. Stat Med. 2012;31(13):1380–1404. doi: 10.1002/sim.4469. [DOI] [PMC free article] [PubMed] [Google Scholar]
- 40.Neyman J. On the Application of Probability Theory to Agricultural Experiments. Essay on Principles. Section 9. Statistical Science. 1923 [1990];5(4):465–472. Trans. Dorota M. Dabrowska and Terence P. Speed. [Google Scholar]
- 41.Hernán MA, Hernández-Díaz S. Beyond the intention-to-treat in comparative effectiveness research. Clin Trials. 2012;9(1):48–55. doi: 10.1177/1740774511420743. [DOI] [PMC free article] [PubMed] [Google Scholar]
- 42.Cain LE, Cole SR. Inverse probability-of-censoring weights for the correction of time-varying noncompliance in the effect of randomized highly active antiretroviral therapy on incident AIDS or death. Stat Med. 2009;28(12):1725–1738. doi: 10.1002/sim.3585. [DOI] [PubMed] [Google Scholar]
- 43.Hernán MA, Brumback B, Robins JM. Marginal structural models to estimate the causal effect of zidovudine on the survival of HIV-positive men. Epidemiology. 2000;11(5):561–570. doi: 10.1097/00001648-200009000-00012. [DOI] [PubMed] [Google Scholar]
- 44.Hernán MA, Robins JM. Estimating causal effects from epidemiological data. J Epidemiol Community Health. 2006;60(7):578–586. doi: 10.1136/jech.2004.029496. [DOI] [PMC free article] [PubMed] [Google Scholar]
- 45.Westreich D, Cole SR. Invited commentary: positivity in practice. Am J Epidemiol. 2010;171(6):674–677. doi: 10.1093/aje/kwp436. discussion 678–681. [DOI] [PMC free article] [PubMed] [Google Scholar]
- 46.VanderWeele TJ. Concerning the consistency assumption in causal inference. Epidemiology. 2009;20(6):880–883. doi: 10.1097/EDE.0b013e3181bd5638. [DOI] [PubMed] [Google Scholar]
- 47.Hernán MA, Vanderweele TJ. Compound treatments and transportability of causal inference. Epidemiology. 2011;22(3):368–377. doi: 10.1097/EDE.0b013e3182109296. [DOI] [PMC free article] [PubMed] [Google Scholar]
- 48.Hudgens MG, Halloran ME. Toward Causal Inference With Interference. J Am Stat Assoc. 2008;103(482):832–842. doi: 10.1198/016214508000000292. [DOI] [PMC free article] [PubMed] [Google Scholar]
- 49.Rothman KJ, Greenland S, Lash TL. Modern Epidemiology, Third Edition. Philadelphia: Lippincott Williams & Wilkins; 2008. [Google Scholar]
- 50.Galea S. Society for Epidemiologic Research Meeting; 2013; Boston, MA. 2013. [Google Scholar]
Associated Data
This section collects any data citations, data availability statements, or supplementary materials included in this article.