Abstract
Daytime light exposure has been reported to impact or have no influence on energy metabolism in humans. Further, whether inter-individual differences in wake, sleep, 24 h energy expenditure, and RQ during circadian entrainment and circadian misalignment are stable across repeated 24 h assessments is largely unknown. We present data from two studies: Study 1 of 15 participants (7 females) exposed to three light exposure conditions: continuous typical room ~100 lx warm white light, continuous ~750 lx warm white light, and alternating hourly ~750 lx warm white and blue-enriched white light on three separate days in a randomized order; and Study 2 of 14 participants (8 females) during circadian misalignment induced by a simulated night shift protocol. Participants were healthy, free of medical disorders, medications, and illicit drugs. Participants maintained a consistent 8 h per night sleep schedule for one week as an outpatient prior to the study verified by wrist actigraphy, sleep diaries, and call-ins to a time stamped recorder. Participants consumed an outpatient energy balance research diet for three days prior to the study. The inpatient protocol for both studies consisted of an initial sleep disorder screening night. For study 1, this was followed by three standard days with 16 h scheduled wakefulness and 8 h scheduled nighttime sleep. For Study 2, it was followed by 16 h scheduled wake and 8 h scheduled sleep at habitual bedtime followed by three night shifts with 8 h scheduled daytime sleep. Energy expenditure was measured using whole-room indirect calorimetry. Constant posture bedrest conditions were maintained to control for energy expenditure associated with activity and the baseline energy balance diet was continued with the same exact meals across days to control for thermic effects of food. No significant impact of light exposure was observed on metabolic outcomes in response to daytime light exposure. Inter-individual variability in energy expenditure was systematic and ranged from substantial to almost perfect consistency during both nighttime sleep and circadian misalignment. Findings show robust and stable trait-like individual differences in whole body 24 h, waking, and sleep energy expenditure, 24 h respiratory quotient—an index of a fat and carbohydrate oxidation—during repeated assessments under entrained conditions, and also in 24 h and sleep energy expenditure during repeated days of circadian misalignment.
Keywords: Shift work, Biological day, Biological night
1. Introduction
Light exposure has numerous influences on human physiology beyond vision including modulation of sleep and circadian physiology (Czeisler et al., 1989; Duffy and Wright, 2005), alteration of arousal (Altimus et al., 2008; Lupi et al., 2008; Tsai et al., 2009), regulation of the pupillary light reflex,(Hattar et al., 2003; Lucas et al., 2001; Lucas et al., 2003), and alterations in emotion (Iskra-Golec and Smith, 2008; Lewy et al., 1980) temperature physiology (Badia et al., 1991; Cajochen et al., 2005; Wright et al., 1997a, 1997b, 2000), and endocrine physiology (Jung et al., 2010; Lewy et al., 1980; Wright et al., 1997a, 1997b, 2000).
Less is known about the influence of light exposure on metabolism. In one study of healthy adults, adverse effects of daytime blue-enriched or evening bright light exposure was observed on insulin sensitivity and insulin responses to a meal (Cheung et al., 2016). In another study, morning bright light exposure had no impact on glucose or insulin in young lean healthy men, but increased fasting and post-prandial glucose in older overweight and obese men with Type-II diabetes (Versteeg et al., 2017). Whether light exposure affects energy expenditure and substrate oxidation is also not clear as inconsistent findings have been reported (Gaist et al., 1990; Pinchasov et al., 2000). (Gaist et al., 1990; Pinchasov et al., 2000) (Ivanova et al., 2017). Understanding whether light exposure influences energy expenditure and substrate oxidation has implications for health.
The effects of sleep loss and circadian disruption on energy expenditure (EE) and substrate oxidation in humans has been the focus of several recent studies (Bandin et al., 2015; Schoffelen and Westerterp, 2008; Van Etten et al., 1995), including studies by our group using whole-room indirect calorimetry. In those studies, we have shown that sleep loss (Jung et al., 2011; Markwald et al., 2013) and circadian misalignment (McHill et al., 2014) alter 24 h EE, sleeping EE, and substrate oxidation. Individual differences in 24 h EE and RQ are well known and are hypothesized to contribute to the risk of obesity (Howard et al., 1991; Ravussin, 1995; Zurlo et al., 1990). There are limited data however, on the stability of individual differences in 24 h, waking, and sleeping EE and RQ measures and contributing mechanisms of such individual differences. It could be hypothesized that individual differences in waking and sleeping EE and RQ are trait-like, and that such stable individual differences and responses to sleep and circadian challenges may be explained by individual factors such as of sex, age, fat mass, and fat free mass.
With regards to metabolism, the aim of study 1 in this report was to determine the effects of exposure to different levels of light (dim light, continuous bright warm light, and intermittent exposure to blue-enriched white light) on EE, substrate utilization (i.e., RQ), and glucose metabolism. We hypothesized that intermittent exposure blue-enriched white light would acutely increase EE relative to room-light control during the daytime hours. We focused on blue-enriched white light since non-image forming responses are most robust in response to light in the blue-green spectrum (Lucas et al., 2001). We also assessed whether light exposure influenced macronutrient oxidation as well as post meal glucose and insulin levels. Because we saw no effects of the different light exposure conditions tested on EE and 24 h RQ, this provided an opportunity to determine the repeatability of these measures under highly-controlled circadian entrained conditions. In addition to quantifying the repeatability of EE and RQ, we used data from a previously reported study from our group, here referred to study 2, to determine how the stability of individual differences in these measures is affected by circadian misalignment.(McHill et al., 2014). We hypothesized that individual differences in EE and RQ would be stable and trait-like during circadian entrained (study 1) and circadian misaligned (study 2) conditions.
2. Materials methods
2.1. Institutional approval and ethics
Procedures followed were in accordance with the ethical standards of the Helsinki Declaration of 1975 as revised in 1983. Studies were approved by the scientific and advisory review committee of the Colorado Clinical and Translational Sciences Institute and the Colorado Multiple Institutional Review Board.
Study 1 – daytime light exposure, energy and glucose metabolism, and stability of 24 h, scheduled wake and sleep EE
2.2. Participants and screening procedures
15 healthy adults (7 females) aged 23.3 ± 3.4 y, weight 65.3 ± 6.3 kg, body mass index (BMI) 22.4 ± 2.0 kg/m2 (± SD) participated. After providing written informed consent, participants underwent health screening consisting of medical, psychological, and sleep history, semi-structured clinical psychiatric interview, physical examination, complete blood count, comprehensive metabolic panel, urine toxicology, 12-lead electrocardiogram, and a polysomnographic sleep disorders screen. Inclusion criteria were age of 18–40 years old; BMI of 18.5–24.9 kg/m2; habitual nightly sleep duration > 7 h and < 9.25 h (based on self-report); and low to moderate caffeine use (< 500 mg/day). Exclusion criteria included self-reported smoking or nicotine use; current or chronic medical/psychiatric/sleep conditions; shift work or dwelling below Denver altitude (1600 m) in the year prior to study; travel across more than one time zone in the 3 weeks prior to study; recent self-reported weight loss; and positive urine toxicology screen.
After confirming inclusion criteria, RMR was assessed on a separate day. RMR was measured in the morning, following an overnight fast and 24 h abstention from exercise, using standard indirect calorimetry with the ventilated hood technique (TrueOne® 2400, ParvoMedics, Sandy, UT). Prior to the measurement, participants rested quietly for 30 min in a dimly lit, thermoneutral room. Respiratory gas exchange was measured for 30 min, and values from the last 20 min were used to determine RMR.
2.3. Experimental design and study procedures
The in-laboratory portion of the study was performed in the University of Colorado Hospital Clinical and Translational Research Center (CTRC) at the University of Colorado Anschutz Medical Campus. For one week prior to the laboratory study, participants were instructed to discontinue the use of caffeine, alcohol, nicotine, and over-the-counter medication and to maintain a consistent ~8 h per night sleep schedule based on habitual sleep and circadian timing. Sleep timing was verified via wrist actigraphy with light-exposure monitoring (Actiwatch-Spectrum; Philips Respironics Inc.), sleep logs, and call-ins to a time-stamped voice recorder to report sleep and wake times. Three days prior to admission, participants were provided a 3-day outpatient diet estimated to meet individual daily energy needs determined from RMR with an activity factor of 1.5. Participants were also instructed to refrain from planned exercise during these 3 days.
Upon admission for the laboratory portion of the study, verification of drug- and alcohol-free status was confirmed using urine toxicology screen and breath alcohol assessments (Lifeloc Technologies; model FC10). Participants were admitted ~8 h prior to their habitual bedtime and placed into room light (~100 lx in the angle of gaze; IL-1400 photometer, International Light) to begin the 4 day study period. Day 1 of the laboratory visit included an 8 h sleep opportunity to habituate participants to recordings as well as to serve as a sleep disorders screen. Days 2–4 were experimental days that consisted of 16 h of scheduled wakefulness followed by an 8 h sleep opportunity. Wakefulness and sleep opportunities were scheduled relative to each subject’s habitual bed and wake times based on the week of pre-study monitoring. A modified constant routine (Broussard et al., 2018; Duffy and Wright, 2005) was employed to control for the influence of environmental and behavioral factors on our primary outcome measures. Specifically, during scheduled wakefulness participants were studied in a semi-recumbent posture with the head of the bed raised to ~35 degrees, ambient temperature was maintained in the thermoneutral range (22.3–22.9 °C). Wakefulness and compliance with modified constant routine procedures were verified via monitoring by research staff and continuous monitoring of electroencephalographic (EEG) activity.
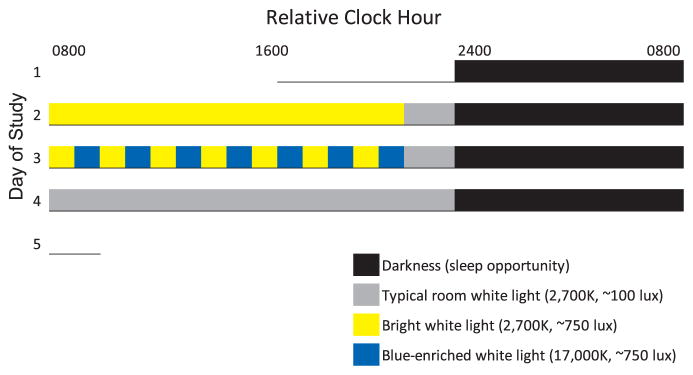
During experimental days 2–4, participants were exposed to three light exposure conditions in a randomized order: (1) 14 h of continuous ~750 lx warm white light (2700 K), (2) continuous ~100 lx room warm white light (2700 K) and (3) intermittent warm white and blue-enriched white light of ~750 lx (Fig. 1). Intermittent light exposure consisted of 1 h warm white (2700 K, ~750 lx) alternated every 1 h with blue-enriched white light (17,000 K, ~750 lx) across scheduled wakefulness. For all conditions, participants were exposed to warm white (2700 K, ~100 lx) light during the last 2 h hours prior to bedtime. The ~750 lx warm white light and blue-enriched white light levels in the angle of gaze are considered moderately bright for indoor lighting. Light exposure was administered with a custom built rack system (Philips Inc.) measuring 165 cm height x 165 cm width, composed of 2700 K (Philips MASTER TL5 HE 35 W/827) and 17,000 K (Philips MASTER TL5 HO Activa active 49 W) fluorescent bulbs. The light rack system was placed at the end of the bed approximately 0.8 M from the seated participant.
Fig. 1.
Protocol for Study 1. Relative Clock hour indicates the relative time of protocol events. Data presented in the manuscript plotted relative to waketime (0800 h relative clock hour) whereas actual clock hour of waketime was determined by the subjects’ habitual waketime from the week of prior ambulatory monitoring. Underline represents time in the lab on day one prior to bedtime. Legend provides light exposure information.
Whole-room indirect calorimetry was used to assess EE and RQ as previously described (Melanson et al., 2010). Hourly EE, 24 h EE, 24 h RQ, and scheduled sleep and wake EE were examined across conditions and daily to examine repeatability of 24 h, waking, and sleep EE and RQ.
Participants were provided scheduled meals (percent daily caloric intake: 30% breakfast, 30% lunch, 30% dinner, 10% evening snack) at 0.5, 4.5, 10.5, and 14.5 h post-awakening. The energy content of the diet was estimated to meet individual daily energy requirements as determined by RMR and an activity factor of 1.2 to account for a lack of physical activity during bed rest. Meals were identical (total energy and macronutrient composition) across study days (e.g., the food served for breakfast was the same each day) and free of caffeine and alcohol. Participants were required to consume all food provided. Blood was sampled prior to and after the dinner meal to test for the impact of the light exposure condition on glucose and insulin levels.
Study 2 – Stable individual differences in energy expenditure during circadian misalignment
To determine how repeatability of 24 h, waking, and sleep EE and RQ is affected by circadian misalignment, we used data from a simulated night shift work protocol.(McHill et al., 2014) Fourteen healthy young adults (8 women, aged 26 ± 5 y, weight 67.6 ± 8.1 kg, BMI 22.7 ± 0.5 kg/m2) were studied during a simulated shiftwork protocol in the whole-room calorimeter. Modified constant routine conditions (Broussard et al., 2018; Duffy and Wright, 2005) were employed with bed rest and thermoneutral temperature conditions as described for study 1. The first day in the calorimeter served as a baseline day, with 16 h of daytime wakefulness and 8 h of nighttime sleep opportunity. The second day in the calorimeter was a transition day with a 2 h afternoon nap opportunity and first night shift and the third and fourth days in the calorimeter room were nightshifts with 8 h daytime sleep opportunities and 16 h of wakefulness mostly during the biological night. Daytime sleep opportunities began 1 h after their habitual baseline waketime. As in study 1, participants were provided scheduled meals (percent daily caloric intake: 30% breakfast, 30% lunch, 30% dinner, 10% evening snack) at 0.5, 4.5, 10.5, and 14.5 h post-awakening on days 1, 3 and 4. Because day 2 in the calorimeter room simulated the transition day to nightshift 1 with an afternoon nap, the timing and percent of daily caloric intake (30% breakfast, 25% lunch, 10% snack, 25% dinner, 10% snack) were spread across that day and these meals were given at 1.5, 5.5, 10.5, 15.5, and 20.5 h after scheduled morning awakening. The energy content of the diet was estimated to meet individual daily energy requirements as determined by RMR and an activity factor of 1.2 to account for a lack of physical activity during bed rest. Meals were identical (total energy and macronutrient composition) across study days (e.g., the food served for breakfast was the same each day) and free of caffeine and alcohol. Participants were required to consume all food provided. Participants were shielded from all time cues during the experiment and maintained in dim light (< 1 lx in the angle of gaze, < 5 lx max). 24 h, waking, and sleeping EE and RQ were compared on days one and three to determine the effect of circadian misalignment. Specifically, we compared changes in 24 h, schedule wake, and sleep EE during circadian misalignment with daytime sleep and nighttime wakefulness to baseline with nighttime sleep and daytime wake.
2.4. Measurements
To determine how much inter-individual variability was technological rather than biological, we performed a gas infusion test to determine the accuracy of the whole room calorimetry system, as previously described (Brychta et al., 2009). Briefly, dried compressed nitrogen and CO2 were simultaneously infused for 10 h. The rate of infusion of each gas was controlled using separate thermal mass flow controllers connected to a mass flow programmer (MKS Instruments). The infusion rates were used to determine expected EE and RQ, which were subsequently compared to the measured EE and RQ.
Melatonin RIA (sensitivity 2.3 pg/mL, within-assay CV 13.4%, LDN Melatonin Direct RIA; Rocky Mountain Diagnostics) was performed by the Sleep and Chronobiology Laboratory. InsulinRIA (sensitivity 3 uU/mL; intra- and inter-assay coefficients of variation 5.2% and 9.8%, respectively Colorado Springs, CO, Millpore) and glucose using hexokinase, UV (sensitivity 10 mg/dL; intra- and interassay coefficients of variation 0.67% and 1.44%, respectively, Beckman Coulter) were performed by the CTRC core laboratory.
2.5. Statistical analyses
Data were analyzed with mixed model ANOVA, with condition and time as fixed factors. Dependent t-tests were used to test for planned comparisons. Unless otherwise stated, data are presented as mean ± SD. Generalized eta squared (η2G) effect sizes, computed using sum of squares from the mixed-effects ANOVA model, were used to assess the magnitude of effect of condition on select outcomes accounting for variance due to individual differences by including subject as a random factor in the model (Bakeman, 2005; Burke et al., 2015b; Olejnik and Algina, 2003). As there are no established benchmarks for η2G, we used standard benchmarks for small, medium and large effect sizes when using eta squared (η2), even though effects for η2G will be smaller than η2 –effect sizes of 0.02, 0.15, and 0.35 are termed small, medium, and large, respectively. Intra-class correlation coefficients (ICC) were used to test the stability of individual differences in 24 h EE and RQ as well as scheduled wake and sleep EE during circadian entrainment with wake during the daytime and sleep at night (Study 1) and during circadian misalignment with wake during the night and sleep during the daytime (Study 2). The ICC model (McGraw and Wong, 1996) used the following formula:
where MSS=mean square subject, MSE=mean square error, k=number of conditions, n=number of participants, and MSC=mean square condition. The following arbitrary benchmarks from Landis and Koch (Landis and Koch, 1977) were used to describe the strength of agreement of ICC scores: < 0.00=poor, 0.00–0.20=slight, 0.21–0.40=fair, 0.41–0.60=moderate, 0.61–0.80=substantial, 0.81–1.00=almost perfect. The average absolute difference in energy expenditure outcomes for Study 1 was calculated for descriptive purposes as outcomes were not impacted by condition. Further, Pearson correlations were calculated between wake and sleep EE and RQ.
3. Results
3.1. Daytime light exposure, energy and glucose metabolism
Hourly EE (Fig. 2a), hourly RQ (Fig. 2b), and glucose and insulin levels in response to dinner (Fig. 3a–b) did not differ across conditions (all p > 0.45). Planned comparisons showed that for one time point after dinner, glucose levels were higher under the bright versus normal room light condition (Fig. 3a). Effect sizes of condition were less than small (all η2G < 0.02) for 24 h EE, 24 h RQ, and for average glucose and insulin responses to dinner.
Fig. 2.
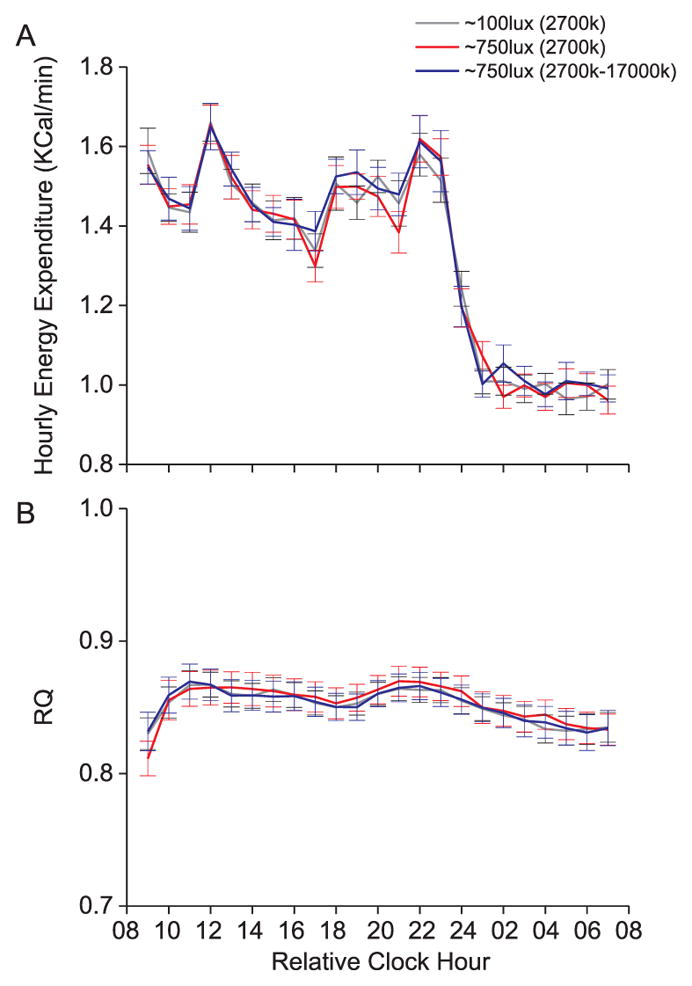
Hourly energy expenditure and Respiratory Quotient (RQ) values for study 1. Black box = scheduled sleep episode. Data are mean +/− SEM. Increases in energy expenditure during the daytime represent the thermic effects of food.
Fig. 3.
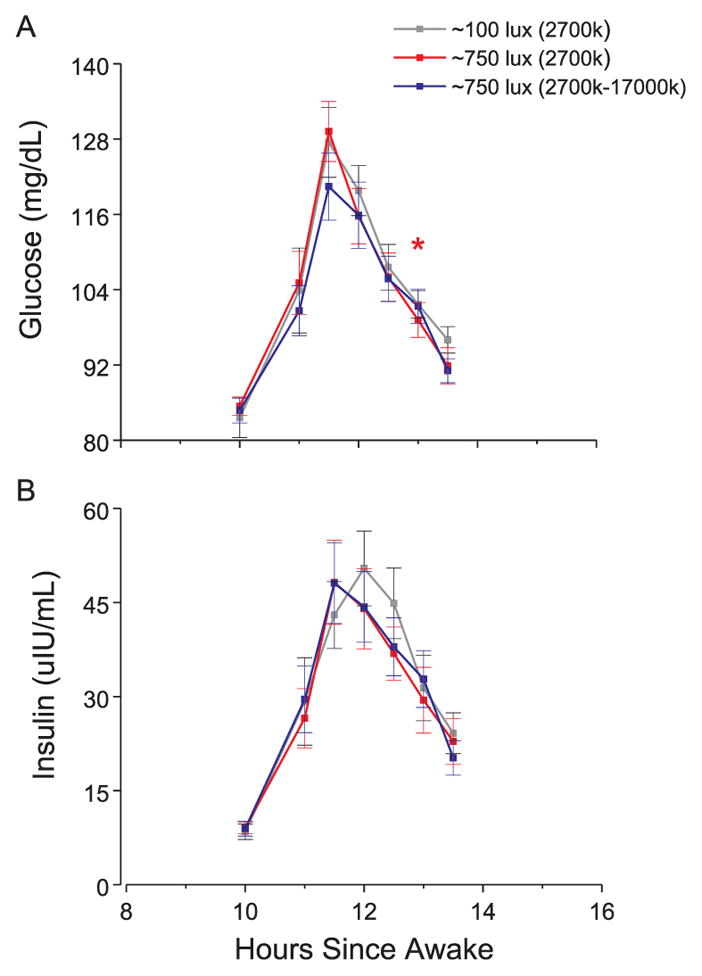
Glucose and insulin responses to dinner test meal for study 1.
3.2. Stability of 24 h, scheduled wake and sleep energy expenditure during circadian entrainment and technical variation
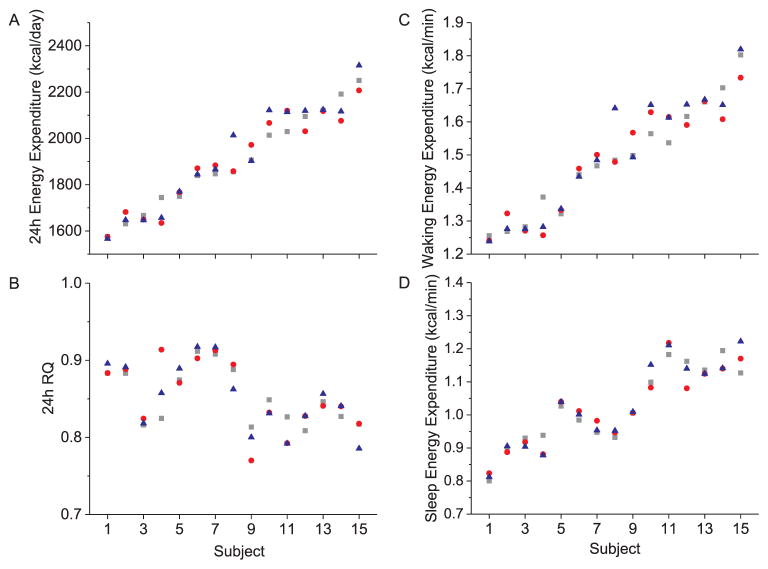
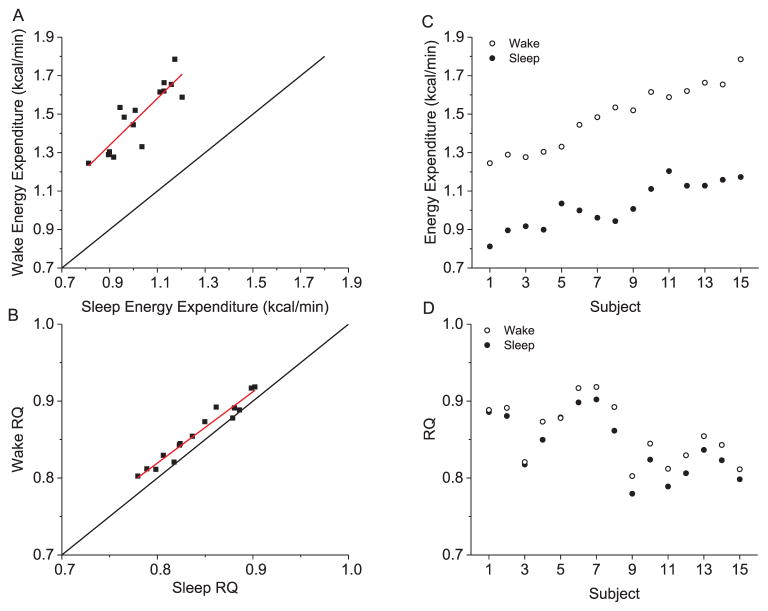
Because hourly EE and RQ did not differ by condition, we examined the repeatability of 24 h EE (Fig. 4A) and 24 h RQ (Fig. 4A) as well as scheduled wake and sleep EE (Fig. 4C–D) under these highly controlled laboratory conditions. The average absolute differences between days in 24 h EE (~27 ± 28 kcal/day), 24 h RQ (0.01 ± 0.01), wake EE (0.02 ± 0.03 kcal/min), and sleep EE (0.01 ± 0.02 kcal/min) were small. The ICCs for 24 h EE showed “almost perfect” consistency without (ICC = 0.96) and with (ICC = 0.81) control of the individual factors of sex, age, fat mass, and fat free mass. Similar results were observed for 24 h RQ (ICCs = 0.84 and 0.83), waking EE (ICCs = 0.93 and 0.81), and sleep EE (ICCs = 0.96 and 0.81). Wake and sleep EE (r = 0.87, p < 00001) and RQ (r = 0.98, p < 00001) were strongly correlated (Fig. 5A–B). The influence of sleep-wake state was stronger than that of individual differences and thus ICCs between wake and sleep EE was “slight” ICC = 0.14 (Fig. 5C), whereas individual differences were “almost perfect” for RQ (Fig. 5D) regardless of sleep-wake state (ICC = 0.90).
Fig. 4.
Individual differences in daily energy metabolism during circadian alignment in Study 1. A) 24 h energy expenditure, B) 24 h respiratory quotient (RQ), C) energy expenditure during scheduled wake, D) energy expenditure during scheduled sleep. Grey square represents average data for 100 lx day, red circle represents average data for 750 lx bright white light day, blue triangle represents average data for 750 lx blue-enriched white light day. Data for the 15 individual subjects are displayed along the x-axis plotted according to the rank order of subjects’ 24 h energy expenditure shown in 5A. (For interpretation of the references to color in this figure legend, the reader is referred to the web version of this article.)
Fig. 5.
Associations between scheduled wake and sleep energy metabolism averaged across study days in study 1. A) correlation between wake and sleep energy expenditure, B) correlation between wake and sleep respiratory quotient (RQ), C) individual differences in wake and sleep energy expenditure, D) individual differences in wake and sleep RQ. Data for the 15 individual subjects are displayed along the x-axis for figures C and D, plotted according to the rank order of subjects’ 24 h energy expenditure shown in 5 A. Black line represent the line of identity and red line represents best linear fit.
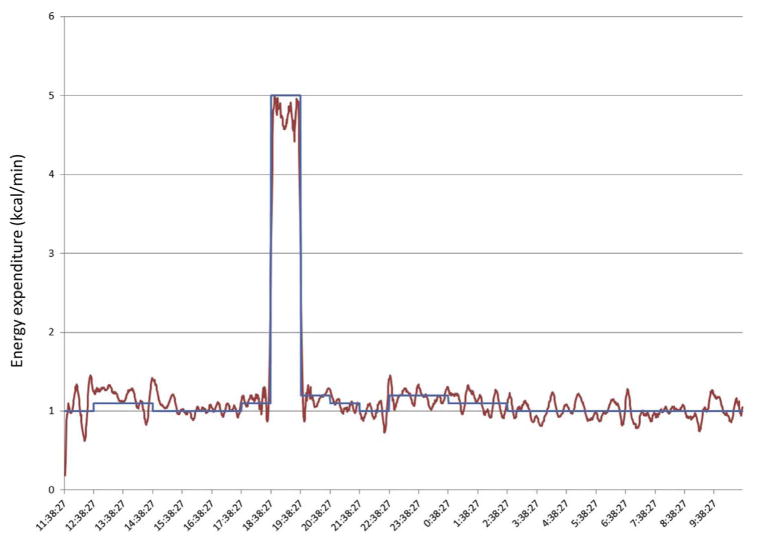
Because the ICCs from these repeated measurements are likely influenced by both biological and technological variation, we tested technological variation of our metabolic chamber using a gas infusion system that uses high precision mass flow controllers and infusions of nitrogen and carbon dioxide gasses. Using this system, we tested the integrated response of our system across a range of known EE and RQ values. An example of one such test is shown in Fig. 6. In this test, the infusion rates were programmed to mimic a typical human study, including meal consumption (with a 10% post-meal consumption increase in EE due to the thermic effect of feeding) and exercise. We show that the cumulative EE and RQ is within 1% of expected values. These results demonstrate that any contribution of technological variation to variation in measured EE and RQ is minimal.
Fig. 6.
Sample trace of gas infusion trace. Read line represents actual energy expenditure measured by the room calorimeter. Blue line represents expected energy expenditure based on the programmed gas infusion and mass flow rates. (For interpretation of the references to color in this figure legend, the reader is referred to the web version of this article.)
3.3. Stability of 24 h, scheduled wake and sleep energy expenditure during circadian misalignment
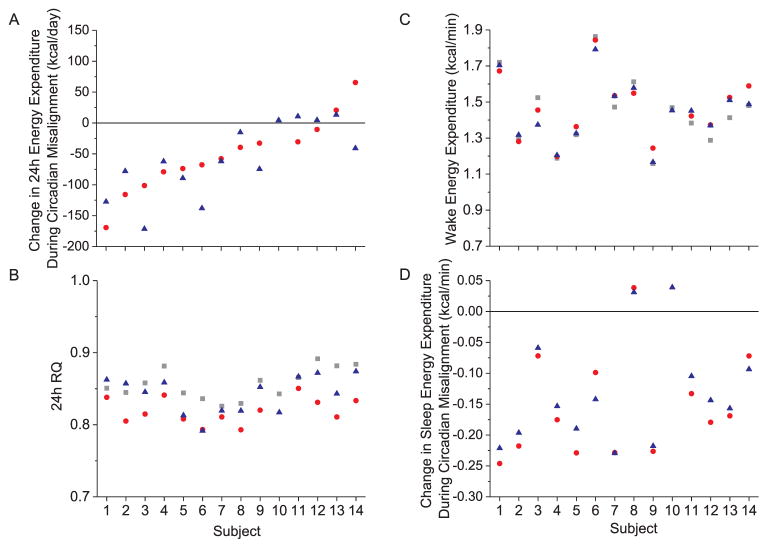
We previously reported that 24 h EE was reduced during circadian misalignment, largely due to a reduction in sleep EE (Days 4 and 5 versus Day 2 baseline), and that fat oxidation was increased on Day 4 versus baseline during circadian misalignment (McHill et al., 2014). We therefore examined the stability of the change in 24 h EE (Fig. 7A), in 24 h RQ (Fig. 7B), in waking EE (Fig. 7C) and the change in sleep EE (Fig. 7D) during circadian misalignment. The ICC for 24 h EE (data not shown) showed “almost perfect” consistency, ICC = 0.96 and was “substantial” when controlling for the individual factors of sex, age, fat mass, and fat free mass, ICC = 0.77. The ICC for the change in 24 h EE during circadian misalignment from baseline (Fig. 7A) showed “substantial” consistency without, ICC = 0.68, and with controlling for the individual factors, ICC = 0.71. As noted, we reported that fat oxidation was significantly reduced on Day 4 versus baseline (McHill et al., 2014) and as 24 h RQ reflects the change in macronutrient oxidation, the ICC consistency in 24 h RQ was “moderate”, ICC = 0.43, and was reduced to “slight”, ICC = 0.16 when controlling for the individual factors. The ICC for wake EE (Fig. 7C) showed “almost perfect” consistency, ICC = 0.95, and was reduced to “substantial” consistency, ICC = 0.74 when controlling for the individual factors. Lastly, the ICC for the change in sleep EE during circadian misalignment from baseline (Fig. 7D) showed “almost perfect” consistency without, ICC = 0.93, and with controlling for the individual factors, ICC = 0.93.
Fig. 7.
Individual differences in daily energy metabolism during circadian misalignment in study 2. A) Change in 24 h energy expenditure from baseline during circadian misalignment, B) 24 h respiratory quotient (RQ), C) energy expenditure during scheduled wake, D) change in scheduled sleep energy expenditure from baseline during circadian misalignment. Grey squares represent average data for study day 2 (baseline) with scheduled wake during the daytime and sleep at night, red circles represent data for study day 4 with scheduled sleep during the daytime and wake at night (night shift 2), blue triangles represent data for study day 5 with scheduled sleep during the daytime and wake at night (night shift 3). Data for the 14 individual subjects are displayed along the x-axis plotted according to the rank order of subjects’ change in 24 h energy expenditure shown in 7A. (For interpretation of the references to color in this figure legend, the reader is referred to the web version of this article.)
4. Discussion
One day of exposure to full spectrum bright light and blue-enriched bright light had little to no effect on EE and glucose metabolism in healthy young adults. The stability of EE outcomes during typical circadian entrainment conditions of sleep at night and wake during the daytime were “almost perfect” overall, even when controlling for factors reported to contribute to differences in EE such as sex, age, fat mass, and fat free mass. The stability of EE outcomes during days of circadian misalignment induced by a simulated night shift work schedule with sleep during the daytime and wake at night, were “substantial” to “almost perfect” overall, even when controlling for factors reported to contribute to differences in EE such as sex, age, fat mass, and fat free mass.
The less than small effect sizes for effect of light condition on EE and glucose metabolism suggest that if bright indoor daytime light has an effect on metabolism, it is likely to be small; especially since we used a sensitive, randomized within-subject research design that controlled for factors that influence energy metabolism including having the participants maintain bed rest conditions, scheduling wakefulness and sleep at the participants’ habitual times, and having participants consume the exact same meals at the exact same time each day. Our EE findings are consistent with those from another study in which acute exposure to 30 min morning bright light (4,300 lx) has no significant effect on EE (Ivanova et al., 2017). Fasting glucose and insulin, as well as meal responses during daytime and nighttime light exposure, have been examined in a few studies and findings have been mixed. For example, blue-enriched morning and evening light exposure (combined 260 lx white light background with up to 370 lx blue-light in the angle of gaze) for three hours was reported to induce insulin resistance as measured by HOMA-IR fasting, and by HOMA-post prandial and insulin AUC responses to meals, with no impact on glucose AUC (Cheung et al., 2016). Exposure to morning bright light (4000 lx) compared to dim light (10 lx) for 5 h beginning at 0730 h was reported to increase fasting and glucose AUC to a meal 1 h into light exposure in older overweight and obese men with Type 2 diabetes. However, insulin AUC and insulin sensitivity did not change. Further, the same light exposure had no impact on glucose or insulin responses to a meal in young lean healthy men (Versteeg et al., 2017). Exposure to light at night (600 lx from 2300 to 0800 h) during sleep deprivation was reported to increase insulin AUC, but not significantly impact HOMA-IR or HOMA-post prandial to a late evening test meal scheduled approximately 3 h after melatonin onset (Gil-Lozano et al., 2016). Similarly, exposure to light at night (500 lx from 1800 to 0600 h) during sleep deprivation was reported to increase glucose and insulin AUC, but not HOMA-IR or HOMA-post prandial to a late evening meal scheduled ~3 h after melatonin onset (Albreiki et al., 2017). A limitation of all studies published to date, including the current study, is the use of meal responses to assess glucose metabolism responses. Meal tests tend to be less sensitive to metabolic alterations and other tests such as oral and intravenous tolerance tests or clamps, which should be considered to help clarify the discrepant reported findings.
Stable, trait-like, individual differences have been reported for many sleep and circadian related outcomes (e.g., performance (Leproult et al., 2003; Van Dongen et al., 2004), EEG (Chua et al., 2014; Tarokh et al., 2015), heart rate and eye movement (Chua et al., 2014), responses to sleep deprivation, hormonal responses to awakening (Bright et al., 2014), awakenings in response to environmental stimuli (McGuire et al., 2016), weight gain, increased energy intake, late-night eating and fat intake in response to insufficient sleep (Spaeth et al., 2015), and phase shifting responses to caffeine or light (Burke et al., 2015a)). Findings from the current study extend the above to include 24 h EE, 24 h RQ, wake and sleeping EE during typical circadian entrainment and changes in response to circadian misalignment. The decrease in 24 h EE during circadian misalignment was robust and trait-like. This finding may help to identify individuals who may be at a higher risk of unwanted weight gain and obesity during shift work. Such individual differences were not explained by sex, age, weight, fat mass or fat free mass. Thus, understanding mechanisms underlying such individual differences in waking and sleep energy metabolism and how they may or may not contribute to health outcomes of interest requires additional research. The participants tested the in current studies were healthy and relatively young men and women. Additional research is needed in other populations to determine the stability of individual differences in energy metabolism across the lifespan and in clinical populations and as well as in other metabolic outcomes.
Acknowledgments
We thank the participants, the University Colorado Boulder Clinical Translational Research Center staff, and J. Guzetti, B. Birks, B. Smith, B. Brainard, B. Griffin, and G. Wright, for study assistance.
Sources of funding
This research was supported by the National Institutes of Health (NIH R21 DK092624, NIH/NCATS Colorado CTSA Grant Number UL1 TR001082, P30 DK048520), a Grant from Philips Incorporated, and the Undergraduate Research Opportunities Program in collaboration with the Howard Hughes Medical Institute and Biological Sciences Initiative.
Footnotes
Disclosures
ELM has research support from Somalogics.
KPW has research support from CurAegis Technologies (formerly known as Torvec Inc.) and Somalogics, consulting fees from or served as a paid member of scientific advisory boards for the Sleep Disorders Research Advisory Board - National Heart, Lung and Blood Institute, CurAegis Technologies, Circadian Therapeutics, LTD. and has received speaker/educational consultant honorarium fees from the American Academy of Sleep Medicine, American College of Chest Physicians, American College of Sports Medicine, American Diabetes Association, Associated Professional Sleep Societies, and the Obesity Medicine Association.
References
- Albreiki MS, et al. A single night light exposure acutely alters hormonal and metabolic responses in healthy participants. Endocr Connect. 2017;6:100–110. doi: 10.1530/EC-16-0097. [DOI] [PMC free article] [PubMed] [Google Scholar]
- Altimus CM, et al. Rods-cones and melanopsin detect light and dark to modulate sleep independent of image formation. Proc Natl Acad Sci USA. 2008;105:19998–20003. doi: 10.1073/pnas.0808312105. [DOI] [PMC free article] [PubMed] [Google Scholar]
- Badia P, et al. Bright light effects on body temperature, alertness, EEG and behavior. Physiol Behav. 1991;50:583–588. doi: 10.1016/0031-9384(91)90549-4. [DOI] [PubMed] [Google Scholar]
- Bakeman R. Recommended effect size statistics for repeated measures designs. Behav Res Methods. 2005;37:379–384. doi: 10.3758/bf03192707. [DOI] [PubMed] [Google Scholar]
- Bandin C, et al. Meal timing affects glucose tolerance, substrate oxidation and circadian-related variables: a randomized, crossover trial. Int J Obes (Lond) 2015;39:828–833. doi: 10.1038/ijo.2014.182. [DOI] [PubMed] [Google Scholar]
- Bright MA, et al. Individual differences in the cortisol and salivary alpha-amylase awakening responses in early childhood: relations to age, sex, and sleep. Dev Psychobiol. 2014;56:1300–1315. doi: 10.1002/dev.21209. [DOI] [PubMed] [Google Scholar]
- Broussard JL. Circadian rhythms versus daily patterns in human physiology and behavior. In: Kumar V, editor. Biological Timekeeping: Clocks, Rhythms and Behaviour. 2018. pp. 279–295. [Google Scholar]
- Brychta RJ, et al. Optimizing energy expenditure detection in human metabolic chambers. Conf Proc IEEE Eng Med Biol Soc. 2009;2009:6864–6868. doi: 10.1109/IEMBS.2009.5333121. [DOI] [PMC free article] [PubMed] [Google Scholar]
- Burke TM, et al. Effects of caffeine on the human circadian clock in vivo and in vitro. Sci Transl Med. 2015a;7:305ra146. doi: 10.1126/scitranslmed.aac5125. [DOI] [PMC free article] [PubMed] [Google Scholar]
- Burke TM, et al. Sleep inertia, sleep homeostatic and circadian influences on higher-order cognitive functions. J Sleep Res. 2015b;24:364–371. doi: 10.1111/jsr.12291. [DOI] [PMC free article] [PubMed] [Google Scholar]
- Cajochen C, et al. High sensitivity of human melatonin, alertness, thermo-regulation, and heart rate to short wavelength light. J Clin Endocrinol Metab. 2005;90:1311–1316. doi: 10.1210/jc.2004-0957. [DOI] [PubMed] [Google Scholar]
- Cheung IN, et al. Morning and evening blue-enriched light exposure alters metabolic function in normal weight adults. PLoS One. 2016;11:e0155601. doi: 10.1371/journal.pone.0155601. [DOI] [PMC free article] [PubMed] [Google Scholar]
- Chua EC, et al. Individual differences in physiologic measures are stable across repeated exposures to total sleep deprivation. Physiol Rep. 2014:2. doi: 10.14814/phy2.12129. [DOI] [PMC free article] [PubMed] [Google Scholar]
- Czeisler CA, et al. Bright light induction of strong (type 0) resetting of the human circadian pacemaker. Science. 1989;244:1328–1333. doi: 10.1126/science.2734611. [DOI] [PubMed] [Google Scholar]
- Duffy JF, Wright KP., Jr Entrainment of the human circadian system by light. J Biol Rhythm. 2005;20:326–338. doi: 10.1177/0748730405277983. [DOI] [PubMed] [Google Scholar]
- Gaist PA, et al. Effects of bright light on resting metabolic rate in patients with seasonal affective disorder and control subjects. Biol Psychiatry. 1990;28:989–996. doi: 10.1016/0006-3223(90)90064-9. [DOI] [PubMed] [Google Scholar]
- Gil-Lozano M, et al. Short-term sleep deprivation with nocturnal light exposure alters time-dependent glucagon-like peptide-1 and insulin secretion in male volunteers. Am J Physiol Endocrinol Metab. 2016;310:E41–E50. doi: 10.1152/ajpendo.00298.2015. [DOI] [PubMed] [Google Scholar]
- Hattar S, et al. Melanopsin and rod-cone photoreceptive systems account for all major accessory visual functions in mice. Nature. 2003;424:76–81. doi: 10.1038/nature01761. [DOI] [PMC free article] [PubMed] [Google Scholar]
- Howard BV, et al. Studies of the etiology of obesity in Pima Indians. Am J Clin Nutr. 1991;53:1577S–1585S. doi: 10.1093/ajcn/53.6.1577S. [DOI] [PubMed] [Google Scholar]
- Iskra-Golec I, Smith L. Daytime intermittent bright light effects on processing of laterally exposed stimuli, mood, and light perception. Chronobiol Int. 2008;25:471–479. doi: 10.1080/07420520802118103. [DOI] [PubMed] [Google Scholar]
- Ivanova IA, et al. Investigation of an immediate effect of bright light on oxygen consumption, heart rate, cortisol, and alpha-amylase in seasonal affective disorder subjects and healthy controls. Neuropsychobiology. 2017;74:219–225. doi: 10.1159/000477248. [DOI] [PubMed] [Google Scholar]
- Jung CM, et al. Acute effects of bright light exposure on cortisol levels. J Biol Rhythm. 2010;25:208–216. doi: 10.1177/0748730410368413. [DOI] [PMC free article] [PubMed] [Google Scholar]
- Jung CM, et al. Energy expenditure during sleep, sleep deprivation and sleep following sleep deprivation in adult humans. J Physiol. 2011;589:235–244. doi: 10.1113/jphysiol.2010.197517. [DOI] [PMC free article] [PubMed] [Google Scholar]
- Landis JR, Koch GG. The measurement of observer agreement for categorical data. Biometrics. 1977;33:159–174. [PubMed] [Google Scholar]
- Leproult R, et al. Individual differences in subjective and objective alertness during sleep deprivation are stable and unrelated. Am J Physiol Regul Integr Comp Physiol. 2003;284:R280–R290. doi: 10.1152/ajpregu.00197.2002. [DOI] [PubMed] [Google Scholar]
- Lewy AJ, et al. Light suppresses melatonin secretion in humans. Science. 1980;210:1267–1269. doi: 10.1126/science.7434030. [DOI] [PubMed] [Google Scholar]
- Lucas RJ, et al. Characterization of an ocular photopigment capable of driving pupillary constriction in mice. Nat Neurosci. 2001;4:621–626. doi: 10.1038/88443. [DOI] [PubMed] [Google Scholar]
- Lucas RJ, et al. Diminished pupillary light reflex at high irradiances in melanopsin-knockout mice. Science. 2003;299:245–247. doi: 10.1126/science.1077293. [DOI] [PubMed] [Google Scholar]
- Lupi D, et al. The acute light-induction of sleep is mediated by OPN4-based photoreception. Nat Neurosci. 2008;11:1068–1073. doi: 10.1038/nn.2179. [DOI] [PubMed] [Google Scholar]
- Markwald RR, et al. Impact of insufficient sleep on total daily energy expenditure, food intake, and weight gain. Proc Natl Acad Sci USA. 2013;110:5695–5700. doi: 10.1073/pnas.1216951110. [DOI] [PMC free article] [PubMed] [Google Scholar]
- McGraw KO, Wong SP. Forming inferences about some intraclass correlation coefficients. Pscyhol Methods. 1996;1:30–46. [Google Scholar]
- McGuire S, et al. Inter-individual differences in the effects of aircraft noise on sleep fragmentation. Sleep. 2016;39:1107–1110. doi: 10.5665/sleep.5764. [DOI] [PMC free article] [PubMed] [Google Scholar]
- McHill AW, et al. Impact of circadian misalignment on energy metabolism during simulated nightshift work. Proc Natl Acad Sci USA. 2014;111:17302–17307. doi: 10.1073/pnas.1412021111. [DOI] [PMC free article] [PubMed] [Google Scholar]
- Melanson EL, et al. A new approach for flow-through respirometry measurements in humans. Am J Physiol Regul Integr Comp Physiol. 2010;298:R1571–R1579. doi: 10.1152/ajpregu.00055.2010. [DOI] [PMC free article] [PubMed] [Google Scholar]
- Olejnik S, Algina J. Generalized eta and omega squared statistics: measures of effect size for some common research designs. Psychol Methods. 2003;8:434–447. doi: 10.1037/1082-989X.8.4.434. [DOI] [PubMed] [Google Scholar]
- Pinchasov BB, et al. Mood and energy regulation in seasonal and non-seasonal depression before and after midday treatment with physical exercise or bright light. Psychiatry Res. 2000;94:29–42. doi: 10.1016/s0165-1781(00)00138-4. [DOI] [PubMed] [Google Scholar]
- Ravussin E. Low resting metabolic rate as a risk factor for weight gain: role of the sympathetic nervous system. Int J Obes Relat Metab Disord. 1995;19(Suppl 7):S8–S9. [PubMed] [Google Scholar]
- Schoffelen PF, Westerterp KR. Intra-individual variability and adaptation of overnight- and sleeping metabolic rate. Physiol Behav. 2008;94:158–163. doi: 10.1016/j.physbeh.2007.12.013. [DOI] [PubMed] [Google Scholar]
- Spaeth AM, et al. Phenotypic vulnerability of energy balance responses to sleep loss in healthy adults. Sci Rep. 2015;5:14920. doi: 10.1038/srep14920. [DOI] [PMC free article] [PubMed] [Google Scholar]
- Tarokh L, et al. The spectrum of the non-rapid eye movement sleep electroencephalogram following total sleep deprivation is trait-like. J Sleep Res. 2015;24:360–363. doi: 10.1111/jsr.12279. [DOI] [PubMed] [Google Scholar]
- Tsai JW, et al. Melanopsin as a sleep modulator: circadian gating of the direct effects of light on sleep and altered sleep homeostasis in Opn4(−/−) mice. PLoS Biol. 2009;7:e1000125. doi: 10.1371/journal.pbio.1000125. [DOI] [PMC free article] [PubMed] [Google Scholar]
- Van Dongen HP, et al. Systematic interindividual differences in neurobehavioral impairment from sleep loss: evidence of trait-like differential vulnerability. Sleep. 2004;27:423–433. [PubMed] [Google Scholar]
- Van Etten LM, et al. Effect of weight-training on energy expenditure and substrate utilization during sleep. Med Sci Sport Exerc. 1995;27:188–193. [PubMed] [Google Scholar]
- Versteeg RI, et al. Acute effects of morning light on plasma glucose and triglycerides in healthy men and men with type 2 diabetes. J Biol Rhythm. 2017;32:130–142. doi: 10.1177/0748730417693480. [DOI] [PMC free article] [PubMed] [Google Scholar]
- Wright KP, Jr, et al. Combination of bright light and caffeine as a countermeasure for impaired alertness and performance during extended sleep deprivation. J Sleep Res. 1997a;6:26–35. doi: 10.1046/j.1365-2869.1997.00022.x. [DOI] [PubMed] [Google Scholar]
- Wright KP, Jr, et al. Caffeine and light effects on nighttime melatonin and temperature levels in sleep-deprived humans. Brain Res. 1997b;747:78–84. doi: 10.1016/s0006-8993(96)01268-1. [DOI] [PubMed] [Google Scholar]
- Wright KP, Jr, et al. Acute effects of bright light and caffeine on nighttime melatonin and temperature levels in women taking and not taking oral contraceptives. Brain Res. 2000;873:310–317. doi: 10.1016/s0006-8993(00)02557-9. [DOI] [PubMed] [Google Scholar]
- Zurlo F, et al. Low ratio of fat to carbohydrate oxidation as predictor of weight gain: study of 24-h RQ. Am J Physiol. 1990;259:E650–E657. doi: 10.1152/ajpendo.1990.259.5.E650. [DOI] [PubMed] [Google Scholar]


