Abstract
Purpose
To determine the diagnostic performance and inter-reader agreement of a standardized diagnostic algorithm for determining the histologic type of small (<=4cm) renal masses (SRM) with multiparametric magnetic resonance imaging (MRI).
Materials and Methods
This single-center, retrospective, HIPAA-compliant, IRB-approved study included 103 patients with 109 SRM, resected between December 2011 and July 2015. The requirement for informed consent was waived. Pre-surgical renal MRIs were reviewed by 7 radiologists with diverse experience. Eleven MRI features were assessed and a standardized diagnostic algorithm used to determine the most likely histologic diagnosis, which was compared to histopathology after surgery. Inter-reader variability was tested with Cohen’s κ. Regression models using MRI features were used to predict the histopathologic diagnosis with 5% significance level.
Results
Clear-cell (ccRCC) and papillary type renal cell carcinomas (pRCC) were diagnosed with respective sensitivities of 85% (47/55) and 80% (20/25), and specificities of 76% (41/54) and 94% (79/84). Inter-reader agreement was moderate-to-substantial (ccRCC, κ=0.58; pRCC, κ=0.73). Signal intensity of the lesion on T2-weighted images (T2W) and degree of contrast enhancement during corticomedullary phase (CE) were independent predictors of ccRCC (T2W OR: 3.19 CI95%: [1.4, 7.1], p=0.003; CE OR: 4.45 [1.8, 10.8], p<0.001) and pRCC (CE OR: 0.053 [0.02, 0.2], p<0.001), both with substantial inter-reader agreement (T2W, κ=0.69; CE, κ=0.71). Lower performance was observed for chromophobe histology, oncocytomas, and minimal-fat angiomyolipomas, [ranges, sensitivity=14%(1/7)–67%(4/6), specificity=97%(100/103)–99%(101/102)], with fair-to-moderate inter-reader agreement (κ=0.23–0.43). Segmental enhancement inversion was an independent predictor of oncocytomas (OR: 16.21 [1.0, 275.4], p=0.049), with moderate inter-reader agreement (κ=0.49).
Conclusion
The proposed standardized MRI-based diagnostic algorithm had a diagnostic accuracy of 81% (88/109) and 91% (99/109) for the diagnosis of ccRCC and pRCC, respectively, while achieving moderate to substantial inter-reader agreement among 7 radiologists.
Introduction
The incidence of small renal masses (SRM, i.e., T1a ≤4 cm) has dramatically increased in the last decades, mainly due to the widespread utilization of cross-sectional imaging (1). A shift towards earlier stage diagnosis of incidental SRM has not been translated, however, into lower renal cancer-specific mortality rates (2), suggesting a possible overtreatment effect. Indeed, up to 16% of the SRM are proven to be benign (3), and will not benefit from definitive therapy (i.e., surgery or percutaneous ablation).
Management decisions between definitive therapy and active surveillance (i.e., systematic observation) are guided by the perceived risk of disease progression and development of metastatic disease, which in turn, could be assessed by percutaneous biopsy with histopathologic analysis (4, 5). Although percutaneous biopsy has been proposed for risk stratification (6), it is invasive and not devoid of complications (7). In addition, renal biopsy may yield indeterminate results (8), particularly for tumor grading (9). Thus, the development of competitive noninvasive methodologies for assessing histologic types and tumor grade would be desirable.
Numerous studies have reported the potential application of magnetic resonance imaging (MRI) for histologic subtyping of renal cell carcinoma (RCC) and differentiation of benign from malignant renal masses. For instance, T2-weighted imaging (T2W) aids in the differentiation between papillary RCC (pRCC) and clear cell RCC (ccRCC) (10), and between minimal-fat angiomyolipomas (mfAML) and ccRCC (11). Similarly, multiphasic and dynamic contrast-enhanced (DCE) MRI can help differentiating between ccRCC, pRCC, and chromophobe RCC (chrRCC) (12), and oncocytomas from chrRCC and ccRCC (13). Despite the existence of robust data supporting the utility of MRI features for characterizing SRM, there is a paucity of initiatives aimed to create an easily applicable, standardized, and robust diagnostic system for multiparametric MRI in clinical practice. The purpose of our study was to determine the diagnostic performance and inter-reader agreement of a standardized diagnostic algorithm for determining the histologic type of SRM on multiparametric MRI.
Materials and methods
Study Design
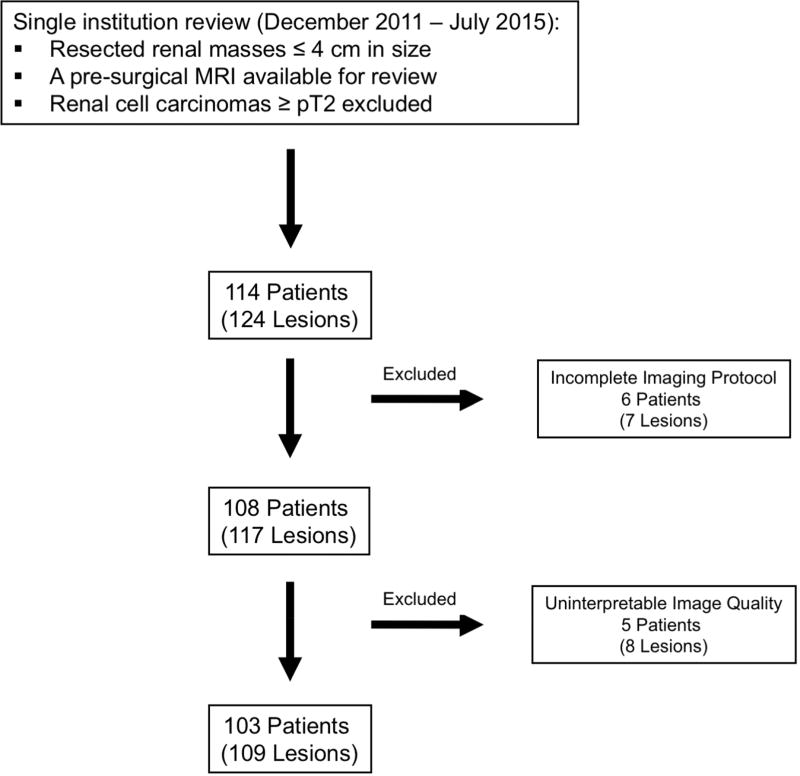
This single-center retrospective Health Insurance Portability and Accountability Actcompliant study was approved by the Institutional Review Board, and requirement for informed consent was waived. A medical record review identified patients who underwent surgical resection of a renal mass measuring 4 cm or less between December 2011 and July 2015, and who had a pre-surgical multiparametric MRI of the kidneys available for analysis. Pathologic stage ≥T2, uninterpretable MRI due to poor image quality, and lack of essential MRI sequences per local institutional protocol (refer below) were excluded (Fig 1). This cohort was included in a previous study, although no overlap exists in the analyses performed (14). The previous study evaluated the diagnostic accuracy of a likelihood score for the prediction of clear cell histology (14). In contrast, the current study assesses the diagnostic performance and inter-reader agreement of a standardized diagnostic algorithm for the diagnosis of the most common malignant and benign histologic diagnoses in SRM and analyzes the contribution of individual imaging findings in achieving the correct diagnosis.
Fig 1.
Study flowchart
MRI Studies
Essential sequences included axial and coronal non-fat-suppressed and fat-suppressed T2W multi-shot or single-shot fast spin echo, T1-weighted (T1W) gradient recalled echo (GRE) in- and opposed-phase imaging, and three-dimensional fat-suppressed spoiled GRE or Dixon-based multiphasic contrast-enhanced T1W (acquisition parameters available in Table E1). Examinations performed at different medical centers, but with essential sequences available, were included. One of the body MRI-trained authors that did not participate in the analysis of imaging features (FK 9 years of post-residency practice) was responsible for reviewing all studies to exclude those with suboptimal imaging quality or non-standard acquisition parameters. All patients imaged at our institution received a bolus of 0.1 mmol/kg of body weight of Gadobutrol I.V. (Gadavist, Bayer Healthcare) and post-contrast acquisitions were timed to the corticomedullary phase using MRI fluoroscopy technique, early and late nephrographic, and early and late excretory phase, the latter acquired 20 secs, 40 secs, 2 min and 5 min after the corticomedulary phase, respectively. All MRIs performed at other imaging centers and included in this study had at least an acquisition during the corticomedullary phase and a late nephrographic phase. Although diffusion weighted imaging (DWI) acquisitions are also acquired as part of this protocol at the authors’ institution, they were not consistently available on studies performed elsewhere; therefore, DWI was not included in the analysis.
Image Interpretation
Images were independently reviewed by 7 radiologists with body MRI training (IP and JRL 15 years; DC 12 years; GK 10 years; TY 7 years; DFP 5 years; ADL 1 year), who were blinded to clinical and histopathologic information, using a PACS workstation (iSite Intellispace, Philips). Reviewers were provided with a training session prior to image review for standardization of image interpretation. The training session consisted of a slide presentation with examples of the different criteria proposed in the standardized diagnostic algorithm (see below), using renal masses not included in the cohort analyzed in this study. This algorithm was created by one of the authors (IP) based on clinical experience, and had been used as a teaching tool for residents and fellows of the body MRI section for 2 years before the study. All reviewers were familiarized with the tool. Table 1 summarizes the definition of each MRI feature with its respective categories.
Table 1.
MRI Features: Definition of Imaging Features and Respective Categories
| Features | Definition | Categories |
|---|---|---|
| T2W Signal Intensity | Lesion intensity in comparison to normal renal cortex on non-fat-suppressed T2W images |
|
| T2W Signal Heterogeneity | Lesion texture as observed on fat-suppressed T2W images |
|
| Intravoxel Fat | Signal dropout on OP images compared to IP images |
|
| Bulk Fat | High signal intensity on non-fat-suppressed T1- or T2W images, with signal dropout on fat-suppressed images; “India ink” artifact at the interface between the hyperintense focus and adjacent renal parenchyma |
|
| Magnetic Susceptibility | Decreased signal intensity on T1W IP images compared to the shorter echo time OP images |
|
| Central Scar | High signal intensity on T2W images at the lesion core, exhibiting no enhancement after intravenous contrast administration and surrounded by enhancing solid tumor |
|
| Hemorrhage | High signal intensity on pre-contrast, fat-saturated T1W images |
|
| Segmental Enhancement Inversion | Areas within the renal mass with intense enhancement during the corticomedullary phase, later washing out, and areas with low level enhancement during the corticomedullary phase exhibiting intense enhancement on delayed post contrast acquisitions (20, 21) |
|
| Contrast Enhancement | During the corticomedullary phase, which was rated as low, moderate, or high if the enhancing portions of the renal mass exhibited approximately ≤30%, 50%, or 100%, enhancement, respectively, compared to renal cortex enhancement |
|
| Dynamic Characteristics | Mass enhancement during the late nephrographic phase, as follows: progressive (at least 10% more than corticomedullary phase), plateau (approximately 10% of the corticomedullary phase), or washout (at least 10% less than corticomedullary phase) |
|
| Enhancement Heterogeneity | Lesion texture as observed on post-contrast images |
|
Note – T1W, T1-weighted; T2W, T2-weighted; IP, in-phase; OP, out-of-phase
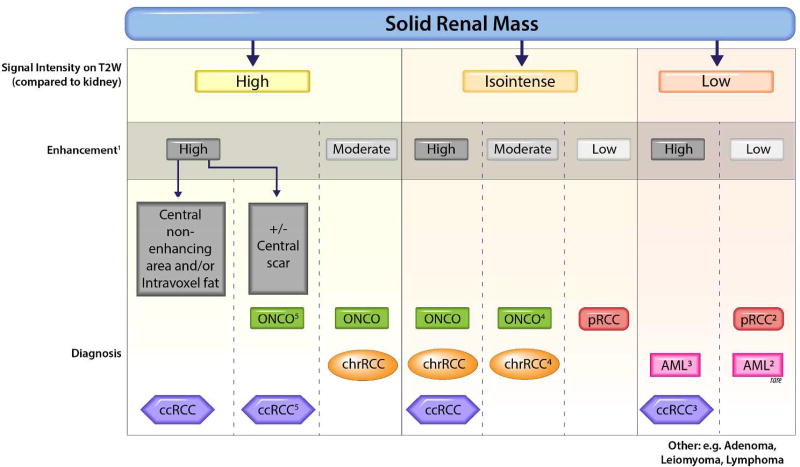
After assessing the MRI features, reviewers were asked to provide the most likely histopathologic diagnosis. A previously reported diagnostic algorithm (15) illustrated in Fig 2 was provided as guideline for defining the most likely diagnosis; notwithstanding, reviewers were allowed to overrule the algorithm ad libitum. In addition, a ‘nonspecific’ diagnosis could be assigned if imaging features failed to fall into a specific diagnostic bin. This option was allowed since some of the diagnostic branches provided more than one diagnostic possibility (e.g., isointense signal on T2W and high contrast enhancement on post-contrast T1W); hence, a specific diagnosis could not be established.
Fig 2.
Diagnostic algorithm for characterization of solid renal masses. Vertical dotted lines indicate different branches in the diagnostic algorithm based on the T2-weighted and enhancement characteristics. The most likely diagnoses in each branch is indicated at the bottom. Readers use ancillary findings to select the most likely diagnosis within each branch. 1) Enhancement during corticomedullary phase. Intense: ≥ renal cortex; moderate: approximately 50% of renal cortex; mild: approximately 25–30% of renal cortex. 2) Arterial-delayed enhancement ratio (ADER), which is the difference in signal intensity between arterial and pre-contrast phase divided by the difference between delayed and pre-contrast phase (29). ADER >1.5 favors "minimal-fat" AML, while <1.5 favors RCC. 3) ccRCC is typically heterogeneous; "minimal-fat" AML is typically homogeneous. 4) Oncocytoma is typically hypervascular (enhances similarly to renal cortex), while chrRCC has typically moderate enhancement (approximately 50% of renal cortex). 5) Oncocytoma if central scar is present, whereas ccRCC is favored if necrosis is present or if tumor is heterogeneous. *Use ancillary findings for characterization. ccRCC, clear cell renal cell carcinoma; ONCO, oncocytoma; chrRCC, chromophobe renal cell carcinoma; pRCC, papillary renal cell carcinoma; AML, minimalfat angiomyolipoma
Standard of Reference
The post-surgical histological diagnosis served as the standard of reference for all tumors, and was determined by review of the medical records. The diagnosis was performed by genitourinary pathologists of our institution, who classified and graded all tumors (i.e., RCC) using the 2004 World Health Organization (WHO) and International Society of Urological Pathology (ISUP) classifications, respectively (16, 17).
Statistical Analysis
Performance analyses only included the most common diagnoses (i.e., ccRCC, pRCC, chrRCC, oncocytoma, mfAML) because of the low frequency of other diagnoses, but data from all lesions were tabulated. Univariate and multivariate analyses for predicting histologic diagnosis were calculated for each finding using generalized linear mixed model with logit link function, adjusted for lesions clustered in a same patient. To account for the multi-reader study design, reviewers were also treated as a random factor in all mixed-effect models. The dependent variable was dichotomized as the occurrence of the specific diagnosis versus all other diagnoses, using the post-surgical histological standard of reference. Variable selection on multivariable stepwise analysis was done by L1-penalized estimation (LASSO), which shrinks the coefficients of the variables per a penalty parameter (lambda). The optimal penalty parameter was chosen based on the Akaike information criterion (AIC). Coefficients of the LASSO regression were estimated and hypothesis tests with the null of no effect (coefficient = 0) were conducted with a z test. Diagnostic performance was tested against the histopathologic diagnosis for each reviewer, with the median and ranges among reviewer reported for sensitivity, specificity, positive predictive value (PPV), negative predictive value (NPV), and accuracy. Overall differences in the diagnostic accuracy when reviewers adhered to the proposed diagnostic algorithm versus nonadherence (i.e. final diagnosis not included in the branch of the diagnostic algorithm with the selected specific MRI features) were tested with the Cochran–Mantel–Haenszel test. Simple pairwise Cohen’s κ was used to measure the inter-reader agreement for binary response imaging features, whereas linear weighted pairwise κ was used to assess agreement for ordinal ternary response features (0–0.20 = slight, 0.21–0.40 = fair, 0.41–0.60 = moderate, 0.61–0.80 = substantial, and 0.81–1 = almost perfect agreement). Spearman’s ρ was used to test years of experience versus diagnostic performance. All statistical analyses were performed with SAS version 9.4 (SAS Institute Inc.). A p<0.05 was considered statistically significant.
Results
Study Cohort
The final cohort comprised 103 patients with 109 lesions, 46% women (47/103) and 54% men (56/103), with mean age of 56.7±14.1 years and mean BMI of 28.7±5.9 kg/m2. Nine percent of the patients (9/103) had a previous history of renal cell carcinoma, different than the SRM included in this study. The median number of days between the MRI and surgery was 65 (range, 12 to 486 days). Approximately half of the renal masses were imaged at our institution (54/109), with the remainder studies acquired at outside facilities (55/109). Fifty-nine percent (61/103) of the patients were imaged on 1.5 T systems, whereas 41% (42/103) were imaged on 3.0 T scanners. MRI scanner manufacturers included Philips (46%, 47/103), Siemens (34%, 35/103), General Electric (17%, 18/103), Hitachi (2%, 2/103), and Toshiba (1%, 1/103). Table 2 includes frequencies and sizes of all renal masses included in the study. ccRCC was the most common diagnosis with 50% (55/109), followed by pRCC with 23% (25/109) and chrRCC with 6% (7/109). Benign histology accounted for 17% (18/109) of the lesions, with oncocytoma being the most common benign lesion (7/109), followed by mfAML (6/109).
Table 2.
Tumor Size and Histologic Type
| Pathologic Diagnosis | n (%) | Diameter (mm, Mean ± SD) |
|---|---|---|
| Clear Cell RCC | 55 (50.46) | 22.4 ± 8.18 |
| ▪ Low-grade Clear Cell RCC | 49 (44.95) | 21.51 ± 6.45 |
| ▪ High-grade Clear Cell RCC | 6 (5.50) | 29.67 ± 9.22 |
| Papillary RCC | 25 (22.94) | 22.94 ± 7.33 |
| ▪ Type 1 | 20 (18.35) | 25.15 ± 8.69 |
| ▪ Type 2 | 5 (4.59) | 25.00 ± 4.30 |
| Chromophobe RCC | 7 (6.42) | 23.71 ± 8.87 |
| Oncocytoma | 6 (5.50) | 19.83 ± 4.26 |
| Minimal-Fat AML | 6 (5.50) | 19.33 ± 8.16 |
| Other | 10 (9.17) | 21.60 ± 8.04 |
| ▪ Clear Cell Papillary RCC | 3 (2.75) | 22.95 ± 7.30 |
| ▪ Multilocular Benign Cyst | 2 (1.83) | 21.67 ± 8.31 |
| ▪ Cystic Nephroma | 2 (1.83) | 24.60 ± 6.84 |
| ▪ Metanephric Adenoma | 1 (0.92) | 28 |
| ▪ Tuberous Sclerosis-RCC | 1 (0.92) | 22 |
| ▪ Carcinoid | 1 (0.92) | 14 |
| Total | 109 (100%) | 22.72 ± 7.42 |
Note – RCC, renal cell carcinoma; AML, angiomyolipoma; SD, standard deviation.
Inter-reader Agreement, MRI Features and Histologic Diagnosis
Median pairwise inter-reader agreement was substantial for degree of contrast enhancement (κ=0.71), T2W signal intensity (κ=0.69), presence of hemorrhage (κ=0.67), and bulk fat (κ=0.66). Inter-reader agreement was moderate for the presence of magnetic susceptibility (κ=0.57), segmental enhancement inversion (κ=0.49), T2W texture (κ=0.48), intravoxel fat (κ=0.47), and central scar (κ=0.42). Agreement was only fair for enhancement homogeneity (κ=0.35), and dynamic characteristics (κ=0.28).
Diagnostic performance (sensitivity, specificity, PPV, NPV, and accuracy) for reviewers’ most likely histopathologic diagnosis on multiparametric MRI, and respective inter-reader agreements, are summarized in Table 3. Median pairwise inter-reader agreement with the use of the algorithm was substantial for the diagnosis of pRCC (κ=0.73), moderate for the diagnosis of ccRCC (κ=0.58) and mfAML (κ=0.43), and fair for the diagnosis of oncocytoma (κ=0.26) and chrRCC (κ=0.23).
Table 3.
Diagnostic Performance by Pathologic Subtype (All Reviewers)
| Pathologic Subtype |
Sensitivity | Specificity | PPV | NPV | Accuracy | Kappa |
|---|---|---|---|---|---|---|
| Clear Cell RCC | 85%(71–98%) | 76%(69–85%) | 77%(74–87%) | 83%(74–98%) | 81%(75–92%) | 0.58(0.33–0.71) |
| Papillary RCC | 80%(68–96%) | 94%(90–98%) | 79%(71–92%) | 94%(91–98%) | 91%(88–97%) | 0.73(0.61–0.81) |
| Chromophobe RCC | 14%(14–29%) | 99%(95–100%) | 50%(17–100%) | 94%(94–95%) | 94%(90–95%) | 0.23(−0.02–0.80) |
| Oncocytoma | 33%(17–83%) | 97%(91–99%) | 38%(25–63%) | 96%(95–99%) | 94%(90–96%) | 0.26(0.07–0.80) |
| Minimal Fat AML | 67%(33–83%) | 98%(95–100%) | 67%(44–100%) | 98%(95–98%) | 98%(95–98%) | 0.43(0.19–0.65) |
Note - Values represent median among all reviewers with range in parentheses. RCC, renal cell carcinoma; AML, angiomyolipoma; PPV, positive predictive value; NPV, negative predictive value
Table 4 exhibits the results from univariate and multivariate models using MRI features for prediction of ccRCC, pRCC, chrRCC, oncocytoma, and mf AML.
Table 4.
Logistic Regression: Imaging Features by Histologic Subtype (All Reviewers)
| Features | Clear Cell RCC | Papillary RCC | Chromophobe RCC | Oncocytoma | Minimal-Fat AML | |||||
|---|---|---|---|---|---|---|---|---|---|---|
| Univariate | Multivariate | Univariate | Multivariate | Univariate | Multivariate | Univariate | Multivariate | Univariate | Multivariate | |
| T2W Signal Intensity | OR: 3.29 p=0.000 | OR: 3.19 p=0.003 | OR: 0.19 p=0.006 | NS | OR: 0.56 p=0.046 | NS | NS | NS | OR: 0.37 p=0.001 | NS |
| T2W Signal Heterogeneity | OR: 3.52 p=0.000 | NS | OR: 0.34 p=0.014 | NS | NS | NS | NS | NS | OR: 0.39 p=0.003 | NS |
| Intravoxel Fat | OR: 2.68 p=0.011 | NS | N.S. | NS | OR: 0.045 p=0.003 | NS | OR: 0.18 p=0.047 | NS | OR: 3.20 p=0.018 | NS |
| Bulk Fat | NS | NS | NS | NS | NC | NS | NC | NS | OR: 80.14 p=0.047 | NS |
| Magnetic Susceptibility | NS | NS | NS | NS | NS | NS | NC | NS | OR: 0.11 p=0.040 | NS |
| Central Scar | OR: 2.92 p=0.020 | NS | OR: 0.11 p=0.033 | NS | NS | NS | OR: 6.28 p=0.001 | NS | NS | NS |
| Hemorrhage | NS | NS | OR: 5.45 p=0.024 | NS | NS | NS | NS | NS | OR: 0.066 p=0.002 | NS |
| Segmental Enhancement Inversion | NS | NS | NC | NS | NS | NS | OR: 28.50 p=0.000 | OR: 16.21 p=0.049 | NS | NS |
| Contrast Enhancement | OR: 9.99 p=0.000 | OR: 4.45 p=0.000 | OR: 0.056 p=0.000 | OR: 0.053 p=0.000 | NS | NS | OR: 3.58 p=0.001 | NS | NS | NS |
| Dynamic Characteristics | NS | NS | NS | NS | NS | NS | NS | NS | NS | NS |
| Enhancement Heterogeneity | OR: 3.56 p=0.000 | NS | OR: 0.29 p=0.030 | NS | NS | NS | NS | NS | OR: 0.44 p=0.008 | NS |
Note – Categories within MRI features are ordinally arranged in Table 1; OR, Odds Ratio; T2W, T2-weighted image; RCC, renal cell carcinoma; AML, angiomyolipoma.
NC – not calculated due to collinearity
NS – non-significant (p-value greater than 0.05)
Clear Cell Renal Cell Carcinoma
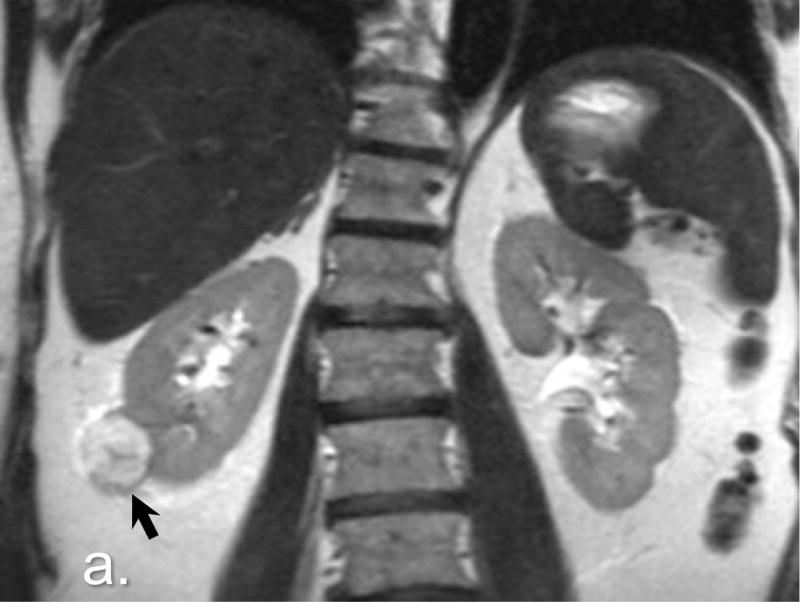
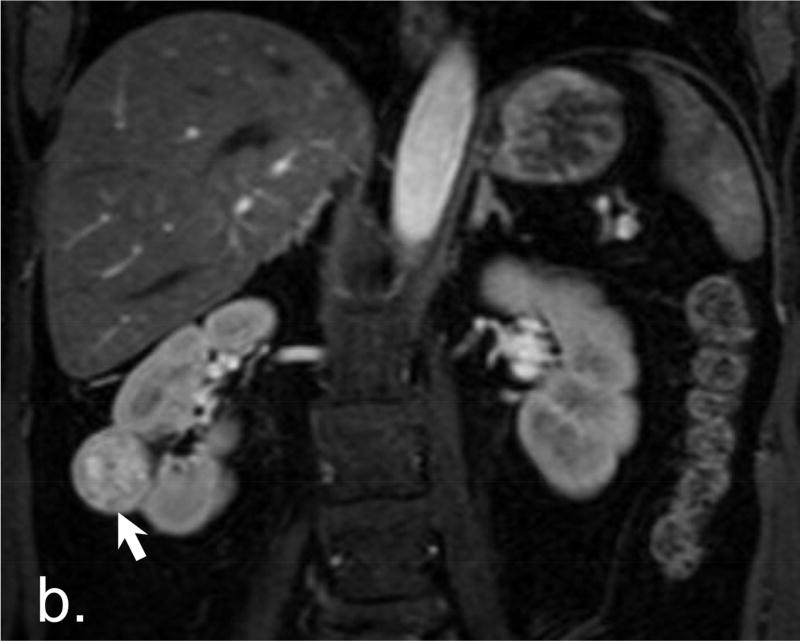
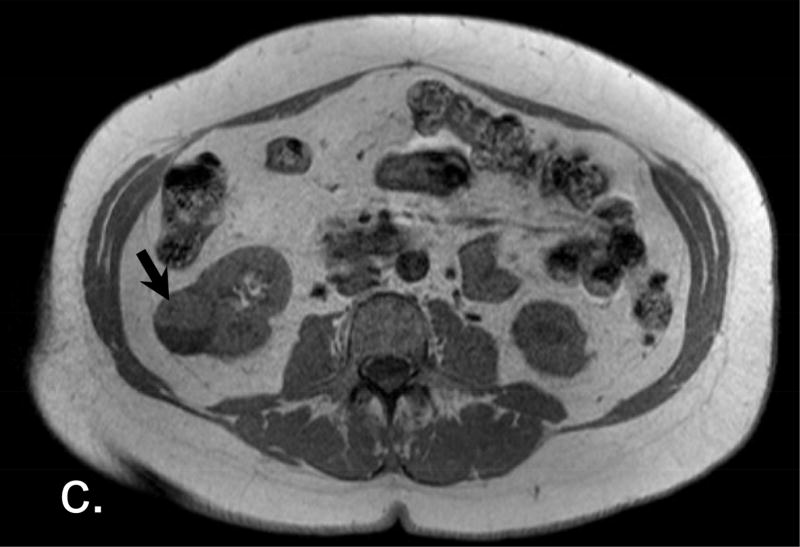
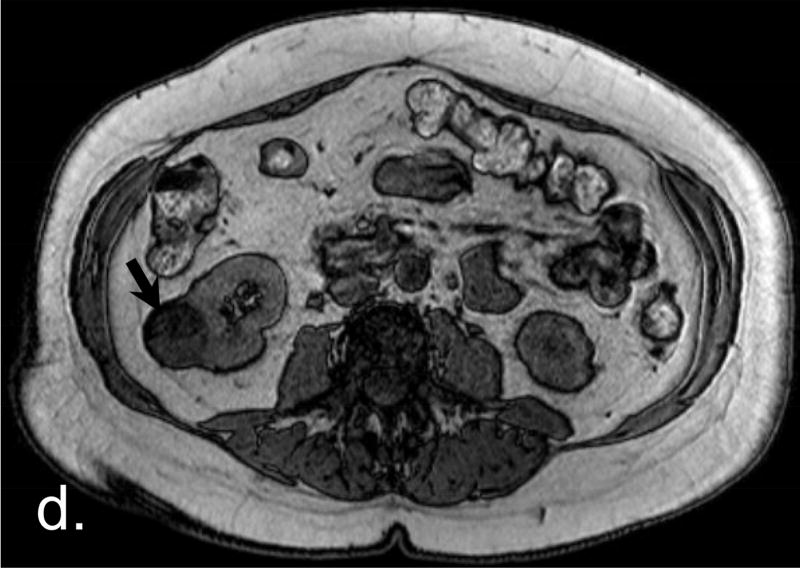
Features associated with ccRCC on univariate analyses included increased T2W signal intensity (odds ratio, OR: 3.29 CI95%: [2.1, 5.2], p<0.001), heterogeneous T2W texture (OR: 3.52 [1.9, 6.4], p<0.001), intravoxel fat (OR: 2.68 [1.3, 5.8], p=0.011), high contrast enhancement (OR: 9.99 [4.6, 21.7], p<0.001) and heterogeneous enhancement (OR: 3.56 [2.1, 6.2], p<0.001). On the multivariate analysis, ccRCC was predicted by signal intensity on T2W (high vs low, OR: 3.19 [1.4, 7.1], p<0.001) and degree of contrast enhancement (high vs low, OR: 4.45 [1.8, 10.8], p<0.0001). Sensitivities and specificities of reviewers for the diagnosis of ccRCC ranged from 71% (39/55) to 98% (54/55) and from 69% (37/54) to 85% (46/54), respectively. Fig 3 (3a 3b 3c 3d) exemplifies MRI features encountered in a pathologically proven ccRCC from our dataset.
Fig 3.
Clear Cell Renal Cell Carcinoma. a. A high signal intensity exophytic small renal mass in the lower pole of the right kidney (arrow) is noted in this coronal non-fat-saturated T2-weighted single-shot fast spin-echo. b. On post contrast (corticomedullary) coronal fat-saturated T1-weighted gradient recalled echo, the lesion shows high contrast enhancement (arrow). c, d. Also note the presence of intravoxel-fat, characterized by signal dropout on out-of-phase non-fat-saturated T1-weighted gradient recalled echo (d) in comparison with in-phase images (c) (arrows). Surgical resection confirmed a clear cell renal cell carcinoma.
Papillary Renal Cell Carcinoma
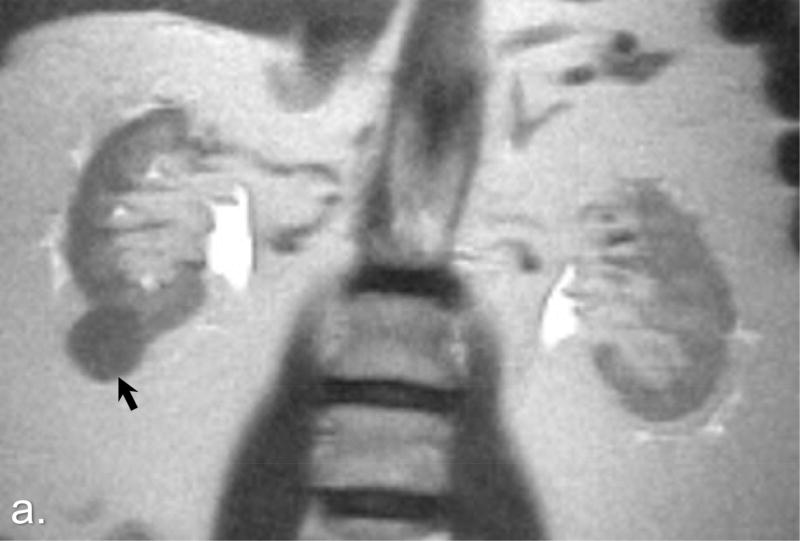
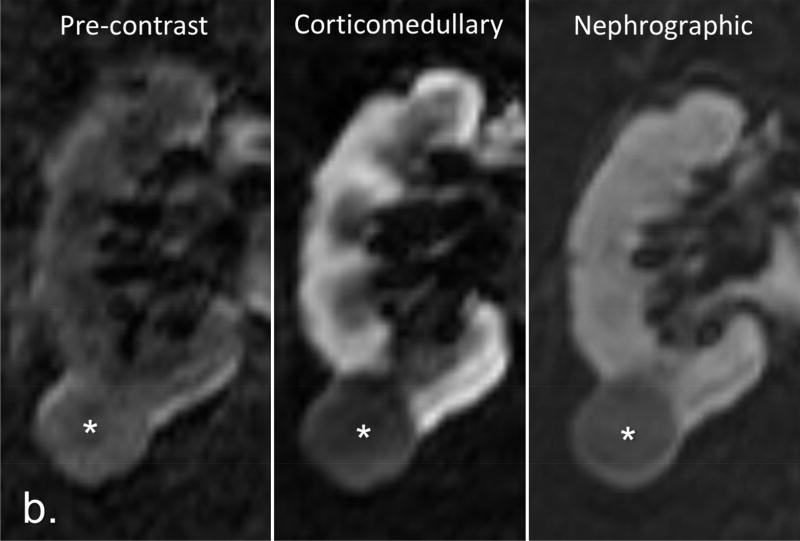
Features associated with pRCC were lower T2W signal intensity (OR: 0.19 [0.06, 0.6], p=0.006), homogeneous T2W texture (OR: 0.34 [0.1, 0.8], p=0.014), absence of central scar (OR: 0.11 [0.01, 0.8], p=0.033), presence of hemorrhage (OR: 5.45 [1.3, 23.6], p=0.024), low contrast enhancement (OR: 0.056 [0.01, 0.3], p<0.001), and homogeneous contrast enhancement (OR: 0.29 [0.09, 0.9], p=0.03) on univariate analyses. pRCC was only independently predicted by degree of contrast enhancement (low vs high, OR: 0.053 [0.02, 0.2], p<0.0001) on the multivariate analysis (Fig 4, 4a 4b). The most likely histopathologic diagnosis defined by the reviewers had sensitivities ranging from 68% (17/25) to 96% (24/25) and specificities from 90% (76/84) to 98% for diagnosing pRCC (82/84).
Fig 4.
Papillary Renal Cell Carcinoma. a. A low-signal intensity lesion is noted on this coronal non-fat-saturated T2-weighted single-shot fast spin-echo image (arrow). b. The same lesion shows signal intensity analogous to renal cortex on pre-contrast coronal T1-weighted fat-saturated spoiled-gradient recalled echo image, with low contrast enhancement on both corticomedullary and nephrographic phases (asterisks) when compared with renal cortex enhancement. Pathologic analysis revealed a papillary type renal cell carcinoma.
Chromophobe Renal Cell Carcinoma
Features associated with chrRCC on univariate analyses included low T2W signal intensity (OR: 0.56 [0.31, 0.99], p=0.046) and absence of intravoxel fat (OR: 0.045 [0.006, 0.3], p=0.003). None of the MRI features could independently predict chrRCC on the multivariate analysis. Reviewer’s sensitivity for the diagnosis of chrRCC ranged from 14% (1/7) to 29% (2/7), while specificity ranged from 95% (97/102) to 100% (102/102).
Oncocytoma
Features associated with oncocytomas were absence of intravoxel fat (OR: 0.18 [0.03, 0.98], p = 0.047), presence of central scar (OR: 6.28 [2.2, 17.7], p=0.001), presence of segmental enhancement inversion (OR: 28.50 [5.1, 160.9], p<0.001), and higher contrast enhancement (OR: 3.58 [1.7, 7.5], p=0.001) on univariate analyses. Segmental enhancement inversion was the single independent predictor of oncocytoma (present vs absent, OR: 16.21 [1.0, 275.4], p<0.05) on the multivariate analysis (Fig E1, E1a E1b). Sensitivities for oncocytoma ranged from 17% (1/6) to 83% (5/6) among reviewers, while median specificities ranged from 91% (94/103) to 99% (102/103).
Minimal Fat Angiomyolipoma
Features associated with mfAML on univariate analyses were low T2W signal intensity (OR: 0.37 [0.2, 0.7], p=0.001), homogeneous T2W texture (OR: 0.39 [0.2, 0.7], p=0.003), presence of intravoxel (OR: 3.20 [1.2, 8.4], p=0.018) and bulk fat (OR: 80.14 [1.1, 6,075.0], p=0.047), absence of magnetic susceptibility (OR: 0.11 [0.01, 0.9], p=0.04), absence of hemorrhage (OR: 0.066 [0.01, 0.4], p=0.002), and homogeneous enhancement (OR: 0.44 [0.2, 0.8], p=0.008). None of the MRI features could independently predict the diagnosis of mfAML on the multivariate analysis. Sensitivities for mfAML ranged from 33% (2/6) to 83% (5/6) among reviewers, while median specificities ranged from 95% (98/103) to 100% (103/103).
Effects of Adherence to the Diagnostic Algorithm
The average accuracy of the most likely histopathologic diagnosis category provided by reviewers when the assigned MRI features matched the proposed diagnostic algorithm in Fig 2 was 65% (71/109). In contrast, the average accuracy dropped to 43% (47/109) (p<0.0001) when the diagnoses chosen by reviewers did not match the output results pertaining to the respective set of input MRI features (i.e. features in a specific branch in the diagnostic algorithm).
‘Nonspecific’ Diagnosis and Effect of Experience on Performance
The number of ‘nonspecific’ diagnoses among reviewers ranged between 2.75% and 20.18%, with a median value of 6.42%. There was no correlation between reviewer’s years of experience and sensitivity (ρ=−0.17, p=0.34) or specificity (ρ=0.054, p=0.76) for all diagnoses. Similarly, there was no correlation between the number of ‘nonspecific’ diagnoses and experience (ρ=0.16, p=0.73).
Discussion
Our study confirms consistent associations of some MRI features with specific histologic subtypes in SRM. Like previous reports (10, 18, 19), we found greater prevalence of high signal intensity on T2W among ccRCC, contrasting with lower signal intensity found in pRCC, chrRCC, and mfAML. Similarly, higher contrast enhancement was most prevalent among ccRCC and oncocytomas, as opposed to pRCC, which consistently showed lower contrast enhancement. Previously, Sun et al. (12) found that contrast enhancement during the corticomedullary phase was a highly sensitive (93%) and specific (96%) MRI feature to differentiate ccRCC from pRCC using a quantitative methodology. Moreover, in our study, signal intensity on T2W and degree of contrast enhancement on T1W demonstrated the highest inter-reader agreement among all MRI features.
Segmental enhancement inversion independently predicted oncocytomas in our cohort. Initial reports described segmental enhancement inversion as a reliable sign on computed tomography (CT) to distinguish oncocytomas from RCC, with 80% sensitivity and 99% specificity (20). However, its validity has been recently disputed. Rosenkrantz et al. (21) found segmental enhancement inversion in 29% of the oncocytomas, which was not statistically different from the 13% prevalence in chrRCC found in their cohort. The moderate inter-reader agreement for segmental enhancement inversion (κ=0.49) in our study may explain to some extent the variability in these results.
Our proposed diagnostic algorithm was derived from published data and from the authors’ experience, confirming T2W signal intensity and post-contrast enhancement as main features for characterizing SRM. The value of ancillary features, such as presence of intravoxel fat in ccRCC and mfAML, signal heterogeneity in ccRCC, signal homogeneity in pRCC and mfAML, and presence of hemorrhage in pRCC, were also analyzed. We found median sensitivities and specificities of 85% and 76% for the diagnosis of ccRCC, with 80% and 94% for the diagnosis of pRCC, respectively. The performance of this standardized approach is comparable with results of a prior study by Pedrosa et al. (18), who used an MRI classification system for subtyping malignant renal masses, with slightly higher sensitivities and specificities for the diagnosis of ccRCC (92% and 83%, respectively), and similar performance for the diagnosis of pRCC (80% and 94%, respectively). Importantly, our cohort of lesions includes a mix of both benign and malignant renal masses representative of those routinely encountered on clinical practice, whereas most of previous studies only included selected tumor types. Moreover, our data set comprised a defined group of tumors, SRM <4cm (T1a), making our results more applicable to similar SRM elsewhere.
To the best of our knowledge, our study assessing the inter-reader agreement and diagnostic performance of MRI in the histologic subtyping of SRM included the largest number of readers (i.e. with different levels of clinical expertise) reported to date. Inter-reader agreement for the diagnosis of ccRCC and pRCC varied from moderate to substantial in our cohort. By comparison, the breast (BI-RADS) (22) and prostate (PIRADS) (23) imaging-reporting and data system, two validated diagnostic systems developed for mammographic screening and assessment of multiparametric prostate MRI, respectively, also show moderate to substantial agreement among reviewers. Cohen’s κ values of 0.51 to 0.59 are reported for PI-RADS version 2 in the determination of lesions suspicious for prostate cancer (23). Therefore, our results reveal inter-reader agreements within reported benchmark ranges for diagnostic systems instituted in clinical practice. In addition, adhering to the diagnostic algorithm significantly improved accuracy. Both findings would be desirable in a diagnostic system tailored for supporting decisions in SRM management.
Nevertheless, opportunities for further refinements in the diagnostic performance of the diagnostic algorithm are obvious. Our reviewer performance was particularly suboptimal for benign renal lesions and for chrRCC. Furthermore, a limitation in our study is the small number of chrRCC and benign tumors. Sensitivities for the diagnosis of chrRCC, oncocytoma, and mfAML varied substantially among reviewers, with fair to moderate inter-reader agreement. In contrast, specificities were consistently high for all three diagnoses (above 90% for all reviewers). Using a quantitative methodology, Schieda et al. (24) found a sensitivity of 60% and specificity of 97% for the combination of T2W and chemical shift imaging in the diagnosis of mfAML, which is comparable to our results using a qualitative/semi-quantitative approach. These authors also reported a sensitivity of 100% and specificity of 89% combining quantitative T2W and DCE-MRI (24), contrasting with our data, which did not show the degree of contrast enhancement or the enhancement characteristics on post-contrast multiphasic MRI to be significant predictors of mfAML histology. Since this algorithm had been used for some time at the authors’ institution for teaching purposes, it is plausible that some AML without visible fat were prospectively recognized and confirmed on percutaneous biopsy. This could result in decreased diagnostic performance of the algorithm in this study’s cohort, which only included nephrectomy patients.
Rosenkrantz et al. (21) reported that qualitative MRI features could not reliably differentiate oncocytomas from chrRCC. Cornelis et al. (13) showed that a quantitative approach could distinguish oncocytomas from chrRCC with low sensitivity (25%) and high specificity (100%), whereas oncocytomas could be differentiated from ccRCC with high sensitivity (100%) and high specificity (94%). While some differences may arise from different patient selection criteria (e.g. T1a versus any size), further studies are needed to better understand the discrepancies in the reported diagnostic accuracies for these histopathologic diagnoses.
Some other study limitations must be acknowledged. First, the MRI acquisition protocol varied considerably due to inclusion of examinations performed in different medical centers. The lack of a single optimized protocol may have contributed to lower diagnostic accuracy. A pre-review by a body MRI fellowship-trained radiologist was conducted to ensure sufficient image quality and adequacy of imaging acquisition parameters for all MRI examinations entered in the final cohort. Second, DWI was not used as it was not consistently acquired in all cases. Although there is no strong evidence for the use of DWI in the differentiation of histological subtypes of RCC (25), DWI may be used as an ancillary input to differentiate among some renal masses (26). Third, although conclusions on the diagnostic performance could have been influenced by the lack of strict adherence to the algorithm, our results suggest that accuracy was indeed higher when reviewers complied with the algorithm versus those instances when it was overruled; therefore, a trend caused by such factor would likely result in underestimation rather than overestimation of the algorithm performance. Finally, our conclusions may be limited due to the retrospective nature of the study and to the prevalence of benign lesions (17%), which is in the lower end of the reported prevalence for T1a disease (16%–30%) (3, 27, 28). Our cohort may not reflect the actual prevalence of benign disease in SRM at different centers.
In summary, the proposed standardized diagnostic approach based on multiple MRI features helps identify ccRCC and pRCC with respective accuracies of 81% (88/109) and 91% (99/109), while achieving moderate to substantial agreement among a large number of radiologists with diverse clinical experience. Further refinements in the algorithm and standardization of the MRI protocol may be necessary to improve the diagnostic performance for the characterization of SRM.
Supplementary Material
Advances in Knowledge.
Clear-cell and papillary renal cell carcinoma (RCC) can be diagnosed with respective sensitivities of 85% (47/55) and 80% (20/25), and specificities of 76% (41/54) and 94% (79/84) using a standardized diagnostic algorithm for interpretation of multiparametric MRI examinations in T1a (<=4cm) renal masses.
The standardized diagnostic algorithm offered moderate to substantial inter-reader agreement for the diagnosis of clear-cell and papillary RCC (κ=0.58 and κ=0.73, respectively).
Signal intensity of the renal mass compared to normal renal parenchyma on T2W images (OR: 3.19 CI95%: [1.4, 7.1], p=0.003) and degree of contrast enhancement during the corticomedullary phase (OR: 4.45 [1.8, 10.8], p<0.001) are independent MRI predictors of clear-cell RCC, whereas degree of contrast enhancement during the corticomedullary phase (OR: 0.053 [0.02, 0.2], p<0.001) is a predictor of papillary RCC, and both variables exhibit substantial inter-reader agreement (T2W, κ=0.69; degree of contrast enhancement, κ=0.71).
The standardized diagnostic algorithm offered low-to-moderate sensitivity (sens) but high specificity (spec) for the diagnosis of chromophobe RCC [sens=14% (1/7), spec=99% (101/102)], oncocytoma [sens=33% (2/6), spec=97% (100/103)], and minimal-fat angiomyolipoma [sens=67% (4/6), spec=98% (101/103)], with fair-to-moderate inter-reader agreement (κ=0.23–0.43).
Segmental enhancement inversion is an independent predictor of oncocytoma (OR: 16.21 [1.0, 275.4], p=0.049), although inter-reader agreement is only moderate (κ=0.49).
Implications for Patient Care.
The implementation of a standardized diagnostic algorithm has the potential to provide superior inter-reader agreement and diagnostic accuracy for histologic subtyping of small renal masses (i.e. T1a disease) with multiparametric magnetic resonance imaging.
Summary Statement.
The proposed standardized diagnostic approach based on multiple MRI features helps identify clear-cell and papillary RCCs with respective accuracies of 81% (88/109) and 91% (99/109), while achieving moderate-to-substantial inter-reader agreement among a large number of radiologists with diverse clinical experience.
Acknowledgments
The authors would like to thank Pam Curry, MA for the graphic work in Fig 2.
Funding
Extra-mural funding by grants NIH 5RO1CA154475 and NIH P50CA196516.
References
- 1.Jayson M, Sanders H. Increased incidence of serendipitously discovered renal cell carcinoma. Urology. 1998;51(2):203–5. doi: 10.1016/s0090-4295(97)00506-2. [DOI] [PubMed] [Google Scholar]
- 2.Hollingsworth JM, Miller DC, Daignault S, Hollenbeck BK. Rising incidence of small renal masses: a need to reassess treatment effect. J Natl Cancer Inst. 2006;98(18):1331–4. doi: 10.1093/jnci/djj362. [DOI] [PubMed] [Google Scholar]
- 3.Kutikov A, Fossett LK, Ramchandani P, Tomaszewski JE, Siegelman ES, Banner MP, et al. Incidence of benign pathologic findings at partial nephrectomy for solitary renal mass presumed to be renal cell carcinoma on preoperative imaging. Urology. 2006;68(4):737–40. doi: 10.1016/j.urology.2006.04.011. [DOI] [PubMed] [Google Scholar]
- 4.Rosales JC, Haramis G, Moreno J, Badani K, Benson MC, McKiernan J, et al. Active surveillance for renal cortical neoplasms. J Urol. 2010;183(5):1698–702. doi: 10.1016/j.juro.2010.01.024. [DOI] [PubMed] [Google Scholar]
- 5.Chawla SN, Crispen PL, Hanlon AL, Greenberg RE, Chen DY, Uzzo RG. The natural history of observed enhancing renal masses: meta-analysis and review of the world literature. J Urol. 2006;175(2):425–31. doi: 10.1016/S0022-5347(05)00148-5. [DOI] [PubMed] [Google Scholar]
- 6.Halverson SJ, Kunju LP, Bhalla R, Gadzinski AJ, Alderman M, Miller DC, et al. Accuracy of determining small renal mass management with risk stratified biopsies: confirmation by final pathology. J Urol. 2013;189(2):441–6. doi: 10.1016/j.juro.2012.09.032. [DOI] [PubMed] [Google Scholar]
- 7.Wang R, Wolf JS, Wood DP, Higgins EJ, Hafez KS. Accuracy of percutaneous core biopsy in management of small renal masses. Urology. 2009;73(3):586–90. doi: 10.1016/j.urology.2008.08.519. discussion 90-1. [DOI] [PubMed] [Google Scholar]
- 8.Vasudevan A, Davies RJ, Shannon BA, Cohen RJ. Incidental renal tumours: the frequency of benign lesions and the role of preoperative core biopsy. BJU Int. 2006;97(5):946–9. doi: 10.1111/j.1464-410X.2006.06126.x. [DOI] [PubMed] [Google Scholar]
- 9.Tomaszewski JJ, Uzzo RG, Smaldone MC. Heterogeneity and renal mass biopsy: a review of its role and reliability. Cancer Biol Med. 2014;11(3):162–72. doi: 10.7497/j.issn.2095-3941.2014.03.002. [DOI] [PMC free article] [PubMed] [Google Scholar]
- 10.Oliva MR, Glickman JN, Zou KH, Teo SY, Mortele KJ, Rocha MS, et al. Renal cell carcinoma: t1 and t2 signal intensity characteristics of papillary and clear cell types correlated with pathology. AJR Am J Roentgenol. 2009;192(6):1524–30. doi: 10.2214/AJR.08.1727. [DOI] [PubMed] [Google Scholar]
- 11.Hindman N, Ngo L, Genega EM, Melamed J, Wei J, Braza JM, et al. Angiomyolipoma with minimal fat: can it be differentiated from clear cell renal cell carcinoma by using standard MR techniques? Radiology. 2012;265(2):468–77. doi: 10.1148/radiol.12112087. [DOI] [PMC free article] [PubMed] [Google Scholar]
- 12.Sun MR, Ngo L, Genega EM, Atkins MB, Finn ME, Rofsky NM, et al. Renal cell carcinoma: dynamic contrast-enhanced MR imaging for differentiation of tumor subtypes--correlation with pathologic findings. Radiology. 2009;250(3):793–802. doi: 10.1148/radiol.2503080995. [DOI] [PubMed] [Google Scholar]
- 13.Cornelis F, Tricaud E, Lasserre AS, Petitpierre F, Bernhard JC, Le Bras Y, et al. Routinely performed multiparametric magnetic resonance imaging helps to differentiate common subtypes of renal tumours. Eur Radiol. 2014;24(5):1068–80. doi: 10.1007/s00330-014-3107-z. [DOI] [PubMed] [Google Scholar]
- 14.Canvasser NE, Kay FU, Xi Y, Pinho DF, Costa D, de Leon AD, et al. Diagnostic Accuracy of Multiparametric Magnetic Resonance Imaging to Identify Clear Cell Renal Cell Carcinoma in cT1a Renal Masses. J Urol. 2017 Oct;198(4):780–786. doi: 10.1016/j.juro.2017.04.089. [DOI] [PMC free article] [PubMed] [Google Scholar]
- 15.Kay FU, Pedrosa I. Imaging of Solid Renal Masses. Radiol Clin North Am. 2017 Mar;55(2):243–258. doi: 10.1016/j.rcl.2016.10.003. [DOI] [PMC free article] [PubMed] [Google Scholar]
- 16.Lopez-Beltran A, Carrasco JC, Cheng L, Scarpelli M, Kirkali Z, Montironi R. 2009 update on the classification of renal epithelial tumors in adults. Int J Urol. 2009;16(5):432–43. doi: 10.1111/j.1442-2042.2009.02302.x. [DOI] [PubMed] [Google Scholar]
- 17.Lopez-Beltran A, Scarpelli M, Montironi R, Kirkali Z. 2004 WHO classification of the renal tumors of the adults. Eur Urol. 2006;49(5):798–805. doi: 10.1016/j.eururo.2005.11.035. [DOI] [PubMed] [Google Scholar]
- 18.Pedrosa I, Chou MT, Ngo L, H Baroni R, Genega EM, Galaburda L, et al. MR classification of renal masses with pathologic correlation. Eur Radiol. 2008;18(2):365–75. doi: 10.1007/s00330-007-0757-0. [DOI] [PubMed] [Google Scholar]
- 19.Roy C, Sauer B, Lindner V, Lang H, Saussine C, Jacqmin D. MR Imaging of papillary renal neoplasms: potential application for characterization of small renal masses. Eur Radiol. 2007;17(1):193–200. doi: 10.1007/s00330-006-0271-9. [DOI] [PubMed] [Google Scholar]
- 20.Kim JI, Cho JY, Moon KC, Lee HJ, Kim SH. Segmental enhancement inversion at biphasic multidetector CT: characteristic finding of small renal oncocytoma. Radiology. 2009;252(2):441–8. doi: 10.1148/radiol.2522081180. [DOI] [PubMed] [Google Scholar]
- 21.Rosenkrantz AB, Hindman N, Fitzgerald EF, Niver BE, Melamed J, Babb JS. MRI features of renal oncocytoma and chromophobe renal cell carcinoma. AJR Am J Roentgenol. 2010;195(6):W421–7. doi: 10.2214/AJR.10.4718. [DOI] [PubMed] [Google Scholar]
- 22.Kerlikowske K, Grady D, Barclay J, Frankel SD, Ominsky SH, Sickles EA, et al. Variability and accuracy in mammographic interpretation using the American College of Radiology Breast Imaging Reporting and Data System. J Natl Cancer Inst. 1998;90(23):1801–9. doi: 10.1093/jnci/90.23.1801. [DOI] [PubMed] [Google Scholar]
- 23.Rosenkrantz AB, Ginocchio LA, Cornfeld D, Froemming AT, Gupta RT, Turkbey B, et al. Interobserver Reproducibility of the PI-RADS Version 2 Lexicon: A Multicenter Study of Six Experienced Prostate Radiologists. Radiology. 2016;280(3):793–804. doi: 10.1148/radiol.2016152542. [DOI] [PMC free article] [PubMed] [Google Scholar]
- 24.Schieda N, Dilauro M, Moosavi B, Hodgdon T, Cron GO, McInnes MD, et al. MRI evaluation of small (<4cm) solid renal masses: multivariate modeling improves diagnostic accuracy for angiomyolipoma without visible fat compared to univariate analysis. Eur Radiol. 2016;26(7):2242–51. doi: 10.1007/s00330-015-4039-y. [DOI] [PubMed] [Google Scholar]
- 25.Kang SK, Zhang A, Pandharipande PV, Chandarana H, Braithwaite RS, Littenberg B. DWI for Renal Mass Characterization: Systematic Review and Meta-Analysis of Diagnostic Test Performance. AJR Am J Roentgenol. 2015;205(2):317–24. doi: 10.2214/AJR.14.13930. [DOI] [PubMed] [Google Scholar]
- 26.Lassel EA, Rao R, Schwenke C, Schoenberg SO, Michaely HJ. Diffusion-weighted imaging of focal renal lesions: a meta-analysis. Eur Radiol. 2014;24(1):241–9. doi: 10.1007/s00330-013-3004-x. [DOI] [PubMed] [Google Scholar]
- 27.Johnson DC, Vukina J, Smith AB, Meyer AM, Wheeler SB, Kuo TM, et al. Preoperatively misclassified, surgically removed benign renal masses: a systematic review of surgical series and United States population level burden estimate. J Urol. 2015;193(1):30–5. doi: 10.1016/j.juro.2014.07.102. [DOI] [PubMed] [Google Scholar]
- 28.Frank I, Blute ML, Cheville JC, Lohse CM, Weaver AL, Zincke H. Solid renal tumors: an analysis of pathological features related to tumor size. J Urol. 2003;170(6 Pt 1):2217–20. doi: 10.1097/01.ju.0000095475.12515.5e. [DOI] [PubMed] [Google Scholar]
- 29.Sasiwimonphan K, Takahashi N, Leibovich BC, Carter RE, Atwell TD, Kawashima A. Small (<4 cm) renal mass: differentiation of angiomyolipoma without visible fat from renal cell carcinoma utilizing MR imaging. Radiology. 2012;263(1):160–8. doi: 10.1148/radiol.12111205. [DOI] [PubMed] [Google Scholar]
Associated Data
This section collects any data citations, data availability statements, or supplementary materials included in this article.


