

Abstract
The past few decades have seen a rapid increase in the use of functional near infrared spectroscopy (fNIRS) in cognitive neuroscience. This fast growth is due to the several advances that fNIRS offers over the other neuroimaging modalities such as functional magnetic resonance imaging (or fMRI) and electroencephalography/magnetoencephalography (or EEG/MEG). In particular, fNIRS is harmless, tolerant to bodily movements, and highly portable, being suitable for all possible participant populations, from newborns to the elderly and experimental settings, both inside and outside the laboratory. In our review, we aim to provide a comprehensive and state-of-the-art review of fNIRS basics, technical developments and applications. In particular, we discuss some of the open challenges and the potential of fNIRS for cognitive neuroscience research, with a particular focus on neuroimaging in naturalistic environments and social cognitive neuroscience.
Keywords: fNIRS, basics of fNIRS, cognitive neuroscience, social neuroscience, ecological
Graphical abstract

The past few decades have seen a rapid increase in the use of functional near infrared spectroscopy (fNIRS) in cognitive neuroscience. In our review, we aim to provide a comprehensive and state-of-the-art review of fNIRS basics, technical developments and applications. In particular, we discuss some of the open challenges and the potential of fNIRS for cognitive neuroscience research, with a particular focus on neuroimaging in naturalistic environments and social cognitive neuroscience.
Introduction
Advances in functional neuroimaging technologies and research have had a major impact on our understanding of a wide range of brain functions, not only in case of the healthy brain, but also in neurological and psychiatric conditions. However, it is still challenging to understand how performance in tightly controlled cognitive tasks relates to our everyday lives and can be of value in the diagnosis and treatment of clinical conditions. Some of these challenges arise from the constraints of neuroimaging technologies themselves. The present review article describes an emerging technology—functional near-infrared spectroscopy (fNIRS)—which has the potential to overcome some of these issues.
The past 25 years have seen rapid growth of fNIRS as a tool to monitor functional brain activity in a wide range of applications and populations. One of the most successful areas of investigation with fNIRS has been neurodevelopment1. Some of the attributes of fNIRS such as portability, movement tolerability and safety of use have made this technique particularly suitable for investigating brain function in infants and children. As recently reviewed in Ref. 2, fNIRS shed light on several aspects of cognition in the developing brain that could not be properly studied with other neuroimaging modalities such as functional magnetic resonance imaging (fMRI), including object, face and language processing, and functional specialization within the visual, auditory and sensorimotor systems. Additionally, exciting research has been carried out in the study of atypical development, with a focus on executive and language dysfunctions, and neurodevelopmental disorders such as autism and attention-deficit hyperactivity disorder that are difficult to investigate in tightly restrained environments as e.g. an fMRI scanner. In particular, the functional organization and the social brain within autism have been investigated both in children3,4 and adults5, showing the ability of fNIRS to measure neurocognitive functions in these groups.
fNIRS has also been demonstrated to be a very promising tool to investigate cortical perturbations in psychiatric conditions (see Ref. 6 for a review). For instance, substantial research has been conducted into schizophrenia research, particularly looking at functional abnormalities within the prefrontal cortex (PFC) during verbal fluency tasks. In general, differences in hemodynamic response dynamics6, reduced brain activity7, and atypical functional connectivity patterns8 were observed in individuals with schizophrenia.
Low sensitivity to body movements and the systems’ portability make fNIRS suitable for monitoring cortical hemodynamics during motor tasks or during tasks involving walking, which is not fully possible in the restrained environment of scanners. This is useful to map functional activation patterns during everyday life activities (e.g., investigate the increase in the risk of falling when using the smartphone while walking9 or investigate mental workload during navigation10) and to explore the effects of neurorehabilitation11. For example, the work in Ref. 12 evaluated the changes in cortical activation in stroke patients before and after 2 months of rehabilitation. This study demonstrated the potential of fNIRS in detecting changes in regional activation associated with locomotor recovery, as reflected by an increase in the activation of premotor cortex in the affected hemisphere after rehabilitation. Other studies using wearable fNIRS investigated the contribution of dysfunctions within PFC to difficulties in performing a second task while walking in different disorders (e.g., Parkinson’s disease13, elderly people with mild cognitive impairment14,15). In this way, fNIRS has shown clear potential as a neurorehabilitation tool to monitor the motor and cognitive progresses of patients over time. This is in addition to its use as a communication device in the brain–computer interface (BCI) systems for people with motor disabilities16.
Our review builds upon the exciting work carried out over the past few decades that have established fNIRS as a stable and reliable neuroimaging methodology to discuss new applications in those fields of cognitive neuroscience that would benefit the most from the use of this technology. In particular, we first summarize the history of fNIRS and how it works, before providing a more detailed comparison with other neuroimaging methods. We then move on to explore how new studies use fNIRS in the domains of executive function and social cognition, and highlight the scope for exciting future developments.
History and basics of Near Infrared Spectroscopy
fNIRS is an optical, non-invasive neuroimaging technique that allows the measurement of brain tissue concentration changes of oxygenated (HbO2) and deoxygenated (HbR) hemoglobin following neuronal activation. This is achieved by shining near-infrared light (NIR, 650–950 nm) into the head, and, taking advantage of the relative transparency of the biological tissue within this NIR optical window, light will reach the brain tissue. For further information about the fNIRS technology, see recent review in Ref. 17.
The discovery of the existence of the NIR optical window into our body dates back to 197718, when Fransis Jöbsis observed the capability of red light to penetrate through a 4-mm thick bone of a beefsteak while he was holding it against visible light19. This suggested that red light and even more NIR light with longer wavelengths, could travel through our scalp and skull and reach the underlying tissues. The fNIRS technology takes advantage of the transparency property of the skin and bones to NIR light, and has been used in many different fields and applications, including the investigation of muscle physiology (see Ref. 20) and the clinical monitoring of cerebral cortex pathophysiology (see Ref. 21 for a review). For a detailed review of the history of the development of fNIRS, we advise the reader to see Ref. 22. Briefly, in the early nineties, fNIRS recordings were initially performed using single-site (or single-channel) devices and demonstrated the capability of fNIRS to measure oxygenation and hemodynamic changes in the brain in response to functional activation tasks both in adults (e.g., mental arithmetic tasks over the left PFC23,24, visual stimulation over the occipital cortex (OC)24,25,26, and analogy task27) and infants (e.g., visual stimulation over the OC28). To fully exploit and expand the potentiality of fNIRS, multi-site (or multichannel) measurements were needed29. Initially, single-site devices were combined and simultaneously used at multiple locations30; later, the first multichannel systems were developed, allowing monitoring of larger portions of the head and the gathering of topographic HbO2 and HbR maps29. Further proof-of-principle studies were thus conducted, exploring the brain hemodynamic changes to basic functional demands at more locations simultaneously (e.g., finger tapping tasks31,32, verbal fluency task33) and validating fNIRS as a reliable functional neuroimaging tool34.
As more sophisticated multichannel and wearable instrumentation have been developed and put to use in cognitive experiments, fNIRS has led to important advances in the understanding of functional brain activity and higher cognitive functions in adults and babies, both in health and disease (see Refs. 17,21,35,36). Growth in the fNIRS community is now exponential21, with the number of papers published in journals doubling every 3.5 years37. For instance, NeuroImage, a highly relevant journal for the neuroimaging community, dedicated a special issue to commemorate the first 20 years of fNIRS research in 201437. The success of fNIRS as a neuroimaging tool led to the constitution of the Society for Functional Near Infrared Spectroscopy in 2014 that aims to bring together the fNIRS community to collaborate and strengthen our knowledge on use of fNIRS for understanding the properties and functioning of the human brain. The Society holds the official fNIRS conference every two years, with an increasing number of submission (from 49 submissions in 2010, to 221 in 2014 and 247 in 201638,39), and recently adopted Neurophotonics as its official journal, to further foster the strong relationship between optics and neuroscience.
Physical principles of fNIRS
fNIRS measurements are carried out by transmitting NIR light onto the scalp. Prior to reaching the brain, the NIR light has to travel through several different layers (e.g., the scalp skin, skull, cerebrospinal fluid (CSF)), each with different optical properties. The interaction of the NIR light with the human tissue is thus complicated as the tissue is anisotropic and inhomogeneous through the different layers. However, this can be simplified considering that the NIR light is attenuated by absorption and scattering40.
Absorption is the process by which the energy of a photon is converted into internal energy of the medium it is travelling in, and depends on the molecular properties of the material. In our tissue, there are several substances, such as water, lipids, hemoglobin, melanin and cytochrome-c-oxidase, each with different absorbing properties at the different wavelengths17. In particular, our body is made of approximately 70% of water and, in the NIR optical window, its absorption is minimum, allowing the NIR light to travel through the tissue. The most dominant and physiological-dependent absorbing chromophore within the NIR optical window is hemoglobin. Based on its saturation state, we can have hemoglobin in its oxygenated (i.e., oxyhemoglobin, HbO2) and deoxygenated form (i.e., deoxyhemoglobin, HbR). In particular, HbO2 and HbR absorb the NIR light differently: HbO2 absorption is higher for λ>800 nm; on the contrary, HbR absorption coefficient is higher for λ<800 nm. This difference in absorption reflects also on the color of the blood that is more red for oxygenated blood (arterial blood, ≈98% saturated) and more purple for venous blood (≈75% saturated), and can be quantified through spectroscopic measurements.
When a brain area is active and involved in the execution of a certain task, the brain’s metabolic demand for oxygen and glucose increases, leading to an oversupply in regional cerebral blood flow to meet the increased metabolic demand of the brain. The increase in cerebral blood flow in response to an increase in neuronal activity is called functional hyperemia and is mediated by several neurovascular coupling41 mechanisms, such as changes in capillary diameter and vasoactive metabolites42. Hence, the oversupply in regional cerebral blood flow produces an increase in HbO2 and a decrease in HbR concentrations; these are estimated by changes in light attenuation that can be measured by fNIRS. In addition to absorption, the NIR light is also scattered when it travels through the biological tissue. Scattering is 100 times more frequent than absorption and leads to light attenuation. The more a photon is scattered, the longer is the travelled path and the greater is the probability of being absorbed. The light shined into the head will be scattered, diffused and able to penetrate several centimeters through the tissue (Fig. 1).
Figure 1.

Illustration of the path (shown in red) followed by the NIR photons from the light source to the detector through the different layers of the head. The penetration depth of the light is proportional to the source–detector distance (d1: deeper channel; d2: superficial channel). A channel is composed by the pair source–detector and is located at the mid-point between the source and the detector and at a depth of around the half of the source–detector separation.
Therefore, if we place a light detector at a certain distance from the NIR light source, we are able to collect the back-scattered light (Fig. 1) and to measure changes in light attenuation. As absorption within the NIR optical window is mainly due to HbO2 and HbR, changes in light attenuation at a given wavelength can be expressed as a linear combination of concentration changes of HbO2 and HbR. Most of the commercially available systems, known as continuous-wave (CW) fNIRS instruments, use continuously emitted NIR light, typically at 2 or 3 wavelengths, and measure light attenuation (A) due to tissue scattering and absorption through estimating the ratio of the injected (IIN) to the output (IOUT) light as shown in Figure 2. By subtracting the first attenuation measurement from the following attenuation measures, changes in attenuation (ΔA) are estimated and used to derive the changes in concentration of HbO2 and HbR. This assumes that ΔA is only dependent on the changes in absorption by the oxygen-dependent hemoglobin chromophores, therefore removing other factors such as scattering, melanin and water concentrations, which are unlikely to change significantly during the measurement period. This method is often referred to as the modified Beer-Lambert law or differential spectroscopy and is widely applied in fNIRS40.
Figure 2.
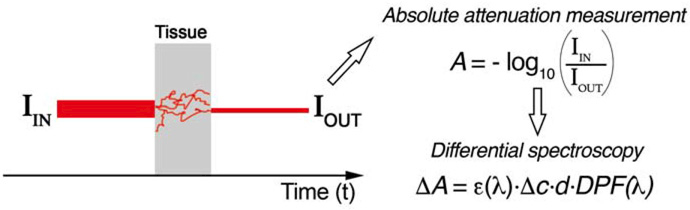
Continuous wave devices measure light attenuation due to scattering and absorption based on intensity measurements of the input (IIN) and output (IOUT) light. Attenuation is evaluated by computing the logarithm of the ratio between IIN and IOUT that is related to changes in hemoglobin concentration. The first attenuation measurement is subtracted to the following attenuation values to remove the effect of scattering, melanin and water concentrations (differential spectroscopy). The changes in attenuation ΔA are related to the changes in chromophore concentrations (Δc, either HbO2 or HbR) by the modified Beer-Lambert law. d represents the source–detector distance, ε is the extinction coefficient of the chromophore at a certain wavelength λ, and the DPF is the Differential Pathlength and indicates the increase in the photon path due to scattering.
CW fNIRS devices can provide information on concentration changes of HbO2 and HbR but cannot resolve absolute baseline concentrations, as they are not able to separate and quantify the contribution of absorption and scattering. That is why measurements of HbO2 and HbR start from zero. However, these systems are well suited for applications in cognitive neuroscience as absolute concentrations are not essential and functional activity is usually evaluated relatively to a baseline.
Besides the fNIRS systems based on the CW technology, fNIRS instruments can also be divided in other two classes: time domain (TD) and frequency domain (FD) devices. These allow the light absorption and scattering contributions to be separated, thus obtaining absolute HbO2 and HbR concentrations. FD devices shine the brain with intensity-modulated NIR light, while TD systems are more sophisticated and implement a NIR light source of few-picosecond pulses and a fast time-resolved detector to recover the time of flight (temporal spread function) of the re-emerging photons. The temporal spread function provides information on the scattered and absorbed light but also on the depth reached by the photons within the brain (i.e., the higher the time spent inside the brain by the photons, the bigger the distance they reached). For further details on other types of fNIRS instrumentation see Ref. 17.
The portion of tissue interrogated by the NIR light is called a channel and is located at the mid-point between the source and the detector, and at a depth of around the half of the source-detector separation43. The penetration depth of the light is related to the source–detector distance (i.e., the longer the source–detector distance, the deeper the penetration). Several studies assessed the spatial and depth sensitivity of fNIRS to brain tissue as a function of different source–detector separations using Monte Carlo simulations. For instance, the investigation included in Ref. 44 suggested that a higher sensitivity to the brain tissue in adults can be obtained using a source–detector separation of 55 mm. However, increasing the source–detector separation to reach deeper structures leads to a signal-to-noise (SNR) deterioration, as the probability of light absorption increases and less light is received by the detector45. The source–detector separation thus has to be a compromise between depth sensitivity and SNR. Typical values that ensure this trade-off are source–detector separations of 30–35 mm for adult studies and 20–25 mm for infants.
Generally, the fNIRS technology can be used in two ways, based on the number of channels and their configuration. In its simple, most common and commercially available form, fNIRS source and detector optical fibers (or optodes) are distributed uniquely at various locations on the head and at fixed source–detector separations. Each source–detector separation represents a measuring channel providing topographical representation of the distribution of the changes in concentration of HbO2 and HbR over the cortical surface. An alternative configuration requires the use of overlapping channels by applying multiple source–detector distances over the head to acquire tomographical representation of the distribution of the changes in concentration of HbO2 and HbR over the cortical surface. This latter configuration of fNIRS is referred to as diffuse optical tomography (DOT), where much denser arrays of channels are used that sample overlapping brain volumes46.
More recently, wearable and/or fibreless fNIRS instruments were developed. These devices are based on the CW technology, are battery-powered, and usually use LEDs directly coupled to the head. The absence of fiber optics bundles makes them more lightweight and more robust to movement artefacts. Participants can thus move more naturally with fewer constraints. Data can be usually recorded on the wearable recording unit or sent wirelessly to a laptop.
fNIRS and the hemodynamic response
Neural activity is associated with an increase in local arteriolar vasodilation and the subsequent oversupply in cerebral blood flow (CBF) and increase in cerebral blood volume (CBV), i.e. functional hyperemia42, to support the increase in neuronal demand for nutrients (i.e., glucose and oxygen). The amount of oxygen that reaches the activated brain region is higher than the rate at which it is consumed, leading to an increase in HbO2 and decrease in HbR (Fig. 3A). This is called a hemodynamic response and can be measured through fNIRS (Fig. 3B) at multiple locations of the cerebral cortex (Fig. 3C). Data in Figure 3 refer to a visual stimulation with a flashing checkerboard.
Figure 3.

Example of HbO2 (red) and HbR (blue) signals from a representative channel (circled in magenta in Panel C) of a single subject over the visual cortex using the fNIRS Hitachi ETG-4000 (equipped with up to 52 channels) during a block-designed flashing checkerboard experiment, stimulating the occipital cortex bilaterally (A). The grey areas refer to the stimulation period. Panel B shows the block-averaged hemodynamic response (mean ± std. dev.) computed by averaging the HbO2 and HbR signals presented in A across the 10 task blocks. It is characterized by simultaneous HbO2 increase and HbR decrease. Panel C presents the distribution of the maximum block-averaged concentration changes within the grey block shown in Panel B across all the channels, both for HbO2 (top) and HbR (bottom). The bilateral occipital cortices consistently respond to the full flashing checkerboard, as shown by the more red for HbO2 and more blue HbR channels.
The same is true for cognitive experiments that actively engage the participant in performing a functional task recruiting high-level cognitive functions, as show in Figure 4. Data refer to a prospective memory task where participants were presented with two pictures of objects and had to judge which one was heavier while responding with a different keyboard button to a target object. fNIRS signals were recorded over the PFC and increase in HbO2 and decrease in HbR (Fig. 4A–B) can be observed at different locations of the measured brain region (Fig. 4C).
Figure 4.

Example of HbO2 (red) and HbR (blue) signals from one channel (circled in magenta in Panel C) of a single subject over the PFC using the fNIRS Hitachi WOT system (equipped with 16 channels) during a block-designed prospective memory experiment (A). The grey areas refer to the stimulation period. Panel B shows the block-averaged hemodynamic response (mean ± std. dev.) computed by averaging the HbO2 and HbR signals presented in A across the task blocks. It is characterized by simultaneous HbO2 increase and HbR decrease. Panel C presents the distribution of the maximum block-averaged concentration changes within the grey block shown in Panel B across all the channels, both for HbO2 (top) and HbR (bottom). PFC activity was elicited by the prospective memory task, as shown by the more red for HbO2 and more blue for HbR channels.
Generally during a stimulus event, the hemodynamic response reaches a peak at ∼5 s after the stimulus onset and goes back to its baseline with a certain delay (∼16 s from the stimulus onset)47. The response dynamics (e.g., peak and undershoot latency, duration) can vary across different brain regions, task types and design, and participants’ age.
Several studies48–52 have been conducted to validate and to compare the metabolic correlates of neural activity as measured by fNIRS (i.e., increase in HbO2 and decrease in HbR) with the gold standard measured by functional magnetic resonance imaging (fMRI; i.e., the blood oxygenation level-dependent (BOLD) response). Positive correlations between the BOLD signal and HbO2 were found as well as anti-correlations with HbR50. Figure 5 shows an example of changes in HbO2, HbR and total hemoglobin (HbT) compared to the BOLD signal during visual stimulation, both in the time domain (Fig. 5A) and frequency domain (Fig. 5B). Data refers to the study in Ref. 51.
Figure 5.
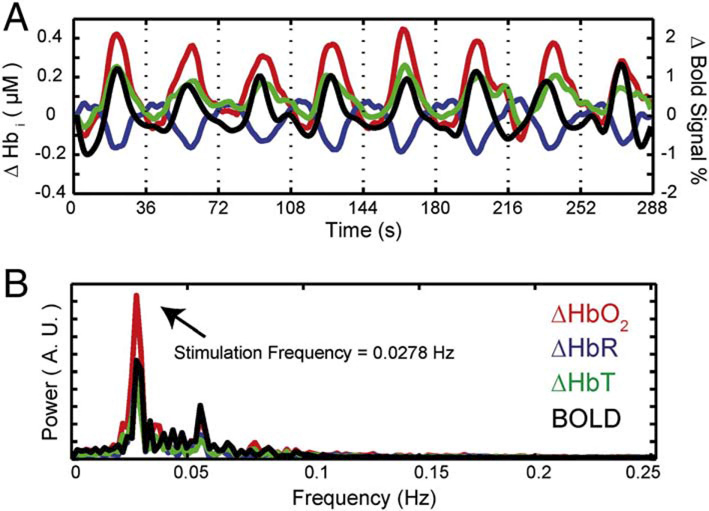
Example of HbO2, HbR, and HbT (HbT = HbO2 + HbR) signals measured with fNIRS and BOLD signal measured with fMRI in the occipital cortex during visual stimulation (A). Panel B shows the frequency spectra of the four signals. The figure is taken from the study in Ref. 51 using an in-house developed diffuse optical tomography system equipped with 24 light sources and 28 detectors. The figure is reprinted from Ref. 51 with permission from Elsevier.
Analysis of fNIRS data
Together with the progress in hardware development and novel applications of fNIRS, the analysis methods of fNIRS data evolved over the years as well (see Ref. 53 for a review). Initially task-evoked brain activity was inferred using qualitative approaches (e.g., visually inspecting the signals or using amplitude thresholds). Now more statistically meaningful and reliable methods are deployed. These include event-locked or task-locked averaging of specific portions of the continuous fNIRS signal; statistical tests can then be applied to the average activation for different events. Given the similarity in the hemodynamic signals measured by fNIRS and fMRI, more sophisticated analysis methods commonly used for fMRI have been expanded to the analysis of fNIRS data as well. A typical example would be the widely used statistical parametric mapping (SPM) approach54 based on the General Linear Model (GLM). This method consists of fitting the fNIRS data with a linear combination of explanatory variables (i.e., regressors) that reflect the stimulation protocol design. The GLM thus has more statistical power than averaging as it considers the entire fNIRS time series and takes advantage of the higher sampling rate (commonly up to 10 Hz) of fNIRS recordings53. Other data-driven approaches detect functional activity assuming that the recorded fNIRS data are a combination of task-evoked and task-independent components that can be separated by means of independent component analysis (ICA)55, principal component analysis (PCA)56, or task-related component analysis (TRCA)57. Recently, more powerful and multivariate techniques, such as the multi-voxel pattern analysis (MVPA), have been borrowed from fMRI, with the capacity to discriminate task-evoked brain activity between two or more experimental conditions58. Freeware analysis toolboxes have been developed and listed on the Society for fNIRS59.
All these methods rely on knowledge of the timeline of the stimuli that is pre-determined and recorded in typical computer-based experiments conducted in laboratories. An example of a computer-based fNIRS experiment pipeline is shown in Figure 6 A. Typically, the sequence of the chosen stimuli is established and coded into a presentation software (Fig. 6A1) that can be also used to trigger the fNIRS recording. During the data acquisition step (Fig. 6A2), stimuli are presented to the participant, usually following a block-design or event-related design structure (i.e., the stimulus is repeated several times alternated to rest periods). fNIRS data are recorded synchronously to the stimuli presentation and the timeline of the events is stored as well. fNIRS data are then pre-processed (Fig. 6.A3) to remove errors due to head motions and physiological interferences, and used to infer functional brain activity (Fig. 6.A4). Conventional analysis methods (e.g., averaging or GLM) start from the recorded timeline of the events to search for significant changes in HbO2 and HbR within the recorded task time period (yellow areas, Figure 6 A4). This can be called a behavior-first approach as it is based on linking the occurrence of neural events to behaviors taking place at a certain time (e.g., watching a flashing checkerboard on a computer screen or responding to a Stroop task).
Figure 6.
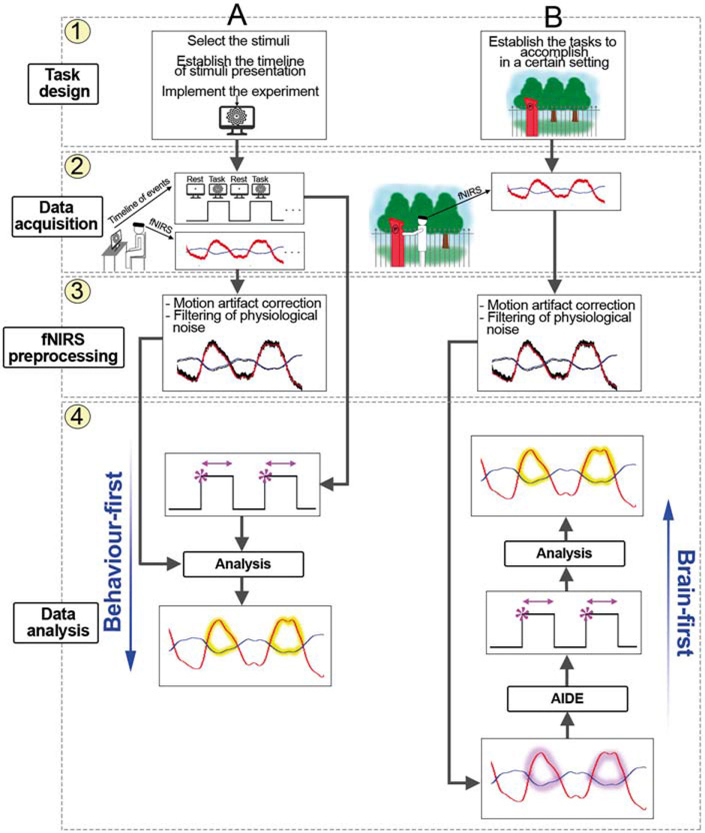
Example of neuroimaging experiment pipelines with fNIRS in case of typical computer-based (A) and ecological (B) experiments. In the first case, the timeline of the stimuli is pre-determined (A1) and fNIRS data are recorded synchronously to that (A2). Pre-processed fNIRS data (A3) are used to assess the presence of significant hemodynamic changes (yellow areas, A4) feeding conventional analysis methods (A4) with the events timeline (behavior-first). In ecological experiments, tasks do not have a particular structure (B1) and fNIRS data are recorded continuously (B2). New methods such as AIDE (B4) are then able to recover the timeline of functional events from pre-processed fNIRS data (B3, ‘brain-first’) by looking at particular patterns in HbO2 and HbR signals (magenta areas, B4). The recovered events can be used to assess the presence of functional activation (yellow areas, B4).
However, the timeline of the stimuli is not always known for experiments performed in real-world contexts where participants have a free choice of where to move and what to engage with. As an example, we focus on the study in Ref. 60 in which the PFC was monitored while participants completed a prospective memory task in a typical London street. Important events in this task occur at times determined by the participant (e.g. approaching a target parking meter, Fig. 6B1) or at times determined by the external world (e.g. a car driving by) and are not tightly controlled by the experimenters. One analysis approach is to video the whole task and then code the video footage to identify key events and make predictions about the timing of hemodynamic responses to those events, which can then be modelled in a GLM. However, this is very time consuming and may be inaccurate as it is difficult to estimate the exact moment when the participant encounters and processes a certain stimulus. To overcome this issue, other methods need to be adopted.
Recently, Pinti et al.61 developed such a method. They describe a new technique for the identification of the onsets of functional events directly from fNIRS data (Fig. 6B4). This algorithm, called AIDE (Automatic IDentification of Funcional Events), works on pre-processed fNIRS data (Figure 6 B3) and takes the opposite approach, i.e. a brain-first (Fig. 6B4) one, since it looks at particular patterns (magenta areas, Figure B4) in fNIRS data to detect the onsets and durations of functional events. The recovered events are then linked back to participants’ behavior and can be used to infer functional activation (yellow areas, Fig. 6B4). In this way, no a priori knowledge of stimuli presentation is needed.
Measuring connectivity with fNIRS
Besides task-evoked functional experiments, fNIRS is also widely used to assess resting-state functional connectivity across brain regions. Functional connectivity concerns the investigation of the correlation in slow signal changes (<0.1 Hz) between different parts of the brain. The sampling rate of typical fNIRS systems is 10 Hz, which provides ideal data for connectivity measures with a reduced risk of aliasing of activity with higher frequency (e.g., heart rate (∼1 Hz)) into the lower frequencies (<0.1 Hz62), when compared to fMRI. Several studies showcase the flexibility of fNIRS for the assessment of cortical connectivity. The method has been validated using simultaneous fNIRS-fMRI measurements63,64, and is also suitable for infants65 with no need of sedatives.
In terms of analysis methods, classical approaches have been extended from fMRI to fNIRS such as the seed-based correlation method62 that evaluates the correlation between a seed region and other regions. The seed can be an fNIRS channel and the correlation66 or the coherence at different frequency bands67 can be evaluated between all possible pairs of seed-channels. However, the seed-based approach strongly depends on the selection of the seed region and ignore the relation between multiple parts of the brain68. To overcome this issue, other data-driven approaches were proposed such as cluster analyses62 or ICA68. Advanced fMRI methods including dynamic causal modelling have been applied to fNIRS data69. Overall, fNIRS has exceptional potential in our growing understanding of brain connectivity, and may be particularly important in studying connectivity in development and in patient populations.
Advantages and disadvantages of fNIRS
The utility of a particular neuroimaging technique can be assessed in a variety of ways, including the spatial and temporal resolution, the robustness of the data, potential sources of artefacts, potential for advanced analyses and the accessibility of the method to a range of participants. Here, we review the advantages and disadvantages of fNIRS for neuroimaging investigations70 (Table 1), before providing a more focused comparison between fNIRS and other available neuroimaging modalities (Table 2).
Table 1.
Advantages and disadvantages of fNIRS.
| Advantages | Disadvantages |
|---|---|
| - Safe - Better spatial resolution than EEG - Better temporal resolution than fMRI - Tolerance to motion artifacts - Possibility to monitor HbO2 and HbR - Portability - Low Cost - Silent - Availability of miniaturized and wearable systems - Suitability for long-time continuous monitoring - Feasibility for multimodal imaging - Compatibility with other electrical and magnetic devices - More participant-friendly than fMRI - All participants are eligible (all ages, no exclusion criteria) |
- Lower temporal resolution than EEG/MEG - Lower spatial resolution than fMRI - Penetration depth (1.5–2cm) - Impossibility to gather structural images and anatomical information - Systemic interferences - Variable SNR - Optodes placement can be time consuming in case of hairy regions and a high number of sources and detectors. - Higher susceptibility to motion errors and less comfort in case of high-coverage measurements with fibre optics coupled to the head. - Lack of standardization in data analysis |
Table 2.
Comparison of fNIRS with other neuroimaging modalities.
| fNIRS | fMRI | EEG/MEG | PET | |
|---|---|---|---|---|
| Signal | - HbO2 - HbR |
BOLD (HbR) | Electromagnetic | - Cerebral blood flow - Glucose metabolism |
|
Spatial resolution |
2–3 cm | 0.3 mm voxels | 5–9 cm | 4 mm |
|
Penetration depth |
Brain cortex |
Whole head | Brain cortex for EEG/Deep structures for MEG |
Whole head |
|
Temporal sampling rates |
Up to 10 Hz |
1–3 Hz | >1000 Hz | <0.1 Hz |
|
Range of possible tasks |
Enormous | Limited | Limited | Limited |
|
Robustness to motion |
Very good | Limited | Limited | Limited |
|
Range of possible participants |
Everyone | Limited, can be challenging for children /patients |
Everyone | Limited |
| Sounds | Silent | Very noisy | Silent | Silent |
|
Portability |
Yes, for portable systems. |
None | Yes, for portable EEG systems. |
None |
| Cost | Low | High | Low for EEG; High for MEG |
High |
fNIRS systems provide measurements from the cortical surface of two hemodynamic signals—HbO2 and HbR, as described above, with a spatial resolution of 2–3 cm. The investigation of the interrelationship between these two signals allows us to make more accurate conclusions about functional brain activity71. Like fMRI, fNIRS records the hemodynamic response, which typically peaks after about 6 seconds. However, fNIRS systems have temporal sampling rates commonly up to 10 Hz, which massively oversamples the hemodynamic response function (HRF). This permits better tracking of the shape of an HRF.
One of the major factors driving the increase in fNIRS research is that this method has good tolerance to motion artefacts. A well-positioned fNIRS cap will continue to give good signals when a participant walks (see Ref. 72 for a review), engages in conversation73,74, or even dances75. New wearable fNIRS devices are becoming smaller, lighter and thus even more robust to bodily movements. A list of commercially available wearable fNIRS devices is provided in Ref. 70. This makes fNIRS suitable for a wider range of cognitive tasks, such as those requiring walking e.g. for neurorehabilitation purposes. In case of the optical displacement of the optodes (i.e., both NIRS light sources and detectors) due to rapid head movements, motion artifacts can appear as fast and narrow spikes or shifts from baseline values in fNIRS signals. Several techniques were developed to identify and effectively correct for motion errors76, and were reviewed elsewhere77. However, in case of high-coverage or whole-head measurements with fNIRS instruments guiding light through fibre optics, the weight of the probe holder increases, increasing the probability of having larger motion errors and corrupted signals70.
The fNIRS systems have many advantages in cases where participant safety and comfort is a priority. fNIRS recording is silent, relatively comfortable and does not impose physical constraints on the participant, which means it is a method-of-choice for many studies of infants and children35 and for long recording sessions. Unlike fMRI, there are no safety concerns and fNIRS can be used with all participants from premature babies78 to patient populations (see Ref. 36 for a review).
To summarize, fNIRS can provide hemodynamic signals with high temporal sampling in a range of contexts and populations. This includes studies with freely moving participants60, motor tasks79, auditory stimuli80, social neuroscience including hyperscanning of multiple participants simultaneously81, clinical monitoring82, and a range of participants including elderly people83 and infants35. As the optical components do not interfere with electromagnetic fields, fNIRS is ideal for multimodal imaging (e.g., fNIRS-fMRI49, fNIRS-EEG84) to gather more complete information related to neurovascular coupling and do not cause any harm when used on individuals with implanted therapeutic devices (e.g., cochlear implants).
Finally, it is worth mentioning that the influence of systemic blood-flow changes on hemodynamic signals is a potential problem for both fMRI and fNIRS data, though it may be more pronounced in case of data recorded on freely moving people. The measured fNIRS signals are a combination of components arising from neuronal activity and components of systemic origin that can lead to false positives and/or false negatives in the statistical inference of functional activity. Tachtsidis and Scholkmann have discussed this issue and how to address it in a recent review.71
Other available technologies for studying human cognition include fMRI and positron emission tomography (PET), which rely on neurovascular coupling, and electroencephalography (EEG) and magnetoencephalography (or MEG), which detect the electromagnetic activity of the brain. These are commonly compared based on the temporal and spatial resolution of each, but there are other important factors too. In particular, robustness to motion, and the breadth and variety of the participant sample that can be studied, are important factors in many contexts, especially where ecological validity is a priority. Table 2 summarizes the strengths and weakness of the neuroimaging technologies.
In general, however, it is important to highlight the fact that, although there are a wide range of fNIRS preprocessing and analysis procedures and free software available to the community, to date there is not an agreement nor guidelines on the analysis of fNIRS data as in other well-established technologies like fMRI. As pointed out by the recent article in Ref. 85, this lack of standardization and the numerous adjustable parameters for preprocessing and analysis algorithms can be confusing for new fNIRS users and can lead to poor quality studies or misinterpretation and irreproducibility of results. For instance, the authors85 demonstrated how different choices and combination of channels exclusion criteria, motion artifacts correction methods, signal denoising techniques, and inference approaches could lead to different results. In addition, a relevant issue in the fNIRS community concerns the investigation of which fNIRS-derived signal can best be used to infer functional brain activity. fNIRS provides concentration changes of two signals, oxy- and deoxyhemoglobin, each with its advantages and disadvantages. Theoretically, functional activation is reflected by concurrent increase in HbO2 and decrease in HbR. However, this is not always the case in real fNIRS data and e.g. only one chromophore might show significant changes in response to a certain task. This can happen for different reasons, e.g. HbO2 changes are higher in amplitude and have a higher SNR but are more confounded by physiological interferences, while HbR can lack statistical power but is more robust to systemic changes71. Therefore, conclusions in some papers are very often drawn based on only one chromophore, with no agreement on which one to use, and rarely on both. The hemoglobin species choice (HbO2, HbR, or combinations) thus also influences our conclusions, as demonstrated in Ref. 85. In summary, additional work and research are still required to establish guidelines and automated procedures for the analysis of fNIRS data to guarantee accurate inferences and localization of functional brain activity through fNIRS.
Future directions in fNIRS hardware development
Significant improvements and advances have been made over the past two decades in terms of fNIRS instrumentation, recently leading to the development of wireless and wearable systems. We expect this progress to continue over the next years, with the extension and expansion of the current CW-based devices to more advanced and sophisticated technologies that will push the boundaries of fNIRS applications and open the way to new applications. In particular, we highlight the developments of:
(1) Diffuse optical tomography (DOT) fNIRS instruments that can achieve imaging of cortical tissue with spatial resolution similar to fMRI. DOT can extend the current topographical representation of brain activity to three-dimensional imaging and increase its spatial resolution through the combination of overlapping measurements at different depths and forward models of light propagation86. However, in case of high-density and whole-head DOT with a very high number of optodes, the issues of weight reduction and optimization of the performance and ergonomics of such systems still need to be addressed87;
(2) Time domain (TD) fNIRS instruments that can perform depth resolved measurements and quantify light pathlength and light scattering, significantly improving the quantification of the hemoglobin concentrations88. However, TD systems are more expensive than CW instruments and, to date the majority of them are prototypes developed in laboratories and not commercially available;
(3) Broadband NIRS instruments, that uses hundreds of NIR wavelengths to measure changes in brain tissue cortical metabolism by quantification of the changes in the oxidation state of cytochrome C oxidase (or oxCCO). Most of these devices are CW-based89 but recently also TD broadband instrumentation have been developed90. As before, prototype systems are currently used in some laboratories but they are not commercially available. Great progress has been made so far in developing new DOT, TD, and broadband hardware. For instance, the cost and the size of TD devices were reduced by 4 orders of magnitude over the last 20 years88. We expect even more advances that are exciting within the next 20 years, with miniaturized and less expensive fNIRS-based instrumentation. Any future fNIRS instruments should be portable, easy to operate, easily interfaced with other measuring systems, have wide applicability, allow real-time visualization, simple analytics for functional inference, large brain coverage, and be safe and cheap. These are some of the attributes that made fNIRS very attractive to neuroscientists, and any new fNIRS technology should retain these features.
Why use fNIRS in cognitive neuroscience?
The field of cognitive neuroscience attempts to understand the mechanisms of cognition in the brain and to link this to our everyday lives in health, disease and over the lifespan. Now that the field has matured from the point where any fMRI study was novel and most basic cognitive processes have been investigated, researchers are turning to new methods to understand how the brain allows us to function in the world.
One approach is the development of big data neuroimaging projects, such as the WU-Minn Human Connectome Project, where over one thousand participants have been scanned over a period of approximately 4 h each (for overview see Ref. 91), or the UK Biobank enterprise92, where approximately one hundred thousand participants are being scanned. These large-scale enterprises are remarkable undertakings with huge promise, although they face considerable challenges (see e.g. Ref. 93). However, arguably a principal utility is in that they are one way of responding to a central criticism that could be made of the neuroimaging enterprise since the early 1990s. This is that there is a question of the degree to which neuroimaging findings help us understand how the brain enables us to cope with our everyday lives, since measurements are not taken in situ. An fMRI or PET study for instance, places the participant in environment very far removed from normal everyday life, with severe restrictions on normal movement, hearing etc. and often the tasks that the participant is asked to perform are unlike any that the participant would normally choose or be required to do in real life. Thus, the ecological validity of the results is uncertain. This is not a trivial matter if one wishes to project the scientific findings to, for example, addressing disability that cannot be measured in the scanner environment or to certain psychiatric or psychological problems. If the data has not been collected under the same conditions as the problems are demonstrated, then naturally one can be less certain about their relevance to understanding them, and the possibility of mediator variables and epiphenomena arise.
Fields related to cognitive neuroscience have been grappling with this issue for some time (e.g. Ref. 94). Big-data neuroimaging enterprises may address this issue by collecting enough data to make statistical associations between real-world variables and neuroimaging data, following an individual differences approach. However, within the field of neuropsychology, an additional approach has been developed to deal with this issue. This is the development of naturalistic methods of assessment, which stress the brain systems of interest in situ. In a neuropsychological context, this means using tasks that mimic the everyday situations where the participants demonstrate their difficulties (see e.g. Ref. 95). This approach does not replace the use of experimental paradigms, but rather is a strong adjunct, and indeed is sometimes used as a validation of them. Recent developments in the technology of fNIRS means that neuroimaging can now follow a similar path, i.e. stressing brain systems relevant to performance in everyday situations in order to gather data that is of more direct (rather than inferred) relevance. This is of relatively minor concern to some cognitive neuroscience researchers, but is fundamental to others. For those cognitive neuroscientists who study relatively basic sensory processes (such as the early stages of vision or audition), or where the cognitive resources are assumed to be relatively encapsulated (in the sense of Moscovitch and Umilta96, i.e. impervious to top-down control and dedicated to a particular activity), and the processes of interest are not related to any of the following: (a) bodily movement, including moving the head; (b) direct interpersonal interaction; (c) naturalistic behavior ; (d) processing naturalistic stimuli (as opposed to stimuli presented on a computer display); (e) choosing how to respond, e.g. speaking versus signalling with a hand; (f) physically moving around an environment; (g) situations involving a quiet environment; (h) situations involving being in an open environment; (i) any behavior not normally conducted whilst lying down, and largely immobile; and (j) any mental process or state of mind that is affected by being observed directly, then fMRI is well suited to its study. However, this is a long list of exclusionary conditions, and there are very many behaviors, situations, and mental processes which cannot currently be examined by fMRI. Indeed, it is perhaps the case that the neuroimaging community has become so used to the constraints that fMRI places upon experimentation that the lack of study of brain–behavior relations that correlate to, for example, free bodily movement or engaging in social interaction etc. is rarely considered. Yet these are very substantial areas of cognition that are critical to understanding how the brain facilitates behavior in the real world, as well as understanding disorders of cognition that are often easier to measure in everyday situations than typical experimental ones (for examples see Ref. 97).
Overview of novel applications of fNIRS
Recent technological advances in fNIRS present the opportunity to study the relations between brain activity and cognition in virtually all of the situations (a)–(j) listed above, in addition to those that one normally studies with fMRI. Following the development of the novel wearable and portable fNIRS devices, the past few years have seen the first studies investigating the feasibility of using fNIRS with freely moving participants. These studies have been conducted on healthy adults43,98–104 and on patients with neurological deficits (e.g., Parkinson’s disease100,105 and mild cognitive impairments106), and demonstrated the ability of fNIRS of measuring brain hemodynamics and oxygenation in response to cognitive tasks performed while they are moving freely. It is even more exciting to see that these investigations can be performed outside the laboratory and in everyday life situations, as shown by the works in Refs. 60, 99, 101, 102. In Figure 7, we provide examples of participants wearing portable and wearable fNIRS systems, showing how fNIRS allows to freely move in the environment and to accomplish the task with minimal restraints. Figure 7 A refers to the study of Pinti et al.60 using the WOT-100 fNIRS device (Hitachi, Japan; now sold by NeU Corporation, Japan) and Figure 7 B shows the LIGHTNIRS™ system (Shimadzu, Japan).
Figure 7.
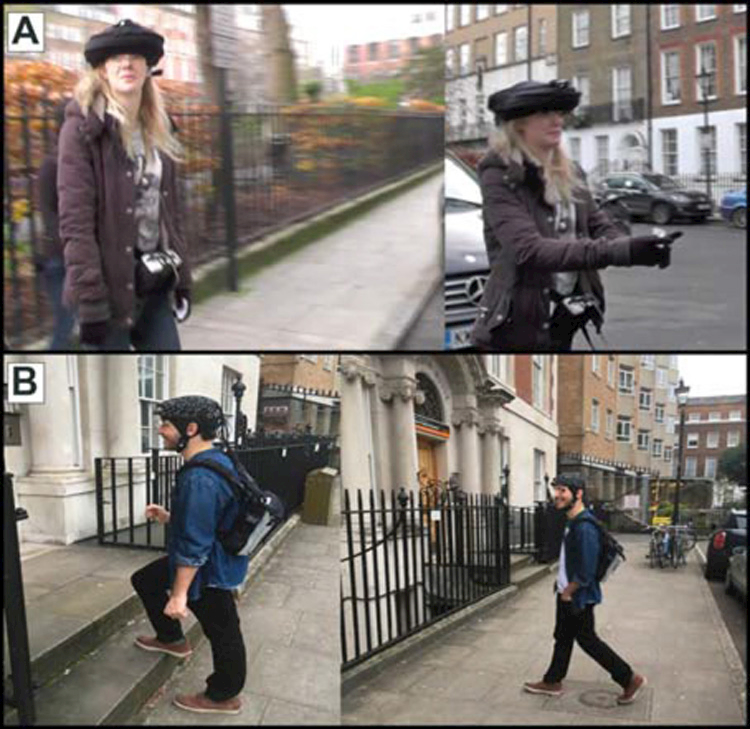
(A) Example of a participant carrying out the ecological prospective memory task described in Ref. 60 in the real world where brain activity is monitored over the PFC by a portable, wearable and fibreless fNIRS system (WOT-100, Hitachi, Japan; now sold by NeU Corporation, Japan). (B) Example of a participant freely moving in unrestrained situations outside the lab while functional brain activity is measured over the PFC through a portable and wearable fNIRS device (LIGHTNIRS, Shimadzu, Japan); such system is equipped with optical fibers that are connected to a control unit, carried through a backpack.
If wearable fNIRS devices are lightweight, compact, more robust to motion artifacts—especially the fibreless ones—than the conventional fNIRS instruments, and are to be used in naturalistic environments, detectors saturation due to the stray sunlight should be considered when using these new systems outdoor. This problem can be minimized by using shading caps (e.g. Fig. 7A), devices incorporating optical detectors with a high dynamic range or systems that include a reference detector with the aim of measuring the stray light only and subtracting it from the other detectors’ signals (e.g., as implemented in the Brite23™ and OctaMon™ developed by Artinis, Netherlands).
Other novel and promising applications of fNIRS concern the study of the effect of malnutrition and social or environmental difficulties on the neurodevelopment of infants living in low-resource contexts. For instance, this is currently investigated by the BRIGHT project team107 on African infants. The first results on the cortical mapping of cognitive functions in Gambian infants108 (Fig. 8A) showed that fNIRS is able to provide objective markers and robust developmental curves, and, thanks to its low-cost and portability, has the potential to be used in low-resource settings. Figure 8B shows an example from the study in Ref. 108, where a change in specialization to auditory social cues was found in the anterior temporal cortex at 9 months of age.
Figure 8.

Examples of Gambian infants from 6 to 24 months undertaking the study described in Ref. 108 (A). Data were recorded using the UCL optical topography system with 12 channels. A change in the specialization to auditory social stimuli were found between the 4–8 month olds (green) infants and the 9–13 (orange), 12–16 (red), 18–24 (purple) months olds cohorts in the anterior temporal cortex (B). HbO2 and HbR (here HHb) responses are indicated by full and dashed lines respectively. The figure was modified with permission from Ref. 84 and under the terms of the Creative Commons Attribution License (CC BY)109, photo credit to the Bill and Melinda Gates Foundation.
Below, we present an overview of the current and potential applications of fNIRS in those fields of cognitive neuroscience that we think would benefit the most by the use of this novel neuroimaging modality. In particular, we focus on neuroimaging in natural situations and in social interaction, highlighting the current state of the field and potential future directions.
The study of cognition in naturalistic situations: progress, challenges and future directions
The possibility of monitoring brain activity in naturalistic contexts is especially important for those who study the PFC, since this exceptionally large region of the brain is thought to be intimately involved with voluntary behavior and dealing with open-ended situations110, and PFC activity measured by fNIRS has been found to be higher in realistic versus simulated everyday tasks (e.g. apple peeling111). Indeed, fNIRS lends itself well to studies of PFC activations, as Masataka et al.112 point out. There are two particular reasons for this. The first is technical: there is less hair at the front of the skull. But the second, far more important factor is the one alluded to above: large portions of PFC support mental processes involved with dealing with voluntary, self-initiated behavior, especially in response to “open-ended” or “ill-structured” situations113,114.
It has been argued for several decades that trying to measure frontal lobe function by placing people in highly constrained situations (environmentally, socially, and in terms of instruction and the possibilities for responding) risks a marked loss of construct validity (i.e. the degree to which you measure what you intend to measure; see Refs. 95 and 97 for reviews). The most common explanation is that since part of the role of PFC is to set the boundaries for behavior and responding through establishing various forms of top-down control (e.g. “sculpting the response space”115), if the experimenter artificially provides these boundaries by placing the participant in a situation where only limited ways of moving, behaving, responding, or thinking are possible, this effectively eliminates much of the PFC-supported mental processing that would normally be required in naturalistic or real-world situations. In this way, there is good reason to suppose that certain mental processes supported by PFC that are highly predictive of competence in the real world are best investigated using naturalistic situations which attempt to introduce as few artificial (i.e. not commonly occurring outside the lab) constraints as possible. This issue of construct validity intersects neatly with that of ecological validity. This term was first coined by Brunswik116 but has come to mean something rather different than he intended. These days it is most commonly used to refer to issues of generalizability (i.e. the degree to which the results of an experiment would hold across a range of situations outside it) and representativeness (the extent to which an experimental task corresponds in form and context to a situation encountered outside the laboratory)95. It is generally assumed that increases in the latter are a way to improve the former, and these are of particular concern where experimental findings are intended to illuminate e.g. clinical or ergonomic practice.
This naturalistic approach when used with fNIRS is already showing pleasing support for some principles of PFC function. For instance, in the study in Ref. 117, the authors used fNIRS equipment in a vehicle that was being driven on an expressway that was not open to the public. PFC activity was measured when the driver was either parked, accelerating, decelerating, maintaining a constant speed, or performing a U-turn. The gateway hypothesis of supervisory attentional system model of PFC function (e.g. Ref. 118) would predict that activation while performing a U-turn should be greater in rostral PC (BA 10) than during parking (since U-turns are rarer and often more hazardous activities), and this is indeed what Yoshino et al.117 discovered. Similarly, the changes in patterns of activation over time as found in Ref. 119 during a gambling task are probably consistent with several theories of PFC function (e.g. Ref. 120, 121). In this way, the findings from fNIRS investigations of PFC in naturalistic situations are useful tests of the extent to which we understand PFC function and organisation at a theoretical level, as well as providing potentially useful data in terms of potential clinical, neuroergonomic, or engineering possibilities. Similarly, and overlapping with the study of PFC function, is the study of social interactions, discussed below, and the study of cortical activity during complex physical movement (e.g. Ref. 79). fNIRS promises measurements of enhanced ecological validity in these domains as well.
However, when studying behavior in naturalistic situations, new conceptual problems are created and should be considered. For instance, participants’ behavior may be voluntary and self-generated in more ecologically valid contexts. This can make it more difficult to determine the timecourse of mental activity. The time at which a mental event occurs can be established with a high degree of confidence in some behavior al paradigms (e.g. simple stimulus-response tasks, in which mental events related to each stimulus, can be assumed to occur close to the time at which each stimulus is presented). However, in other situations it is far from straightforward to determine the temporal profile of mental activity putatively linked with a particular behavior. Overt behavior may be influenced by mental activity that has occurred considerably earlier. One methodological approach that has been adopted to investigate such situations it to average brain activity over multiple trials, time-locked to a particular behavior al outcome, and search for the earliest point in time prior to this outcome that a difference in brain activity versus baseline can be detected. EEG studies investigating the readiness potential122 would be an example of this approach. A related approach is to sort trials into two or more categories (e.g. left versus right button presses) and search for the earliest time-point prior to overt behavior at which brain activity distinguishes the two categories. The lateralised readiness potential is an example of this123,124. More recent studies have adapted this approach for fMRI125.
So, traditional neuroimaging methods such as fMRI are challenged by the study of self-initiated or stimulus-independent thought, which are central to an understanding of several fields within cognitive neuroscience (e.g. PFC function, social interaction, creativity, self-initiated adaption to novel situations, etc.). How then might fNIRS assist in these investigations? The first advantage of fNIRS in this respect is of course the better temporal resolution compared to fMRI (although not better than EEG/MEG). This matters because the mental experiences under consideration (e.g. moments of insight) can be of relatively short duration. However, possibly an even more serious issue from an experimental standpoint is that the solutions to the complex problems that are typically used to provoke them take too long for these kinds of stimuli to be used in fMRI experiments126. Here, fNIRS also provides a potential solution since relatively long periods of data acquisition can be tolerated much more easily by participants (e.g., well tolerated up to 1.5 h in case of the study in Ref. 60, where the fNIRS headset’s weight was 700 g and the processing unit worn around the waist was 650 g), partly because they are free to move, but also of course because fNIRS is silent, and people of all heights and weights can be made to be comfortable (unlike fMRI). Linked to this is the ability to use automatic detection procedures such as AIDE61 described above to investigate the relationship between hemodynamic changes and behavior s or mental experiences of interest. In this way, stimulus-independent thought (or cognition that is linked to, but distant from, a behavior) can be explored. This advantage is still made stronger by the quietness and lack of physical constraint, because unless the investigator is particularly interested in responses to, e.g. the noise of a MRI scanner or the discomfort or stimuli provided by being immobilized, these are potential serious confounds since they may interfere greatly with the natural frequency or type of stimulus—independent thoughts. Incidentally, for this reason, fNIRS may be particularly useful for resting-state data acquisition. Indeed, it is not known to what degree the results of resting-state fMRI studies have been affected by these confounds: Are we really resting when we are immobilized and placed in a noisy and intimidating environment like an MRI scanner? fNIRS may be one method for finding out.
Using fNIRS to explore social neuroscience
Neuroimaging studies of human social cognition have revealed a complex network of interacting brain regions with roles in social perception, emotion, imitation and understanding of other people’s mental states127,128. However, lying on your back in a dark noisy fMRI scanner is not a typical social situation and there are many aspects of a social interaction, which are hard to manipulate in these circumstances. These include the production of natural social behaviors (including posture, gesture, spontaneous mimicry, and unconstrained speech), the feeling of being watched by another person, and the continuous dynamic interaction between two people which characterizes natural conversation. This last factor in particular is gaining in importance, as researchers recognize that second person neuroscience which studies real-time interactive behavior may be an important way to understand the social brain and psychiatric disorders129.
As detailed above, fNIRS can record brain activity in natural contexts and thus is compatible with all these richer social behavior s. In recent years, researchers have begun to use both single-participant fNIRS in social contexts and to record from two or more participants simultaneously, giving new insights into the neural mechanism of social interaction. Here, we review some recent studies in this area, before highlighting challenges for the area and potential future directions.
Social neuroscience with fNIRS.
A range of social perception and interaction studies in children and adults have been implemented in fNIRS. Some of these are similar to typical fMRI studies, examining face perception130, emotion perception,131 and theory of mind132 in both child and adult populations. For example, the study in Ref. 133 showed that both infants and mothers have a positive fNIRS response in the PFC when seeing videos of the other smiling. Others take advantage of the flexibility of fNIRS to examine neural response to affective touch134 or to imitation behavior 135. For example, in the latter paper, participants completed an interactive task in which they saw a demonstrator make typical straight actions or abnormal curved actions and then had the opportunity to imitate them; right inferior parietal cortex showed a stronger activation signal when viewing the curved actions, which replicates previous fMRI studies. However, in fMRI, it is very hard to implement the imitation actions, and fNIRS provides more flexibility to explore the neural mechanisms of interactive behavior. There are even attempts to use fNIRS as a biofeedback mechanism for creating social virtual characters who can interact with a participant136.
Building on the participant-friendly nature of fNIRS, a large number of studies use this method to explore the development of cognition and social cognition in infants, children, and individuals with developmental disorders. Such work tracks the development of body perception137, response to direct gaze138,139, responses to speech140 and many other tasks. Reviewing all these papers is beyond the scope of the present article (see Refs. 35, 141), so we highlight here a few developments. First, fNIRS has been used to identify differences in neural responses to social stimuli in 4-month-old infants at risk for autism142, indicating a potential for early diagnosis. Similarly, adults with autism show differences in fNIRS responses when completing an imitation task143 and face viewing tasks144. The flexibility of fNIRS to collect data in a wide range of contexts is also demonstrated by a project that tracks the development of malnourished infants in the Gambia, using fNIRS in rural conditions145.
Hyperscanning with fNIRS.
Beyond the single-participant studies reviewed above, one of the most exciting and rapidly growing areas of fNIRS is hyperscanning, where signals are recorded from two or more participants simultaneously. Hyperscanning in fMRI has been developed by chaining scanners together to record interactions in competitive/cooperative games146,147, sequential scanning of intimate partners that express emotional facial expressions148, and sequential scanning of dyads who tell and listen to stories149. However, critical social information that comes from face-to-face, real-time updating of information about inner states, affect, and intentions is not well represented by these approaches. Using fNIRS hyperscanning, it is possible to both monitor brain activation and permit natural interaction behavior s. The first study of this form, published in 2012, examined neural activation in the frontal cortex of two participants playing a computer-based cooperation game150. A variety of methods is available to analyze this type of data, with a focus on measures of inter-brain synchrony (IBS). This is typically quantified in terms of wavelet coherence, which provides an estimate of functional hyperconnectivity or Granger causality as a measure of effective hyperconnectivity151. In both cases, a key analysis is to compare synchrony measures in true interactions to pseudo-interactions created by shuffling data between participants or time-windows while retaining the same measurement parameters. This provides an important baseline for statistical comparison. However, even this method cannot entirely remove the possibility that apparent synchrony between brains is driven by the two participants responding to a common input150 or even synchronization of physiological markers such as heartbeat and breathing. Developing new analysis methods to identify and isolate the causes of interbrain synchronization will be an important future direction in this area.
Despite these caveats, there have been a number of important advances since 2012. Studies have shown that it is possible to record and analyze fNIRS hyperscanning data in the context of singing152, cooperative manual games153, card games involving deception154,155 and imitation156,157. There are also studies that have gone beyond 2-person hyperscanning to record signals from three or four participants simultaneously. A study of three-way conversation found that one person in each group of participants tended to act as a leader, and that the leader’s temporoparietal junction showed greater synchronization of neural activation signals with the equivalent area in the follower participants, compared to the follower’s synchronization with each other158. This three-way design is also able to overcome some of the problems of common-input as all three participants are exposed to the same stimuli. Similarly, a four-person hyperscanning has been attempted to explore different analysis options159.
To illustrate the value of fNIRS hyperscanning in more detail, we describe in depth the study in Ref. 81, which combines fNIRS with face and gaze tracking to explore the neural mechanisms for eye contact between two people. In this study, two participants completed trials where they gazed directly at each other’s eyes or at a static photo of a face. fNIRS data was acquired with the Shimadzu LABNIRS™ system with 134 channels equally divided between two participants. These acquisitions are synchronized with visual stimulus presentations, eye-tracking, voice recording, Kinect™ cameras for facial classifications, and response dials indicating continuous subjective ratings during the experiments, as shown in Figure 9A.
Figure 9.

(A) The hyperscanning setup used in Ref. 81 is illustrated using the Shimadzu LABNIRS system (84 channels) synchronized with visual simulation monitors, eye-tracking glasses, voice recording microphones, rotating dials providing a continuous analogue report of subjective responses, and wall mounted Kinect cameras for facial classifications. All components are the same for both participants and synchronized by triggers. Photo courtesy of Hirsch Brain Function Laboratory, Yale School of Medicine. (B) Cross-brain synchrony is measured by wavelet coherence analysis and shown here for the condition of real eye-to-eye contact as compared to mutual gaze at a picture face and eyes. The illustration shows subsystems within the left temporal-parietal complex including the supramarginal gyrus (SMG), superior temporal gyrus (STG), middle temporal gyrus (MTG), the sub central area (SCA), and left pre-motor (pM) cortex that resonate more during real face-to-face eye-to-eye contact than viewing a face/eye picture (p < 0.001). These correlations between real partners disappeared when the partners were computationally “scrambled” confirming that the coherence across partner brains was a result of actual real-time reciprocal events and not general viewing of a moving face81.
This illustrates the importance of combining the fNIRS itself with high-resolution recordings of behavior to obtain the best data. This study used both general linear models to analyze data within subject and wavelet coherence measures (Fig. 9B) to analyze interbrain synchronization. In both measures, eye contact engages active neural systems associated with social engagement which were not seen in the static picture condition. Furthermore, the subcentral gyrus (BA43), a previously undescribed functional region, was selectively activated and functionally connected to face, language, sensorimotor, and executive systems during eye-to-eye contact, and not during the non-interactive condition, suggesting a foundational mechanism for continuous, bidirectional streaming of social interactions. These findings contribute to an emerging model for human-to-human interactions and suggest that a subset of neural operations is mutually engaged during live eye-to-eye contact. Observations of cross-brain coherence such as these (Fig. 9B) introduce novel opportunities to understand rapid sensory processes dedicated to interpersonal interaction not previously investigated due, in part, to conventional block designs, sparse temporal sampling, and restrictions on imaging during natural two-person interactions. Future fNIRS research will focus on the sensory processes engaged during coherent neural activity during live and spontaneous interactions as a key sensory element that drives neural responses during real person-to-person interactions.
Future directions within social neurosciences and hyperscanning.
To summarize, fNIRS for the study of human social interaction is a rapidly growing field with excellent potential. When used in conjunction with careful recording of behavior and in hyperscanning contexts, fNIRS has the potential to reveal important facets of the brain mechanisms of interaction, which cannot be captured in the fMRI environment. In the ongoing quest to build a field of second person neuroscience160 and to test the interactive brain hypothesis161, fNIRS hyperscanning will be an essential tool.
The future of fNIRS
fNIRS occupies a significant and rapidly expanding space within neuroscience, providing huge neuroimaging capacity with fewer constraints upon participants’ behavior . In fact, fNIRS allows the neuromonitoring of a wide range of populations, from the newborn to the elderly. More interestingly, this can now be performed in more realistic environments and in our everyday lives thanks to the advances in hardware development. The availability of wearable fNIRS devices paves the way for new and revolutionary neuroimaging investigations that we expect to grow exponentially over the next years, particularly in the domains of real-world cognition, social interaction and neurodevelopment.
However, these are still very early days for the use of fNIRS in cognitive neuroscience, and there is little doubt that the next few years will see new ways of applying the methodology, and new discoveries from this about how the brain works. For instance, the dynamics of the relationship between the oxyhemoglobin and deoxyhemoglobin signals in different brain regions and across different tasks and conditions remains largely to be investigated, and there may be fundamental discoveries for us in these kinds of investigations. In addition, fNIRS instrumentation can also be easily interfaced with other physiological measurements, including other neuroimaging modalities (such as EEG or fMRI52), systemic measurements (such as heart rate, blood pressure, breathing rate, etc.), and behavior (such as eye tracking, motion capture, video recordings, etc.). This will allow a 360-degree view of how neurodynamics are coordinated with other changes within the body, which could be fundamental to work on e.g. anxiety, stress, or similar work at the interface between emotion and cognition. Similarly, the improved sampling rate of fNIRS over fMRI may offer approaches and considerations that we have not considered yet including new connectivity analyses. In many ways, these early days of fNIRS are mirroring the early days of fMRI in terms of scientific development. The fNIRS physicists, engineers and methods community are investigating what is possible with the new method, and to an extent this is occurring independently of scientific questions that might drive them, since few cognitive neuroscientists know enough about fNIRS to have spent a lot of time considering what questions this new technique allows them to ask that they cannot with the established methods of fMRI or MEG. With the early history of fMRI, a stage was soon reached where the equipment and methods were made accessible enough to those people interested in determining brain–behavior relations in humans that they could start thinking about what questions they could ask. This led to a huge explosion of interest, as the interaction between cognitive scientists and medical physicists became routine, and they started to share a common scientific goal, and interdisciplinary collaborations became the norm. fNIRS is now at that cusp too. We now know enough to have some idea of its potential as a method, and the equipment is sophisticated enough to be useful, and is easy (and cheap) enough to be accessible to a wide variety of cognitive neuroscientists. Indeed, the safety and cheapness have huge potential for its widespread use in a way beyond that possible with fMRI. Therefore, what is almost certain to happen now is an enormous increase in the use of fNIRS that will drive both new scientific questions, and new ways of addressing them that mirrors the transformational changes to the discipline that happened with fMRI. This will be stimulating for early adopters as new studies that have never been done before due to limitations of previous technologies can now be performed.
Indeed, the growth of fNIRS is likely to be faster than fMRI, because the scientific infrastructure (e.g. software packages for analysis, standard ways of designing experiments) now exists in a way that it did not before fMRI. Moreover, there are many neuroscientists who have until now been limited in their investigations by the constraints imposed by fMRI and other methods. Hence, there is a ready audience. These investigators are increasingly adopting fNIRS to overcome some of the issues related to other neuroimaging modalities, pushing the boundaries of the application of the technique but also increasing the demand for new analytic methodologies and procedures that allow its effective use, often alongside the more established methods they know well. The future of cognitive and social neuroscience seems brighter with fNIRS.
Acknowledgments
I.T. and P.P. are supported by the Wellcome Trust (104580/Z/14/Z). A.H. is supported by ERC grant 313398-INTERACT. J.H. is the principal investigator on and supported by the following grants from the US National Institute of Health: NIH 5 R01 MH107513; NIH 5 R01 MH111629; NIH 1 R37 HD 090153.
Footnotes
Competing interests
The authors declare no competing interests.
References
- 1.Lloyd-Fox S, Blasi A & Elwell CE. 2010. Illuminating the developing brain: The past, present and future of functional near infrared spectroscopy. Neurosci Biobehav Rev 34: 269–284. [DOI] [PubMed] [Google Scholar]
- 2.Vanderwert RE & Nelson CA. 2014. The use of near-infrared spectroscopy in the study of typical and atypical development. Neuroimage 85 Pt 1: 264–271. [DOI] [PMC free article] [PubMed] [Google Scholar]
- 3.Liu T, Liu X, Yi L, et al. 2017. Assessing autism at its social and developmental roots: A review of Autism Spectrum Disorder studies using functional near-infrared spectroscopy. Neuroimage [DOI] [PubMed]
- 4.Keehn B, Wagner JB, Tager-Flusberg H, et al. 2013. Functional connectivity in the first year of life in infants at-risk for autism: a preliminary near-infrared spectroscopy study. Front Hum Neurosci 7. [DOI] [PMC free article] [PubMed] [Google Scholar]
- 5.Ishii-Takahashi A, Takizawa R, Nishimura Y, et al. 2014. Prefrontal activation during inhibitory control measured by near-infrared spectroscopy for differentiating between autism spectrum disorders and attention deficit hyperactivity disorder in adults. Neuroimage Clin 4: 53–63. [DOI] [PMC free article] [PubMed] [Google Scholar]
- 6.Ehlis AC, Schneider S, Dresler T, et al. 2014. Application of functional near-infrared spectroscopy in psychiatry. Neuroimage 85 Pt 1: 478–488. [DOI] [PubMed] [Google Scholar]
- 7.Quaresima V, Giosuè P, Roncone R, et al. 2009. Prefrontal cortex dysfunction during cognitive tests evidenced by functional near-infrared spectroscopy. Psychiatry Res - Neuroimaging 171: 252–257. [DOI] [PubMed] [Google Scholar]
- 8.Einalou Z, Maghooli K, Setarehdan SK, & Akin A 2014. Functional near infrared spectroscopy to investigation of functional connectivity in schizophrenia using partial correlation. Univers J Biomed Eng 2: 5–8. [Google Scholar]
- 9.Takeuchi N, Mori T, Suzukamo Y, et al. 2016. Parallel processing of cognitive and physical demands in left and right prefrontal cortices during smartphone use while walking. BMC Neurosci 17: 9. [DOI] [PMC free article] [PubMed] [Google Scholar]
- 10.McKendrick R, Parasuraman R, Murtza R, et al. 2016. Into the Wild: Neuroergonomic Differentiation of Hand-Held and Augmented Reality Wearable Displays during Outdoor Navigation with Functional Near Infrared Spectroscopy. Front Hum Neurosci 10. [DOI] [PMC free article] [PubMed] [Google Scholar]
- 11.Strangman G, Goldstein R, Rauch SL, et al. 2006. Near-Infrared Spectroscopy and Imaging for Investigating Stroke Rehabilitation: Test-Retest Reliability and Review of the Literature. Arch Phys Med Rehabil 87: 12–19. [DOI] [PubMed] [Google Scholar]
- 12.Miyai I, Yagura H, Hatakenaka M, et al. 2003. Longitudinal optical imaging study for locomotor recovery after stroke. Stroke 34: 2866–2870. [DOI] [PubMed] [Google Scholar]
- 13.Nieuwhof F, Reelick MF, Maidan I, et al. 2016. Measuring prefrontal cortical activity during dual task walking in patients with Parkinson’s disease: Feasibility of using a new portable fNIRS device. Pilot Feasibility Stud 2. [DOI] [PMC free article] [PubMed] [Google Scholar]
- 14.Doi T, Makizako H, Shimada H, et al. 2013. Brain activation during dual-task walking and executive function among older adults with mild cognitive impairment: a fNIRS study. Aging Clin Exp Res 25: 539–544. [DOI] [PubMed] [Google Scholar]
- 15.Maidan I, Nieuwhof F, Bernad-Elazari H, et al. 2016. The Role of the Frontal Lobe in Complex Walking Among Patients With Parkinsons Disease and Healthy Older Adults: An fNIRS Study. Neurorehabil Neural Repair [DOI] [PubMed]
- 16.Naseer N & Hong K-S. 2015. fNIRS-based brain-computer interfaces: a review. Front Hum Neurosci 9. [DOI] [PMC free article] [PubMed] [Google Scholar]
- 17.Scholkmann F, Kleiser S, Metz AJ, et al. 2014. A review on continuous wave functional near- infrared spectroscopy and imaging instrumentation and methodology instrumentation and methodology. Neuroimage 85: 6–27. [DOI] [PubMed] [Google Scholar]
- 18.Jobsis F 1977. Noninvasive, infrared monitoring of cerebral and myocardial oxygen sufficiency and circulatory parameters. Science 198: 1264–1267. [DOI] [PubMed] [Google Scholar]
- 19.Jobsis FF 1999. Discovery of the near-infrared window into the body and the early development of near-infrared spectroscopy. J Biomed Opt 4: 392–6. [DOI] [PubMed] [Google Scholar]
- 20.Perrey S & Ferrari M. 2017. Muscle Oximetry in Sports Science: A Systematic Review. Sport Med 1–20. [DOI] [PubMed]
- 21.Yücel MA, Selb JJ, Huppert TJ, et al. 2017. Functional Near Infrared Spectroscopy: Enabling Routine Functional Brain Imaging. Curr Opin Biomed Eng 4: 78–86. [DOI] [PMC free article] [PubMed] [Google Scholar]
- 22.Ferrari M & Quaresima V. 2012. NeuroImage A brief review on the history of human functional near-infrared spectroscopy (fNIRS) development and fields of application. Neuroimage 63: 921–935. [DOI] [PubMed] [Google Scholar]
- 23.Hoshi Y & Tamura M. 1993. Detection of dynamic changes in cerebral oxygenation coupled to neuronal function during mental work in man. Neurosci Lett 150: 5–8. [DOI] [PubMed] [Google Scholar]
- 24.Villringer A, Planck J, Stodieck S, et al. 1994. Noninvasive assessment of cerebral hemodynamics and tissue oxygenation during activation of brain cell function in human adults using near infrared spectroscopy. Adv Exp Med Biol 345: 559–565. [DOI] [PubMed] [Google Scholar]
- 25.Kato T, Kamei a, Takashima S, et al. 1993. Human visual cortical function during photic stimulation monitoring by means of near-infrared spectroscopy. J Cereb Blood Flow Metab 13: 516–520. [DOI] [PubMed] [Google Scholar]
- 26.Meek JH, Elwell CE, Khan MJ, et al. 1995. Regional Changes in Cerebral Hemodynamic s as a Result of a Visual Stimulus Measured by near Infrared Spectroscopy. Proc R Soc B Biol Sci 261: 351–356. [DOI] [PubMed] [Google Scholar]
- 27.Chance B, Zhuang Z, UnAh C, et al. 1993. Cognition-activated low-frequency modulation of light absorption in human brain. Proc Natl Acad Sci 90: 3770–3774. [DOI] [PMC free article] [PubMed] [Google Scholar]
- 28.Meek JH, Firbank M, Elwell CE, et al. 1998. Regional hemodynamic responses to visual stimulation in awake infants. Pediatr Res 43: 840–843. [DOI] [PubMed] [Google Scholar]
- 29.Villringer A & Chance B. 1997. Non-invasive optical spectroscopy and imaging of human brain function. Trends Neurosci 20: 435–442. [DOI] [PubMed] [Google Scholar]
- 30.Hoshi Y & Tamura M. 1993. Dynamic multichannel near-infrared optical imaging of human brain activity. J ApplPhysiol 75: 1842–1846. [DOI] [PubMed] [Google Scholar]
- 31.Maki A, Yamashita Y, Ito Y, et al. 1995. Spatial and temporal analysis of human motor activity using noninvasive NIR topography. Med Phys 22: 1997–2005. [DOI] [PubMed] [Google Scholar]
- 32.Hirth C, Obrig H, Villringer K, et al. 1996. Non-invasive functional mapping of the human motor cortex using near-infrared spectroscopy. Neuroreport 7: 1977–81. [DOI] [PubMed] [Google Scholar]
- 33.Hock C, Villringer K, Müller-Spahn F, et al. 1997. Decrease in parietal cerebral hemoglobin oxygenation during performance of a verbal fluency task in patients with Alzheimer’s disease monitored by means of near-infrared spectroscopy (NIRS) - Correlation with simultaneous rCBF-PET measurements. Brain Res 755: 293–303. [DOI] [PubMed] [Google Scholar]
- 34.Plichta MM, Herrmann MJ, Baehne CG, et al. 2006. Event-related functional near-infrared spectroscopy (fNIRS): Are the measurements reliable? Neuroimage 31: 116–124. [DOI] [PubMed] [Google Scholar]
- 35.Lloyd-Fox S, Blasi A & Elwell CE. 2010. Illuminating the developing brain: The past, present and future of functional near infrared spectroscopy. Neurosci Biobehav Rev 34: 269–284. [DOI] [PubMed] [Google Scholar]
- 36.Obrig H 2014. NIRS in clinical neurology - a “promising” tool? Neuroimage 85: 535–546. [DOI] [PubMed] [Google Scholar]
- 37.Boas DA, Elwell CE, Ferrari M, et al. 2014. Twenty years of functional near-infrared spectroscopy: Introduction for the special issue. Neuroimage 85: 1–5. [DOI] [PubMed] [Google Scholar]
- 38.Website of the Society for fNIRS. Accessed February 12, 2018. www.fnirs.org.
- 39.Martinos Center news page Accessed February 12, 2018. https://www.nmr.mgh.harvard.edu/news/141028/the-birth-of-an-academic-society
- 40.Delpy DT & Cope M. 1997. Quantification in tissue near-infrared spectroscopy. Philos Trans R Soc B Biol Sci 352: 649–659. [Google Scholar]
- 41.Buxton RB 2009. An Introduction to Functional Magnetic Resonance Imaging: Principles and Techniques. In An Introduction to Functional Magnetic Resonance Imaging: Principles and Techniques. Ed: Cambridge University Press. [Google Scholar]
- 42.Nippert AR, Biesecker KR & Newman EA. 2018. Mechanisms Mediating Functional Hyperemia in the Brain. Neuroscientist 24: 73–83. [DOI] [PMC free article] [PubMed] [Google Scholar]
- 43.Patil AV, Safaie J, Moghaddam HA, et al. 2011. Experimental investigation of NIRS spatial sensitivity. Biomed Opt Express 2: 1478–1493. [DOI] [PMC free article] [PubMed] [Google Scholar]
- 44.Strangman GE, Li Z & Zhang Q. 2013. Depth Sensitivity and Source-Detector Separations for Near Infrared Spectroscopy Based on the Colin27 Brain Template. PLoS One 8: e66319. [DOI] [PMC free article] [PubMed] [Google Scholar]
- 45.Calderon-Arnulphi M, Alaraj A & Slavin KV. 2009. Near infrared technology in neuroscience: past, present and future. Neurol Res 31: 605–614. [DOI] [PubMed] [Google Scholar]
- 46.Zeff BW, White BR, Dehghani H, et al. 2007. Retinotopic mapping of adult human visual cortex with high-density diffuse optical tomography. Proc Natl Acad Sci U S A 104: 12169–12174. [DOI] [PMC free article] [PubMed] [Google Scholar]
- 47.Friston KJ, Josephs O, Rees G, et al. 1998. Nonlinear event-related response in fMRI. Magn Reson Med 39: 41–52. [DOI] [PubMed] [Google Scholar]
- 48.Huppert TJ, Hoge RD, Diamond SG, et al. 2006. A temporal comparison of BOLD, ASL, and NIRS hemodynamic responses to motor stimuli in adult humans. Neuroimage 29: 368–382. [DOI] [PMC free article] [PubMed] [Google Scholar]
- 49.Steinbrink J, Villringer A, Kempf F, et al. 2006. Illuminating the BOLD signal: combined fMRI-fNIRS studies. Magn Reson Imaging 24: 495–505. [DOI] [PubMed] [Google Scholar]
- 50.Cui X, Bray S, Bryant DM, et al. 2011. A quantitative comparison of NIRS and fMRI across multiple cognitive tasks. Neuroimage 54: 2808–2821. [DOI] [PMC free article] [PubMed] [Google Scholar]
- 51.Eggebrecht AT, White BR, Ferradal SL, et al. 2012. A quantitative spatial comparison of high-density diffuse optical tomography and fMRI cortical mapping. Neuroimage 61: 1120–1128. [DOI] [PMC free article] [PubMed] [Google Scholar]
- 52.Scarapicchia V, Brown C, Mayo C, et al. 2017. Functional Magnetic Resonance Imaging and Functional Near-Infrared Spectroscopy: Insights from Combined Recording Studies. Front Hum Neurosci 11: 419. [DOI] [PMC free article] [PubMed] [Google Scholar]
- 53.Tak S & Ye JC. 2014. Statistical analysis of fNIRS data: A comprehensive review. Neuroimage 85: 72–91. [DOI] [PubMed] [Google Scholar]
- 54.Friston KJ, Holmes AP, Worsley KJ, et al. 1994. Statistical parametric maps in functional imaging: A general linear approach. Hum Brain Mapp 2: 189–210. [Google Scholar]
- 55.Patel S, Katura T, Maki A, et al. 2011. Quantification of systemic interference in optical topography data during frontal lobe and motor cortex activation: An independent component analysis. In Advances in Experimental Medicine and Biology: 45–51. [DOI] [PMC free article] [PubMed]
- 56.Tanaka H, Katura T & Sato H. 2014. Task-related oxygenation and cerebral blood volume changes estimated from NIRS signals in motor and cognitive tasks. Neuroimage 94: 107–119. [DOI] [PubMed] [Google Scholar]
- 57.Tanaka H, Katura T & Sato H. 2013. Task-related component analysis for functional neuroimaging and application to near-infrared spectroscopy data. Neuroimage 64: 308–327. [DOI] [PubMed] [Google Scholar]
- 58.Emberson LL, Zinszer BD, Raizada RDS, et al. 2017. Decoding the infant mind: Multivariate pattern analysis (MVPA) using fNIRS. PLoS One 12: e172500. [DOI] [PMC free article] [PubMed] [Google Scholar]
- 59. Software developed for fNIRS imaging. List available on the website of the Society for fNIRS. Accessed February 12, 2018. http://fnirs.org/resources/software/
- 60.Pinti P, Aichelburg C, Lind F, et al. 2015. Using Fiberless, Wearable fNIRS to Monitor Brain Activity in Real-world Cognitive Tasks. J Vis Exp 106: e53336. [DOI] [PMC free article] [PubMed] [Google Scholar]
- 61.Pinti P, Merla A, Aichelburg C, et al. 2017. A novel GLM-based method for the Automatic IDentification of functional Events (AIDE) in fNIRS data recorded in naturalistic environments. Neuroimage 155: 291–304. [DOI] [PMC free article] [PubMed] [Google Scholar]
- 62.Lu CM, Zhang YJ, Biswal BB, et al. 2010. Use of fNIRS to assess resting state functional connectivity. J Neurosci Methods 186: 242–249. [DOI] [PubMed] [Google Scholar]
- 63.Duan L, Zhang YJ & Zhu CZ. 2012. Quantitative comparison of resting-state functional connectivity derived from fNIRS and fMRI: A simultaneous recording study. Neuroimage 60: 2008–2018. [DOI] [PubMed] [Google Scholar]
- 64.Sasai S, Homae F, Watanabe H, et al. 2012. A NIRS-fMRI study of resting state network. Neuroimage 63: 179–193. [DOI] [PubMed] [Google Scholar]
- 65.Bulgarelli C, Blasi A, Arridge S, et al. 2018. Dynamic causal modelling on infant fNIRS data: A validation study on a simultaneously recorded fNIRS-fMRI dataset. Neuroimage 175: 413–424. [DOI] [PMC free article] [PubMed] [Google Scholar]
- 66.Mesquita RC, Franceschini MA & Boas DA. 2010. Resting state functional connectivity of the whole head with near-infrared spectroscopy. Biomed Opt Express 1: 324. [DOI] [PMC free article] [PubMed] [Google Scholar]
- 67.Sasai S, Homae F, Watanabe H, et al. 2011. Frequency-specific functional connectivity in the brain during resting state revealed by NIRS. Neuroimage 56: 252–257. [DOI] [PubMed] [Google Scholar]
- 68.Zhang H, Zhang YJ, Lu CM, et al. 2010. Functional connectivity as revealed by independent component analysis of resting-state fNIRS measurements. Neuroimage 51: 1150–1161. [DOI] [PubMed] [Google Scholar]
- 69.Tak S, Kempny AM, Friston KJ, et al. 2015. Dynamic causal modelling for functional near-infrared spectroscopy. Neuroimage 111: 338–349. [DOI] [PMC free article] [PubMed] [Google Scholar]
- 70.Quaresima V, & Ferrari M 2016. Functional near-infrared spectroscopy (fNIRS) for assessing cerebral cortex function during human behavior in natural/social situations: a concise review. Organ Res Methods
- 71.Tachtsidis I & Scholkmann F. 2016. False positives and false negatives in functional near-infrared spectroscopy: issues, challenges, and the way forward. Neurophotonics 3: 31405. [DOI] [PMC free article] [PubMed] [Google Scholar]
- 72.Herold F, Wiegel P, Scholkmann F, et al. 2017. Functional near-infrared spectroscopy in movement science: a systematic review on cortical activity in postural and walking tasks. Neurophotonics 4: 41403. [DOI] [PMC free article] [PubMed] [Google Scholar]
- 73.Suda M, Takei Y, Aoyama Y, et al. 2010. Frontopolar activation during face-to-face conversation: An in situ study using near-infrared spectroscopy. Neuropsychologia 48: 441–447. [DOI] [PubMed] [Google Scholar]
- 74.Takei Y, Suda M, Aoyama Y, et al. 2014. Near-infrared spectroscopic study of frontopolar activation during face-to-face conversation in major depressive disorder and bipolar disorder. J Psychiatr Res 57: 74–83. [DOI] [PubMed] [Google Scholar]
- 75.Noah JA, Ono Y, Nomoto Y, et al. 2015. fMRI Validation of fNIRS Measurements During a Naturalistic Task. J Vis Exp 100: e52116. [DOI] [PMC free article] [PubMed] [Google Scholar]
- 76.Scholkmann F, Spichtig S, Muehlemann T, et al. 2010. How to detect and reduce movement artifacts in near-infrared imaging using moving standard deviation and spline interpolation. Physiol Meas 31: 649–662. [DOI] [PubMed] [Google Scholar]
- 77.Brigadoi S, Ceccherini L, Cutini S, et al. 2014. Motion artifacts in functional near-infrared spectroscopy: A comparison of motion correction techniques applied to real cognitive data. Neuroimage 85: 181–191. [DOI] [PMC free article] [PubMed] [Google Scholar]
- 78.Roche-Labarbe N, Wallois F, Ponchel E, et al. 2007. Coupled oxygenation oscillation measured by NIRS and intermittent cerebral activation on EEG in premature infants. Neuroimage 36: 718–727. [DOI] [PubMed] [Google Scholar]
- 79.Leff DR, Orihuela-Espina F, Elwell CE, et al. 2011. Assessment of the cerebral cortex during motor task behavior s in adults: A systematic review of functional near infrared spectroscopy (fNIRS) studies. Neuroimage 54: 2922–2936. [DOI] [PubMed] [Google Scholar]
- 80.Zaramella P, Freato F, Amigoni A, et al. 2001. Brain auditory activation measured by near-infrared spectroscopy (NIRS) in neonates. Pediatr Res 49: 213–219. [DOI] [PubMed] [Google Scholar]
- 81.Hirsch J, Zhang X, Noah JA, et al. 2017. Frontal temporal and parietal systems synchronize within and across brains during live eye-to-eye contact. Neuroimage 157: 314–330. [DOI] [PMC free article] [PubMed] [Google Scholar]
- 82.Schroeter ML, Cutini S, Wahl MM, et al. 2007. Neurovascular coupling is impaired in cerebral microangiopathy—an event-related Stroop study. Neuroimage 34: 26–34. [DOI] [PubMed] [Google Scholar]
- 83.Herrmann MJ, Langer JBM, Jacob C, et al. 2008. Reduced prefrontal oxygenation in alzheimer disease during verbal fluency tasks. Am J Geriatr Psychiatry 16: 125–135. [DOI] [PubMed] [Google Scholar]
- 84.Wallois F, Mahmoudzadeh M, Patil A, et al. 2012. Usefulness of simultaneous EEG-NIRS recording in language studies. Brain Lang 121: 110–123. [DOI] [PubMed] [Google Scholar]
- 85.Hocke LM, Oni IK, Duszynski CC, et al. 2018. Automated processing of fNIRS data-A visual guide to the pitfalls and consequences. Algorithms 11. [DOI] [PMC free article] [PubMed] [Google Scholar]
- 86.Ferradal SL, Eggebrecht AT, Hassanpour M, et al. 2014. Atlas-based head modeling and spatial normalization for high-density diffuse optical tomography: In vivo validation against fMRI. Neuroimage 85: 117–126. [DOI] [PMC free article] [PubMed] [Google Scholar]
- 87.Zhao H & Cooper RJ. 2017. Review of recent progress toward a fiberless, whole-scalp diffuse optical tomography system. Neurophotonics 5: 1. [DOI] [PMC free article] [PubMed] [Google Scholar]
- 88.Pifferi A, Contini D, Mora AD, et al. 2016. New frontiers in time-domain diffuse optics, a review. J Biomed Opt 21: 91310. [DOI] [PubMed] [Google Scholar]
- 89.Bale G, Mitra S, Meek J, et al. 2014. A new broadband near-infrared spectroscopy system for in-vivo measurements of cerebral cytochrome-c-oxidase changes in neonatal brain injury. Biomed Opt Express 5: 3450. [DOI] [PMC free article] [PubMed] [Google Scholar]
- 90.Lange F, Dunne L, Hale L, et al. 2018. MAESTROS: A multi-wavelength time domain NIRS system to monitor changes in oxygenation and oxidation state of cytochrome-c-oxidase. IEEE J Sel Top Quantum Electron [DOI] [PMC free article] [PubMed]
- 91.Van Essen DC, Smith SM, Barch DM, et al. 2013. The WU-Minn Human Connectome Project: An overview. Neuroimage 80: 62–79. [DOI] [PMC free article] [PubMed] [Google Scholar]
- 92.Miller KL, Alfaro-Almagro F, Bangerter NK, et al. 2016. Multimodal population brain imaging in the UK Biobank prospective epidemiological study. Nat Neurosci 19: 1523–1536. [DOI] [PMC free article] [PubMed] [Google Scholar]
- 93.Smith SM & Nichols TE. 2018. Statistical Challenges in “Big Data” Human Neuroimaging. Neuron 97: 263–268. [DOI] [PubMed] [Google Scholar]
- 94.Kvavilashvili L & Ellis J. 2004. Ecological validity and the real-life/laboratory controversy in memory research: A critical (and historical) review. Hist Philos Psychol 6: 59–80. [Google Scholar]
- 95.Burgess PW, Alderman N, Forbes C, et al. 2006. The case for the development and use of “ecologically valid” measures of executive function in experimental and clinical neuropsychology. J Int Neuropsychol Soc 12: 194–209. [DOI] [PubMed] [Google Scholar]
- 96.Moscovitch M & Umiltà C. 1990. Modularity and neuropsychology: Modules and central processes in attention and memory. In Modular deficits in Alzheimer-type dementia Ed.: Schwartz MF. Cambridge, MA: The MIT press. [Google Scholar]
- 97.Burgess PW, Alderman N, Volle E, et al. 2009. Mesulam’s frontal lobe mystery re-examined. Restor Neurol Neurosci 27: 493–506. [DOI] [PubMed] [Google Scholar]
- 98.Atsumori H 2010. Noninvasive imaging of prefrontal activation during attention-demanding tasks performed while walking using a wearable optical topography system. J Biomed Opt 15: 46002. [DOI] [PubMed] [Google Scholar]
- 99.Balardin JB, Zimeo Morais GA, Furucho RA, et al. 2017. Imaging brain function with functional near-infrared spectroscopy in unconstrained environments. Front Hum Neurosci 11: 258. [DOI] [PMC free article] [PubMed] [Google Scholar]
- 100.Maidan I, Nieuwhof F, Bernad-Elazari H, et al. 2016. The Role of the Frontal Lobe in Complex Walking Among Patients With Parkinsons Disease and Healthy Older Adults: An fNIRS Study. Neurorehabil Neural Repair 30: 963–971. [DOI] [PubMed] [Google Scholar]
- 101.McKendrick R, Parasuraman R, Murtza R, et al. 2016. Into the Wild: Neuroergonomic Differentiation of Hand-Held and Augmented Reality Wearable Displays during Outdoor Navigation with Functional Near Infrared Spectroscopy. Front Hum Neurosci 10. [DOI] [PMC free article] [PubMed] [Google Scholar]
- 102.McKendrick R, Mehta R, Ayaz H, et al. 2017. Prefrontal Hemodynamics of Physical Activity and Environmental Complexity during Cognitive Work. Hum Factors 59: 147–162. [DOI] [PubMed] [Google Scholar]
- 103.Mirelman A, Maidan I, Bernad-Elazari H, et al. 2014. Increased frontal brain activation during walking while dual tasking: An fNIRS study in healthy young adults. J Neuroeng Rehabil 11: 85. [DOI] [PMC free article] [PubMed] [Google Scholar]
- 104.Takeuchi N, Mori T, Suzukamo Y, et al. 2016. Parallel processing of cognitive and physical demands in left and right prefrontal cortices during smartphone use while walking. BMC Neurosci 17: 9. [DOI] [PMC free article] [PubMed] [Google Scholar]
- 105.Nieuwhof F, Reelick MF, Maidan I, et al. 2016. Measuring prefrontal cortical activity during dual task walking in patients with Parkinson’s disease: feasibility of using a new portable fNIRS device. Pilot Feasibility Stud 2: 59. [DOI] [PMC free article] [PubMed] [Google Scholar]
- 106.Doi T, Makizako H, Shimada H, et al. 2013. Brain activation during dual-task walking and executive function among older adults with mild cognitive impairment: a fNIRS study. Aging Clin Exp Res 25: 539–544. [DOI] [PubMed] [Google Scholar]
- 107.Website of the Global fNIRS project Accessed February 12, 2018. http://www.globalfnirs.org/
- 108.Lloyd-Fox S, Begus K, Halliday D, et al. 2017. Cortical specialisation to social stimuli from the first days to the second year of life: A rural Gambian cohort. Dev Cogn Neurosci 25: 92–104. [DOI] [PMC free article] [PubMed] [Google Scholar]
- 109.Creative Commons Attribution License (CC BY) https://creativecommons.org/licenses/by/4.0/
- 110.Burgess PW, & Wu H 2013. Rostral prefrontal cortex (Brodmann area 10). In Principles of frontal lobe function Oxford University Press: 524–544. New York. [Google Scholar]
- 111.Okamoto M, Dan H, Shimizu K, et al. 2004. Multimodal assessment of cortical activation during apple peeling by NIRS and fMRI. Neuroimage 21: 1275–1288. [DOI] [PubMed] [Google Scholar]
- 112.Masataka N, Perlovsky L & Hiraki K. 2015. Near-infrared spectroscopy (NIRS) in functional research of prefrontal cortex. Front Hum Neurosci 9: 974. [DOI] [PMC free article] [PubMed] [Google Scholar]
- 113.Goel V, Grafman J, Tajik J, et al. 1997. A study of the performance of patients with frontal lobe lesions in a financial planning task. Brain 120: 1805–1822. [DOI] [PubMed] [Google Scholar]
- 114.Shallice T & Burgess PW. 1991. Deficits in strategy application following frontal lobe damage in man. Brain 114: 727–741. [DOI] [PubMed] [Google Scholar]
- 115.Fletcher PC, Shallice T & Dolan RJ. 2000. “Sculpting the response space” - An account of left prefrontal activation at encoding. Neuroimage 12: 404–417. [DOI] [PubMed] [Google Scholar]
- 116.Brunswik E 1956. Perception and the representative design of psychological experiments Ed.: 2 Berkeley: University of California Press. [Google Scholar]
- 117.Yoshino K, Oka N, Yamamoto K, et al. 2013. Functional brain imaging using near-infrared spectroscopy during actual driving on an expressway. Front Hum Neurosci 7: 882. [DOI] [PMC free article] [PubMed] [Google Scholar]
- 118.Burgess PW, Dumontheil I & Gilbert SJ. 2007. The gateway hypothesis of rostral prefrontal cortex (area 10) function. Trends Cogn Sci 11: 290–298. [DOI] [PubMed] [Google Scholar]
- 119.Bembich S, Clarici A, Vecchiet C, et al. 2014. Differences in time course activation of dorsolateral prefrontal cortex associated with low or high risk choices in a gambling task. Front Hum Neurosci Vol 8 June 2014, ArtID 464 8: 464. [DOI] [PMC free article] [PubMed] [Google Scholar]
- 120.Daw ND, O’Doherty JP, Dayan P, et al. 2006. Cortical substrates for exploratory decisions in humans. Nature 441: 876–879. [DOI] [PMC free article] [PubMed] [Google Scholar]
- 121.Shallice T, & Burgess P. 1996. The Domain of Supervisory Processes and Temporal Organization of Behavior . Philos Trans R Soc B Biol Sci 351: 1405–1412. [DOI] [PubMed] [Google Scholar]
- 122.Kornhuber HH & Deecke L. 1965. Hirnpotentialänderungen bei Willkürbewegungen und passiven Bewegungen des Menschen: Bereitschaftspotential und reafferente Potentiale. Pflugers Arch Gesamte Physiol Menschen Tiere 284: 1–17. [PubMed] [Google Scholar]
- 123.De Jong R, Wierda M, Mulder G, et al. 1988. Use of Partial Stimulus Information in Response Processing. J Exp Psychol Hum Percept Perform 14: 682–692. [DOI] [PubMed] [Google Scholar]
- 124.Gratton G, Coles MGH, Sirevaag EJ, et al. 1988. Pre- and Poststimulus Activation of Response Channels: A Psychophysiological Analysis. J Exp Psychol Hum Percept Perform 14: 331–344. [DOI] [PubMed] [Google Scholar]
- 125.Soon CS, Brass M, Heinze HJ, et al. 2008. Unconscious determinants of free decisions in the human brain. Nat Neurosci 11: 543–545. [DOI] [PubMed] [Google Scholar]
- 126.Kounios J, Fleck JI, Green DL, et al. 2008. The origins of insight in resting-state brain activity. Neuropsychologia 46: 281–291. [DOI] [PMC free article] [PubMed] [Google Scholar]
- 127.Adolphs R 2009. The Social Brain: Neural Basis of Social Knowledge. Annu Rev Psychol 60: 693–716. [DOI] [PMC free article] [PubMed] [Google Scholar]
- 128.Happé F & Frith U. 1996. The neuropsychology of autism. Brain 119: 1377–1400. [DOI] [PubMed] [Google Scholar]
- 129.Schilbach L 2014. On the relationship of online and offline social cognition. Front Hum Neurosci 8: 278. [DOI] [PMC free article] [PubMed] [Google Scholar]
- 130.Ding XP, Fu G & Lee K. 2014. Neural correlates of own- and other-race face recognition in children: A functional near-infrared spectroscopy study. Neuroimage 85: 335–344. [DOI] [PMC free article] [PubMed] [Google Scholar]
- 131.Balconi M, Grippa E & Vanutelli ME. 2015. What hemodynamic (fNIRS), electrophysiological (EEG) and autonomic integrated measures can tell us about emotional processing. Brain Cogn 95: 67–76. [DOI] [PubMed] [Google Scholar]
- 132.Hyde DC, Aparicio Betancourt M & Simon CE. 2015. Human temporal-parietal junction spontaneously tracks others’ beliefs: A functional near-infrared spectroscopy study. Hum Brain Mapp 36: 4831–4846. [DOI] [PMC free article] [PubMed] [Google Scholar]
- 133.Minagawa-Kawai Y, Matsuoka S, Dan I, et al. 2009. Prefrontal activation associated with social attachment: Facial-emotion recognition in mothers and infants. Cereb Cortex 19: 284–292. [DOI] [PubMed] [Google Scholar]
- 134.Bennett RH, Bolling DZ, Anderson LC, et al. 2014. fNIRS detects temporal lobe response to affective touch. Soc Cogn Affect Neurosci 9: 470–476. [DOI] [PMC free article] [PubMed] [Google Scholar]
- 135.Oliver D, Tachtsidis I & de C. Hamilton AF. 2018. The role of parietal cortex in overimitation: a study with fNIRS. Soc Neurosci 13: 214–225. [DOI] [PMC free article] [PubMed] [Google Scholar]
- 136.Aranyi G, Pecune F, Charles F, et al. 2016. Affective Interaction with a Virtual Character Through an fNIRS Brain-Computer Interface. Front Comput Neurosci 10: 70. [DOI] [PMC free article] [PubMed] [Google Scholar]
- 137.Grossmann T, Cross ES, Ticini LF, et al. 2013. Action observation in the infant brain: The role of body form and motion. Soc Neurosci 8: 22–30. [DOI] [PMC free article] [PubMed] [Google Scholar]
- 138.Lloyd-Fox S, Széplaki-Köllőd B, Yin J, et al. 2015. Are you talking to me? Neural activations in 6-month-old infants in response to being addressed during natural interactions. Cortex 70: 35–48. [DOI] [PMC free article] [PubMed] [Google Scholar]
- 139.Urakawa S, Takamoto K, Ishikawa A, et al. 2014. Selective medial prefrontal cortex responses during live mutual gaze interactions in human infants: an fNIRS study. Brain Topogr 28: 691–701 [DOI] [PubMed] [Google Scholar]
- 140.Bortfeld H, Wruck E & Boas DA. 2007. Assessing infants’ cortical response to speech using near-infrared spectroscopy. Neuroimage 34: 407–415. [DOI] [PMC free article] [PubMed] [Google Scholar]
- 141.Vanderwert RE & Nelson CA. 2014. The use of near-infrared spectroscopy in the study of typical and atypical development. Neuroimage 85: 264–271. [DOI] [PMC free article] [PubMed] [Google Scholar]
- 142.Lloyd-Fox S, Blasi A, Elwell CE, et al. 2013. Reduced neural sensitivity to social stimuli in infants at risk for autism. Proceedings Biol Sci 280: 20123026. [DOI] [PMC free article] [PubMed] [Google Scholar]
- 143.Tamura R, Kitamura H, Endo T, et al. 2012. Decreased leftward bias of prefrontal activity in autism spectrum disorder revealed by functional near-infrared spectroscopy. Psychiatry Res Neuroimaging 203: 237–240. [DOI] [PubMed] [Google Scholar]
- 144.Jung CE, Strother L, Feil-Seifer DJ, et al. 2016. Atypical Asymmetry for Processing Human and Robot Faces in Autism Revealed by fNIRS. PLoS One 11: e0158804. [DOI] [PMC free article] [PubMed] [Google Scholar]
- 145.Lloyd-Fox S, Papademetriou M, Darboe MK, et al. 2014. Functional near infrared spectroscopy (fNIRS) to assess cognitive function in infants in rural Africa. Sci Rep 4: 4740. [DOI] [PMC free article] [PubMed] [Google Scholar]
- 146.King-Casas B, Tomlin D, Anen C, et al. 2005. Getting to know you: Reputation and trust in a two-person economic exchange. Science (80) 308: 78–83. [DOI] [PubMed] [Google Scholar]
- 147.Montague PR, Berns GS, Cohen JD, et al. 2002. Hyperscanning: Simultaneous fMRI during linked social interactions. Neuroimage 16: 1159–1164. [DOI] [PubMed] [Google Scholar]
- 148.Anders S, Heinzle J, Weiskopf N, et al. 2011. Flow of affective information between communicating brains. Neuroimage 54: 439–446. [DOI] [PMC free article] [PubMed] [Google Scholar]
- 149.Hasson U, Ghazanfar AA, Galantucci B, et al. 2012. Brain-to-brain coupling: A mechanism for creating and sharing a social world. Trends Cogn Sci 16: 114–121. [DOI] [PMC free article] [PubMed] [Google Scholar]
- 150.Cui X, Bryant DM & Reiss AL. 2012. NIRS-based hyperscanning reveals increased interpersonal coherence in superior frontal cortex during cooperation. Neuroimage 59: 2430–7. [DOI] [PMC free article] [PubMed] [Google Scholar]
- 151.Scholkmann F, Holper L, Wolf U, et al. 2013. A new methodical approach in neuroscience: assessing inter-personal brain coupling using functional near-infrared imaging (fNIRI) hyperscanning. Front Hum Neurosci 7: 813. [DOI] [PMC free article] [PubMed] [Google Scholar]
- 152.Osaka N, Minamoto T, Yaoi K, et al. 2015. How Two Brains Make One Synchronized Mind in the Inferior Frontal Cortex: fNIRS-Based Hyperscanning During Cooperative Singing. Front Psychol 6: 1811. [DOI] [PMC free article] [PubMed] [Google Scholar]
- 153.Liu N, Cui X, Bryant DM, et al. 2015. Inferring deep-brain activity from cortical activity using functional near-infrared spectroscopy. Biomed Opt Express 6: 1074–89. [DOI] [PMC free article] [PubMed] [Google Scholar]
- 154.Zhang M, Liu T, Pelowski M, et al. 2017. Gender difference in spontaneous deception: A hyperscanning study using functional near-infrared spectroscopy. Sci Rep 7: 7508. [DOI] [PMC free article] [PubMed] [Google Scholar]
- 155.Piva M, Zhang X, Noah JA, et al. 2017. Distributed Neural Activity Patterns during Human-to-Human Competition. Front Hum Neurosci 11: 571. [DOI] [PMC free article] [PubMed] [Google Scholar]
- 156.Bhat AN, Hoffman MD, Trost SL, et al. 2017. Cortical Activation during Action Observation, Action Execution, and Interpersonal Synchrony in Adults: A functional Near-Infrared Spectroscopy (fNIRS) Study. Front Hum Neurosci 11: 431. [DOI] [PMC free article] [PubMed] [Google Scholar]
- 157.Holper L, Scholkmann F & Wolf M. 2012. Between-brain connectivity during imitation measured by fNIRS. Neuroimage 63: 212–222. [DOI] [PubMed] [Google Scholar]
- 158.Jiang J, Chen C, Dai B, et al. 2015. Leader emergence through interpersonal neural synchronization. Proc Natl Acad Sci U S A 112: 4274–9. [DOI] [PMC free article] [PubMed] [Google Scholar]
- 159.Nozawa T, Sasaki Y, Sakaki K, et al. 2016. Interpersonal frontopolar neural synchronization in group communication: An exploration toward fNIRS hyperscanning of natural interactions. Neuroimage 133: 484–497. [DOI] [PubMed] [Google Scholar]
- 160.Schilbach L, Timmermans B, Reddy V, et al. 2013. Toward a second-person neuroscience. Behav Brain Sci 36: 393–414. [DOI] [PubMed] [Google Scholar]
- 161.Di Paolo E & De Jaegher H. 2012. The interactive brain hypothesis. Front Hum Neurosci 6: 163. [DOI] [PMC free article] [PubMed] [Google Scholar]