

Abstract
Cytosolic Ca2+ has been proposed to act as both a positive and a negative feedback signal on the inositol trisphosphate (InsP3) receptor. However, it is unclear how this might affect the Ca2+ response in vivo.
Mouse pancreatic acinar cells were whole-cell patch clamped to record the Ca2+-dependent chloride (Cl(Ca)) current spikes and imaged to record the cytosolic Ca2+ spikes elicited by the injection of Ins(2,4,5)P3. Increasing concentrations of Ca2+ buffer (up to 200 μm EGTA or BAPTA) were associated with the appearance of steps in the current activation phase and a prevalence of smaller-amplitude Cl(Ca) spikes. Imaging experiments showed that with increased buffer the secretory pole cytosolic Ca2+ signal became fragmented and spatially discrete Ca2+ release events were observed.
At higher buffer concentrations (200-500 μm), increasing concentrations of EGTA increased spike frequency and reduced spike amplitude. In contrast, BAPTA decreased spike frequency and maintained large spike amplitudes.
We conclude that, during InsP3-evoked spiking, long-range Ca2+ feedback (∼2–4 μm) shapes the rising phase of the Ca2+ signal by acting to co-ordinate discrete Ca2+ release events and short-range (∼40 nm) Ca2+ feedback acts to inhibit further Ca2+ release.
The well-known biphasic effect of cytosolic calcium (Ca2+) on the InsP3 receptor, largely derived from in vitro experiments (for example Bezprozvanny et al. 1991), still leaves many questions unanswered in explaining in vivo Ca2+ responses.
Role of released Ca2+ as a positive feedback mechanism
Rapid superfusion studies of InsP3-triggered 45Ca2+ flux from microsomes (Finch et al. 1991; Marchant & Taylor, 1997) or rapid photolytic release of InsP3 from a caged precursor in more intact systems (Iino & Endo, 1992; Iino & Tsukioka, 1994; Ogden & Capiod, 1997; Hirose et al. 1998) have shown that Ca2+ acts to potentiate InsP3-evoked release. In vivo, Ca2+ release from one region, leading to activation of release from adjacent sites, has been proposed to be the mechanism for wave propagation, that is Ca2+-induced-Ca2+ release (CICR) (Berridge & Dupont, 1994). However, there is little in vivo evidence for this mechanism occurring at the InsP3 receptor. In one study (Yao & Parker, 1992) used Ca2+ imaging techniques to show that, on a background elevation of InsP3, injections of Ca2+ can act as new foci for a Ca2+ wave. Their work demonstrates the principle that exogenous Ca2+ can ‘seed’ a new wave of release. If CICR was the mechanism for communication between InsP3-dependent Ca2+ release sites then Ca2+ buffers should interfere with this process. Wang & Thompson (1995) used exogenous Ca2+ buffers, and demonstrated a slowing of global Ca2+ waves. Using a similar method, the application of EGTA to rat basophilic leukaemia (RBL) cells (Horne & Meyer, 1997) restricted Ca2+ release to apparently spatially discrete Ca2+ release sites. Both of these experiments lend support to a role for CICR in shaping the cytosolic Ca2+ response.
Role of released Ca2+ as a negative feedback mechanism
Inhibition of InsP3-evoked Ca2+ release has been observed under conditions where the cytosolic Ca2+ has been artificially elevated to a raised steady-state level (DeLisle et al. 1990; Parker & Ivorra, 1990; Payne et al. 1990; Combettes et al. 1994). More direct effects of Ca2+ release on inhibiting a subsequent InsP3-evoked response have also been shown (Ilyin & Parker, 1994; Ogden & Capiod, 1997; Carter & Ogden, 1997). InsP3 receptor desensitisation by Ca2+ release has also been described (Oancea & Meyer, 1996). It is not clear, at present, if this is a distinct process separate from inactivation. The recovery from inactivation/desensitisation is slow (seconds to minutes) and is proposed to be the mechanism that governs the interspike interval (Oancea & Meyer, 1996; Carter & Ogden, 1997).
Ca2+ signalling in pancreatic acinar cells
In the pancreatic acinar cell, the activation of the Cl(Ca) current is critical to the process of fluid secretion (Kasai & Augustine, 1990; Greger 1996). The underlying Ca2+ signal is characterised by local mechanisms of Ca2+ release in the secretory pole which adjoins the apical plasma membrane where the Cl(Ca) channels are clustered (Thorn et al. 1993; Zdebik et al. 1997). Low concentrations of agonists, or direct injection of InsP3, elicit trains of Ca2+ spikes, restricted to the secretory pole, which in turn activate trains of Cl(Ca) current spikes (Thorn et al. 1996; Ito et al. 1997). Previous work, in pancreatic acinar cells, suggests that the InsP3-evoked Ca2+ response is composed of spatially discrete Ca2+ release units that are co-ordinated by a process of CICR (Thorn et al. 1996). However, a role for positive feedback of the Ca2+ signal on the InsP3 receptor has not been directly demonstrated in acinar cells. A number of studies have shown, however, that elevation of basal Ca2+ can inhibit the InsP3 or agonist-evoked responses (e.g. Wakui & Petersen, 1990). Furthermore it has been shown that loading pancreatic acinar cells with BAPTA increased the rate and extent of Ca2+ efflux (Zhang & Muallem, 1992). This led the authors to postulate that Ca2+-dependent inhibition of Ca2+ release is the underlying mechanism for terminating Ca2+ oscillations and that BAPTA interferes with this process resulting in increased Ca2+ release from the intracellular stores.
In this paper we have investigated the potential role of released Ca2+ as a feedback signal in specifically shaping the spatial and temporal characteristics of Ca2+ spikes. In studying what is thought to be a physiologically relevant oscillatory signal in pancreatic acinar cells we directly address the actual mechanisms involved in its genesis. We have chosen to manipulate the oscillatory system with a range of concentrations of fast and slow on-rate Ca2+ buffers and study the effects these have on the Ca2+ response. We conclude that, during each oscillatory cycle, cytosolic Ca2+ acts as a long-range messenger (μ2-4 μm) to co-ordinate Ca2+ release from a small number of release sites, giving rise to a local Ca2+ spike. In addition, we provide evidence that released Ca2+ acts as a short-range messenger (μ40 nm) to inhibit further Ca2+ release.
METHODS
Cell preparation
Male outbred albino mice (25 g) were killed by cervical dislocation and the pancreas dissected out. Acutely isolated mouse pancreatic acinar cells were prepared by collagenase (Worthington, CLSPA) digestion at 33°C for 7 min as previously described (Thorn & Petersen, 1992). Cells were plated onto poly-L-ornithine (Sigma)-coated dishes.
Patch clamp
Standard whole-cell patch clamp techniques (Hamill et al. 1981) were employed and all experiments were carried out at room temperature (μ21°C). Pipettes had a resistance of 3–6 MΩ (Brown and Flaming pipette puller). After breaking through to the whole-cell configuration pipettes had a measured, but uncompensated series resistance of 10-20 MΩ. The pipette solution contained (mm): KCl 140, MgCl2 1, Na2ATP 2, EGTA/BAPTA 0.01–0.5, (Calcium Green 0.05, Molecular Probes), Hepes-KOH 10; pH 7.2. The extracellular solution contained (mm): NaCl 135, KCl 5, MgCl2 1, CaCl2 1, glucose 10, NaOH-Hepes 10; pH 7.4. Cells were held at a membrane potential of −30 mV and currents were sampled by an A/D converter (EPC-9, HEKA) at 2 kHz. In experiments where the pipette free Ca2+ concentration was adjusted we added appropriate concentrations of total Ca2+ according to the equilibrium equations (MAXC programme, Chris Patton, Stanford University). In all experiments Ins(2,4,5)P3 (gift from Professor R. Irvine) was added to the pipette solution (8–14 μm) to establish trains of Ca2+ spikes. These spikes have previously been shown to originate from a mechanism of InsP3-dependent Ca2+ release in the secretory pole (Thorn et al. 1993), to remain localised to this region of the cell and to be independent of ryanodine receptor activity (Thorn et al. 1994). Control experiments showed no effect on the current spike size or shape when extracellular monovalent cations were replaced with N-methyl D-glucamine (NMDG). We conclude that the current is carried by calcium-activated Cl− channels that have been shown to be localised to the apical membrane (Zdebik et al. 1997).
Photolytic release of Ca2+ from DM-nitrophen
The whole-cell configuration of the patch-clamp technique was used to introduce the caged Ca2+ compound DM-nitrophen (Calbiochem) into the cells. The pipette solution contained (mm): KCl 140, MgCl2 1, Hepes 10, Na2ATP 2, CaCl2 8, DM-nitrophen 10; pH 7.2. The extracellular solution contained (mm): NaCl 65, NMDGCl 70, KCl 5, MgCl2 1, CaCl2 1, glucose 10, Hepes 10; pH 7.4. A high intensity flash of UV light (HiTech Scientific, UK) focused through the objective lens of the microscope was used to liberate the Ca2+ from the DM-nitrophen. Whole-cell recordings were performed with the membrane potential clamped at −17 mV, the equilibrium potential for cations, in order to eliminate any component of the current, which might be from Ca2+-dependent cation channels.
Patch clamp data analysis
The Cl(Ca) current data were analysed with a custom programme within the IGOR package (Wavemetrics Inc., Eugene, OR, USA). Spike amplitude rate of rise and frequency over the test period were assessed. The Cl(Ca) current spike amplitude was measured from the point of a 20 pA excursion of the baseline current to the maximum inward current obtained for each spike. The average rate of rise of the current spike was determined by dividing the peak spike amplitude by the time measured from a 20 pA deviation from the noise to the time of the peak. Student's one-tailed, two-sample, equal variance t test was applied where relevant.
Fluorescence imaging
Ca2+ imaging experiments were performed by inclusion of 40-50 μm Calcium Green in the pipette solution. Cells were illuminated with a visible laser (Coherent Innova 70) at 488 nm and imaged through a Nikon ×40 UV, 1.3 NA, oil immersion objective through a 510 nm long-pass filter. Full-frame images (128 × 128 pixels) were captured on a cooled CCD camera (70 % quantum efficiency, 5 electrons readout noise; Massachusetts Institute of Technology (MIT), Lincoln Laboratories) with a pixel size of 200 nm at the specimen and at rates of up to 500 Hz. After recording to computer, the data were analysed with custom software with bleach correction routines and appropriate smoothing. Images were displayed in terms of ΔF/Fo (100 × (F - Fo)/Fo), where F is the recorded fluorescence and Fo was obtained from the mean of 20 sequential frames where no activity was apparent. The principle advantage of this imaging technique is the fast rate of acquisition of full frame images (Rizzuto et al. 1998).
RESULTS
Investigation of the effects of buffers on the Ins(2,4,5)P3-induced Cl(Ca) current spikes
In order to determine the role of Ca2+ feedback during an oscillatory response we used high temporal resolution (2 kHz) Cl(Ca) current measurement in whole-cell patch clamp experiments. The intracellular environment was altered by the inclusion of a range of exogenous slow on-rate (EGTA) and fast on-rate (BAPTA) Ca2+ buffer concentrations in the pipette solution. In these experiments the Cl(Ca) current spikes were recorded and a 150 s section of data, taken 150 s after breakthrough to whole-cell configuration, was analysed (Fig. 1).
Figure 1. Trains of current spikes induced by injections of Ins(2,4,5)P3.
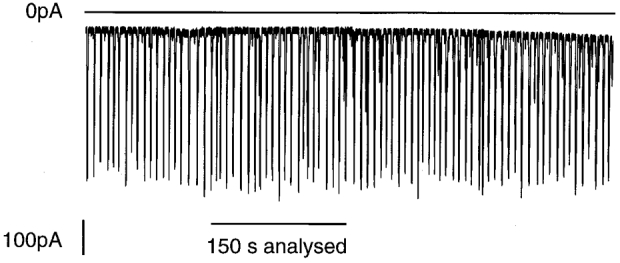
Representative electrophysiological data obtained from a single whole-cell patch clamped acinar cell held under voltage clamp at a membrane potential of −30 mV in the presence of 50 μm EGTA. The upper horizontal line shows the zero current level in this figure (and in others). The record was obtained immediately after breaking through to the whole-cell configuration and shows the stable nature of the spike responses, which are of similar frequency and amplitude throughout the time of recording. The period of time used in the analysis of spike parameters was always 150 s after breakthrough to whole cell and was itself 150 s long. The period of analysis, for this cell, is indicated below the figure.
We studied three main parameters, peak spike amplitude, spike frequency and average rate of current rise (Figs 2, 3 and 4). The data represent the means and standard errors of the mean obtained from at least three independent cells at each Ca2+ buffer concentration with a sum total of around 100 spikes at each condition. The values, obtained at 10 μm EGTA and 50 μm EGTA or BAPTA, showed no significant differences in any of the parameters (P > 0.06).
Figure 2. Graphs of peak current spike amplitude plotted against Ca2+ buffer concentration.
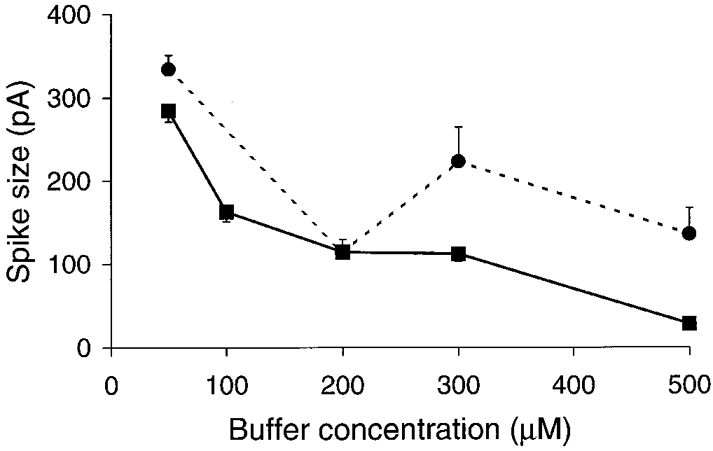
EGTA, ▪ and continuous line; BAPTA, • and dashed line. These graphs and those of Figs 3 and 4, show the mean ±s.e.m. spike amplitudes obtained from at least 3 separate cells at each buffer concentration. In the presence of EGTA increasing buffer led to a steady decrease in spike amplitude. In contrast a complex relationship of initial decline followed by variable amplitudes was observed in the presence of increasing BAPTA concentrations.
Figure 3. Graphs of spike frequency plotted against Ca2+ buffer concentration.
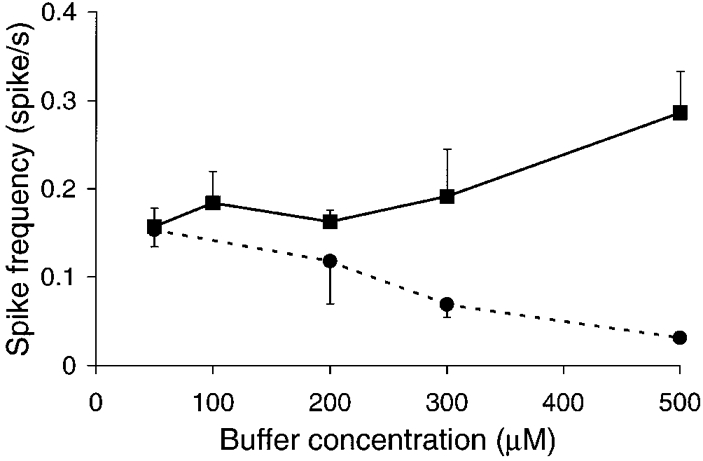
EGTA, ▪ and continuous line; BAPTA, • and dashed line. Spike frequency was measured independent of spike size. The minimum spike size measured was 10 pA. The graphs show divergent effects of the different buffers. Increasing concentrations of EGTA lead to an increase in spike frequency, whereas increasing concentrations of BAPTA lead to a decrease in spike frequency.
Figure 4. Graphs of average rate of current rise plotted against Ca2+ buffer concentration.
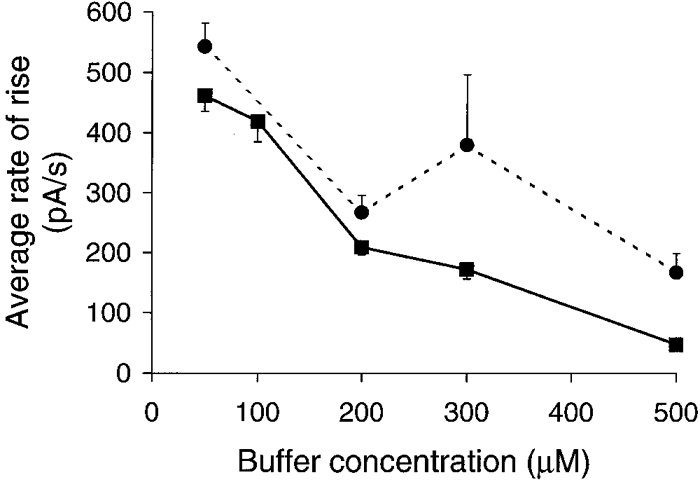
EGTA, ▪ and continuous line; BAPTA, • and dashed line. In both cases EGTA and BAPTA led to a decrease in the average rate of rise of the Cl(Ca) current signal.
With EGTA, the spike amplitude showed a dose-dependent decrease over the range of buffer concentrations used (Fig. 2, ▪). All points were significantly different from the control values taken at 10 or 50 μm EGTA (P < 0.001). Spike amplitude was a more complex function of the BAPTA concentration (Fig. 2, •). A significant (P < 0.001) drop in amplitude was observed when the BAPTA concentration was increased from 50 to 200 μm. However, further increases in concentration of the buffer failed to reduce the amplitude and in fact produced a small increase, although at all concentrations amplitudes were significantly smaller than at 50 μm BAPTA (P < 0.01). Spike amplitudes obtained with 300 and 500 μm EGTA and BAPTA were significantly different (P < 0.001).
Differences between EGTA and BAPTA effects were also observed when we measured spike frequency (Fig. 3). To determine spike frequency we simply counted the number of spikes, independent of spike amplitude. The very small spikes seen at the high EGTA concentrations (Fig. 2, ▪) were therefore included in this analysis. EGTA showed a general trend to increasing spike frequency at higher buffer concentrations (Fig. 3, ▪) while BAPTA showed the opposite trend. The spike frequencies obtained with EGTA were significantly greater than those obtained with BAPTA both at 300 μm (P < 0.06) and at 500 μm (P < 0.01).
The average rate of rise decreased with increasing concentrations of either EGTA or BAPTA (Fig. 4). The rates of rise were significantly faster in the presence of BAPTA than EGTA both at 300 μm (P < 0.001) and 500 μm (P < 0.001).
In summary, at the control (50 μm) and also at the lower concentrations (< 200 μm), the two buffers are not statistically different for any of our indices. However, the responses diverge as the buffer concentration is increased. Responses in the presence of 500 μm EGTA are typified by small high frequency spikes. On the other hand responses recorded in the presence of 500 μm BAPTA are characterised by larger, low-frequency monotonic spikes (see Fig. 10). To study the basis of the properties of the Cl(Ca) spikes at increasing buffer concentrations we looked more closely at the individual current spikes and also carried out Ca2+ imaging experiments.
Figure 10. Examples of current records obtained in the whole-cell patch clamp configuration with either 500 μm EGTA (A) or 500 μm BAPTA (B).
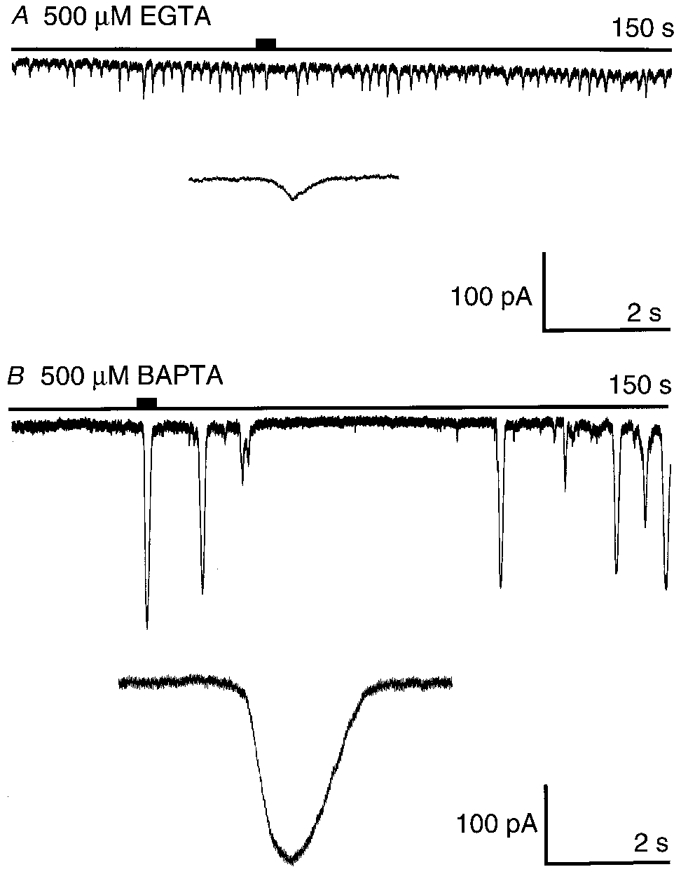
The typical high-frequency, low-amplitude spikes seen with EGTA are in contrast with the large-amplitude, low-frequency spikes seen in the presence of BAPTA. The long horizontal line indicates the zero current level. The short filled bar above the zero current line indicates the part of the record shown expanded below. The membrane potential was voltage clamped at −30 mV.
Low concentrations of Ca2+ buffer disrupt the Cl(Ca) spike activation phase and amplitude
The average rate of rise of the currents, even in the presence of low concentrations of Ca2+ buffers was relatively slow. We set out to test if this rate of rise was limited by the Ca2+ signal or by the activation of the Cl(Ca) current. We applied a rapid large step change in cytosolic Ca2+ by photolytic liberation of Ca2+ from DM-nitrophen. The amplitude of the Cl(Ca) current elicited by the Ca2+ step was comparable to that recorded during Ca2+ oscillations. However, the rate of rise was much faster (2354 ± 479 pA s−1, mean ±s.e.m., n = 4) than that of the InsP3-induced Cl(Ca) current spikes (462 ± 27 pA s−1 for EGTA, n = 87 spikes and 543 ± 39 pA s−1 for BAPTA, n = 69 spikes) indicating that the rate-limiting step in the activation of the Cl(Ca) currents is the Ca2+ signal (Fig. 5).
Figure 5. The rate of rise of the Cl(Ca) current signal closely follows the calcium signal.
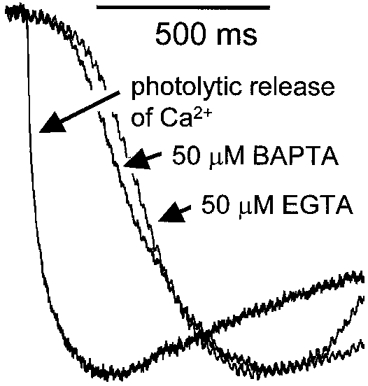
Examples of normalised current spikes in the presence of 50 μm BAPTA and EGTA are shown in the figure. The activation phase is monotonic and relatively slow (≈1 s to reach peak). The figure also shows the Cl(Ca) current response recorded in response to the rapid photolytic release of Ca2+ from DM-nitrophen. This experiment was conducted after the partial replacement of the extracellular monovalent cations with NMDG and the cells were voltage clamped at a membrane potential of −17 mV (the equilibrium potential for the remaining cations). For this reason the current amplitude was slightly smaller and therefore we have scaled the responses to their maxima. The figure shows the much more rapid initial activation phase observed in response to photolytic release of Ca2+ compared with the responses to Ins(2,4,5)P3.
The average rate of rise of the Cl(Ca) spikes was seen to decrease with increasing concentrations of both buffers (Fig. 4). In the control responses (at 10 and 50 μm buffer) the majority of spikes had a monotonic activation phase (Fig. 6A and B). The responses in the presence of 200 μm EGTA or BAPTA, however, were very different in appearance (Fig. 6C). Now instead of a smooth activation of the currents we frequently observed steps. These steps were of variable duration, and shape. Some appeared flat whereas others showed a decline, or near-complete recovery of the current. In our analysis we defined step events in the current activation phase as flat or decreasing currents of greater than 100 ms in duration. We determined that, by this definition, no more than three steps in the current activation phase were observed and the frequency of steps increased in a dose-dependent manner with buffer concentration (data not shown).
Figure 6. Examples of current spikes in the presence of 10, 50 and 200 μm EGTA.
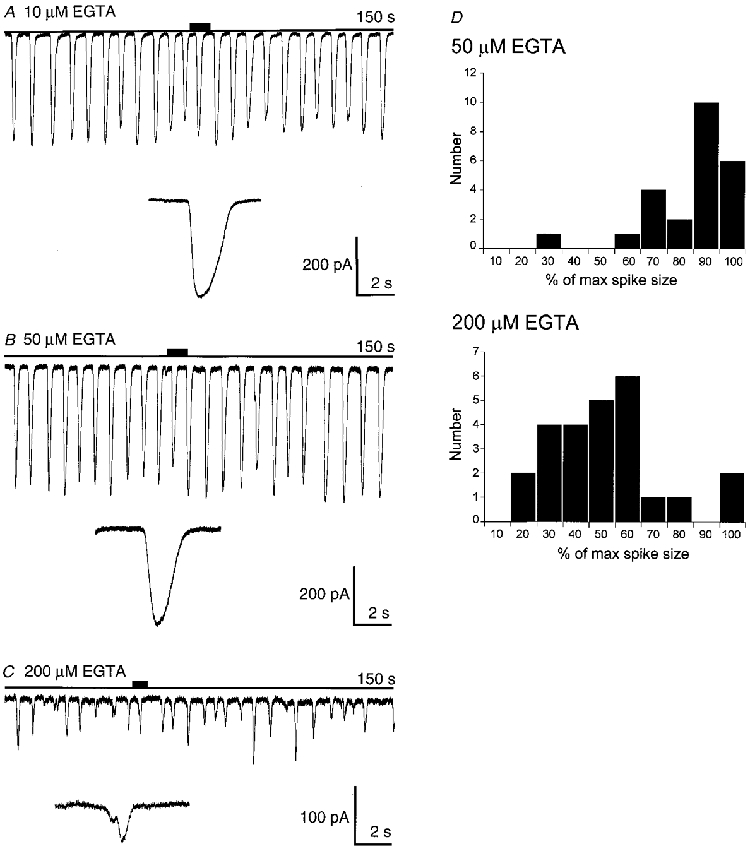
A-C, expanded traces correspond to the region of the record indicated by the short filled bar above the zero current line. At 200 μm EGTA a higher frequency of smaller events and the appearance of steps in the spike activation phase were observed (note the different amplitude scale). D, frequency-amplitude histograms drawn up from this dataset. At 50 μm EGTA there is a clustering of high amplitude events which contrasts with the spread of amplitudes seen at the higher Ca2+ buffer concentration.
In addition to an effect on the current activation phase we also observed an effect on the spread of the frequency- amplitude histogram of current amplitudes (Fig. 6D). With low concentrations of Ca2+ buffers the current amplitude- frequency histogram shows a clustering towards higher amplitudes. In contrast, in the presence of higher buffer concentrations the amplitude-frequency plots were spread wider. It is probable that at the lower buffer concentrations the Cl(Ca) current spike amplitude is saturated and this might account for the limited spread of amplitudes observed with 50 μm EGTA.
In summary, EGTA and BAPTA, at lower concentrations (< 200 μm), act in a similar manner to disrupt the activation phase of the spikes. Our data demonstrate at most three steps during the activation phase of the spike. With higher concentrations of EGTA, the higher frequency and presence of smaller amplitude spikes suggest autonomous activity of individual calcium release components that underlie the step events. However, with these data alone we cannot differentiate between a primary effect on the Ca2+ signal or an effect on the mechanism of the Cl(Ca) current response. To address this issue we turned to experiments where we could simultaneously measure the Ca2+ response and the resulting activation of Cl(Ca) currents.
Low concentrations of buffer slow the secretory pole Ca2+ response and reveal autonomous spatially discrete Ca2+ events
Previous experiments have shown a close correlation between InsP3-induced trains of Cl(Ca) current spikes and trains of secretory pole Ca2+ responses (Thorn et al. 1996). In this paper we set out to use low Ca2+ buffering and high-speed imaging to look closely at the Ca2+ signal during single Cl(Ca) current spikes.
Single mouse pancreatic acinar cells were whole-cell patch clamped with a KCl-rich intracellular solution containing 8–15 μm Ins(2,4,5)P3 and 40-50 μm Calcium Green as the Ca2+-reporting dye and as the only exogenous Ca2+ buffer. Immediately after breakthrough to the whole-cell configuration Cl(Ca) current spikes of about 2 s duration and 0.05 Hz frequency were observed at a holding potential of −30 mV. High temporal resolution (whole-frame capture at 77 Hz) Ca2+-imaging techniques were used to capture a series of 200 images over the duration of the rising phase of a Ca2+ spike (Fig. 7). Changes in fluorescence were expressed as a percentage of the average of the last 20 images in which no activity was seen in the Ca2+ signal. All experiments (n = 5, in this series) showed a Ca2+ increase restricted to the secretory pole region of the cell (identified by the presence of zymogen granules). The activation of the Cl(Ca) current closely followed this Ca2+ rise (compare ratio images (bottom) and Cl(Ca) spike (top)). In contrast to the good correlation between the activation phase of the current spike and the rising phase of the Ca2+ signal, the decay of the current occurred more rapidly than that of the Ca2+ signal.
Figure 7. The Ins(2,4,5)P3-induced Ca2+ spike response measured with Calcium Green in a single whole-cell patch clamped pancreatic acinar cell.
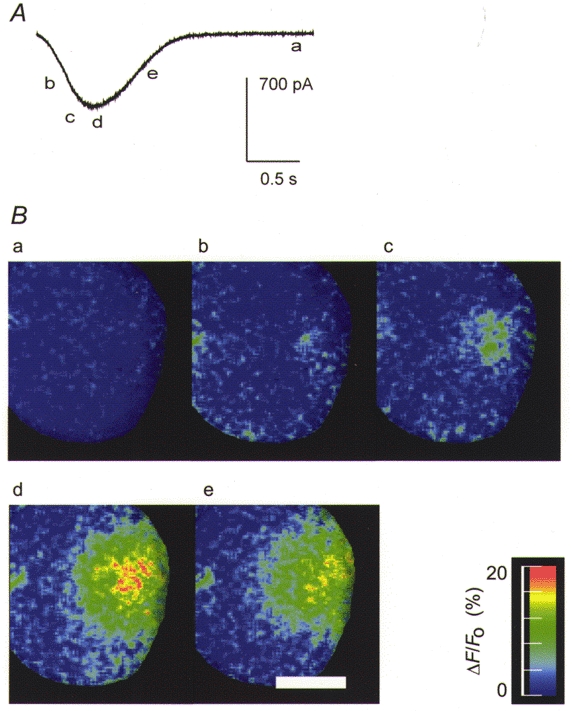
A, time course of the whole-cell current response. B, ΔF/Fo digital images at the points a-e in A. The response originates at a single spot and spreads rapidly through the secretory pole over the time course of the activation phase of the spike. It appears as if the current inactivates much more rapidly than the decay in the bulk cytosolic Ca2+. In support of this the time to reach half peak amplitude (t½) of the Ca2+ signal was 1.2 ± 0.24 s (mean ±s.e.m., n = 3), and of the current was 0.53 ± 0.07 s (mean ±s.e.m., n = 3, means significantly different, P < 0.05, Student's one-tailed t test). Scale bar, 10 μm.
Figure 8 illustrates a typical experiment (n = 8) where we simultaneously recorded the current spikes and the cytosolic Ca2+ signal from a single cell dialysed with 200 μm EGTA and 50 μm Calcium Green. The Cl(Ca) current records (Fig. 8A) were very similar to those recorded in the presence of EGTA alone (Fig. 6B) indicating that the additional presence of Calcium Green did not significantly alter the response. In the experiment shown in Fig. 8 we captured a single spike that showed steps in the current activation phase (n = 5 cells showed step events). Analysis of the images showed similar local Ca2+ responses to those in the control images. However, there is evidence for the Ca2+ signal spreading as a miniature wave travelling across the secretory pole region. This is not clear in the sequence of ratio images (Fig. 8B) but can be seen in the sequence of images where we subtracted preceding images from one another (Fig. 8B). These data suggest that Ca2+ buffers may be slowing the co-ordination of events and allowing us to visualise sequential recruitment of Ca2+ release from spatially separate sites.
Figure 8. An example of a spike Cl(Ca) current response and simultaneously recorded Ca2+ response measured with Calcium Green fluorescence induced by Ins(2,4,5)P3 in the presence of 200 μm EGTA.
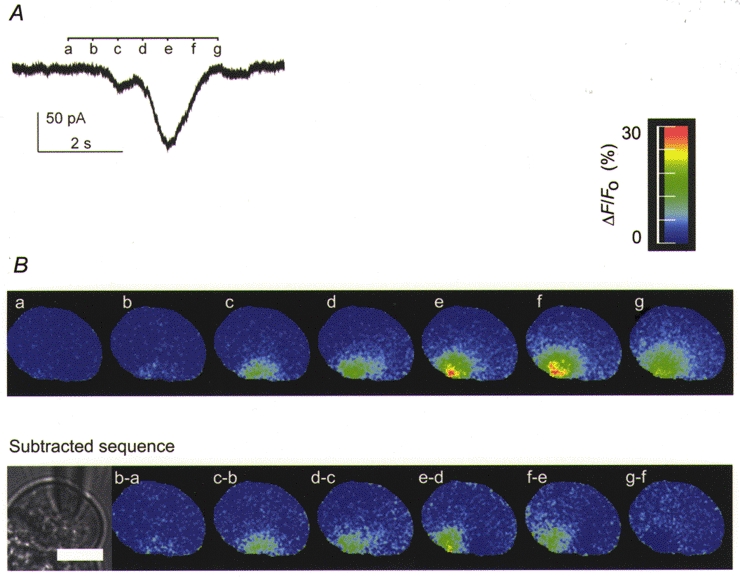
A, a single clear step is seen in the Cl(Ca) current activation phase. B, the series of fluorescence images (upper panel) show the Ca2+ signal at the time points indicated (a-g). The signal looks similar to that in control (Fig. 7) in terms of amplitude but has an additional slow spreading component. This is seen more clearly in the subtracted images (lower panel) where the change in Ca2+ response moves across the secretory pole in a right to left direction. In all of the data showing steps in the current activation phase, the analysed images were consistent with multiple components to the secretory pole response. A scale bar of 10 μm is shown on the black and white image of the cell.
In other cells (n = 4) we obtained images with a range of spike amplitudes and steps in the spikes (Fig. 9, Cl(Ca) current, upper trace). In contrast to the Cl(Ca) spikes and Ca2+ images obtained with low buffer (see Figs 6A, B and 7) the Ca2+ responses were highly heterogeneous. This supports the idea that the variability in spike amplitude seen in the current records with higher buffer concentrations (Fig. 6C) is due to variability in the underlying Ca2+ signal. This variability in the Ca2+ signal was apparently due to the activity of a small number of discrete Ca2+ release sites situated within the secretory pole region. In the record of Fig. 9 a single Ca2+ release site is active for two of the Ca2+-dependent current spikes (image c and image d). In addition, a spatially separate release site elicits a further Cl(Ca) current spike (image a). Futhermore it can be seen that during a larger Cl(Ca) current spike, multiple Ca2+ release sites are now recruited (image f). We conclude that under conditions of Ca2+ buffering the co-ordinating effect of released cytosolic Ca2+ is reduced. This leads to the appearance of discrete regions of Ca2+ release that now can act autonomously to trigger small Cl(Ca) current spikes.
Figure 9. An example of current records obtained under similar conditions (200 μm EGTA, 50 μm Calcium Green) to Fig. 8 but showing evidence of smaller Cl(Ca) current spikes.
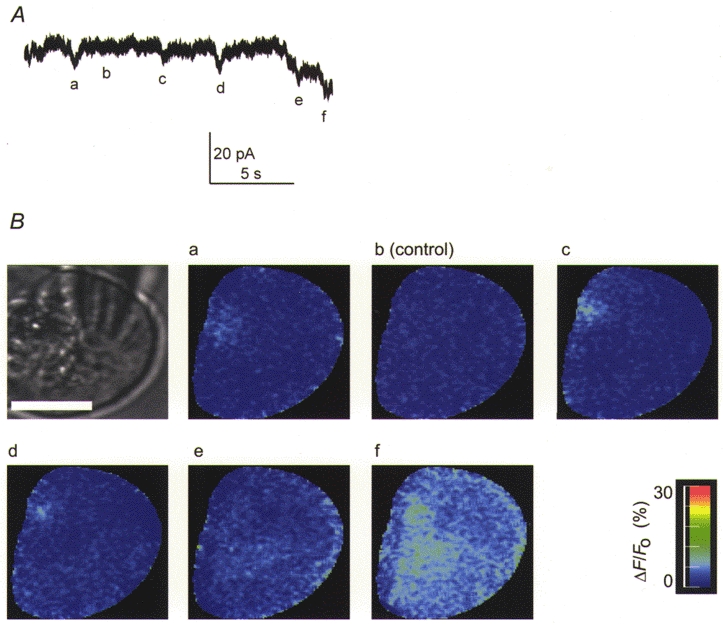
The whole-cell current records are shown in A and simultaneously recorded fluorescence images at the time points indicated (a-f) are shown in B. A scale bar representing 10 μm is shown on the black and white image of the cell. Any given series of images were limited in length by the memory limitations of the computer and image capture was triggered by the experimenter. In this example the first images and Cl(Ca) currents show evidence of spike activity. The ‘control’ image is therefore shown in b, where there is neither current nor fluorescence evidence for a response. Images c and d show a very small Ca2+ response in the same region of the cell (our spatial resolution for the centre of the Ca2+ response is 200 nm). In image a, an apparently smaller Ca2+ response in a different region of the cell gives rise to a larger Cl(Ca) current spike. Image e was taken at the peak of a larger Cl(Ca) current spike and shows a diffuse Ca2+ signal in a region distinct from the Ca2+ release sites of the previous images. Image f shows the Ca2+ response during a larger Cl(Ca) current response. The differences in amplitude of the Ca2+ signal may well be due to Ca2+ release events occurring in and out of the plane of focus. We therefore make no conclusions about the size of the Ca2+ release events. It is clear, however, that individual Cl(Ca) current spikes arise from spatially separate Ca2+ release events.
High concentrations of the fast Ca2+ buffer, BAPTA, give paradoxically large Cl(Ca) and Ca2+ responses
The divergent characteristics of the current spikes at high EGTA and BAPTA concentrations (Figs 2, 3 and 4) are typified by the current records shown in Fig. 10 and warranted further investigation. We carried out a series of control experiments to explore these effects. In the first set of experiments we set out to control for the possibility that the high buffer concentrations were lowering the resting free cytosolic Ca2+ levels. In order to do this we made up pipette solutions where the concentration of free cytosolic Ca2+ was adjusted to 50 nM (approximate resting levels). This would minimise the possibility that under whole-cell conditions the large amounts of calcium buffer in the pipette solution were imposing a low free Ca2+ concentration on the cell. The results obtained with 500 μm BAPTA or EGTA were very similar to those shown in Fig. 10 (data not shown). This indicates that the effects are not due to a difference in the effectiveness of the two buffers in lowering free Ca2+ levels. In the second set of control experiments we set out to determine the possible effects of these buffers as antagonists at the InsP3 receptor (Richardson & Taylor, 1993; Combettes et al. 1994). There is some evidence that BAPTA acts as a higher affinity antagonist than EGTA (Richardson & Taylor, 1993). If this was the basis of the difference between the buffers then increasing the InsP3 concentration in the BAPTA experiments should produce a response similar to that obtained with EGTA. However, experiments were conducted with 20 μm InsP3 and these failed to produce EGTA-like responses (n = 3, data not shown). The relatively large amplitude of the spikes was retained and only the frequency increased, as might be expected on the basis of previous work (Petersen et al. 1991). We can conclude that, although antagonism of the InsP3 receptor may account for some of the divergence of the effects of BAPTA and EGTA it does not explain the larger amplitude of the Cl(Ca) current spikes obtained in the presence of BAPTA.
To determine the effect of BAPTA on the Ca2+ signal we carried out further imaging experiments. Figure 11 shows a single, large current spike obtained in the presence of 450 μm BAPTA and 50 μm Calcium Green (n = 4 spikes). The Ca2+ response looks very similar to that of the controls in the presence of Calcium Green alone (Fig. 7), even though the buffer power in the cytosol is much greater (50 μm Calcium Green compared with 450 μm BAPTA + 50 μm Calcium Green). This indicates that the amount of Ca2+ released into the cytosol must be much greater.
Figure 11. A single Cl(Ca) current spike (A) recorded in the presence of 500 μm BAPTA, and simultaneously captured fluorescence imaging data (B).
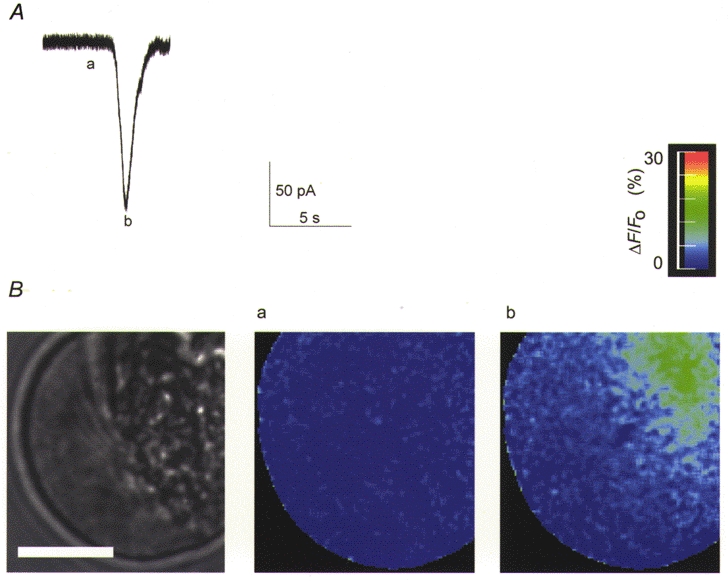
The current is of large amplitude and the Ca2+ response shows a Ca2+ change very similar to that in the control (Fig. 7). This is despite the large increase in buffering power of the cytosol and indicates an increase in the amount of Ca2+ released. The scale bar on the black and white image of the cell represents 10 μm.
We conclude that the Cl(Ca) current spikes observed at high BAPTA concentrations are correlated with a change in the Ca2+ signal characterised by a large Ca2+ release event.
DISCUSSION
Our studies on InsP3-induced Ca2+ and Cl(Ca) spikes are the first to systematically investigate the role of Ca2+ feedback in shaping an in vivo oscillatory response involving InsP3 receptors. They have shed light on the role of Ca2+ feedback in the initial spread of the Ca2+ signal during the rising phase of the spike and the local role of Ca2+ in the termination of Ca2+ spikes. Ca2+ buffers slow the rate of rise of a Ca2+signal, dissipate Ca2+ gradients and partition Ca2+ to reduce the free Ca2+concentration (Stern, 1992; Wang & Thompson, 1995; Horne & Meyer, 1997). High concentrations of buffer have been shown not to significantly affect calcium uptake by endoplasmic reticulum Ca2+ pumps (Mogami et al. 1998) or calcium extrusion by plasma membrane Ca2+ pumps (Zhang & Muallem, 1992). As a result of these actions we would expect Ca2+ buffers to interfere with any processes that rely on passive Ca2+ movement. These processes would include a potential communication in the cytosol between spatially separate clusters of InsP3 receptors. Our observations, with the slow on-rate buffer, EGTA, are consistent with such a mechanism of inter-site communication acting to co-ordinate spatially discrete Ca2+ release events by a process of CICR. A fast on-rate buffer like BAPTA has a much shorter range of action and therefore would be anticipated to act on Ca2+-dependent mechanisms in the local vicinity of the InsP3 receptor. Our results demonstrate that the InsP3-induced oscillations are transformed in the presence of high concentrations of BAPTA in a manner consistent with an effect on reducing Ca2+-dependent inactivation at the InsP3 receptors.
Long-range action of Ca2+ in co-ordinating the spike rising phase
In the presence of increasing concentrations of EGTA we observe a disruption in the activation phase of the Ins(2,4,5)P3-induced Cl(Ca) current spikes and the recruitment of spatially separate Ca2+ release sites. In contrast the Cl(Ca) current response to an ‘instantaneous’ step change in Ca2+, as produced by photolytic liberation of Ca2+, has a rapid monotonic activation. At low buffer concentrations the Ins(2,4,5)P3-induced Cl(Ca) current response is slower but also shows a monotonic rise. These observations suggest that the activation phase of the Cl(Ca) current spike is governed by a co-ordinated cytosolic Ca2+ signal that becomes progressively more disrupted with increasing buffer concentrations. Fluorescence images did show evidence for Ca2+ waves across the secretory pole, in the presence of higher EGTA (Fig. 8), which were not seen in fluorescence images captured from cells not dialysed with high concentrations of EGTA (Fig. 7). In addition to effects on the activation phase of the spikes, with higher EGTA concentrations, we also saw the appearance of small-amplitude Cl(Ca) spikes (Fig. 9). On the basis of Ca2+ buffer acting to sequester cytosolic Ca2+, smaller-amplitude Ca2+ responses would be predicted. However, observations on the Ca2+ signal were not consistent with a simple reduction in cytosolic Ca2+. Instead the images reveal the activity of autonomous, spatially separate Ca2+ release events (Fig. 9). Most of these discrete Ca2+ release events were associated with the activation of small Cl(Ca) current spikes. We observed at most three separate Ca2+ release sites in the secretory pole and the separation of these sites, approximately 2–4 μm, was consistent with the calculated range of length constants for EGTA action (see Appendix).
We conclude that the action of EGTA on the InsP3-induced Ca2+ spikes can be explained by the disruption of Ca2+-dependent communication between spatially discrete Ca2+ release sites in the secretory pole of acinar cells. At low buffer concentrations, and presumably endogenously, CICR acts as a co-ordinating signal to produce an ensemble Ca2+ spike in the secretory pole. In this model, a single Ca2+ release site might act to entrain Ca2+ release from its neighbours. In fact, recordings obtained over long time durations, where many InsP3-evoked spikes were recorded, did show evidence for a single highly active discrete Ca2+ release site (Thorn et al. 1996). At higher EGTA concentrations the buffer sequesters released Ca2+ and co-ordination between individual release sites is disrupted. This leads to the appearance of steps in the spike activation phase and also, particularly at the highest EGTA concentrations, gives rise to autonomous Ca2+ release activity from each spatially separate release site. Consistent with this interpretation is the observed trend for an increase in spike frequency with increasing EGTA concentrations. This would be expected if each discrete region was capable of independent Ca2+ release but was now liberated from the entraining action of an adjacent Ca2+ release site.
The effects of higher BAPTA concentrations are, at first sight, paradoxical. The large Cl(Ca) current spikes and the large, co-ordinated Ca2+ responses, are not consistent with the anticipated effect of sequestration of the Ca2+ signal by BAPTA. In addition, BAPTA has been shown to antagonise InsP3 binding to its receptor, which would be expected to further decrease Ca2+ release (Richardson & Taylor, 1993; Combettes et al. 1994). In fact, the observation of roughly the same Ca2+ rise, as measured by Calcium Green, in the presence of 50 and 450 μm BAPTA indicates that the amount of Ca2+ released has increased considerably. Similar effects of BAPTA have previously been observed and proposed to be due to an action at the Ca2+-dependent inactivation site of the InsP3 receptor (Zhang & Muallem, 1992). These experiments demonstrated that after loading acinar cells via the acetoxymethyl ester of BAPTA, the cytosolic Ca2+ signal was abolished but Ca2+ extrusion was still observed. It was concluded that BAPTA was affecting the mechanism of inactivation of Ca2+ release (Zhang & Muallem, 1992). In our experiments we propose that BAPTA is reducing the local Ca2+ concentration at the inactivation site of the InsP3 receptor, thus limiting inactivation and allowing greater Ca2+ release. We can still see a Ca2+ signal in the presence of BAPTA and therefore the inactivation site must have a lower Ca2+ affinity than the activation site and our BAPTA concentration is not sufficient to affect the Ca2+-dependent activation site. This is supported by direct measurement of a high-affinity activation site (Kdμ200 nM) and a low-affinity inactivation site (Kdμ4 μm) (Dufour et al. 1997). In a thorough study of the Ca2+ dependence of InsP3 receptor activation, Mak et al. (1998) have shown a Kd for activation of 210 nM Ca2+ and a Kd for inactivation, at InsP3 concentrations of between 0.1 and 180 μm, of μ50 μm Ca2+. Such a large concentration range between the Kd values for activation and inactivation are consistent with our findings of BAPTA action. On the basis of the length constants of BAPTA action we estimate that the Ca2+-dependent inactivation site is approximately 40 nm from the release site. This is within molecular dimensions but does not allow us to discriminate between an effect on a single InsP3 receptor or effects on a closely clustered group of InsP3 receptors.
In addition to effects on Ca2+ release, BAPTA may exert other effects. A number of studies, in different cell types, have shown that mitochondria can be closely localised with the endoplasmic reticulum and take up released Ca2+ (Rizzuto et al. 1998; Csordás et al. 1999). In our experiments BAPTA buffering of released Ca2+ may act to compete with this mitochondrial Ca2+ uptake. The consequences of this possible depletion of mitochondrial Ca2+ on the Ca2+ signal are unknown but are likely to be delayed compared with the rising phase of the Ca2+ spike (Boitier et al. 1999). In addition, our use of whole-cell patch clamp effectively maintains the intracellular ATP concentration independent of mitochondrial function.
We conclude that, across the concentration range we used, BAPTA has two main effects on the Ca2+ signal. At higher concentrations BAPTA predominantly acts to relieve Ca2+-dependent inhibition at the InsP3 receptors. At low concentrations the predominant effect is a reduction in release site to release site communication, although we would anticipate some effects on relief of Ca2+-dependent inhibition too. The potential dual effect of BAPTA, at lower concentrations, makes interpretation of these data difficult. Below 200 μm, BAPTA and EGTA effects were not significantly different from each other. This may reflect similar action; on the other hand, the similarity may be a fortuitous summation of the two BAPTA effects. The striking contrast between EGTA and BAPTA effects at higher buffer concentrations, however, does point to a single dominant action of BAPTA in reducing Ca2+-dependent inactivation.
Density of Ca2+ release sites in the secretory pole
The imaging experiments in the presence of EGTA are consistent with μ2 μm spatial separation of the discrete Ca2+ release sites in the secretory pole. This density of release sites is much greater than that described for ‘puffs’ in HeLa cells (majority of cells show only 1 site; Bootman et al. 1997) but is similar to that measured in Xenopus oocytes (μ3 μm; Callamaras et al. 1998), for RBL cells (μ2 μm; Horne & Meyer, 1997) and neuroblastoma cells (Wang & Thompson, 1995).
In the acinar cells the high density of Ca2+ release sites is probably due to specialisation in the secretory pole region. One such specialisation is the presence of zymogen granules, which may (Gerasimenko et al. 1996) or may not be the source (store) of the cytosolic Ca2+ signal (Yule et al. 1997). Independent of the Ca2+ storage organelle, recent work has shown the localisation of all three isoforms of the InsP3 receptor to the secretory pole (Lee et al. 1997).
Cl(Ca) current response to Ca2+ signal
The Cl(Ca) current spikes showed a maximum of three steps in the activation phase and we never observed more than three discrete sites of Ca2+ release in the secretory pole region. This suggests that, under control conditions, the co-ordinated release from three sites gives rise to the activation of the Cl(Ca) current spike. Based on the maximum amplitude of the Cl(Ca) current spike and an estimate of single channel conductance of μ2 pS (Zdebik et al. 1997) we estimate that each Cl(Ca) current spike is due to the opening of μ5000 Cl− channels.
We have observations, but no direct information, on the Ca2+ signal the Cl(Ca) channels are responding to. It has been suggested that for Xenopus oocyte Cl(Ca) channels, the response correlates better with the rate of rise of the Ca2+ signal rather than steady-state levels (Parker & Yao, 1994). The authors also showed current inactivation, even in the presence of a sustained Ca2+ signal. However, in the same tissue Gomez-Hernandez et al. (1997) showed that in isolated inside-out patches there is no indication of channel closure in the continued presence of high Ca2+. In other acinar cell types it has been shown that a Cl(Ca) current can be activated by steady-state changes in cytosolic Ca2+ (Randriamampita et al. 1988; Arreola et al. 1996). Our experiments do not address this issue; however, it is clear that the activation phase of the current is entrained by the Ca2+ signal (see Fig. 5). It is also evident that the Cl(Ca) current declines even in the presence of elevated cytosolic Ca2+ (Figs 7 and 8).
Further work will be required to identify the nature of the relationship between the Ca2+ signal and the activation of the Cl(Ca) current. In addition, although our work indicates that Ca2+ feedback plays a crucial role in shaping the acinar cell Ca2+ oscillations, the basis of the regional specialisation of Ca2+ release mechanisms in the secretory pole remains unclear.
Acknowledgments
This work was supported by The Wellcome Trust (Biomedical Research Collaboration Grant to P.T. and R.A.T.), the Medical Research Council (Project Grant to P.T. and Dr T. R. Cheek) and The Royal Society (Project Grant to P.T.) and the National Science Foundation (grants DBI-9200027 and DBI-9724611). J.F.K. is in receipt of a Biotechnological and Biological Sciences Research Council Studentship.
APPENDIX
Calculation of the length constants for the concentrations of EGTA and BAPTA
The following describes how the length constants were calculated for the range of buffer concentrations that we used. All calculations are based on Stern (1992). Free Ca2+ around the channel pore is expected to fall exponentially with a dependence on Ca2+ buffer action. The simplified equation for the length constant of the buffer described by Stern (1992) is:
| (A1) |
where λ is the length constant, W =K1½ and
 |
Dx, De and Dex represent the diffusion coefficients for calcium, buffer and calcium-bound buffer, respectively. All are taken here to equal 1 × 10⁻⁹ m2 s−1.
k+ is the association rate constant of the buffer for calcium, assumed to be 1.5 × 10⁶ M−1 s−1 for EGTA and 1.7 × 10⁹ M−1 s−1 for BAPTA.
k- is the dissociation constant of calcium from the buffer, taken as Kd×k+, where the Kd values of EGTA and BAPTA for calcium were taken to be 1.58 × 10⁻⁷ and 1.8 × 10⁻⁷ M, respectively.
X0 is resting cytosolic free calcium concentration taken to be 50 nM.
Etot is the total buffer concentration.
We observed the appearance of discrete steps in the activation phase of the current spike between 50 and 200 μm EGTA. Using these concentrations of buffering, eqn (A1) gives length constants of between 4.1 and 2 μm.
The calculated length constant of BAPTA action in our observations of the effect of 500 μm BAPTA (Fig. 11) was 40 nm.
References
- Arreola J, Melvin JE, Begenisich T. Activation of calcium-dependent chloride channels in rat parotid acinar cells. Journal of General Physiology. 1996;108:35–47. doi: 10.1085/jgp.108.1.35. [DOI] [PMC free article] [PubMed] [Google Scholar]
- Berridge MJ, Dupont G. Spatial and temporal signalling by calcium. Current Opinion in Cell Biology. 1994;6:267–274. doi: 10.1016/0955-0674(94)90146-5. [DOI] [PubMed] [Google Scholar]
- Bezprozvanny I, Watras J, Ehrlich BE. Bell-shaped calcium-response curves of Ins(1,4,5)P3- and calcium-gated channels from endoplasmic reticulum of cerebellum. Nature. 1991;351:751–754. doi: 10.1038/351751a0. [DOI] [PubMed] [Google Scholar]
- Boitier E, Rea R, Duchen MR. Mitochondria exert a negative feedback on the propagation of intracellular Ca2+ waves in rat cortical astrocytes. Journal of Cell Biology. 1999;145:795–808. doi: 10.1083/jcb.145.4.795. [DOI] [PMC free article] [PubMed] [Google Scholar]
- Bootman MD, Berridge MJ, Lipp P. Cooking with calcium: the recipes for composing global signals from elementary events. Cell. 1997;91:367–373. doi: 10.1016/s0092-8674(00)80420-1. [DOI] [PubMed] [Google Scholar]
- Callamaras N, Marchant JS, Sun XP, Parker I. Activation and co-ordination of InsP3-mediated elementary Ca2+ events during global Ca2+ signals in Xenopus oocytes. The Journal of Physiology. 1998;509:81–91. doi: 10.1111/j.1469-7793.1998.081bo.x. [DOI] [PMC free article] [PubMed] [Google Scholar]
- Carter TD, Ogden D. Kinetics of Ca2+ release by InsP3 in pig single aortic endothelial cells: evidence for an inhibitory role of cytosolic Ca2+ in regulating hormonally evoked Ca2+ spikes. The Journal of Physiology. 1997;504:17–33. doi: 10.1111/j.1469-7793.1997.00017.x. [DOI] [PMC free article] [PubMed] [Google Scholar]
- Combettes L, Hannaert-Merah Z, Coquil JF, Rousseau C, Claret M, Swillens S, Champeil P. Rapid filtration studies of the effect of cytosolic Ca2+ on inositol 1,4,5-trisphosphate-induced 45Ca2+ release from cerebellar microsomes. Journal of Biological Chemistry. 1994;269:17561–17571. [PubMed] [Google Scholar]
- Csordás G, Thomas AP, Hajnóczky G. Quasi-synaptic calcium signal transmission between endoplasmic reticulum and mitochondria. EMBO Journal. 1999;18:96–108. doi: 10.1093/emboj/18.1.96. [DOI] [PMC free article] [PubMed] [Google Scholar]
- DeLisle S, Krause KH, Denning G, Potter BV, Welsh MJ. Effect of inositol trisphosphate and calcium on oscillating elevations of intracellular calcium in Xenopus oocytes. Journal of Biological Chemistry. 1990;265:11726–11730. [PubMed] [Google Scholar]
- Dufour JF, Arias IM, Turner TJ. Inositol 1,4,5-trisphosphate and calcium regulate the calcium channel function of the hepatic inositol 1,4,5-trisphosphate receptor. Journal of Biological Chemistry. 1997;272:2675–2681. doi: 10.1074/jbc.272.5.2675. [DOI] [PubMed] [Google Scholar]
- Finch EA, Turner TJ, Goldin SM. Calcium as a coagonist of inositol 1,4,5-trisphosphate-induced calcium release. Science. 1991;252:443–446. doi: 10.1126/science.2017683. [DOI] [PubMed] [Google Scholar]
- Gerasimenko OV, Gerasimenko JV, Belan PV, Petersen OH. Inositol trisphosphate and cyclic ADP-ribose-mediated release of Ca2+ from single isolated pancreatic zymogen granules. Cell. 1996;84:473–480. doi: 10.1016/s0092-8674(00)81292-1. [DOI] [PubMed] [Google Scholar]
- Gomez-Hernandez JM, Stuhmer W, Parekh AB. Calcium dependence and distribution of calcium-activated chloride channels in Xenopus oocytes. The Journal of Physiology. 1997;502:569–574. doi: 10.1111/j.1469-7793.1997.569bj.x. [DOI] [PMC free article] [PubMed] [Google Scholar]
- Greger R. The membrane transporters regulating epithelial NaCl secretion. Pflügers Archiv. 1996;432:579–588. doi: 10.1007/s004240050173. [DOI] [PubMed] [Google Scholar]
- Hamill OP, Marty A, Neher E, Sakmann B, Sigworth FJ. Improved patch-clamp techniques for high-resolution current recording from cells and cell-free membrane patches. Pflügers Archiv. 1981;391:85–100. doi: 10.1007/BF00656997. [DOI] [PubMed] [Google Scholar]
- Hirose K, Kadowaki S, Iino M. Allosteric regulation by cytoplasmic Ca2+ and IP3 of the gating of IP3 receptors in permeabilized guinea-pig vascular smooth muscle cells. The Journal of Physiology. 1998;506:407–414. doi: 10.1111/j.1469-7793.1998.407bw.x. [DOI] [PMC free article] [PubMed] [Google Scholar]
- Horne JH, Meyer T. Elementary calcium-release units induced by inositol trisphosphate. Science. 1997;276:1690–1693. doi: 10.1126/science.276.5319.1690. [DOI] [PubMed] [Google Scholar]
- Iino M, Endo M. Calcium-dependent immediate feedback control of inositol 1,4,5-triphosphate-induced Ca2+ release. Nature. 1992;360:76–78. doi: 10.1038/360076a0. [DOI] [PubMed] [Google Scholar]
- Iino M, Tsukioka M. Feedback control of inositol trisphosphate signalling by calcium. Molecular and Cellular Endocrinology. 1994;98:141–146. doi: 10.1016/0303-7207(94)90132-5. [DOI] [PubMed] [Google Scholar]
- Ilyin V, Parker I. Role of cytosolic Ca2+ in inhibition of InsP3-evoked Ca2+ release in Xenopus oocytes. The Journal of Physiology. 1994;477:503–509. doi: 10.1113/jphysiol.1994.sp020211. [DOI] [PMC free article] [PubMed] [Google Scholar]
- Ito K, Miyashita Y, Kasai H. Micromolar and submicromolar Ca2+ spikes regulating distinct cellular functions in pancreatic acinar cells. EMBO Journal. 1997;16:242–251. doi: 10.1093/emboj/16.2.242. [DOI] [PMC free article] [PubMed] [Google Scholar]
- Kasai H, Augustine GJ. Cytosolic Ca2+ gradients triggering unidirectional fluid secretion from exocrine pancreas. Nature. 1990;348:735–738. doi: 10.1038/348735a0. [DOI] [PubMed] [Google Scholar]
- Lee MG, Xu X, Zeng W, Diaz J, Wojcikiewicz RJ, Kuo TH, Wuytack F, Racymaekers L, Muallem S. Polarized expression of Ca2+ channels in pancreatic and salivary gland cells. Correlation with initiation and propagation of [Ca2+]i waves. Journal of Biological Chemistry. 1997;272:15765–15770. doi: 10.1074/jbc.272.25.15765. [DOI] [PubMed] [Google Scholar]
- Mak DO, McBride S, Foskett JK. Inositol 1,4,5-tris-phosphate activation of inositol tris-phosphate receptor Ca2+ channel by ligand tuning of Ca2+ inhibition. Proceedings of the National Academy of Sciences of the USA. 1998;95:15821–15825. doi: 10.1073/pnas.95.26.15821. [DOI] [PMC free article] [PubMed] [Google Scholar]
- Marchant JS, Taylor CW. Cooperative activation of IP3 receptors by sequential binding of IP3 and Ca2+ safeguards against spontaneous activity. Current Biology. 1997;7:510–518. doi: 10.1016/s0960-9822(06)00222-3. [DOI] [PubMed] [Google Scholar]
- Mogami H, Tepikin AV, Petersen OH. Termination of cytosolic Ca2+ signals: Ca2+ reuptake into intracellular stores is regulated by the free Ca2+ concentration in the store lumen. EMBO Journal. 1998;17:435–442. doi: 10.1093/emboj/17.2.435. [DOI] [PMC free article] [PubMed] [Google Scholar]
- Oancea E, Meyer T. Reversible desensitization of inositol trisphosphate-induced calcium release provides a mechanism for repetitive calcium spikes. Journal of Biological Chemistry. 1996;271:17253–17260. doi: 10.1074/jbc.271.29.17253. [DOI] [PubMed] [Google Scholar]
- Ogden D, Capiod T. Regulation of Ca2+ release by InsP3 in single guinea pig hepatocytes and rat Purkinje neurons. Journal of General Physiology. 1997;109:741–756. doi: 10.1085/jgp.109.6.741. [DOI] [PMC free article] [PubMed] [Google Scholar]
- Parker I, Ivorra I. Inhibition by Ca2+ of inositol trisphosphate-mediated Ca2+ liberation: a possible mechanism for oscillatory release of Ca2+ Proceedings of the National Academy of Sciences of the USA. 1990;87:260–264. doi: 10.1073/pnas.87.1.260. [DOI] [PMC free article] [PubMed] [Google Scholar]
- Parker I, Yao Y. Relation between intracellular Ca2+ signals and Ca(2+)-activated Cl− current in Xenopus oocytes. Cell Calcium. 1994;15:276–288. doi: 10.1016/0143-4160(94)90067-1. [DOI] [PubMed] [Google Scholar]
- Payne R, Flores TM, Fein A. Feedback inhibition by calcium limits the release of calcium by inositol trisphosphate in Limulus ventral photoreceptors. Neuron. 1990;4:547–555. doi: 10.1016/0896-6273(90)90112-s. [DOI] [PubMed] [Google Scholar]
- Petersen CC, Toescu EC, Petersen OH. Different patterns of receptor-activated cytoplasmic Ca2+ oscillations in single pancreatic acinar cells: dependence on receptor type, agonist concentration and intracellular Ca2+ buffering. EMBO Journal. 1991;10:527–533. doi: 10.1002/j.1460-2075.1991.tb07979.x. [DOI] [PMC free article] [PubMed] [Google Scholar]
- Randriamampita C, Chanson M, Trautmann A. Calcium and secretagogues-induced conductances in rat exocrine pancreas. Pflügers Archiv. 1988;411:53–57. doi: 10.1007/BF00581646. [DOI] [PubMed] [Google Scholar]
- Richardson A, Taylor CW. Effects of Ca2+ chelators on purified inositol 1,4,5-trisphosphate (InsP3) receptors and InsP3-stimulated Ca2+ mobilization. Journal of Biological Chemistry. 1993;268:11528–11533. [PubMed] [Google Scholar]
- Rizzuto R, Pinton P, Carrington W, Fay FS, Fogarty KE, Lifshitz LM, Tuft RA, Pozzan T. Close contacts with the endoplasmic reticulum as determinants of mitochondrial Ca2+ responses. Science. 1998;280:1763–1766. doi: 10.1126/science.280.5370.1763. [DOI] [PubMed] [Google Scholar]
- Stern MD. Buffering of calcium in the vicinity of a channel pore. Cell Calcium. 1992;13:183–192. doi: 10.1016/0143-4160(92)90046-u. [DOI] [PubMed] [Google Scholar]
- Thorn P, Gerasimenko O, Petersen OH. Cyclic ADP-ribose regulation of ryanodine receptors involved in agonist evoked cytosolic Ca2+ oscillations in pancreatic acinar cells. EMBO Journal. 1994;13:2038–2043. doi: 10.1002/j.1460-2075.1994.tb06478.x. [DOI] [PMC free article] [PubMed] [Google Scholar]
- Thorn P, Lawrie AM, Smith PM, Gallacher DV, Petersen OH. Local and global cytosolic Ca2+ oscillations in exocrine cells evoked by agonists and inositol trisphosphate. Cell. 1993;74:661–668. doi: 10.1016/0092-8674(93)90513-p. [DOI] [PubMed] [Google Scholar]
- Thorn P, Moreton R, Berridge M. Multiple, coordinated Ca2+-release events underlie the inositol trisphosphate-induced local Ca2+ spikes in mouse pancreatic acinar cells. EMBO Journal. 1996;15:999–1003. [PMC free article] [PubMed] [Google Scholar]
- Thorn P, Petersen OH. Activation of nonselective cation channels by physiological cholecystokinin concentrations in mouse pancreatic acinar cells. Journal of General Physiology. 1992;100:11–25. doi: 10.1085/jgp.100.1.11. [DOI] [PMC free article] [PubMed] [Google Scholar]
- Wakui M, Petersen OH. Cytoplasmic Ca2+ oscillations evoked by acetylcholine or intracellular infusion of inositol trisphosphate or Ca2+ can be inhibited by internal Ca2+ FEBS Letters. 1990;263:206–208. doi: 10.1016/0014-5793(90)81374-w. [DOI] [PubMed] [Google Scholar]
- Wang SS, Thompson SH. Local positive feedback by calcium in the propagation of intracellular calcium waves. Biophysical Journal. 1995;69:1683–1697. doi: 10.1016/S0006-3495(95)80086-X. [DOI] [PMC free article] [PubMed] [Google Scholar]
- Yao Y, Parker I. Potentiation of inositol trisphosphate-induced Ca2+ mobilization in Xenopus oocytes by cytosolic Ca2+ The Journal of Physiology. 1992;458:319–338. doi: 10.1113/jphysiol.1992.sp019420. [DOI] [PMC free article] [PubMed] [Google Scholar]
- Yule DI, Ernst SA, Ohnishi H, Wojcikiewicz RJ. Evidence that zymogen granules are not a physiologically relevant calcium pool. Defining the distribution of inositol 1,4,5-trisphosphate receptors in pancreatic acinar cells. Journal of Biological Chemistry. 1997;272:9093–9098. doi: 10.1074/jbc.272.14.9093. [DOI] [PubMed] [Google Scholar]
- Zdebik A, Hug MJ, Greger R. Chloride channels in the luminal membrane of rat pancreatic acini. Pflügers Archiv. 1997;434:188–194. doi: 10.1007/s004240050382. [DOI] [PubMed] [Google Scholar]
- Zhang BX, Muallem S. Feedback inhibition of Ca2+ release by Ca2+ is the underlying mechanism of agonist-evoked intracellular Ca2+ oscillations in pancreatic acinar cells. Journal of Biological Chemistry. 1992;267:24387–24393. [PubMed] [Google Scholar]