

Abstract
Numerous cellular and molecular perturbations have been studied to elucidate the pathogenic mechanisms underlying nephrotic-range proteinuria, which may in turn shed light on disease-specific mechanisms. We have analyzed the publicly available data from the PhysGen partial panel of consomic rats to determine whether there are quantitative trait loci that associate with nephrotic-range proteinuria. As of this writing, consomic rat strains subjected to the renal protocol have been bred by the Program for Genomic Applications for 15 of the 22 rat chromosomes for both genders, predominantly with the Brown–Norway (BN) and Dahl salt-sensitive (SS) strains as parents. We defined chromosomes of interest as consomic SS-xBN strains whose phenotype measurements differed significantly from SS but not BN strains, stratified by gender. We filtered and clustered differentially expressed genes by function in renal tissue from relevant strains. Proteinuria was significantly higher in male SS vs. male SS-18BN, and it was significantly higher in male SS vs. female SS. Functional clustering of differentially expressed genes yielded two specific functional clusters: apoptosis (p=0.022) and angiogenesis (p=0.046). Gene expression profiles demonstrated differential expression of apoptotic and angiogenic genes. However, TUNEL stains of renal tissue showed no significant difference in the number of apoptotic nuclei. We conclude that chromosomes 18 and X are quantitative trait loci for nephrotic-range proteinuria in rats.
Keywords: Proteinuria, Quantitative trait locus, Consomic rats, Nephrotic syndrome
Introduction
Nephrotic-range proteinuria is the primary manifestation of nephrotic syndrome, the most common glomerular disease in children and the most common acquired disease causing pediatric end-stage renal disease (ESRD), accounting for approximately 15% of pediatric ESRD in North America [1]. The pathophysiology of nephrotic-range proteinuria in the setting of nephrotic syndrome and posttransplant recurrence of nephrotic syndrome has been associated with altered T cell subsets, circulating permeability factors, seven interleukins/interleukin receptors, interferon-γ, transforming growth factor-β, vascular endothelial growth factor, nuclear factor κ-B (NFκB), tumor necrosis factor-α, α-actinin-4, nephrin, and podocin (reviewed in [2]). Therefore, the pathophysiology of proteinuria in the setting of progressive glomerular disease is arguably multigenic.
Understanding multigenic pathophysiologic mechanisms such as those underlying proteinuria is a difficult task. To this end, the Program for Genomic Applications (PGA) has bred consomic rats to provide chromosome-specific animal models [3, 4]. These rats’ chromosomes are homologs of one parent, except for a single chromosome that is a homolog of the other parent. A different strain can be bred for each chromosome of interest, thus creating a “panel” of consomic animals. Phenotype and genomic studies of these rats and their parents, performed by PGA and made publicly available, provide an opportunity to single out which chromosomes are loci that are potentially involved in a quantifiable trait of interest, thus providing a resource to discover quantitative trait loci (QTL). QTL provide valuable information regarding the genetic loci underlying complex “continuous” traits such as blood pressure [5, 6, 7] and proteinuria [6].
PhysGen [8] is a National Heart, Lung and Blood (NHLBI)-funded PGA that is breeding a panel of consomic rats and has performed genotyping and phenotyping studies and, in some strains, has performed spotted microarray gene expression studies of several tissues of interest in these animals. This unique database provides an excellent opportunity to search for cross-chromosome multigenic associations with proteinuria. We have analyzed the publicly available data from the PhysGen Renal Protocol normoxic phenotype and gene expression data to determine whether there are QTL that associate with nephrotic-range proteinuria and to assess for functional genomic clusters that may be encoded within nephrotic proteinuria-associated QTL.
Methods
Consomic rat strains and phenotyping protocols
We accessed the publicly available PhysGen database for phenotype and genomic data [9]. Details regarding the breeding protocols, genotyping, phenotyping, and other analyses can be found on the PGA Web site. PhysGen protocols conform to the National Institutes of Health Guide for the Care and Use of Laboratory Animals. At the time of this analysis, PhysGen has bred adult consomic strains subjected to the “Renal B” protocol for rat chromosomes 1, 2, 4, 6,7, 9, 11,13, 16,18, and 20, and for the rat Y chromosome. For chromosomes 2, 4, 6,7, 9, 11,13, 16,18, 20, and Y, consomic strains consisted of the specific Brown–Norway (BN) rat chromosome introgressed within a Dahl salt-sensitive (SS) rat background. The chromosome 1 consomic strain consisted of BN chromosome 1 within a fawn-hooded hypertensive (FHH) rat background. In addition, PhysGen has bred congenic strains for rat chromosomes 8 and 12, in which a majority BN chromosome is introgressed within an SS rat background. We stratified protocol analyses by gender, allowing for analysis of X-chromosome effects as well. Therefore, our analysis included consomic or congenic strains covering 15 of the 22 rat chromosomes (1, 2, 4, 6, 7, 8, 9, 11, 12, 13, 16, 18, 20, X, and Y). Although the PhysGen database includes animals subjected to hypoxia, only those rats in the normoxic group were included in our analysis in order to avoid confounding molecular effects due to hypoxia.
For our analysis we focused on the PhysGen data generated by the “Renal B” protocol [10], which includes the following baseline phenotype measurements: proteinuria (mg/day), microalbuminuria (mg/day), baseline mean arterial pressure (MAP; mmHg), heart rate (HR; beats/min), plasma renin activity (PRA; ng AngI/ml/h), sodium excretion (mEq/day), potassium excretion (mEq/day), creatinine clearance (CrCl; ml/min), and the serum creatinine level (SCr; mg/dl), stratified by strain (BN, SS, SS-xBN, where x=consomic chromosome) and gender.
Identifying chromosomes of interest
We used the R programming environment version 1.7.1 for phenotype data exploration and visualization. We then assessed for differences between genders across all strains for each renal phenotype measurement.
Phenotype measurements demonstrating a significant difference between male and female rats were stratified by gender for all subsequent analyses. We performed comparisons between parental strains and each consomic child strain (i.e., parent vs. parent vs. consomic child), stratified by gender, for each feature. Chromosomes that met both of the following a priori filter criteria were considered to be of interest for further analysis:
A statistically significant difference in proteinuria and/or albuminuria measurements between the SS parent and consomic same-gender offspring
No significant difference in proteinuria or albuminuria measurements between the BN parent and consomic same-gender child.
With respect to the rat Y chromosome, we determined whether proteinuria and/or albuminuria were (1) significantly different in SS-YBN compared with male SS rats, but not significantly different compared with male BN rats, or (2) significantly different in SS-YBN compared with male BN rats, but not significantly different compared with male SS rats.
To assess for other significant phenotypic differences between strains, the same criteria were applied to assess for significant differences in MAP, PRA, HR, SCr, CrCl, sodium excretion, and potassium excretion.
The nonparametric Wilcox.test function in R was utilized to determine whether differences were statistically significant. Differences were considered statistically significant if the nonparametric p-value was <0.05.
cDNA microarray analyses
We downloaded microarray data generated by PhysGen. Microarray preparation and sample processing protocols are posted on the PGA Web site. At the time of this analysis, microarray data were available for several consomic strains from kidney, heart, liver, and lung tissues, stratified by strain and gender. Including flipped hybridizations, each comparison in our analysis included a total of 12 samples from six arrays. We subjected the data to regression normalization. We used the SAM algorithm [11] implemented in R to analyze expression arrays of renal tissue from consomic strains corresponding to chromosomes identified as described above. Rather than selecting a threshold off the plot of observed relative difference [d(i)] to expected relative difference [d(E)], we ranked the genes in each comparison by the d(i)–d(E) (upregulated) differences and the d(E)–d(i) (downregulated) differences. For each comparison we extracted the top 5th percentile upregulated genes and the top 5th percentile downregulated genes. Plots of gene-specific scatter (s(i)) vs. d(i) and of d(i) vs. d(E) were appropriately similar to published SAM algorithm data [11].
Functional clustering of differentially-expressed genes
To determine the most up-to-date functional annotation of differentially expressed genes, we created a PERL script incorporating the Bioperl module to automatically retrieve descriptors from GenBank for all differentially expressed genes. All differentially expressed genes and expressed sequence tags (ESTs) with either known function or similarities to genes with known function were submitted to the Expression Analysis Systematic Explorer (EASE) to be clustered by function [12]. EASE clusters genes based upon commonalities in gene ontology and ranks clusters based on an EASE score as well as the Fisher’s exact p-value. Resulting clusters often include large, nonspecific clusters such as “cell,” “cytoplasm,” or “metabolism” in addition to smaller, more specific clusters such as “transition metal ion binding” or “cation transport.” We noted the highest ranked specific functional clusters of differentially expressed genes based on the Fisher’s exact p-value. We then determined the chromosomal location of genes within these clusters, if known, from public sources, including The Institute for Genomic Research (TIGR) and the National Center for Biotechnology Information (NCBI, LocusLink, and UniGene).
TUNEL
In light of our functional clustering results (see Results section), we elected to evaluate for apoptotic activity in renal tissue from strains of interest. We obtained from PhysGen 12 unstained renal tissue histology slides of male and female rat strains of interest. Detailed histology processing information is available in the PhysGen histology protocol. Formalin fixed rat kidney paraffin sections (3-micron thickness) obtained from PhysGen were deparaffinized and washed with water, followed by phosphate-buffered saline (PBS). The TUNEL reaction mixture from the In situ Cell Death Detection Kit, Fluoresceine (Boeringer Mannheim, Roche, Indianapolis, IN) was prepared according to the company instructions (dilution of enzyme 1:20), added to the sections, and incubated in a humid chamber for 90 min at 373C. The sections were washed with PBS and mounted with Vector Shield mounting media (Vector) containing 12.5 μg/ml DAPI. As a negative control, we incubated the kidney sections in label solution without addition of the enzyme. Fluorescence images were captured using a Nikon Eclipse E-1000 microscope and a Diagnostic Instruments SPOT RT cooled color camera.
Results
Identification of chromosomes of interest
Phenotypic measurements were significantly different between all male and female (parental and consomic) rats for all measurements except serum creatinine (Table 1). Therefore, all phenotype measurements except serum creatinine were assessed via our a priori filter criteria, across all available consomic strains and stratified by gender. As a reference point for defining nephrotic-range proteinuria in rats, puromycin aminonucleoside-induced nephrosis in rats manifests nephrotic-range proteinuria at a urine excretion rate of greater than approximately 150 mg/day [13].
Table 1.
Comparison of phenotype measurements in male and female rats. Values presented as median (interquartile range)
| Males | Females | P | |
|---|---|---|---|
| Creatinine clearance (ml/min) | 2.01 (1.57–2.53) | 1.36 (1.03–1.74) | <0.001 |
| Serum creatinine (mg/dl) | 0.36 (0.31–0.40) | 0.34 (0.29–0.40) | 0.22 |
| Heart rate (beats/min) | 389 (370–419) | 411 (396–434) | <0.001 |
| Mean arterial pressure (mmHg) | 157 (144–176) | 146 (136–163) | <0.001 |
| Plasma renin activity (ng AngI/ml/hr) | 0.42 (0.23–0.91) | 1.26 (0.72–2.40) | <0.001 |
| Sodium excretion (mEq/day) | 16.6 (12.8–21.7) | 12.9 (8.9–17.5) | <0.001 |
| Potassium excretion (mEq/day) | 1.2 (1.0–1.5) | 1.0 (0.8–1.1) | <0.001 |
| Albumin excretion (mg/day) | 36.7 (12.5–69.4) | 8.7 (4.3–20.0) | <0.001 |
| Protein excretion (mg/day) | 123.0 (70.2–197.4) | 59.7 (40.4–91.8) | <0.001 |
SS male rats demonstrated nephrotic-range proteinuria (Fig. 1). Based upon our a priori filter criteria, urine protein excretion was significantly different between strains for the SS-18BN consomic rats, such that proteinuria in SS-18BN consomic rats stratified by gender was significantly lower than for SS rats and not significantly different from BN rats (Fig. 1). In addition, significantly elevated urine protein excretion levels were detected in male SS rats vs. female SS rats and in male SS-18BN vs. female SS-18BN rats (Fig. 1). The rat Y chromosome was not identified as a chromosome of interest by our filter criteria. None of the other phenotype measurements (MAP, PRA, HR, SCr, CrCl, sodium excretion or potassium excretion) fulfilled the a priori filter criteria for any of the consomic strains tested. Therefore, rat chromosomes 18 and X were identified as QTL chromosomes of interest with respect to nephrotic proteinuria.
Fig. 1.

Boxplots showing a significant difference in protein excretion between the SS and SS-18BN consomic strains, stratified by gender. Male SS rat daily protein excretion is in the nephrotic range
Differentially expressed genes and functional clustering
Based on the pattern of protein excretion across genders and strains (Fig. 1), we performed analyses for differential gene expression comparing male SS to female SS rats, and male SS rats to male SS-18BN rats. Each PhysGen microarray measured a total of 27,648 genes. Five percent of this number is 1,382 genes. Therefore, the SAM algorithm was configured to filter out the 1,382 most up-regulated genes and the 1,382 most downregulated genes for each of the two comparisons, based upon the observed vs. expected differences, as described in the Methods section.
Utilizing GenBank accession numbers, our PERL script was able to identify descriptors for all differentially expressed genes, and a total of 870 genes were identified as having either known function or similarities to genes with known function. The remaining genes were ESTs with as yet no known function.
Functional clustering by way of the EASE tool yielded two high-ranked specific functional clusters: apoptosis, containing 10 genes, and cell proliferation/angiogenesis, containing 23 ESTs from 20 distinct genes (Fisher’s exact p-values of 0.022 and 0.046, respectively; Table 2). Only three ESTs from these two functional clusters mapped to either of the rat chromosomes of interest: a-raf murine sarcoma viral oncogene (two distinct ESTs, mapped to rat chromosome X) and adenomatosis polyposis coli (mapped to rat chromosome 18). Of these three ESTs, only the a-raf oncogene ESTs showed differential expression between strains consistent with chromosomal location; both a-raf oncogene ESTs were significantly downregulated in male SS rats vs. female SS rats. The adenomatosis polyposis coli EST was differentially expressed between genders but not between male SS and male SS-18BN rats.
Table 2.
The two highest-ranking specific functional clusters: cell proliferation/angiogenesis and apoptosis (EST expressed sequence tag)
| Cluster | EST | Chromosome |
|---|---|---|
| CD81 antigen (integral membrane protein TAPA-1) | 1 | |
| Chondroitin sulfate proteoglycan | 1 | |
| v-akt murine thymoma viral oncogene 2 | 1 | |
| Heparin-binding neurotrophic factor | 4 | |
| Ki-ras cellular oncogene 4B | 4 | |
| Von Hippel-Lindau protein | 4 | |
| v-jun sarcoma virus 17 oncogene | 5 | |
| Stress-activated protein kinase 3 | 7 | |
| Cell proliferation/angiogenesis | Dynein | 8 |
| Vascular endothelial growth factor | 9 | |
| v-erb-b2 oncogene (two ESTs) | 10 | |
| Protein phosphatase 1 | 12 | |
| Calmodulin 2 (two ESTs) | 15 | |
| Adenomatosis polyposis coli | 18 | |
| HLA-B associated transcript 3 (BAT3) | 20 | |
| ERK1 kinase | 1, 11 | |
| a-raf (v-raf) murine sarcoma viral oncogene (two ESTs) | X | |
| DNA polymerase alpha subunit | Unknown | |
| Janus kinase 2 | Unknown | |
| p55 cell division cycle protein | Unknown | |
| Bcl-2-like 1 | 3 | |
| v-akt murine thymoma viral oncogene | 6 | |
| Glutathione peroxidase 1 | 8 | |
| Amyloid beta 4 precursor protein | 11 | |
| Apoptosis | Superoxide dismutase 1 | 11 |
| Amyloid precursor protein-binding protein 1 | 19 | |
| NAC-1 protein | 19 | |
| Beta-tubulin | 20 | |
| Clusterin | Unknown | |
| Janus kinase 2 | Unknown |
Given the limitations of functional clustering in identifying all relevant genes within a functional cluster, we searched the list of all top 5th-percentile differentially expressed genes for 253 keywords or phrases pertaining to angiogenesis and apoptosis. We determined the chromosomal location of all such genes in order to detect ESTs for which differential expression was consistent with the respective strain comparison. Of 253 keywords, this search yielded only three additional ESTs: fibroblast growth factor (FGF) inducible gene 14, vascular endothelial growth factor (VEGF)-D, and GATA-6. The proangiogenic genes FGF inducible gene 14 and VEGF-D both mapped to rat chromosome X. Of these two ESTs, only FGF inducible gene 14 was differentially expressed between genders (downregulated in male SS vs. female SS). VEGF-D was upregulated in male SS vs. male SS-18BN. GATA-6, a proapoptotic transcription factor, mapped to chromosome 18 and was upregulated in nephrotic male SS rats vs. male SS-18BN rats.
Therefore, a-raf oncogene, FGF-inducible protein 14, and GATA-6 may be genes of interest in association with nephrotic-range proteinuria in rats, but it is unlikely that apoptosis or angiogenesis are mechanisms predominantly represented by nephrotic proteinuria-associated QTL.
Upon examination of the direction of the balance between angiogenesis and apoptosis at the gene expression level between male SS and female SS rats, we found no significant direction of expression, although there was an overall trend for downregulation of proangiogenic and antiapoptotic genes and for upregulation of proapoptotic genes (Table 3). No overall shift toward either apoptosis or angiogenesis at the gene expression level was observed when comparing male SS to male SS-18BN rats (Table 4), although numerous differentially expressed apoptotic and angiogenic genes were observed.
Table 3.
Angiogenesis- and apoptosis-related genes differentially expressed between male SS and female SS rats (EST expressed sequence tag)
| Action | Male SS vs. female SS | Gene | Chromosome |
|---|---|---|---|
| UP | Angiopoietin-2 | 7 | |
| DOWN | a-raf/v-raf oncogene (two ESTs) | X | |
| Angiogenic | DOWN | Calmodulin | 15 |
| DOWN | ERBB-2 receptor protein-tyrosine kinase | 10 | |
| DOWN | Fibroblast growth factor inducible gene 14 | X | |
| DOWN | v-akt murine thymoma viral oncogene | 1 | |
| Antiangiogenic | UP | Brain-specific angiogenesis inhibitor 1 | 9 |
| DOWN | Mitogenic regulation SSeCKS | 1 | |
| UP | Amyloid A4 protein | 11 | |
| UP | Apoptosis-related protein 1 | 2 | |
| UP | Fas antigen | 1 | |
| Apoptotic | UP | Ki-ras cellular oncogene 4B | 4 |
| UP | Stress-activated protein kinase-3, MAPK | 7 | |
| UP | Superoxide dismutase (Cu-Zn) | 11 | |
| DOWN | Chondroitin sulfate | 1 | |
| UP | Phosphatase 2A B56-alpha/PP2A | 16 | |
| Antiapoptotic | DOWN | Clusterin | Unknown |
| DOWN | p53 binding protein | 5 | |
| DOWN | p53 tumor suppressor-binding protein 1 | 3 |
Table 4.
Angiogenesis- and apoptosis-related genes differentially expressed between male SS and male SS-18BN rats
| Action | Male SS vs. male SS-18BN | Gene | Chromosome |
|---|---|---|---|
| UP | Angiopoietin-2 | 7 | |
| UP | Fibroblast growth factor inducible gene 14 | X | |
| UP | Heparin-binding neurotrophic factor/pleiotrophin | 4 | |
| UP | Integrin-linked kinase | Unknown | |
| UP | Transcription initiation factor TFIID | 12 | |
| Angiogenic | UP | Vascular endothelial growth factor-D | X |
| DOWN | Calmodulin | 15 | |
| DOWN | ERBB-2 receptor protein tyrosine kinase | 10 | |
| DOWN | PDGF-alpha-receptor | 14 | |
| DOWN | v-akt murine thymoma viral oncogene | 1 | |
| DOWN | Vascular endothelial growth factor | 9 | |
| UP | Apoptosis response zinc finger protein requiem | 1 | |
| UP | Cell division cycle protein p55CDC | Unknown | |
| UP | Poly(ADP-ribose) polymerase/PARP | 13 | |
| Apoptotic | DOWN | Amyloid precursor protein-binding protein | 19 |
| DOWN | Integrin beta subunit/Fibronectin receptor/CD29 | 19 | |
| DOWN | Large proline-rich protein BAT3 | 20 | |
| DOWN | p53 responsive gene product EI24 | 1, 8 | |
| UP | Apoptosis inhibitor bcl-x | 3 | |
| UP | VHL protein | 4 | |
| UP | GATA-6 | 18 | |
| DOWN | Dynein | 8 | |
| DOWN | Extracellular signal-regulated kinase 1 | 1, 11 | |
| Antiapoptotic | DOWN | Glutathione peroxidase | 8 |
| DOWN | Integral membrane protein TAPA-1/CD81 | 1 | |
| DOWN | Protein phosphatase 2A-beta/PP2A | 16 | |
| DOWN | Protein phosphatase-1 | 12 | |
| DOWN | Tyrosine-protein kinase JAK2 (2 ESTs) | Unknown | |
| DOWN | v-jun sarcoma virus 17 oncogene/AP-1 (2 ESTs) | 5 |
Histopathology
We downloaded publicly available images of renal tri-chrome histopathology sections from the PhysGen Web site. These revealed increased mesangial matrix and a decrease in the number of patent glomerular capillaries in all groups. No significant qualitative differences were observed between groups. The PhysGen pathologist interpreted all specimens as “fibrosis/sclerosis.”
TUNEL
In light of our gene expression results, we obtained 12 unstained renal tissue histology slides of male and female SS rats and male and female SS-18BN rats from PhysGen in order to perform TUNEL reaction analyses. Although the median number of apoptotic nuclei was higher in SS vs. SS-18BN rats (Fig. 2), these differences were not statistically significant. Male SS renal tissue displayed focal, condensed collections of apoptotic nuclei, while apoptotic nuclei were dispersed in the renal tissue from female SS rats, particularly in the inner stripe of the outer medulla (Fig. 3).
Fig. 2.

Boxplots showing the number of apoptotic nuclei on TUNEL stains of SS and SS-18BN renal tissue. No significant differences exist between genders or rat strains (all nonparametric p-values >0.05)
Fig. 3.
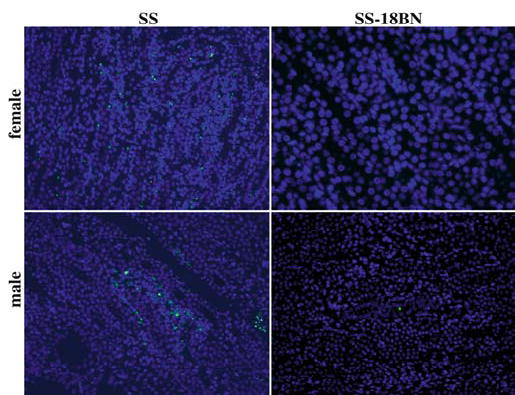
TUNEL images of the inner stripe of the outer renal medulla from female (upper panels) and male (lower panels) SS (left panels) and SS-18BN (right panels) rats
Discussion
We have identified rat chromosomes 18 and X as QTL for nephrotic-range proteinuria. The general nature of our approach was to set predefined filtering criteria to select chromosomes of potential interest, followed by the application of established bioinformatics methods to determine whether there exist identifiable categories of differentially expressed genes related to the selected chromosomes. Functional clustering of gene expression data suggested that angiogenic and apoptotic genes residing in these loci may be associated with nephrotic-range proteinuria, and several significantly differentially expressed angiogenic and apoptotic genes were found to be within the upper 5th percentile. As well, upon examination of the overall direction of the balance between angiogenesis and apoptosis at the gene expression level, we found a trend toward downregulation of proangiogenic and antiapoptotic gene expression and for upregulation of proapoptotic genes in nephrotic male vs. nonnephrotic female comparisons. However, a search of 253 additional angiogenesis- and apoptosis-related genes revealed only a small fraction of genes mapping to the two QTL of interest. Furthermore, associations between the QTL and nephrotic-range proteinuria may result from events not directly related to gene expression; events at the DNA, protein, and posttranslational levels may be more prominent. Consequently, our gene expression findings may simply represent surrogate markers that are dependent upon genetic and/or protein events. Therefore, we cannot conclude from our findings that either angiogenesis or apoptosis are predominant mechanisms expressed by rat chromosomes 18 and X in the pathogenesis of nephrotic-range proteinuria.
Given our gene expression findings, we performed TUNEL analyses of renal tissue from the SS-18BN consomic strain. Our TUNEL staining studies revealed no significant difference in the number of apoptotic nuclei in rat strains of interest, supporting our conclusion that apoptosis is not likely a predominant mechanism expressed by rat chromosomes 18 and X in the pathogenesis of nephrotic-range proteinuria. The apoptotic activity in our TUNEL analyses was focal and condensed in the nephrotic SS males and diffusely distributed in the nonnephrotic SS females. These findings were observed in tubules in the inner stripe of the outer medulla, the region of the kidney in which the thick and thin ascending limbs of the loop of Henle reside, and the collecting ducts, possibly representing tubular cell death of these nephron segments. The significance of this finding is unclear, but it likely represents apoptosis of interstitial cells, infiltrating leukocytes, and/or capillary endothelial cells, probably related to nonspecific progression of tubulointerstitial damage that may or may not occur secondary to proteinuria rather than a direct result of glomerular processes. Although it is known that excessive proteinuria induces apoptotic events in the proximal renal tubule, including increased NFκB activation and TNF expression [14] and increased expression of Fas and Fas-associated protein with death domain [15], it is not clear whether similar events occur in the loop of Henle. It is therefore also possible that our TUNEL observations reflect the effects of proteinuria-induced injury occurring predominantly in the medullary tubular segments.
Other consomic-based studies of proteinuria have been reported [5, 6]. Cowley et al. evaluated the role of chromosome 13 in the genetics of hypertension in SS-BN13 consomic rats. In addition to concluding that rat chromosome 13 contains genes protective against salt-sensitive hypertension, the authors also observed significantly less proteinuria in the SS-13BN rats compared with the SS strain [5]. Yagil et al. bred consomic rat strains for Sabra hypertension-prone chromosomes 1 and 17 on a Sabra hypertension-resistant background [6]. The consomic strains demonstrated much higher levels of proteinuria compared with the hypertension-resistant strain, but as we have also reported here, the renal histology was not different between the two strains. Yagil et al also reported similar findings in congenic rat strain models of salt-sensitive hypertension [7]. Our conclusions differ from the results of these reported investigations, primarily as a result of our use of a priori filter criteria to perform a global screen of all available consomic strains based solely on renal phenotype measurements, rather than selecting a specific chromosomal strain for study.
Our approach has several strengths and limitations. Our study is limited by seven missing consomic strains and by the lack of functional annotation for many ESTs. As well, functional clustering requires that gene functions be known and is also limited because many proteins have multiple functions, whereas many have as yet no known function. Furthermore, functional clustering results suggest associations only and provide no evidence of causality. Although SAM is an established algorithm that is commonly used to determine differential expression of genes in paired microarray data, it relies upon the validity of certain assumptions, such as the normality of the data and the effect of repeated testing. Our approach is empowered by the setting of stringent a priori criteria to select chromosomes of interest and by the scope of the chromosomes assessed, representing the majority of the rat genome. From this nearly genome-wide search, our findings implicate chromosomes 18 and X as QTL for nephrotic-range proteinuria in rats. The likely involvement of multiple genes originating from disparate chromosomes supports our hypothesis that genomic regulation of nephrotic-range proteinuria is diverse and complex. Our approach is a virtually global screen that identifies QTL related to nephrotic-range proteinuria and is largely dependent upon the accessibility and quality of Web-based datasets.
It is unclear whether SS rat chromosomes X and 18 contain genes that cause proteinuria that then resolves when either of those chromosomes are replaced by the corresponding BN strain chromosome, or whether genes in the SS genome cause proteinuria, and BN chromosomes X and 18 contain genes that are protective against proteinuria. More specific information could be uncovered if the sequences for these genes could be compared between the BN, SS, and SS-BN strains to identify polymorphisms that may indicate altered gene function and a propensity to proteinuria. To this end, efforts towards a unified rat single nucleotide polymorphism (SNP) map may be most informative [16].
In summary, we have identified chromosomes 18 and X as QTL for nephrotic-range proteinuria in rats. In-depth studies of these two QTL in rat models of nephrotic syndrome would be of value.
Acknowledgments
The authors are grateful for the assistance of Glenn Slocum/PhysGen/PGA, Sunil Saluja, Atul Butte, Joseph Bonventre, William Harmon, and Mona Khurana. This work was supported in part by NIH grant K23 16080 (ADS).
References
- 1.Seikaly M, Ho PL, Emmett L, Tejani A. The 12th Annual Report of the North American Pediatric Renal Transplant Cooperative Study: renal transplantation from 1987 through 1998. Pediatr Transplant. 2001;5:215–231. [PubMed] [Google Scholar]
- 2.Schachter AD. The pediatric nephrotic syndrome spectrum: Clinical homogeneity and molecular homogeneity. Pediatr Transplantation. 2004;8:344–348. doi: 10.1111/j.1399-3046.2004.00179.x. [DOI] [PMC free article] [PubMed] [Google Scholar]
- 3.Hudgins CC, Steinberg RT, Klinman DM, Reeves MJ, Steinberg AD. Studies of consomic mice bearing the Y chromosome of the BXSB mouse. J Immunol. 1985;134:3849–3854. [PubMed] [Google Scholar]
- 4.Williams RW. A targeted screen to detect recessive mutations that have quantitative effects. Mamm Genome. 1999;10:734–738. doi: 10.1007/s003359901081. [DOI] [PubMed] [Google Scholar]
- 5.Cowley AW, Jr, Roman RJ, Kaldunski ML, Dumas P, Dickhout JG, Greene AS, Jacob HJ. Brown Norway chromosome 13 confers protection from high salt to consomic Dahl S rat. Hypertension. 2001;37:456–461. doi: 10.1161/01.hyp.37.2.456. [DOI] [PubMed] [Google Scholar]
- 6.Yagil C, Sapojnikov M, Katni G, Ilan Z, Zangen SW, Rosenmann E, Yagil Y. Proteinuria and glomerulosclerosis in the Sabra genetic rat model of salt susceptibility. Physiol Genomics. 2002;9:167–178. doi: 10.1152/physiolgenomics.00014.2002. [DOI] [PubMed] [Google Scholar]
- 7.Yagil C, Hubner N, Kreutz R, Ganten D, Yagil Y. Congenic strains confirm the presence of salt-sensitivity QTLs on chromosome 1 in the Sabra rat model of hypertension. Physiol Genomics. 2003;12:85–95. doi: 10.1152/physiolgenomics.00111.2002. [DOI] [PubMed] [Google Scholar]
- 8.PhysGen (2005) PhysGen: http://pga.mcw.edu
- 9.TREX NHLBI Program for Genomic Applications, The Institute for Genomic Research, Rockville, MD 20850 (http://pga.tigr.org) [accessed 11/2003]
- 10.PhysGen (2005). Renal_B Protocol: http://pga.mcw.edu/pga-bin/protocol_desc.cgi
- 11.Tusher VG, Tibshirani R, Chu G. Significance analysis of microarrays applied to the ionizing radiation response. Proc Natl Acad Sci USA. 2001;98:5116–5121. doi: 10.1073/pnas.091062498. [DOI] [PMC free article] [PubMed] [Google Scholar]
- 12.Hosack DA, Dennis G, Jr, Sherman BT, Lane HC, Lempicki RA. Identifying biological themes within lists of genes with EASE. Genome Biol. 2003;4:R70. doi: 10.1186/gb-2003-4-10-r70. [DOI] [PMC free article] [PubMed] [Google Scholar]
- 13.Nakakura H, Ashida A, Hirano K, Tamai H. Oxidative stress in a rat model of nephrosis can be quantified by electron spin resonance. Pediatr Nephrol. 2004;19:266–270. doi: 10.1007/s00467-003-1332-9. [DOI] [PubMed] [Google Scholar]
- 14.Drumm K, Bauer B, Freudinger R, Gekle M. Albumin induces NF-kappaB expression in human proximal tubule-derived cells (IHKE-1) Cell Physiol Biochem. 2002;12:187–196. doi: 10.1159/000066278. [DOI] [PubMed] [Google Scholar]
- 15.Erkan E, De Leon M, Devarajan P. Albumin overload induces apoptosis in LLC-PK(1) cells. Am J Physiol Renal Physiol. 2001;280:F1107–1114. doi: 10.1152/ajprenal.2001.280.6.F1107. [DOI] [PubMed] [Google Scholar]
- 16.Zimdahl H, Nyakatura G, Brandt P, et al. A SNP map of the rat genome generated from cDNA sequences. Science. 2004;303:807. doi: 10.1126/science.1092427. [DOI] [PubMed] [Google Scholar]