

Abstract
Mitochondria are critical for cellular ATP production; however, recent studies suggest that these organelles fulfill a much broader range of tasks. For example, they are involved in the regulation of cytosolic Ca2+ levels, intracellular pH and apoptosis, and are the major source of reactive oxygen species (ROS). Various reactive molecules that originate from mitochondria, such as ROS, are critical in pathological events, such as ischemia, as well as in physiological events such as long-term potentiation, neuronal-vascular coupling and neuronal-glial interactions. Due to their key roles in the regulation of several cellular functions, the dysfunction of mitochondria may be critical in various brain disorders. There has been increasing interest in the development of tools that modulate mitochondrial function, and the refinement of techniques that allow for real time monitoring of mitochondria, particularly within their intact cellular environment. Innovative imaging techniques are especially powerful since they allow for mitochondrial visualization at high resolution, tracking of mitochondrial structures and optical real time monitoring of parameters of mitochondrial function. Among the techniques discussed are the uses of classic imaging techniques such as rhodamine-123, the highly advanced semi-conductor nanoparticles (quantum dots), and wide field microscopy as well as high-resolution multi-photon imaging. We have highlighted the use of these techniques to study mitochondrial function in brain tissue and have included studies from our laboratories in which these techniques have been successfully applied.
1. INTRODUCTION
Mitochondria play critical roles in the maintenance of cellular homeostasis. For example, mitochondria are not only an important source of cellular energy (ATP) but they also maintain intracellular Ca2+ levels within closely defined ranges for the mediation of signaling, control of neuronal excitability and synaptic function. In the intact brain a tight metabolic coupling exists between the vascular substrate supply of both oxygen (O2) and glucose and the metabolic needs of brain tissue, most importantly neurons and glial cells. This coupling exists following even a small increase in brain metabolic demand, such as sensory or visual stimulation evoking a neuronal response in sensory and visual cortex, respectively. The tight sequence of events occurring after neuronal stimulation include an initial O2 dip in areas of high O2 demand (i.e., those areas primarily stimulated), and a later large O2 increase associated with wide-field arterial vasodilation. These events are tightly correlated with mitochondrial activity through the production of signaling molecules such as hydrogen peroxide (H2O2).
Neurons within the brain are highly vulnerable to metabolic disturbances; therefore, impairment of mitochondrial ATP generation clearly threatens the viability of both neurons and glial cells, the function of neuronal networks, and consequently normal brain function. De-regulation of cytosolic Ca2+ levels by failure of mitochondrial Ca2+ buffering, and/or release of sequestered Ca2+ present within mitochondria (Biscoe and Duchen, 1990; Kulik and Ballanyi, 1998) contributes to the severe damage of brain tissue in response to glutamate excitotoxicity or metabolic insults, such as cerebral stroke. Similarly, an abnormally increased generation of ROS by mitochondria (such as during ischemia/reperfusion) also threatens neuronal viability, since the multiple ROS buffering mechanisms can be overwhelmed. The resulting oxidative damage of cell membranes, structural and regulatory proteins or redox modulation can, as a consequence, lead to abnormal activity of various ion channels (Chan, 1996, 2001).
Another threatening event for cell viability is the mitochondrial permeability transition (mPT), which occurs in response to mitochondrial Ca2+ overload during excitotoxicity or anoxia/ischemia, elevated cellular ROS levels or adenine nucleotide depletion (Crompton, 1999). The mPT is characterized by a nonspecific increase in the permeability of the inner mitochondrial membrane, loss of the mitochondrial membrane potential (?? m), possible rupture of the outer membrane, and severe mitochondrial swelling. When the mitochondrial permeability transition pore (mPTP) opening is transient, the release of cytochrome c from the mitochondrial intermembrane space may activate downstream caspases 9 and 3 and lead to programmed cell death or apoptosis. If the opening is prolonged, mitochondrial content becomes depleted, inducing rapid necrosis (Lipton, 1999; Lipton and Nicotera, 1998; Majno and Joris, 1995).
In view of these diverse mitochondrial functions and their integration into various cellular signaling pathways it is not surprising that alterations in mitochondrial physiology are currently being considered as pivotal events in several neurodegenerative diseases. For example, chronic dysfunction of complex I is being considered as a potential cause of Parkinson’s disease (Schulz and Beal, 1994), complex II dysfunction seems to mediate Huntington’s disease (Cooper and Schapira, 1997), complex IV dysfunction is considered the most frequent disturbance in Leigh disease (Dahl, 1998), and acute inhibition of complex IV (chemical hypoxia) prevents the utilization of O2. Furthermore, increased levels of ROS released from malfunctioning and/or stressed mitochondria, together with changes in ROS defense and scavenging, are considered to be involved in the generation of Alzheimer’s disease (Behl and Moosmann, 2002) and amyotrophic lateral sclerosis (Kong and Xu, 1998).
Many pharmacological tools have been used to study mitochondrial physiology and pathophysiology. These tools have been widely applied in isolated mitochondrial preparations and have in turn contributed to the elucidation of several mitochondrial parameters (e.g., electron transport chain function, membrane potential, free radical formation). However, the combination of pharmacological tools and imaging techniques when applied to intact cells, ex-vivo brain slices or more recently in vivo, are extremely important techniques to derive findings of mitochondrial physiology and in addition supply information about spatial distribution and temporal dynamics. Especially powerful are modern imaging techniques that allow for the visualization of single mitochondria, the tracking of mitochondrial structures and the optical real time monitoring of specific parameters of mitochondrial function, all possible now within intact cells, to increase our knowledge regarding mitochondrial physiology.
In this review, we summarize the tools that are currently available for the study of mitochondrial function and dysfunction. Due to our interest in mitochondrial physiology and the role of mitochondria in hypoxia/ischemia mediated neuronal injury, we have applied a range of techniques to both cell culture preparations and brain slices to further address our interests. Most of our work has been performed on various in vitro preparations of the mammalian brain, but the techniques and tools presented here are by no means restricted to neuronal tissue or vertebrate preparations. We have discussed (using examples) throughout the review the relative approaches of in vitro versus in vivo applications. These comparisons are critical to gain a complete understanding of mitochondrial function and dysfunction.
2. Mitochondrial Physiology
2.1 ATP production and brain activity
Brain function is critically dependent on a continuous supply of O2. Although the brain accounts for only 2% of the body mass, it is responsible for 20% of total O2 consumption and 25% of the body’s energy stores. The critical energy source in the brain is adenosine triphosphate (ATP), produced from adenosine diphosphate (ADP) by substrate-level phosphorylation. Glucose is considered the major source of energy following its metabolism during glycolysis and subsequent oxidative phosphorylation. The majority of ATP in the brain (> 95%) is produced by oxidative phosphorylation in the mitochondria (Fig. 1). In contrast, glycolysis alone in the cytoplasm contributes to only 1–5% of ATP production (Erecinska and Silver, 1989).
Figure 1. Mitochondrial physiology and pharmacological tools for the selective targeting of mitochondrial function.

A) Mitochondria are descendents of prokaryotic “bacteria”, and therefore have the typical double-layered membrane surrounding the inner matrix space. An enlarged schematic view of a section of the mitochondrial membrane (green box) and its respiratory complexes is shown in the following panel.
B) Schematic representation of the four complexes of the respiratory chain and the mitochondrial ATP synthase (F0F1 ATPase, complex V). Complexes I, III and IV are involved in proton pumping and thus the generation of the inwardly directed proton gradient across the inner mitochondrial membrane. Also, the main components of the mPTP are shown: ANT, CPD and VDAC. For clarity, only a small part of the outer mitochondrial membrane is shown.
C) Summary of drugs targeting the individual respiratory complexes as well the F0F1 ATPase. Mitochondrial uncouplers act as protonophores and collapse the proton gradient across the inner mitochondrial membrane. CsA can prevent the assembly of the various subunits forming the mPTP.
The concentration of ATP is maintained under steady-state conditions in the presence of an adequate supply of O2 and substrates. However, the rate of ATP production may vary among brain regions, cell types and cellular compartments depending on the activity of the region (for review see: (Erecinska and Silver, 1989)). For example, brain regions such as the basal ganglia, thalamus, brain stem and spinal cord show strong cytochrome oxidase staining (which indicates the presence of mitochondria and areas of ATP production) especially in areas containing tonically active neurons. On a cellular level, neurons are more intensely stained compared to glial cells. Within single neurons mitochondrial density in the dendrites is higher than in other areas such as axons or cell bodies. In addition, mitochondria in the dendrites show a dark cytochrome oxidase staining (Wong-Riley, 1989). A direct correlation was reported between the distribution of cytochrome oxidase and Na+/K+-ATPase (probably to maintain energy dependent electrochemical gradients) (Hevner et al., 1992). Overall, axons were found to have lower levels of cytochrome oxidase. These regional differences in ATP production, as indicated by cytochrome oxidase staining, suggest that mitochondria are dynamic and therefore able to rapidly adjust enzyme levels and/or increase in number to satisfy local energy demands in response to physiological as well as pathological conditions (Brines et al., 1995; Wong-Riley, 1989).
Since ATP diffusion within the cells is relatively slow due in part to the tortuosity of the diffusion path through the cellular structures, which include microtubules, filaments and organelles (Ames, 2000; Jones, 1986), it has been suggested that the strategic distribution of ATP synthesis sites may overcome the limitations of diffusion. For example, hexokinase, which requires ATP for glucose phosphorylation in order to initiate glycolysis, is preferentially associated with mitochondria, possibly to gain rapid access to ATP generated by oxidative phosphorylation (da-Silva et al., 2004; Jones, 1986; Wilson, 2003). In addition, glycolytic enzymes have been found to be associated with the plasma membrane, suggesting that ATP produced by glycolysis contributes in part to the maintenance of ion transport, in particular at the Na+/K+ATPase complex (Ames, 2000).
Neuronal and glial function is critically dependent on the maintenance of electrochemical gradients across membranes. Maintenance of the electrochemical gradient largely depends on the Na+/K+ ATP-ase activity and requires approximately 60% of the ATP produced. Therefore when energy production is impaired (e.g., during hypoxia), a rapid loss in ionic homeostasis occurs (Hansen, 1985; Müller and Somjen, 2000; Somjen et al., 1992). For example, the postsynaptic potential in hippocampal slices starts to decrease when ATP is lowered by 15% within 2 min following the initiation of hypoxia (Lipton and Whittingham, 1982). Interventions that limit ATP depletion or that can restore ATP levels to baseline after energy deprivation result in long-term protection of mitochondria and prevent neuronal degeneration (Galeffi et al., 2000; Kass and Lipton, 1982; Riepe et al., 1997). This has formed the premise of the development of several neuroprotective strategies.
2.2 Reactive oxygen species (ROS) generation
Mitochondria constitute the major source of superoxide (·O2−) and other ROS within cells, generating approximately 85% of total cellular ·O2−, via aberrant O2 reactions (Boveris and Chance, 1973; Dröge, 2002). During the process of electron transport in mitochondrial complexes I-IV, approximately 2–5% of electrons escape to react directly with readily diffusible O2, resulting in the production of ·O2− at complexes I and III (Boveris and Chance, 1973). During enhanced mitochondrial activity or respiratory chain inhibition (see Fig. 1C for a summary of inhibitors), either chronic or acute, the generation of ·O2− may markedly increase, causing oxidative damage, which is assumed to underlie many neurodegenerative diseases. In addition to mitochondrial ·O2− production, various cytosolic oxidases such as xanthine oxidase and nicotinamide adenine dinucleotide (NADH) oxidase, generate the remaining 15% of cellular ·O2− (Boveris and Chance, 1973; Dröge, 2002).
Once generated, ·O2− is converted both spontaneously and by various forms of superoxide dismutase (SOD) to H2O2 (Cadenas and Davies, 2000). H2O2 may react further, forming the reactive hydroxyl radical (OH·) in the presence of Fe2+ (Dean et al., 1997; Lipton and Nicotera, 1998). Alternatively, ·O2− may react with nitric oxide (NO) to form peroxynitrite (ONOO−) (Lipton and Nicotera, 1998).
Since in most instances, the levels of H2O2 are intrinsically lower in brain than the levels critical for inducing oxidative neuronal damage, H2O2 may act as a physiological, highly permeable signaling molecule, leading to a wide array of signaling functions both between cells as well as to the extracellular environment and adjacent blood vessels. These functions also include neuronal-glial interactions and long-term potentiation (Atkins and Sweatt, 1999; Chan, 2001, 2004; Kamsler and Segal, 2003, 2003; Knapp and Klann, 2002; Serrano and Klann, 2004; Thiels et al., 2000; Yermolaieva et al., 2000). The physiological role of ROS (along with O2 and NO) also extends to the control of vascular tone in the brain, which is tightly modulated by metabolic activity within neurons (Demchenko et al., 2002).
Under normal physiological circumstances cellular H2O2 as well as other ROS are scavenged by the various cellular antioxidants, particularly catalase and the glutathione (GSH) system (Chan, 1996). However, these defense systems may not be capable of keeping up with pathologically enhanced ROS generation resulting from acute or chronic mitochondrial dysfunction. Thus, during both ischemia and reperfusion, for example, excess ROS escape into the interstitial fluid (Lei et al., 1998). The resulting oxidative stress, which is based on the sudden imbalance of oxidizing and reducing agents, may cause both direct and indirect damage to secondary cellular targets. The severity of damage depends on the ROS or reactive nitrogen species (RNS) involved. While ·O2− and H2O2 are less reactive, OH· and ONOO− are considered extremely reactive (Chan, 1996; Halliwell and Gutteridge, 1984; Lipton, 1999). Cellular damage arises from the oxidation of macromolecules such as proteins, membrane lipids and somatic deoxyribonucleic acid (DNA) (Chan, 1996). Thus not only cellular cytoarchitecture but also function and cytosolic signaling are impaired. For example, ONOO− mediates the nitrosylation of tyrosine and cysteine sulfhydryls, thereby severely disturbing tyrosine phosphorylation-mediated signaling (Martin et al., 1990) as well as sulfhydryl-mediated redox sensing (Lipton et al., 2002; Lipton and Nicotera, 1998).
In view of the deleterious effects of increases in ROS and RNS, various attempts have been made to reduce or even prevent cellular oxidative damage, through the administration of radical scavengers, blocking of nitric oxide synthase (NOS) or overexpression of cellular self-defense systems. Administration of the free radical scavenger a-tocopherol rescued 75% of hippocampal neurons during 5 min global ischemia in gerbils (Hara et al., 1990) while SOD and catalase were found to be neuroprotective in a gerbil model of repeated ischemia (Truelove et al., 1994). In the same models, inhibition of lipid peroxidation was found to reduce neuronal damage (Hara and Kogure, 1990; Truelove et al., 1994). Also the reduction in damage caused by ONOO− by either inhibition or knockout of inducible NOS exerted neuroprotection in an MPTP (1-methyl-4-phenyl-1,2,3,6-tetrahydropyridine) model of parkinsonism in mouse substantia nigra (Liberatore et al., 1999). Overexpression of MnSOD in transgenic mice and the resulting decrease in ·O2− levels reduced lipid peroxidation, protein tyrosine nitration and decreased the cortical infarct volume following middle cerebral artery occlusion (Keller et al., 1998).
2.3 Ca2+ buffering
Mitochondria are able to sequester large amounts of Ca2+ via a uniporter (Gunter and Pfeiffer, 1990; Thayer and Miller, 1990) whenever the uptake of Ca2+ into the cell is greater than the efflux (Nicholls and Akerman, 1982). In resting cells, the concentration of Ca2+ in the cytosol has been estimated in the range of <100 nM to 300 nM (Carafoli, 1987; Cobbold and Rink, 1987; Crompton, 1985; Fiskum, 1985; Rasmussen and Barrett, 1984). The ‘set-point’ or cytosolic concentration at which Ca2+ is accumulated in mitochondria has been determined to be ~500 nM (Nicholls and Scott, 1980), yet depending on the cell type it may also be much lower, as has been shown for hypoglossal motoneurons (von Lewinski and Keller, 2005). Mitochondria thus act as temporary sinks (in addition to endoplasmic reticulum [ER]) to protect cells from toxic Ca2+ levels before releasing the Ca2+ into the cytosol (Nicholls, 1985, 1986). Their large Ca2+ storage capacity is achieved by the formation of a tricalcium phosphate complex (Ca3[PO4]2), which is osmotically inactive and does not interfere with ?? m. Formation of the complex is facilitated by alkaline pH of the matrix space and is quickly resolved upon mitochondrial uncoupling (by, e.g., protonophores) and the resulting proton influx into the matrix space (Nicholls and Chalmers, 2004).
Transportation of Ca2+ across the inner mitochondrial membrane utilizes the electrochemical potential and occurs in place of H+ transport and ATP synthesis, thereby uncoupling electron transport from ATP synthesis (Gunter and Pfeiffer, 1990). However, electron transport occurs during this time in order to maintain the electrochemical gradient. Following its sequestration into mitochondria, Ca2+ is then slowly released into the cytosol via a Na+/Ca2+ exchanger or Na+ independent efflux mechanism leading to a plateau in intracellular Ca2+ (Gunter and Pfeiffer, 1990).
2.4 pH effects
Mitochondrial function modulates the cytosolic pH of the host cell, thereby potentially modulating cell function and neuronal excitability, due to the proton pumping required for energy generation (Fig. 1B). Mitochondrial uncoupling by protonophores in muscle and snail neurons results in a transient increase in cytosolic pH (alkalinization) followed by an acidification (Buckler and Vaughan-Jones, 1998; Kaila et al., 1989; Meech and Thomas, 1980). While the acidification reflects a sarcolemmal H+ conductance induced by the incorporation of the protonophore into the cell membrane, the initial alkalinization reflects proton influx via the protonophore into the mitochondrial compartment (Kaila et al., 1989). Under physiological conditions, rapid changes in mitochondrial activity are indicated by high amplitude fluctuations of ?? m [blinking of mitochondria see Fig. 2D and (Buckman and Reynolds, 2001; Müller et al., 2005; Vergun and Reynolds, 2004)]. These rapid ?? m changes, which reflect variations of the proton gradient across the inner mitochondrial membrane could, especially in spatially confined cellular compartments such as dendrites and axons, result in localized cytosolic pH changes (pH microdomains) around mitochondrial clusters or filaments. The pH changes could then affect nearby located membrane channels and regulatory/structural proteins.
Figure 2. Fluorescence-labeling of mitochondria reveals their organization in single neurons.

A) Fluorescent labeling of mitochondria was achieved by transfection with CFPs targeted to cytochrome oxidase. Shown is a 3-dimensional reconstruction of a cultured neuron that was isolated from the medullary respiratory center (pre-Bötzinger complex) of a juvenile mouse. Note the long mitochondrial filaments, their high density in the soma region, their irregular distribution within the dendrites, and the accumulation of mitochondria in the synaptic terminals (arrows). Mitochondria were visualized by a custom-built 2-photon laser scanning microscope (Müller et al., 2003) at 800 nm excitation wavelength using a 63x 0.9 NA IR-optimized objective (Zeiss Achroplan), a pixel resolution of 250 nm/pixel and a pixel dwell time of 10 μs/pixel. Fluorescence intensity is coded in an 8-bit (256 level) pseudo-color mode ranging from black (low intensity = 0) to red (high intensity = 255) (Müller M. unpublished data).
B, C) Individual mitochondria within the dendrites of respiratory neurons. Mitochondria were labeled by Rh123 (5 μg/ml, 30 min), which reports changes in ?? m and were scanned at a resolution of 60 nm/pixel. Exposing the cell shown in panel C to the complex I inhibitor rotenone (25 μM) induced high amplitude ?? m oscillations in some of the mitochondria. The changes in ?? m for those mitochondria indicated by the arrows are plotted in panel D (Müller M. unpublished data).
D) ? ? m oscillations (“blinking”) upon administration of rotenone. Note the irregular ?? m changes occurring in the 5 mitochondria marked by the arrows in panel C and the subsequent loss of ?? m indicating complete mitochondrial depolarization as well as the irreversible effect of rotenone (Müller M. unpublished data).
Various ion channels are modulated by changes in pH. Among those are voltage-gated Na+ and Ca2+ channels which are activated by alkalosis and blocked by acidosis (Tombaugh and Somjen, 1996, 1997) and which may critically affect cellular function and excitability. Mitochondria-mediated cytosolic pH changes have also been reported to be involved in mitochondria-mediated apoptosis, with cytosolic acidosis promoting cytochrome c-mediated activation of caspases (Matsuyama et al., 2000).
Mitochondrial function itself is also modulated by changes in intracellular pH. The distribution of protons across the inner mitochondrial membrane (low in the matrix space and high in cytosol) contributes to the negative ?? m. It also defines the availability of the phosphate anion, which is required for the formation of the tricalcium phosphate complex in the matrix and thus the mitochondrial storage of Ca2+ (Nicholls and Chalmers, 2004). Therefore, changes in cytosolic pH may directly affect the ?? m.
During ischemia/reperfusion in which massive cellular Ca2+ loading occurs, pronounced cytosolic acidosis leads to increases in mitochondrial Ca2+ uptake. This is based on the increased uptake of inorganic phosphate (HPO42−) driven by the proton motive force across the inner mitochondrial membrane (Kristian et al., 2001). It is via this larger mitochondrial Ca2+ load that acidosis favors the opening of the mPTP (Kristian et al., 2001) and thus paves the way for irreversible cell damage and cell loss. Such pH-mediated distortion of mitochondrial function could contribute to the glucose paradox of cerebral ischemia, i.e., the fact that the outcome of cerebral stroke is worse for patients suffering from diabetes mellitus and hyperglycemia, in spite of the apparent benefit which hyperglycemia should provide in anoxic conditions (Schurr et al., 2001).
2.5 Mitochondrial organization and clustering
In each eukaryotic cell mitochondria are abundant and may occupy as much as 10–20% of cellular volume (Bereiter-Hahn, 1990; Müller et al., 2005), with the mitochondrial content being dependent on cell type and its energy demand. In a direct electron microscopic comparison of mitochondrial content in various regions of the rat brain, neurons were found to contain a higher mitochondrial density (17.3%) than astrocytes (11.0%) and oligodendrocytes (11.3%) (Pysh and Khan, 1972). Similar to the cellular content of mitochondria their subcellular distribution is quite heterogeneous. Mitochondria tend to accumulate near high-energy requiring regions, such as pre-synaptic terminals (Fig. 2A), suggesting directed motility and clustering according to energy needs. Most textbooks still depict mitochondria as free floating, bean-shaped organelles, a situation that has been found in electron micrographs of liver tissue and which has been propagated by the preparation of ultra-thin tissue sections and the resulting two-dimensional images obtained by this technique (Skulachev, 2001). However, it is now clear that mitochondria show a considerable degree of higher-level organization, forming linked mitochondrial arrangements, directed towards strategic locations within a cell. For example, in various tissues mitochondria were found to be organized in long mitochondrial filaments (also being referred to as mitochondrial chains, or tubules) or to have formed irregularly shaped mitochondrial clusters (Amchenkova et al., 1988; Dedov and Roufogalis, 1999; Müller et al., 2005). Examples of such mitochondrial filaments and clusters are shown in Fig. 2.
Studies from our laboratory have found that mitochondrial filaments are mostly in dendritic processes, while mitochondrial clusters dominate the soma region (Müller et al., 2005). High resolution electron tomography of single cortical, striatal, cerebellar and hippocampal mitochondria revealed synaptic and dendritic mitochondria to be mostly of globular shape, axonal mitochondria to be cigar-shaped, and somatic mitochondria to be of either shape (Perkins et al., 2001).
Within mitochondrial clusters or chains the single mitochondria are not simply physically attached, but they are indeed functionally coupled. Such coupling has been reported for mitochondria in fibroblasts, cardiomyocytes, astrocytes, sensory neurons and striated muscle (Amchenkova et al., 1988; Skulachev, 2001). Localized laser bleaching in neurons isolated from the respiratory brain stem center also demonstrated this concept of coupling. In these cells the highly localized (1 μm2) illumination of up to 12 μm long mitochondrial filaments resulted in the irreversible loss of ?? m (as probed by rhodamine 123 (Rh123) fluorescence) over the entire length of the filaments, including the non-illuminated parts. In contrast, other mitochondrial filaments that were located nearby were not affected (Müller et al., 2005). Thus, mitochondrial coupling is a dynamic process, and time lapse recordings of single labeled mitochondria demonstrating fusion and fission of the various mitochondrial structures can be observed occasionally under physiological as well as pathophysiological conditions (De Vos et al., 2005; Lewis and Lewis, 1914; Müller et al., 2005). For example, hypoxic conditions were found to promote the fusion of mitochondria (Bereiter-Hahn, 1990). The functional coupling of mitochondria requires the fusion of their inner and outer membranes, and it is apparently achieved by the involvement of various mitochondrial proteins located within these membranes, which cooperate to form a common fusion apparatus (Hales and Fuller, 1997; Yaffe, 2003).
Mitochondria also develop close connections with cytoskeletal components, such as microtubules, actin filaments and intermediate filaments. These interactions are involved in the anchoring of mitochondria as well as their transport and motility inside cells, thereby offering the unique possibility to adjust the subcellular spatial distribution of mitochondria to a cell’s current metabolic demands, particularly in terms of growth and development and other plastic changes in the cellular structure (Ligon and Steward, 2000; Morris and Hollenbeck, 1995; Müller et al., 2005).
The mechanisms that control mitochondrial movements and determine their subcellular distribution are only poorly understood. In addition to our findings that increased cyclic adenosine monophosphate (cAMP) levels reversibly arrest mitochondrial transport (Müller et al., 2005), others have reported that neurotoxic concentrations of glutamate (Rintoul et al., 2003) and NO formation (Rintoul et al., 2006) arrest mitochondrial movements in forebrain neurons. Even though the detailed molecular events have yet to be clarified, the loss of ?? m seems to play a central role in such impairment of mitochondrial transport (Rintoul et al., 2006). Hence it simply could be a local shortage of ATP that inhibits mitochondrial movements, since ATP is required to drive the molecular motors along microtubules. Also high local concentrations of Ca2+, either resulting from e.g., glutamate-mediated Ca2+ influx or released from dysfunctioning mitochondria (Kulik and Ballanyi, 1998; Müller and Ballanyi, 2003) could be responsible for the arrest of mitochondrial movements by impairing cytoskeletal integrity (van Rossum and Hanisch, 1999).
The variability of mitochondrial distribution and their polymorphism is associated with heterogeneous functional responses. The membrane potentials of mitochondria within a single cell are not uniform, as was revealed by 5,5′,6,6′-tetrachloro-1,1′,3,3′-tetraethylbenzimidazolylcarbocyanine iodide (JC-1) labeling (Smiley et al., 1991). Also their sensitivity to Ca2+-mediated stress differs. Synaptic mitochondria obtained from rat cortex are more sensitive to Ca2+ overload and undergo the mPT earlier than their nonsynaptic counterparts (Brown et al., 2006). Also the expression of certain mitochondrial ion channels, e.g., the BK-type KCa channels, was found in only a subset of cerebellar Purkinje cells, most notably in perinuclear mitochondria (Douglas et al., 2006). Such subcellular heterogeneity may prove to have important implications for the characteristic damage patterns of neurodegenerative diseases and the selective vulnerability among neurons in the brain.
3. Pharmacological Tools
3.1 Inhibitors of mitochondrial respiration
The respiratory chain consists of a number of enzyme complexes designated as: complex I (NADH-ubiquinol oxidoreductase); II (succinate-ubiquinol oxidoreductase); III (ubiquinol-cytochrome c oxidoreductase); and IV (cytochrome c oxidase), in which reduction/oxidation reactions occur (Fig. 1B). ATP is produced separately by the protein cluster ATP synthase, sometimes termed complex V or F0F1 ATPase using the proton gradient as an energy source (for a more detailed review, please see (Balaban, 1990; Senior, 1988) ).
Compounds that inhibit the respiratory chain at various target points (Fig. 1C) have contributed to the understanding of the oxidative phosphorylation process and proton transport. Site-specific inhibitors of the electron transport chain prevent the passage of electrons by binding to a component of the chain, hence blocking the oxidation/reduction reactions critical to mitochondrial function and therefore indirectly inhibiting ATP synthesis.
3.1.1 Complex I inhibitors
Complex I (NADH: ubiquinone oxidoreductase) inhibitors include over sixty different families of various compounds. Among complex I inhibitors are: pesticides; insecticides of natural origins such us rotenone and piericidin A; synthetic drugs and neurotoxins such as Amytal (barbiturates); and the toxic synthetic compound, MPP+ (1-methyl-4-phenylpyridinium). These compounds act at or close to the ubiquinone (Q) reduction site. Many of these inhibitors have structural similarities with Q, suggesting perhaps a common binding site.
Natural rotenone is the most widely used inhibitor of complex I and belongs to the rotenoids, a family of isoflavonoids extracted from Laguminosae plants. Based on its mechanism of action, rotenone is classified as a semiquinone antagonist, together with Amytal. The protein subunits ND1 and ND4 are involved in the binding of rotenone to complex I (Degli Esposti, 1998). Rotenone inhibits complex I by interfering with the electron transfer from the Fe-S cluster to the flavin mononucleotide (FMN)-a group (Albracht et al., 2003), thereby preventing the utilization of NADH as a substrate. In contrast, the electron flow resulting from the oxidation of succinate is unimpaired, because the electrons in this case enter through ubiquinol (QH2), which is beyond the site of rotenone inhibition.
Piericidins are produced by various Streptomyces strains and have contributed extensively to the understanding of the enzymatic properties of complex I. Piericidin A binds at two sites within complex I, thereby powerfully inhibiting electron transfer within this complex. The tight binding of piericidin A to complex I essentially prevents its displacement by rotenone and Amytal (Degli Esposti, 1998). Complex I inhibitors are probably the most widely used in the large variety of inhibitor studies because complex I is the largest and most complicated electron transfer complex. The structures of its 43 subunits have yet to be characterized. In addition, complex I is the respiratory enzyme most likely to be affected by mitochondrial DNA mutations and to be involved in human disease, since 40% of human mitochondrial DNA encodes for 7 subunits of complex I (Walker, 1995), while the remaining 36 subunits are encoded by the nuclear genome.
Diphenyleneiodonium (DPI) binds to the FMN-compound thereby inhibiting complex I between the NADH binding site and the Fe-S-clusters. However, DPI does not specifically target mitochondria, as it also blocks various oxidases (Li and Trush, 1998). We found that the application of DPI to acute hippocampal slices facilitated the onset of hypoxic spreading depression (hSD) similar to rotenone. Interestingly, the administration of DPI induced a decrease in NADH autofluorescence and an increase in flavin adenine dinucleotide (FAD) levels suggesting that mitochondrial respiration was stimulated. This effect, however, was probably caused independently of the inhibition of complex I by DPI (Gerich et al., 2006).
In brain preparations, rotenone has been one of the most widely used inhibitors to study the role of the electron transport chain in the production of ROS. Inhibition of complex I by rotenone (10–1000 nM) in isolated brain synaptosomes caused an increase in H2O2 after complex I activity was inhibited by 16% (Sipos et al., 2003). These results suggest that complex I itself could be the site of ROS formation in inhibited mitochondria, as well as in mitochondria with defective complex I. However, the application of rotenone for this purpose has given different results depending on the preparation and the substrate used. In the presence of the substrates pyruvate and glutamate, rotenone increases H2O2 production in brain mitochondria (Votyakova and Reynolds, 2001). This increase was inhibited if succinate was used as a substrate instead.
The application of rotenone may have different effects on ROS production when it is applied to intact neuronal cells or tissue under conditions that increase free radical formation, such as exposure to glutamate or cerebral ischemia. In cultured hippocampal neurons, rotenone (3 μM) in combination with oligomycin (2 μM), for example, lowered free radical formation after N-methyl-D-aspartate (NMDA) exposure (Luetjens et al., 2000). In vivo intracerebral infusion of rotenone (10 μM) inhibits ROS formation in the hippocampus during transient global ischemia. However, if succinate is administered with rotenone, ROS are still produced. The administration of succinate, which fuels the respiratory chain by bypassing complex I through activation of complex II, is able to overcome the rotenone-induced inhibition of ·O2− production that is probably occurring at complex III after ischemia (Piantadosi and Zhang, 1996).
Respiratory substrates and electron transport chain inhibitors also modulate mPTP opening, which in turn has dramatic consequences on respiration. For example, much higher Ca2+ loads are required to open the pore when electrons are provided to complex II rather than to complex I. In the presence of succinate and rotenone, the load of Ca2+ required to induce mitochondrial depolarization and swelling was three to four times higher than when mitochondria were incubated with glutamate and malate (Leverve and Fontaine, 2001).
3.1.2 Complex II inhibitors
In contrast to complex I only a small number of agents are available which can specifically inhibit complex II. Malonate, which is structurally similar to succinate, is a competitive inhibitor of succinate dehydrogenase, the critical enzymatic component of complex II. Other inhibitors of complex II include the fungicide carboxin, which is now considered a major environmental hazard, because of its extremely high affinity for mammalian succinate dehydrogenase. Additionally, 2-thenoyltrifluoroacetate (TTFA) is a classical inhibitor for the Q reduction site of complex II, but is used primarily for in vitro assays of complex II in isolated mitochondria (Barja and Herrero, 1998; Sun et al., 2005).
The compound 3-NPA (3-nitropropionic acid) is an irreversible inhibitor of succinate dehydrogenase (Coles et al., 1979). 3-NPA was tested in hippocampal slices and found to cause extracellular zinc accumulation, indicating the release of zinc from intracellular sites (Wei et al., 2004). Inhibition of complex II has been used to model the pathology of Huntington’s disease, and the inhibition of complex II by 3-NPA has demonstrated increased vulnerability of striatal neurons by causing irreversible membrane depolarization. In contrast, cholinergic interneurons were hyperpolarized (Saulle et al., 2004). Additionally, 3-NPA (in the presence of dopamine) can lead to enhanced NMDA-mediated long-term potentiation in striatum, suggesting increased sensitivity to complex II antagonists (but not complex I) in this region (Calabresi et al., 2001).
3.1.3 Complex III inhibitors
Electron flow in complex III (cytochrome c oxydoreductase) can be blocked by either the antibiotic antimycin A, which is produced by streptomyces, or myxothiazol. Antimycin A binds at the QI sites (internal Q, in proximity to the matrix), and inhibits the electron transfer from semiquinone to QI (Lai et al., 2005), whereas myxothiazol binds at external Q0 (in proximity to the intermembrane space). Antimycin A and myxothiazol have both been used to study the catalytic activity and structural characteristics of complex III (Miyoshi, 1998; Rieske et al., 1967).
The inhibition of the electron transport chain at complex III can also lead to ROS generation (Barja, 1999). The activity of complex III can be impaired in various conditions, such as exposure to hypoxia and in aging. During hypoxia, for example, complex III is inhibited at both the QI and Qo sites. In aged rats, the application of antimycin A (47 μM) and myxothiazol (9 μM) in submitochondrial particles isolated from the heart identified a defect in the ubiquinol (QH2) binding site (Q0) in complex III that may lead to increased ROS formation in aging cardiac mitochondria (Moghaddas et al., 2003). The application of antimycin A to isolated heart mitochondria induced an increase in H2O2 production in mitochondria respiring on complex I and complex II substrates. However, only when mitochondria were respiring on glutamate or pyruvate/malate, was rotenone fully able to suppress the ability of antimycin A to produce H2O2. This result suggests that complex III is the principal site of ROS production, and that rotenone blocks the primary flow of electrons into complex III (Chen et al., 2003).
To test the effect of complex III inhibition that is observed during hypoxia, antimycin A (3 μM) was applied to acutely dissociated CA1 pyramidal neurons (Lai et al., 2005). Antimycin A decreased Na+ currents and subsequently neuronal excitability, possibly through H2O2 production, and increased activity of protein kinase C (PKC). In cultured hippocampal neurons antimycin A (10 μM) increased ROS production, but blocked the ability of NMDA to produce a further increase in ROS, indicating that inhibition of complex III due to cytochrome c release may be implicated in ROS production and cell death after an excitotoxic insult (Luetjens et al., 2000). Although antimycin A and myxothiazol have been shown to induce an increase in ROS in a variety of tissues using a range of approaches, the ability of complex III to produce ROS and ROS-induced cell damage remains to be explicitly proven.
Mitochondrial populations demonstrate different degrees of sensitivity to respiratory chain inhibition and thus ROS formation. For example, synaptic and non-synaptic mitochondria have different susceptibilities to injury induced by antimycin A. In isolated brain mitochondria oxidizing glutamate and malate, the application of antimycin A (1 μM) resulted in an increase in H2O2, which was not inhibited by rotenone (1 μM). Instead, rotenone induced an additional production of H2O2 (Votyakova and Reynolds, 2001). Antimycin A (5–50 nM) has also been applied to synaptosomes to determine the threshold of complex III inhibition in order to produce ROS in synaptic mitochondria. In one study, 70% inhibition of complex III was required to induce an increase in H2O2 formation, indicating that in synaptic mitochondria ROS production from complex III is less relevant to physiological or pathological conditions than from complex I, where only 16% inhibition by rotenone is sufficient to induce a significant increase in ROS formation (Sipos et al., 2003).
3.1.4 Complex IV inhibitors
Under normal physiological conditions, electrons in complex IV are donated to O2, which is subsequently reduced to water (Babcock, 1999). Cyanide (CN−), azide (N3−) and carbon monoxide (CO) inhibit complex IV (cytochrome oxidase) by blocking the transfer of electrons from complex IV to O2. CN− and N3− react with the ferric form of heme a3, while CO reacts with the ferrous form of heme a3 (Berg et al., 2002). This inhibition causes chemical hypoxia by preventing the utilization of O2. Azide has been used in the development of models of chronic Alzheimer’s disease and amyotrophic lateral sclerosis (ALS) (Kaal et al., 2000; Szabados et al., 2004). Sodium azide administered to rats at 45 mg/kg/day caused both cognitive deficits and histopathological changes similar to changes caused by Alzheimer’s disease (Szabados et al., 2004), while the administration of up to 100 μM azide caused dose dependent death in motoneurons (Kaal et al., 2000). A concentration of 30 μM was lethal to motoneurons as compared to the survival of 44% of interneurons at the same concentration (Kaal et al., 2000). In contrast, many interneurons are spared in the hippocampus following global ischemia, even though hippocampal CA1 pyramidal cells are severely damaged (Freund et al., 1990). Thus, the chemical hypoxic effects of azide mimic global ischemia.
CN− has also been used extensively to study mechanisms involved in neurodegeneration and cell death, since it is rapid acting and neurotoxic, but also partially reversible. CN− initiates a series of reactions leading to cell death, which include release of K+ from mitochondria and efflux from neurons (Liu et al., 2003) and the enhancement of NMDA receptor function with a subsequent increase in cytosolic Ca2+ (Patel et al., 1992; Sun et al., 1997). The mobilized Ca2+ stores then can enhance the generation of free radicals, which secondarily cause lipid peroxidation (Gunasekar et al., 1996). CN− also causes the release of Ca2+ and cytochrome c from mitochondria (Liu et al., 2003; Müller and Ballanyi, 2003). Depending on the cell type and degree of insult, the application of CN− can lead to apoptosis or necrosis. For example, the application of CN− (400 μM) to primary cortical neurons caused apoptosis, whereas exposure of the same concentration of CN− to mesencephalic neurons caused necrosis (Prabhakaran et al., 2002). Since mitochondria are the primary target of CN− they respond within a few seconds with a major depolarization (Fig. 3). Also, the transport of mitochondria, which occurs along cytoskeletal tracks such as microtubules and actin filaments, is reversibly halted in the presence of CN− (Müller et al., 2005). The mechanisms involved in the arrest of mitochondrial movements have not yet been identified, though candidate events include local ATP shortage, loss of ?? m, cytosolic Ca2+ changes, and protein phosphorylation (see also section 2.5) (Müller et al., 2005; Rintoul et al., 2006; Rintoul et al., 2003).
Figure 3. Continuous monitoring of ?? m in single neurons and in acute tissue slices.

A) Rh123 labeled mitochondria within a cultured respiratory neuron. Note the increase in background fluorescence and the loss of structural labeling, as the cells are exposed to CN− (1 mM). Images were taken with a two-photon laser-scanning microscope using a 63x objective and a pixel resolution of 250 nm/pixel (Müller M. unpublished data).
B) Time course of the changes in rhodamine fluorescence (normalized to pre-treatment baseline conditions) quantified in three regions of interest within the cytosol (arrow 1) and two mitochondrial clusters (arrows 2, 3) of the cell shown in panel A. Note the opposite changes in cytosolic and mitochondrial compartments. As the mitochondria depolarize in response to CN−, Rh123 is released into the cytosol. Accordingly, cytosolic fluorescence markedly increases (black trace) while the fluorescence intensity of the mitochondrial structures decreases (blue and red traces). Upon washout of CN− the mitochondria regain their ?? m and the Rh123 fluorescence returns to pre-treatment baseline conditions (Müller M. unpublished data).
C) Measurement of Rh123 fluorescence in bulk-loaded slices. Using the appropriate filter sets, Rh123-fluorescence was monitored in combination with NADH autofluorescence, thereby obtaining changes in ?? m (Rh123) as well as mitochondrial respiration ([NADH]) and important details on mitochondrial dysfunction. Rh123-fluorescence and autofluorescence was captured with a highly sensitive CCD camera (QE, PCO) using a 40x 0.75NA water mmersion objective (Zeiss Achroplan) and quantified within a region of interest in stratum radiatum of an acute rat hippocampal slice. Note that in response to 1 mM CN−, 500 μM glutamate and 1 μM FCCP, NADH fluorescence consistently increased at a steeper rate and reached its plateau earlier than Rh123 fluorescence, indicating that upon inhibition of mitochondrial respiration the ?? m can at least partially be maintained for a limited period of time (Müller M. unpublished data).
CN− has also been used to study the differential response of hippocampal cells to chemical hypoxia by examining changes in membrane potential (Englund et al., 2001). The application of CN− (2 mM) to CA1 neurons causes hyperpolarization in cells with less negative resting membrane potential, and transient depolarization in cells with more negative resting membrane potential, indicating that CN− activates K+ channels. Applied to interface hippocampal slices, 1 mM CN− (as well as 2 mM azide) trigger spontaneous spreading depression episodes despite the presence of O2 (Gerich et al., 2006). Activation of KATP channels by CN− was found in dorsal vagal neurons, where KATP channels were activated independent of ATP depletion – obviously as a direct consequence of impaired mitochondrial metabolism or mitochondrial depolarization (Müller et al., 2002). However, a loss of membrane potential or massive Ca2+ influx did not occur in these cells even during prolonged CN− induced chemical anoxia (Müller and Ballanyi, 2003). CN− has also been shown to increase voltage-dependent Na+ currents in CA1 hippocampal cells (Hammarström and Gage, 1998).
The inhibition of mitochondria in motoneurons has been implicated in the neurodegenerative disorder amyotrophic lateral sclerosis, and hypoxia may be a causative factor. CN− was used to investigate the underlying vulnerability of these cells to hypoxia, compared to more resistant cell types such as dorsal vagal neurons. The application of CN− to patch clamped motoneurons in brainstem slices caused cellular influx of Na+ and increases in cytosolic Ca2+ levels as a result of: 1) Ca2+ release from mitochondria, 2) slowing of Ca2+ clearance rates from the cytosol and 3) elevated firing rate induced by secondary Ca2+ influx (Bergmann and Keller, 2004). The observed vulnerability of the motoneurons to mitochondrial impairment is suggested to be in part due to their low buffering capacity of cytosolic Ca2+, high-energy requirements and an increase in electrical excitability during hypoxia (Bergmann and Keller, 2004). From these studies, it is evident that the toxicity of CN− varies considerably across various cell types in the central nervous system.
3.2 Mitochondrial uncoupling by protonophores
A number of compounds (both exogenous and endogenous) exist that interfere with the flow of protons (H+) produced by mitochondria. Under normal physiological circumstances, the transport of electrons between mitochondrial complexes I-IV provides energy to transfer protons (H+) across the inner membrane (Fig. 1B). The resulting electrochemical gradient, expressed as the ΔΨm (−150 to −180 mV) (Mitchell, 1966), is vital to both ATP production and Ca2+ accumulation and is therefore essential to the maintenance of mitochondrial homeostasis. Dissipation of the proton gradient results in the cessation of ATP energy production (uncoupling) while electron and proton transport continues unabated (and may even be increased, due to the positive feedback from ADP).
Endogenous protonophores (uncoupling proteins) act to uncouple ATP synthesis from electron transport and are found in the inner membrane of mitochondria. Thermogenin or uncoupling protein 1 (UCP-1) lowers ΔΨm and increases the permeability of the inner mitochondrial membrane to H+ in order to generate heat in brown adipose tissue (Klingenberg and Echtay, 2001). Uncoupling proteins, particularly uncoupling protein 2 (UCP-2), may also play a significant role in the regulation of brain metabolism and intracellular signaling, particularly in terms of the modulation of ROS generation. For example, UCPs may modulate the formation of ·O2− and as a result H2O2 through their uncoupling activity (Casteilla et al., 2001; Negre-Salvayre et al., 1997). In addition, UCP-2 may be induced as a protective stress signal following neuronal injury. This was demonstrated in wild-type mice in which lesioning of the entorhinal cortex resulted in the expression of UCP-2 and activated caspase-3 immunoreactivity. Lesions in mice overexpressing UCP-2, however, resulted in a lower number of activated caspase-3 cells compared to wild-type animals (Bechmann et al., 2002). The overexpression of UCP-2 has also been shown to reduce neuronal damage following oxygen-glucose deprivation in cultured cortical neurons and following middle-cerebral artery occlusion in mice overexpressing the UCP-2 protein. UCP-2 is suggested to exert its protection by lowering ROS release and preventing the activation of both mPT and capase-3 (Mattiasson et al., 2003).
Drugs such as carbonyl cyanide m-chlorophenyl hydrazone (CCCP), carbonyl cyanide p-trifluromethoxy-phenylhydrazone (FCCP) and 2,4-dinitrophenol (DNP) shuttle protons from the intermembrane space back into the mitochondrial matrix, thereby diverting protons from the ATP synthase (Fig. 1B, C). This diversion of protons causes mitochondrial depolarization, which increases the rate of respiration, thereby short-circuiting the ?? m and uncoupling electron transport from ATP synthesis (Duchen, 1999). The unique effects of the different types of protonophores (i.e., compounds acting as either channels or carrier molecules to shuttle protons across membranes) on mitochondria have allowed for the various functions of mitochondria to be further investigated. DNP, CCCP, and FCCP have been the most widely used protonophores for this purpose and therefore are described in more detail below.
DNP is produced as a result of the addition of H+ to 2,4-dinitrophenate. DNP is lipophilic and uncouples oxidative phosphorylation from ATP production by shuttling protons back into the mitochondrial matrix, thereby directly decreasing the ΔΨm (Loomis and Lipmann, 1948). Since the ΔΨm controls the influx of Ca2+ into mitochondria (Gunter et al., 1994), it has been suggested that Ca2+ influx is decreased as a result of uncoupling. Mitochondrial uncouplers such as DNP (and CCCP, FCCP; see below) have been used extensively to elucidate the mechanism of disruption of intracellular Ca2+ homeostasis, in particular the relationship to mitochondrial ΔΨm following excessive glutamate stimulation. In the presence of glutamate, the addition of 300 μM DNP to granule cells from rat cerebellum induced mitochondrial depolarization, increases in [Ca2+]i and a sharp decrease in intracellular ATP (compared to glutamate alone). Following the removal of DNP, the [Ca2+]i rapidly recovered to baseline levels (Khodorov et al., 2002).
Although prolonged uncoupling leads to the collapse of the ΔΨm and depletion of ATP stores, temporary uncoupling by DNP is suggested to have little effect on both the ΔΨm and ATP levels (Kaim and Dimroth, 1999). Because of this finding, DNP has been investigated for its neuroprotective properties following cerebral ischemia. In a study conducted by Korde and colleagues (2005), the administration of DNP following transient focal cerebral ischemia was found to reduce infarct volume compared to vehicle-treated animals. The mechanisms of neuroprotection by DNP were shown to be the attenuation of both Ca2+ uptake into mitochondria (only in the ischemic penumbra) and a decrease in ROS formation in both the penumbra and core tissue (Korde et al., 2005). In a separate study, rats were treated with DNP prior to a striatal injection of quinolinic acid followed by mitochondrial isolation. DNP was shown to attenuate increases in mitochondrial Ca2+ as well as ROS formation induced by quinolinic acid. In addition, DNP also improved mitochondrial function as indicated by an increase in O2 consumption compared to treatment with TNP (2,4,6-trinitrophenol, a DNP analog, which cannot uncouple intact mitochondria) prior to quinolinic acid injection (Korde et al., 2005).
CCCP is a weak acid with lipophilic properties. It acts to uncouple mitochondria by dispelling the H+ gradient and releasing Ca2+ that has been sequestered in mitochondria. CCCP has been used to show that mitochondria play a role in buffering Ca2+ loads in neurons (Werth and Thayer, 1994). Following depolarization (by superfusion of 50 mM K+) in dorsal root ganglion neurons, the application of CCCP caused a sharp increase in cytoplasmic Ca2+ (during the plateau phase of the Ca2+ transient), suggesting mitochondrial release by uncoupling. In comparison, the application of CCCP to resting cells elicited a much smaller increase in cytoplasmic Ca2+(Werth and Thayer, 1994), which was followed by a gradual decline to baseline levels while CCCP was still present. CCCP has also been used to examine mitochondrial buffering of Ca2+ in cortical neurons (White and Reynolds, 1995) and cerebellar granule cells (Budd and Nicholls, 1996; Kiedrowski and Costa, 1995).
FCCP is an analog of CCCP and also causes a collapse in the H+ gradient across the mitochondrial membrane. Dissipation of the proton gradient causes not only inhibition of ATP synthesis but also the reversal of the ATP synthase, which then results in the hydrolysis of ATP since the equilibrium of the ATP synthase is predicated by both the ATP/ADP.P1 ratio and the ΔΨm. The application of FCCP (1 μM) causes a significant decrease in ATP content in cortical synaptosomes (Tretter et al., 1997) as well as in astrocytes (Juthberg and Brismar, 1997). Because of this, oligomycin (which blocks the mitochondrial ATP synthase without affecting the ΔΨm) has been used regularly in conjunction with FCCP to counter the effect of ATP depletion by FCCP (eg. (Storozhevykh et al., 2001; Villalba et al., 1994).
FCCP also acts to inhibit the uptake of Ca2+ into mitochondria by causing the Na+/Ca2+ gradient along the mitochondrial membrane to collapse (Budd and Nicholls, 1996; Gunter and Pfeiffer, 1990; Prehn et al., 1994; White and Reynolds, 1996). The application of FCCP (750 nM) to cultured forebrain neurons has been shown to cause a reversible collapse of ΔΨm using the fluorescent dye JC-1 (White and Reynolds, 1996). In comparison to CCCP, which elicits a further increase in Ca2+ during the plateau phase following depolarization (Werth and Thayer, 1994), the application of FCCP does not alter Ca2+ levels (Khodorov et al., 1996).
The use of FCCP has demonstrated the dependence of ROS production (H2O2) on mitochondrial ΔΨm and the NADH redox state in the presence of NADH-linked substrates (malate and glutamate or α-ketoglutarate). In a study conducted in isolated mitochondria, H2O2 production decreased concomitantly with a reduction in ΔΨm (produced by 0–80 nM FCCP) in the presence of the NADH-linked substrates. However, the application of 80 nM FCCP, which caused maximum reduction of the ΔΨm still resulted in 30% of the maximal ROS (H2O2) production (Starkov and Fiskum, 2003).
The administration of FCCP (1 μM) to cultured rat hippocampal neurons has been shown to cause mitochondrial generation of ·O2− equivalent to that produced by lethal concentrations of NMDA (300 μM). However, no neurotoxicity was evident from the application of FCCP alone at 1 μM or higher (10 μM) or even over longer periods of exposure (1 μM for 20 min). The co-administration of FCCP (1 μM) with 100 μM NMDA did not increase the amount of ·O2− generation but did lead to increased neurotoxicity (Sengpiel et al., 1998). The administration of only 100 μM NMDA caused a decrease in cell viability. These results suggest that although the generation of ·O2− is associated with NMDA toxicity, ·O2− production alone is insufficient to cause neuronal degeneration. It is, however, known that ·O2− can react rapidly with NO (produced by endothelium, macrophages, neutrophils and brain synaptosomes) following excessive stimulation of the NMDA receptor to form ONOO−, which does cause neurotoxicity (Beckman et al., 1990; Lipton et al., 1993).
FCCP has also been used to examine the role of mitochondrial Ca2+ buffering in excitotoxic cell death. When FCCP (750 nM) is applied to forebrain neurons in the presence of glutamate (100 μM) and glycine (10 μM), mitochondrial membrane depolarization is enhanced compared to the application of glutamate and glycine alone (Stout et al., 1998). In addition, the [Ca2+]i is increased with the co-application of FCCP compared to stimulation by glutamate and glycine alone. Despite the increases in [Ca2+]i, the transient inhibition of mitochondrial function prevented glutamate induced cell death, which demonstrates that the uptake of Ca2+ by mitochondria is a requirement of excitotoxicity. Specifically, FCCP is suggested to have prevented the generation of ROS induced by glutamate (Stout et al., 1998). In a separate study, the co-application of FCCP (1μM) with glutamate (0.5 mM) to spinal cord motor and non-motor neurons blocked Ca2+ uptake into mitochondria. FCCP was also shown to directly prevent the increase in ROS generated by glutamate exposure as indicated by a decrease in dihydrorhodamine-123 (DHR123) fluorescence (Urushitani et al., 2001). Unlike CCCP, FCCP may also act on non-mitochondrial Ca2+ stores (Jensen and Rehder, 1991; Ruben et al., 1991). For example, the application of FCCP to Helisoma (snail) neurons in which the mitochondria had been depleted of their Ca2+ stores was found to cause an indefinite increase in intracellular Ca2+ (Jensen and Rehder, 1991).
3.3 Inhibition of mitochondrial ATP synthase
F1F0 ATP synthase transforms energy from the proton electrochemical gradient into the phosphoric acid anhydride bond of ATP (Kaim and Dimroth, 1999; Mitchell, 1961). The F1F0 ATP synthase is located within the inner mitochondrial membrane and protrudes into the matrix space. It consists of the catalytic F1 part and the F0 subunit, which spans the inner mitochondrial membrane and forms a proton channel (Fig. 1B) (for details on the complex interaction of the two subunits see: (Elston et al., 1998; Stock et al., 2000)). Under normal physiological circumstances the H+ ions, which are transported out of the mitochondria via electron transport, then reenter the mitochondrial matrix through the F0 channel of the F1F0ATP synthase (complex V), to generate ATP (Fig. 1B).
Inhibition of the F1F0ATP synthase can be achieved either directly or indirectly. Indirect inhibition of the ATP synthase occurs in response to mitochondrial uncouplers, which collapse the proton gradient across the inner mitochondrial membrane and hence deprive ATP synthase of its driving force. Under these conditions the enzyme complex may reverse its direction of operation, hydrolyzing ATP rather than synthesizing it. This response is assumed to stabilize the ? ? m, prevent mitochondrial swelling and thus assure mitochondrial function (Duchen, 1999; Nicholls and Budd, 2000), for at least as long as glycolysis can keep up with the increased ATP demand.
Direct inhibition of the ATP synthase can be achieved by the antibiotics oligomycin and venturicidin, as well as by the covalently binding inhibitors N,N’-dicyclohexylcarbodiimide (DCCD) and dibutylchloromethylin chloride (Cain et al., 1977; Penefsky, 1985). All of these compounds interact with the F0 subunit and block the proton flux across the inner mitochondrial membrane (Penefsky, 1985). As a result of the decreased H+ conductance in response to these ATP-synthase inhibitors, mitochondria become hyperpolarized (as indicated by the monitoring of ?? m by e.g., Rh123) (Duchen and Biscoe, 1992; Schuchmann et al., 2000).
Four independent inhibitory sites have been identified recently for the catalytic F1 complex of the ATP-synthase. These sites can be targeted by a variety of covalent inhibitors, non-hydrolysable substrate analogs as well as the natural inhibitor protein IF1 [for review see: (Gledhill and Walker, 2005)]. Under physiological conditions the latter inhibitor protein prevents ATP hydrolysis by the catalytic F1 subunit. IF1 binds to the F1 complex in a 1:1 stoichiometry when cytosolic/mitochondrial acidification occurs in response to metabolic insults or mitochondrial uncoupling (Gledhill and Walker, 2005; Walker, 1994).
The mitochondrial fluorescence marker rhodamine 6G, as well as other structurally related lipophilic cations, can block the F1 subunit (Gledhill and Walker, 2005), which may prove problematic when these dyes are used as mitochondrial markers. This binding may explain the known impairment of mitochondrial respiration by higher concentrations of these mitochondrial markers (see section 5.1.) (Emaus et al., 1986; Scaduto and Grotyohann, 1999).
Since the ATP synthase is not directly linked to the respiratory chain, its inhibition by either of the above-mentioned compounds leaves mitochondrial respiration intact. Therefore, ATP synthase inhibition is an elegant approach to block mitochondrial ATP synthesis, avoiding interference with either mitochondrial respiration per se or maintenance of the ?? m. Other mitochondrial functions such as Ca2+ sequestration, also remain intact. It should be kept in mind, however, that under these conditions glycolysis remains the only source available for ATP production, which, depending on the cell type, its specific ATP demand, glycolytic capacity and glucose availability, may be insufficient to ensure undisturbed cell function.
When performing experiments on mitochondrial function, inhibition of ATP synthase may be desirable when protonophores are applied. In the presence of protonophores alone, ATP synthase may revert to the reversed mode, leading to the hydrolysis of ATP, and thereby worsening the metabolic status of the cell, since the cell also utilizes ATP derived from glycolysis (Duchen, 1999; Nicholls and Budd, 2000). Therefore, oligomycin should be applied to prevent the reversal of the ATP synthase in combination with protonophores to elucidate the true tissue response to mitochondrial depolarization. Although oligomycin is the most widely used compound to inhibit ATP synthase, we occasionally found that it precipitated in experiments performed with carbogen-aerated solutions and at temperatures in the physiological range (35–36°C), questioning its ability to penetrate into tissues.
In other studies, oligomycin was used to assess the effects of the ATP synthase on ΔΨm during focal cerebral ischemia (Takeda et al., 2004). Following the onset of ischemia, the time taken for anoxic depolarization (or hSD) to occur (indicated by a negative extracellular DC voltage deflection) in oligomycin treated rats was shorter than in the control group. The rapid decrease in ΔΨm prior to extracellular DC voltage deflection in the oligomycin group was attributed to a decrease in the mitochondrial proton pump following tissue O2 depletion. This finding suggests that the ΔΨm cannot be maintained without the reversed functioning of the ATP synthase. However, the extracellular DC potential following ischemia was lower in the control group, suggesting that the reversed functioning of the ATP synthase caused depletion in ATP, which compromised the DC potential (Takeda et al., 2004).
The application of oligomycin has also been used to investigate the relationship between mitochondrial ROS production, the NAD(P)H redox state and membrane potential in isolated brain mitochondria. Inhibition of the ATP synthase by the administration of oligomycin resulted in an increase in ROS generation and reduction of the NAD(P)H redox state, indicating that ROS generation is redox regulated (Starkov and Fiskum, 2003).
Oligomycin has often been used in conjunction with other mitochondrial inhibitors or protonophores to investigate various functions of mitochondria. For example, the co-administration of oligomycin (10 μM) with rotenone (5 μM) following stimulation with glutamate and glycine in cultured neurons caused a significant increase in mitochondrial membrane depolarization (measured using the fluorescent dye JC-1) compared to the application of glutamate alone (there was no significant membrane depolarization following oligomycin and rotenone treatment alone either). In addition, these inhibitors potentiated glutamate-induced increases in intracellular Ca2+ concentrations by blocking mitochondrial function and therefore Ca2+ uptake. However, in contrast to FCCP (750 nM), which significantly blocked neuronal toxicity as a result of glutamate stimulation, oligomycin and rotenone enhanced toxicity and caused irreversible inhibition of mitochondrial function (Stout et al., 1998).
It has also been shown that the addition of oligomycin to granule cells treated with glutamate and either DNP or CN− eliminates the [Ca2+]i plateau produced by DNP or CN−. In parallel experiments, the addition of DNP or CN− significantly potentiated the decrease in intracellular ATP following glutamate stimulation, whereas treatment with oligomycin weakened the effect produced by DNP and CN− (Khodorov et al., 2002).
3.4 Inhibitors of mitochondrial permeability transition (mPT)
The induction of the mPT represents the opening of a non-specific (voltage sensitive) proteinaceous pore. The mPTP has a diameter that allows molecules up to a molecular weight of ~1500 D to equilibrate across the mitochondrial membrane. Several proteins have been implicated in the formation and/or regulation of the mPTP. These include a voltage dependent anion channel (VDAC), intermembrane protein (creatinine kinase), adenine nucleotide translocator (ANT), cyclophilin D (CPD), and the peripheral benzodiazepine receptor, which are located in the inner and outer mitochondrial membranes (Fig. 1B, C). Furthermore, Bcl2 family proteins located in the outer membrane are involved either directly or indirectly (Crompton, 1999). The induction of mPT is facilitated by anoxia, loss of ATP, depletion of NAD(P)H, increased production of ROS, and dissipation of the negative ?? m (Almeida and Bolanos, 2001; Halestrap et al., 1997; Kristian, 2004; Simbula et al., 1997). In turn, the induction of mPT can lead to the uncoupling of the electron respiratory chain, the collapse of ?? m, as well as the efflux of both small molecules (Ca2+ and NAD+/NADH) and small proteins from the mitochondria (Halestrap et al., 2002).
Depending on the cell condition mPT has also been associated with the initiation of cell death, which can occur either by necrosis or apoptosis. Cells will undergo death by necrosis if the induction of mPT is associated with the depletion of ATP and disruption of the integrity of the plasma membrane, indicating loss of mitochondrial function. In contrast, if ATP levels are maintained, a more regulated induction of mPT may activate the apoptotic process over hours to days, which requires ATP formation for many of the programmed cell death states (Kroemer et al., 1998; Murphy et al., 1999).
The induction of mPT can be inhibited by endogenous factors, such as an elevated NAD(P)H/NAD(P) ratio; high levels of ADP or ATP; extramitochondrial Mg2+ and highly negative ?? m; and by pharmacological agents such as cyclosporin A (CsA), rasagiline, minocycline, and melatonin (Jemmerson et al., 2005). The ability of the immunosuppressive agent CsA to prevent or delay the induction of mPT was first postulated in in vivo and in vitro studies, where the application of CsA prevented both cell damage and the dissipation of ?? m induced by ischemia (Kroemer et al., 1998). CsA interferes with the induction of mPT by binding to cyclophilin D in the mitochondrial matrix. This binding prevents the interaction of cyclophilin D with ANT and the conversion of ANT into a pore (Crompton, 1985; Woodfield et al., 1998).
Cyclosporin A has been used in various preparations to further investigate the roles and regulation of the mPT. In isolated mitochondria, the induction of mPT is usually determined by detecting the absorbance decrease associated with mitochondrial swelling, using a spectrophotometer. Studies using isolated liver mitochondria have shown that CsA (0.5 μM) inhibits the release of GSH and the large amplitude swelling induced by Ca2+ (70 μM) and Pi (3 mM). Consequently, CsA also prevents the depletion of ATP, and the oxidation and release of NAD+ and NADP+ (Reed and Savage, 1995).
The ability of CsA to inhibit mPT is dependent on Ca2+ concentrations within the particular mitochondrial population. For example, CsA is less effective at preventing mitochondrial swelling induced by Ca2+ and Pi in brain mitochondria, as compared to liver mitochondria (Kristal and Dubinsky, 1997). In purified brain mitochondria CsA (1 μM) blocked mitochondrial swelling induced by Ca2+ (0.3 μmol/mg protein), but larger Ca2+ concentrations (0.6 μmol/mg protein) overcame CsA inhibition in the striatum. In contrast, the application of ADP (100 μM), another potent mPT blocker was able to block the Ca2+ induced mitochondrial swelling and depolarization in both types of mitochondria (Brustovetsky et al., 2003). ADP inhibits mitochondrial swelling probably by binding to multiple sites involved in the formation of the mPTP, such as the ANT, CsA binding protein and the Ca2+ uniporter (Brustovetsky et al., 2003; Brustovetsky and Dubinsky, 2000). In addition, the protocol used for mitochondrial isolation could alter the effect of CsA on mPT induction. For example, if digitonin is added to the buffer during the mitochondrial isolation to dissolve synaptosomes, the Ca2+ induced mitochondrial swelling is rendered insensitive to CsA inhibition.
To monitor the induction of mPT in cell culture or in situ, changes in ?? m were measured using fluorescent dyes such as tetramethylrhodamine, ethyl ester (TMRE), JC-1 and Rh123 that can be selectively loaded in the mitochondria (see 5.1 for a more detailed discussion of these probes). CsA (1 or 25 μM) administered with ADP prevented Ca2+ –induced mitochondrial swelling in cultured astrocytes loaded with JC-1 (Kristal and Dubinsky, 1997). In cultured oligodendrocyte progenitor cells loaded with TMRE, CsA and its analogue methylvaline-4- CsA (5–10 μM) were able to prevent ?? m dissipation and cytoplasmic Ca2+ oscillations induced by glutamate agonists (Smaili and Russell, 1999). In contrast, in hippocampal slices in which mitochondria were loaded with rhodamine-123, CsA (10 μM) failed to prevent slow mitochondrial depolarization during seizure-like activity indicating that mPT did not contribute to the seizure-associated mitochondrial depolarization (Kovacs et al., 2002). This result suggested that mitochondrial depolarization may not always be indicative of mPT induction.
The induction of the mPT can be more suitably monitored in living neurons with a voltage independent method by measuring fluorescence changes in calcein-loaded mitochondria. Selective mitochondrial labeling can be achieved after quenching calcein fluorescence in the cytoplasm with 1 mM CoCl 2 (Gillessen et al., 2002), Intact mitochondria are impermeable to cobalt and therefore retain calcein fluorescence; however, during induction of mPT, Co2+ enters the mitochondria and quenches calcein fluorescence. Since this technique is specific for mPTP, it is often used in parallel with mitochondrial voltage sensitive dyes to validate mPTP opening (Mironov et al., 2005). This method demonstrated that mPT induced by Mg2+or by ammonia in cultured astrocytes double labeled with calcein and TMRE, can be prevented indirectly with compounds that reduce ROS formation such as SOD (25 U/ml), vitamin E (250 μM), and Fe2+chelator deferoxamine (DFX, 40 μM), suggesting a role for ROS in the induction of mPT (Rao and Norenberg, 2004).
The induction of mPT by microtubule-acting drugs (taxol and nocodazole) was confirmed using the calcein/Co2+ imaging technique in cultured brain stem pre-Bötzinger complex neurons and in isolated brain mitochondria (Mironov et al., 2005). Apparently, the drugs’ mechanisms involved modification of the interaction between the microtubule and the outer mitochondrial membrane (Mironov et al., 2005). Interestingly, another mPTP blocker 2-aminoethoxydiphenyl borate (2-APB) (100 μM) was more effective than CsA in reducing the dissipation of ?? m induced by nocodazole in intact cells (Mironov et al., 2005). 2-APB prevents Ca2+ induced mPTP in non-synaptosomal brain mitochondria, in the presence of physiological concentrations of ATP (3 mM) and Mg2+. Under these conditions, 2-APB prevents the transition from a low to high conductance of mPTP and reduces Ca2+-induced release of cytochrome c and pyridine nucleotide from the mitochondria (Chinopoulos et al., 2003)
4. Fluorescence-labeling of mitochondria
4.1 MitoTracker® probes
MitoTracker® probes demonstrate binding to and fluorescent labeling of mitochondria. These probes mainly serve to mark mitochondrial structures, without yielding detailed functional information regarding dynamic changes in mitochondrial metabolism or membrane potential (Poot et al., 1996). MitoTracker® dyes are available for various excitation and emission wavelength ranges, spanning from green to orange to red, and have been used by us for both one- and multiphoton excitation (see the manufacturer’s webpage for details on the chemical structure: http://probes.invitrogen.com/handbook/print/1202.html). Due to their rapid membrane permeability, mitochondrial labeling is easily performed by simple cell/tissue incubation. MitoTracker® dyes label functional mitochondria only, since their specific accumulation partly depends on an intact ?? m. Once reaching the mitochondria they bind covalently to peptidergic sulfhydryl groups (Buckman et al., 2001).
One advantage of the MitoTracker® dyes is that they are considered to be less sensitive to photobleaching than the rhodamine derivatives, since they are robust fluorescent chromophores (Poot et al., 1996). Furthermore, they are stable during fixation, and are therefore valuable tools for double-label immunofluorescent studies (Stamer et al., 2002; Wozniak et al., 2005).
In addition, MitoTracker® dyes can be used to determine the mitochondrial content of a cell. This approach was used to verify that Alzheimer’s disease is correlated with a reduction of mitochondrial mass as determined in postmortem temporal lobe tissue (de la Monte et al., 2000). As demonstrated in primary cultures of forebrain neurons and astrocytes as well as endothelial and fibroblast cell lines, mitochondrial depolarization (induced by either uncoupling or respiratory chain inhibition) may interfere with MitoTracker® labeling, suggesting that the labeling remains partially dependent on mitochondrial integrity (Buckman et al., 2001; Poot et al., 1996). Nevertheless, these probes are effective tools for the tracking of mitochondria or the determination of cellular mitochondrial content, as has been shown in cultured rat hippocampal neurons and chick retinal ganglion cells (Stamer et al., 2002). MitoTracker® compounds have even been used in in vivo studies. Intracerebral injection of MitoTracker® green and a redox-sensitive MitoTracker® (MitoTracker® red CM-H2XRos) was used in animal models of neurodegenerative disorders to localize and quantify the generation of mitochondrial free radical production in rat striatal neurons after ischemia, elevated Fe2+ levels and application of 3-NPA (Kim et al., 2002).
4.2 Transfection with fluorescent proteins
Similar to MitoTracker® dyes, the use of green fluorescent protein (GFP) (Chalfie et al., 1994), or its spectrally differing variants, selectively labels mitochondria when inserted into an appropriate coding sequence (Rizzuto et al., 1995). Yet the difference is that the transfected cells themselves then significantly express the genetically encoded fluorescent proteins. Equipped with the appropriate targeting sequences GFP or its various isoforms yield a highly specific labeling of mitochondria (Rizzuto et al., 1995). A difficulty of this technique is the actual transfection procedure that is required to introduce the GFP-encoding DNA into the cells of interest. One must then make sure that the mitochondria have been effectively targeted. Since GFP labeling requires at least 24 hours before the first labeled mitochondria can be observed, with the optimum being at least 48 hours after transfection and expression, the application of this procedure is limited to cell or slice cultures, rather than acute brain slices (Rizzuto et al., 1995). Furthermore, the transfection procedure itself imposes stress on the cells, and in contrast to fluorescent dyes, only a small fraction of the cells becomes labeled. The transfection rates are usually far lower with liposome vehicles (10–20%) than with electroporation (50–90%) (Teruel et al., 1999).
We conducted experiments with cyan fluorescent protein (CFP) targeted to cytochrome oxidase (Fig. 2A). In cultured brainstem neurons we achieved transfection rates of 15–20% (see also (Rizzuto et al., 1995)) using lipofectamine transfection. The resulting labeling was found to be quite bright and markedly more photostable during both one- and multiphoton (NIR-Laser) illumination than, for example Rh123, or MitoTracker® labeling (Fig. 2A), and it provided us a tool to visualize and track single mitochondria independent of their ?? m. Another major advantage of fluorescent proteins compared to classical dissolvable fluorescent dyes is that once expressed in a cell, the fluorophore cannot be extruded by cellular transport systems or lost by diffusional exchange across the plasma membrane. Once expressed, the fluorescent protein is trapped and anchored at its targeted location within the cell, and is preserved even following tissue fixation (Chalfie et al., 1994).
While transfection by either electroporation or liposome vehicles is not applicable to acute tissue slices, their highly efficient transfection can be achieved with viral transfection procedures (Washbourne and McAllister, 2002). Yielding unprecedented transfection efficiencies for neuronal gene transfer of ~95 % (Washbourne and McAllister, 2002), these approaches come at the cost of more complex transfection procedures and strict safety regulations. To ensure that the desired expression pattern develops before the tissue samples are prepared, the viral shuttle with the expression system has to be injected in vivo - directly into the brain region or the organ of interest. Available viral vectors include adeno- and adeno-associated virus, vaccinia virus, Herpes simplex virus, and Sindbis as well as Semliki Forest viruses. The choice of the transfection system depends on the targeted cell type, desired expression level, time course of expression, and the toxicity level resulting from such transfection (Ehrengruber et al., 2001; Washbourne and McAllister, 2002).
Besides the pure labeling of mitochondria, expression of recombinant GFP allows for the determination of protein composition (Seharaseyon et al., 2000) or protein localization inside living cells. Furthermore, such gene transfer and mitochondrial gene therapy is considered a putative future treatment approach for human neuromuscular and neurodegenerative disorders (D'Souza and Weissig, 2004), and it also allows the delivery of small interfering ribonucleic acid species (SiRNA) for specific gene knockdown (Buckingham et al., 2004). This was used in mice to generate a more refined animal model of Parkinson’s disease by specifically knocking down the dopamine synthesizing enzyme tyrosine hydroxylase in midbrain neurons. The conditional mutants developed the typical behavioral changes as well as motor deficits (Hommel et al., 2003).
4.3 Fluorescently labeled antibodies
A variety of labeling antibodies is available for different mitochondrial targets. These include each of the respiratory complexes, the ATP synthase, the matrix protein pyruvate dehydrogenase as well as frataxin, a mitochondrial protein involved in iron metabolism. Furthermore, antibodies exist for the detection of cytochrome c, which is released from mitochondria early during apoptosis, as well as for the main constituents of the mPTP, i.e., the VDAC, the ANT, and CPD (Fig. 1). However, since antibodies are not membrane permeable, their application requires fixation and some method (such as the use of thin sections) to enhance access to tissue proteins prior to the labeling of intracellular targets. Even if applied to living tissue or cell cultures, such as following injection into cells or extracellular application, antibodies are likely to interfere with normal cellular and mitochondrial function, as their binding imposes steric constraints on protein function, thereby disturbing and/or preventing close protein/protein- or subunit-interactions.
Antibodies directed against mitochondria might, however, be useful for the detection of various mitochondrial proteins, or for testing of the correct assembly of the various respiratory complexes, since each complex consists of several subunits, variably encoded by either mitochondrial DNA (mtDNA) or in the nucleus by somatic DNA. Improper assembly of these subunits will result in chronic mitochondrial dysfunction, as may occur in various diseases (Capaldi et al., 2004). Also, quantitative analyses of the expressed protein levels are possible, as mitochondrial antibodies have proven useful for Western blotting. It is also possible to assess posttranslational modifications of various mitochondrial proteins. However, antibody detection requires additional labeling by either secondary antibodies or direct labeling by linked fluorophores. Besides these immunohistochemical studies, further applications of antibody-based mitochondrial labeling include electron microscopy (antibody conjugated gold particles) as well as the selective targeting of quantum dots.
4.4 Quantum dots
Quantum dots (Qdots) are nanometer-scale crystals consisting of semiconductor materials such as cadmium selenide (CdSe) or cadmium telluride (CdTe), which have unique advantages, making them superior in several ways to organic dye molecules (Derfus et al., 2004; Grecco et al., 2004; Parak et al., 2005). Qdots combine features such as large extinction coefficients, very broad excitation spectra, narrow emission peaks, intense fluorescence emission, and exceptional photostability, yet their use remains feasible for light- as well as electron microscopy. Most importantly, their high quantum yield is not diminished upon conjugation to biomolecules, a property often seen with traditional fluorescence dyes. The emission wavelength of Qdots is determined by the size of the nano-particle, so they can simply be “grown” to the desired spectral properties. Also, Qdots can be prepared to attach selectively to various targets at the molecular level. In contrast to antibody labeling, their small size (10–30 nm) indicates they are far less likely to interfere with normal function than, for example, antibodies or fluorescently tagged proteins.
The labeling of cell structures by Qdots requires biological molecules to either be anchored to the colloid particles, or in some situations, to be subject to non-specific cellular uptake via endocytosis. This can be achieved via covalent, electrostatic, or hydrophobic interactions, and the bio-molecules might be either anchored directly or via linker molecules such as the streptavidin-biotin system (Medintz et al., 2005). The latter approach is mostly applied to commercially available Qdots, lending feasibility for conjugation with antibody fragments to target specific cell structures.
In contrast to several organic dye-molecules, Qdots, however, are not membrane permeable. While this does not constitute a major problem in permeabilized and fixed cells, the lack of permeability is a critical limitation if living samples are to be investigated. In this case, Qdots can be transferred into cells by transfection reagents such as translocation peptides or cationic liposomes, electroporation or microinjection (Derfus et al., 2004). While the delivery of Qdots by transfection agents and electroporation was found to result in the delivery of Qdots aggregates, which may affect their subcellular distribution (Lovric et al., 2005), microinjection is currently deemed the best method for the labeling of subcellular structures and compartments (Derfus et al., 2004). However, a major limitation of the injection procedure in batch loading is that it has to be performed on each individual cell. Also, Qdots may be taken up by endocytosis (similar to nanobeads, long used for retrograde tracing), which usually results in their sequestration in vesicles or lysosomes rather than a cytoplasmic distribution (Derfus et al., 2004). Despite being useful as a delivery strategy, the uptake by endocytosis as well the tendency of Qdots to stick to membranes may severely reduce the specificity of Qdot targeting in this manner.
An issue that limits the use of Qdots in living cells, especially in long term studies in intact tissue or in vivo, is their potential neurotoxicity. Even though the surface coating of the CdSe or CdTe core markedly reduces cytotoxicity, the release of Cd2+ under oxidative conditions such as photooxidation by ultraviolet (UV) light or ambient O2 levels may still occur (Derfus et al., 2004). Another concern has been the generation of ROS (Lovric et al., 2005), which may also reduce cell viability if the protective coating of the inner core is degraded. In part, Qdot-mediated toxicity can be decreased by radical scavengers (Lovric et al., 2005) and improved surface coating (Jaiswal et al., 2003). The conjugation of Qdots with proteins or biocompatible polymers further reduces their cytotoxicity and thus improves their feasibility for biological tissue samples.
The unique optical properties of Qdots also have some disadvantages. Quenching of their fluorescence often occurs in aqueous media (Chan and Nie, 1998; Lovric et al., 2005). Other issues include the blinking of Qdots (Nirmal et al., 1996) and the dark fraction (non-radiant fraction) of non-responsive Qdots (Ebenstein et al., 2002), since these “photophysical pathologies” may prevent their continuous detection during e.g., single particle tracking and reduce the bulk quantum yield, respectively (Yao et al., 2005).
Currently more information is required regarding the long-term effects of Qdot labeling on the viability and physiology of living tissue samples. Yet as their use becomes more popular and improved coating strategies further reduce their potential cytotoxicity, these issues will become the focus of interest. Successful labeling of mitochondria by Qdots has been achieved recently (Derfus et al., 2004), by tagging a 28 amino acid targeting presequence for cytochrome oxidase to the Qdots. Co-labeling of mitochondria with MitoTracker® Red resulted in an indistinguishable staining pattern, proving mitochondrial specificity of Qdot labeling (Derfus et al., 2004).
4.5 Labeling mitochondria for electron microscopy
The only technique that allows for the visualization of mitochondrial ultrastructure is electron microscopy, applied as either classical transmission electron microscopy or scanning electron microscopy. Despite yielding the highest resolution of all imaging techniques, down to ~0.2 nm, a major drawback is that electron microscopy remains only applicable to fixed/dehydrated samples, as proper function of an electron microscope requires the material of interest to be maintained in a vacuum. Labeling of cells and organelles, including mitochondria, for electron microscopy requires staining with electron-dense metal ions such as uranyl acetate or lead citrate. Alternatively, colloidal gold particles of usually 1–40 nm size are conjugated to antibodies for immunogold labeling approaches (Hollinshead et al., 1997). This approach allows for the detection of protein expression pattern in single mitochondria with superior, ultrastructural resolution. The recently developed nanoscale semiconductor particles, such as Qdots (see previous section for details), can also be visualized by electron microscopy and might therefore prove to be valuable tools in future immunolabeling studies.
Electron microscopy has been applied successfully to both isolated mitochondria and mitochondria still enclosed in their host cell environment to analyze organelle interactions, mitochondrial ultrastructure under normal and pathological conditions, and protein expression at the single organelle level. By comparing neurons and glial cells of different brain regions neurons were found to generally contain a higher mitochondrial density (17.3%) than astrocytes (11.0%) or oligodendrocytes (11.3%) (Pysh and Khan, 1972). Electron tomography (three-dimensional electron microscopy) revealed uniform membrane architecture in mitochondria of cortical, striatal, cerebellar and hippocampal neurons and even among chick and rat cerebellum (Perkins et al., 2001). Yet, their shape varied considerably. Cigar-shaped mitochondria were found in axons, small globular mitochondria (<0.3 μm) in synapses, intermediate-sized (~ 1μm) globular mitochondria in dendrites and either globular or cigar-shaped mitochondria of varying size (0.25–2 μm) in the soma (Perkins et al., 2001).
Increasing evidence has shown that ion channels are also present in mitochondria (O'Rourke, 2000) and immunogold electron microscopy unequivocally identified the expression of those channels. In rat brain mitochondria high conductance Ca2+-sensitive K+ channels (BK channels) were located in the inner mitochondrial membrane (Douglas et al., 2006) and ATP-sensitive K+ channels were identified in mouse brain mitochondria (Lacza et al., 2003). In addition, the aquaporin AQP9 was found to be expressed in the inner mitochondrial membrane in astrocytes throughout the rat brain, but was found only in dopaminergic midbrain neurons among the neuronal populations (Amiry-Moghaddam et al., 2005).
On the structural level, electron microcopy is useful for mapping the distortion of mitochondrial ultrastructure during metabolic or excitotoxic insults. Anoxia in isolated rat brain mitochondria caused shrinkage of the matrix space (Fujii et al., 2004), while hypoxia combined with increased Ca2+ concentrations disrupted mitochondrial integrity (Schild et al., 2003). Severe mitochondrial swelling and disruption of membrane integrity also occurred in response to kainate-induced status epilepticus in hippocampal neurons of the CA1, CA3 and dentate gyrus subfields (Chuang et al., 2004). Mitochondrial content may be affected as well. In granule cells of rat dentate gyrus, transient ischemia increased the number of mitochondria in the presynaptic terminals (Briones et al., 2005). Mapping and classifying the damage of human cortical mitochondria (biopsy tissue) showed that characteristic damage patterns correlated with the type of insult or malfunction. Swollen clear mitochondria were found in the case of traumatic brain edema, while swollen dense mitochondria as well as dark degenerated mitochondria were associated with ischemia (Castejon and de Castejon, 2004).
Even though electron microscopy does not allow for functional studies or the dynamic probing of living mitochondria it is indispensable in terms of its detailed morphological analysis. Complemented by other techniques applicable to functional tissue, electron microscopy provides unique insights into ultrastructure and protein expression of single organelles that, at present, cannot be obtained by any other optical approach.
5. Functional imaging/probing of mitochondria
5.1 Mitochondrial membrane potential (?? m)
The ?? m relies on the proton gradient across the inner mitochondrial membrane, which is generated by the proton extruding complexes I, III, and IV of the respiratory chain (Fig. 1). Accordingly, the proton gradient is inwardly directed (towards the matrix space), generating a ? ? m of −150 to −180 mV (referred to cytosol, which is already 50–70 mV more negative than the extracellular space). A variety of fluorophores is available to monitor the ?? m, the most prominent ones being Rh123 and its derivatives TMRM (tetramethylrhodamine, ethyl ester) and TMRE (tetramethylrhodamine, methyl ester), as well as the cyanine dye JC-1 (5,5′,6,6′-tetrachloro-1,1′,3,3′ tetraethylbenzimidazolylcarbocyanine iodide). All of these dyes are membrane permeable cations, which accumulate in the mitochondria, the most electrically negative sites within cells. Accordingly, the use of these dyes is restricted to living cells, tissue or isolated mitochondria. These dyes concentrate up to 1000 fold higher within the mitochondria than in the externally applied staining solution (Skulachev, 2001). Changes in ?? m then result in a redistribution or aggregation of these dyes, generating changes in either intensity or wavelength of fluorescence emission, which constitute the detectable optical signal. Care needs to be taken with the concentrations used, since higher concentrations of the rhodamine derivatives in particular have been reported to interfere with mitochondrial respiration (Emaus et al., 1986; Gledhill and Walker, 2005; Scaduto and Grotyohann, 1999).
Rh123, the most widely used mitochondrial marker, shows a bright emission at 529 nm that is quenched as the dye accumulates within mitochondria, and then de-quenched (with increased fluorescence) when released from the mitochondria into the cytosol (Bahar et al., 2000; Duchen, 1999; Emaus et al., 1986). Thus, overall cellular fluorescence increases while the dye concentration inside mitochondria decreases. This results in very strong cytosolic background fluorescence and hence the labeled cells show a marked increase in fluorescence upon mitochondrial depolarization (Figs. 2C, D; 3).
TMRM and TMRE fluorescence emission also changes with ?? m due to redistribution and dequenching of mitochondrially accumulated fluorophores. Depending on excitation wavelength, TMRM and TMRE fluorescence emission either increases (546 nm excitation) or decreases (573 nm excitation) in response to mitochondrial depolarization (Scaduto and Grotyohann, 1999). Similar to Rh123, a moderate red shift of both the excitation and emission spectra occurs during dye accumulation in mitochondria. This spectral shift may be used for a ratiometric approach (Scaduto and Grotyohann, 1999). However, due to the small magnitude of the spectral shifts of the rhodamine derivatives, other mitochondrial markers such as JC-1 are better suited for such ratiometric recordings.
Another frequently used dye is JC-1 (Smiley et al., 1991), which is essentially a potential-sensitive probe. It is also membrane permeable and accumulates in mitochondria, depending on their ?? m. As the dye concentration increases in mitochondria, the JC -1 molecules start forming so-called J-aggregates, whose formation causes a shift in fluorescence emission from green (monomer, 527 nm) to red (J-aggregate, 590 nm). Thus, in contrast to the rhodamine derivatives, JC-1 is perfectly suited for ratiometric approaches, in which optical recordings are much less sensitive to loss of staining, organelle swelling and dye bleaching. Also due to the spectrally differing emission, single depolarized (green fluorescing) mitochondria can easily be distinguished from normally polarized ones (red fluorescing), thereby allowing analyses of mitochondrial heterogeneity within a single cell. JC1 staining also remains intact upon fixation of the tissue (Poot et al., 1996), which extends its use to immunohistochemical approaches.
An important issue in the use of these membrane permeable cationic dyes is that they distribute across all lipid membranes, i.e., not only across the inner mitochondrial membrane - or that of other organelles - but also across the plasma membrane. Nevertheless, due to its very negative potential, the highest dye concentration will eventually be reached within the mitochondrial matrix. In the concentration range often used for the indicators Rh123, TMRE and TMRM (up to 20 μM), autoquenching of their fluorescence occurs within mitochondria, and the intensity of mitochondrial labeling does not reflect true dye content, but is highly nonlinear. Under these conditions the release of dye from mitochondria into the cytosol results in dequenching of the released dye and a significant increase in fluorescence arising from the cytosol (Fig. 2B), dominating the optical whole cell response (Nicholls and Ward, 2000). At the same time the dye also slowly redistributes across the plasma membrane, particularly in tissue culture cells (Nicholls and Ward, 2000). This slow process of loss from cells into the interstitial space contributes to a decrease in the whole cell signal, especially during long lasting ?? m changes. The magnitude of these artifacts depends on the membrane permeability of the indicator used, and is more pronounced in the case of TMRE/TMRM than for Rh123 (Nicholls and Ward, 2000).
In the quenched mode, mitochondrial fluorescence is a nonlinear function of ?? m and therefore changes in ?? m cannot be accurately quantified. As a result, it is difficult to compare absolute ? ? m changes in mitochondria within different cells or among individual mitochondria. However, the dynamics of ?? m changes can be measured reliably, especially at the tissue level, when single particle or single cell resolution is either not desired or unavailable (Fig. 3C).
The use of these ?? m indicators in the non-quenched mode requires loading with sub-micromolar (<50 nM) concentrations (Duchen et al., 2003). In the non-quenched mode mitochondrial fluorescence is linearly related to ?? m and is indicative (in a linear manner) of the true distribution/redistribution of the dye between the different compartments. It thereby allows for the comparison of different cells or even individual mitochondria and the analysis of mitochondrial heterogeneity. The choice of the experimental mode to be used with these indicators depends on the questions to be addressed and the specimen to be investigated. An analysis of mitochondrial heterogeneity may be desired when examining single cells or isolated mitochondria, since single organelle resolution is difficult to achieve at the tissue level or even in vivo, and therefore the quenched mode may be more advantageous in this case.
5.2 NADH and flavoprotein autofluorescence
The optical recording of changes in the fluorescence of reduced pyridine nucleotides and oxidized flavoproteins provides an effective tool for studying mitochondrial metabolism and/or neuronal activity in the brain. The main advantages are that these compounds are endogenous and present within all cells, and that their levels are modulated by metabolic activity. Therefore, the monitoring of cellular energy metabolism does not require the loading of exogenous dyes, but does require quite intense illumination and highly sensitive detectors, since endogenous fluorophores are poor chromophores, with low quantal efficacy (< 1%).
Nicotinamide adenine dinucleotide (NAD+ and its reduced form NADH) is a hydrogen carrier in the mitochondrial electron chain and is involved in a number of oxidation/reduction reactions catalyzed by dehydrogenases. NADH is an indicator of both the cytoplasmic and mitochondrial redox state. Flavoproteins, which include cellular flavins, FAD and FMN, are enzyme cofactors involved in oxidation-reduction reactions. Both NADH and FADH2 are generated from pyruvate in the Krebs cycle. NADH produced along with protons generates a potential across the inner mitochondrial membrane to produce ATP (Mitchell, 1961).
Both NADH and flavoproteins have fluorescent properties, which are dependent upon their redox state. NADH emits yellow-blue light at 400–460 nm when excited with UV light at 340–360 nm. Since the oxidized form of NAD+ is not fluorescent, the fluorescence intensity is proportional to NADH, which is a useful measure of electron transport chain substrate availability and therefore an indicator of aerobic energy metabolism (Figs. 3–5). The majority of NADH fluorescence emission in tissue has been estimated to originate from the superficial layer of the cortex in vivo (~0.5 mm depth from the surface), since there is generally poor penetration of UV light into brain tissue (Chance et al., 1962). On the other hand, brain slices, which are usually 0.4 mm thick, are almost completely accessible for NADH investigation (Foster et al., 2005). Multiphoton confocal microscopy can potentially image NADH fluorescence at greater depths (given that the emitted photons can still be detected), since infrared (IR) light (at twice the wavelength, or 720–750 nm) has much higher penetration into brain than UV light. Confocal microscopy also has the advantages of three-dimensional resolution and greater sensitivity compared to conventional microscopy. However, limitations such as the objective working distance, scattering of the emitted photons and aberration phenomena exist with greater depths. In addition, increases in laser power are required to achieve the equivalent resolution obtained at more superficial depths (König, 2000).
Figure 5. Recordings of PO2, NADH and FAD autofluorescence as indicators of mitochondrial metabolism.
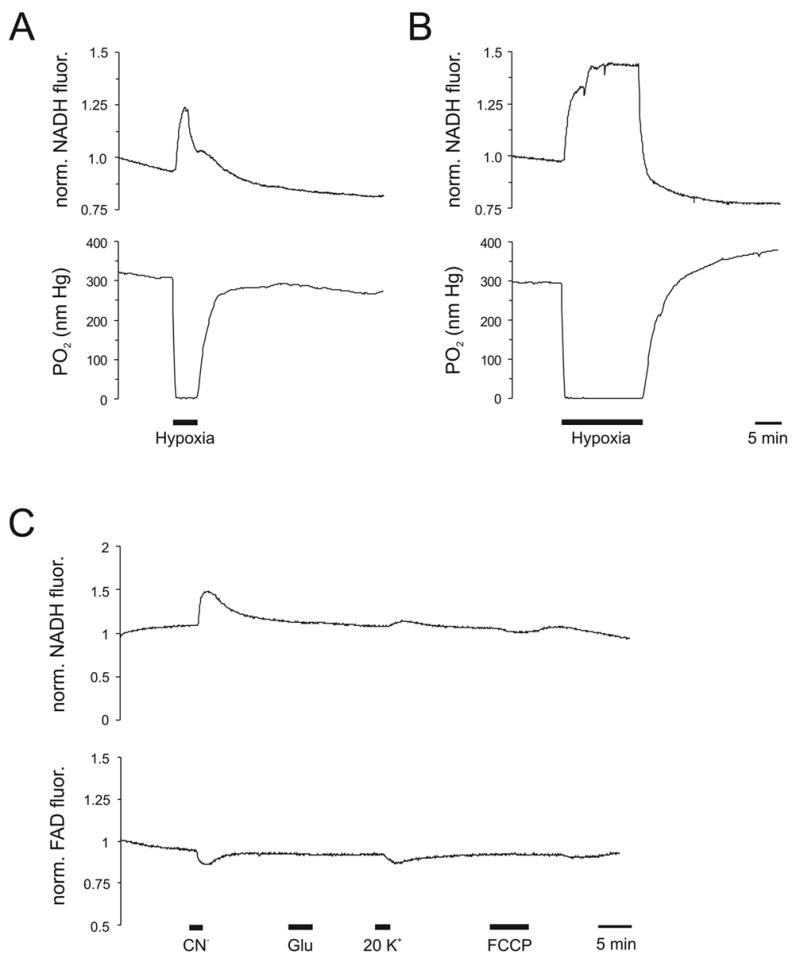
A) Simultaneous recording of PO2 and NADH autofluorescence in an interface rat hippocampal slice in response to reversible hypoxia. Hypoxia was induced by aeration of the experimental chamber with 95%N2-5%O2, which resulted in the triggering of hSD within 2–3 min. Reoxygenation within 15s following the onset of hSD (DC potential recordings not shown) resulted in the return of PO2 and NADH levels to pre-treatment baselines (reprinted from Neuroscience, vol. 132, Foster KA, Beaver, CJ, Turner DA, ‘Interaction between tissue pO2 and NADH imaging during synaptic stimulation and hypoxia in rat hippocampal slices’, p 645–657, 2005, with permission from Elsevier).
B) Responses of PO2 and NADH levels to prolonged hypoxia (95% N2, 5% O2) in an interface rat hippocampal slice. Hypoxia was continued for 10 min following the onset of hSD. After reoxygenation PO2 rapidly increased past baseline levels (overshoot) suggesting less O2 utilization due to irreversible neuronal impairment. In contrast, NADH decreased below baseline levels (hyperoxidation). The phenomenon of NADH hyperoxidation may occur as a result of cellular damage caused by increased levels of ROS following hypoxia (reprinted from Neuroscience, vol. 132, Foster KA, Beaver, CJ, Turner DA, ‘Interaction between tissue pO2 and NADH imaging during synaptic stimulation and hypoxia in rat hippocampal slices’, p 45–657, 2005, with permission from Elsevier).
C) Simultaneous recording of NADH and FAD autofluorescence in a submerged acute hippocampal slice (stratum radiatum). Note the opposite changes in NADH and FAD levels in response to chemical anoxia (1 mM CN−) or massive depolarization induced by elevating extracellular K+ to 20 mM. The application of CN− and K+ lead to NADH accumulation as a result of impaired respiratory chain function. In contrast, application of 2 μM FCCP or 300 μM glutamate induced only moderate changes. NADH and FAD autofluorescence was measured by alternate excitation with 360 and 445 nm and recorded through a 450 nm dichroic mirror and a 510/40 nm bandpass (Müller M. unpublished data).
Flavoproteins autofluoresce green light (515–570 nm) following excitation in the blue range (420–490 nm). However, only lipoamide dehydrogenase and electron transfer flavoprotein derived from the mitochondrial matrix contribute significantly to flavoprotein fluorescence (Hassinen and Chance, 1968; Kunz, 1986; Kunz and Kunz, 1985). A previous study performed in rat liver mitochondria found that alpha-lipoamide dehydrogenase flavin accounted for 50% of the overall flavoprotein fluorescence signal while electron transfer flavoprotein (non-NAD+-linked, component of the fatty-acid-oxidizing system) accounted for approximately 25%. The remaining 25% of the signal was accounted for by flavoenzymes not involved in flavoprotein fluorescence changes associated with alterations in respiratory chain electron flow (Kunz and Kunz, 1985). FAD is the cofactor of lipoamide dehydrogenase (LipDH) and its redox state is in equilibrium with the mitochondrial NAD+/NADH pool. However, in this case, the oxidized form FAD is fluorescent, not FADH2. The relationship between NAD+ and FAD is shown by the following reaction (Huang et al., 2002):
| (Eqn. 1) |
Since changes in NADH and flavoprotein fluorescence provide an indication of mitochondrial metabolism, fluorescent changes are also an indirect indicator of neuronal activity (Figs. 3–5). For example, changes in NADH fluorescence have been used to examine the dynamic response to increases in metabolic demand, i.e., as a result of synaptic train activation or K+-mediated neuronal excitation (Fig. 4). In vitro tissue slice studies have shown that the resulting NADH response is biphasic (Fig. 4A) and consists of an initial oxidation followed by a more prolonged reduction phase (overshoot) (Foster et al., 2005; Kann et al., 2003; Kasischke et al., 2004; Shuttleworth et al., 2003). The flavoprotein response to synaptic stimulation is also biphasic but smaller and asymmetrical to the NADH response (Fig. 4B) (Shuttleworth et al., 2003). Shuttleworth and colleagues have shown that the oxidation phases of the NADH and FAD responses following a stimulus train coincide with an increase in cytoplasmic Ca2+ concentration, which is partially absorbed by the mitochondria (Shuttleworth et al., 2003). In addition, we have shown that the NADH oxidative phase following stimulation coincides with a sharp decrease in tissue oxygen partial pressure (PO2) confirming mitochondrial utilization (Fig. 4A) (Foster et al., 2005). The later reduction phase overlaps only slightly with the PO2 transient, suggesting that this phase of the NADH response occurs mainly outside of the mitochondria, or with non-oxidative NADH reactions (Foster et al., 2005). Others have suggested that the NADH reduction phase is the net production of NADH from the conversion of pyruvate to lactate in astrocytes (Kasischke et al., 2004).
Figure 4. NADH/PO2 recordings during neuronal stimulation.

A) Combined recording of NADH autofluorescence and PO2 from an acute hippocampal slice (incubated in an interface recording chamber) during repetitive electrical stimulation. Note the biphasic response in NADH levels, characterized by an initial decrease (oxidation) and followed by an increase (reduction phase). The initial decrease in NADH levels coincided with the onset of the massive drop in PO= indicating enhanced metabolic activity in this area of increased neural activity. Synaptic stimulation consisted of a 25 s stimulus train (0.1 ms pulses at 10 Hz) (Galeffi F. unpublished data).
B) Simultaneous recordings of NADH and FAD autofluorescence during massive neuronal stimulation by increased extracellular K+ levels. Focally recorded field excitatory postsynaptic potentials were transiently depressed during and after the application of 50 mM K+, (~7 min) indicating depolarization block of synaptic transmission. Note that the recovery of synaptic function occurred faster than the normalization of NADH and FAD levels (Turner D.A. unpublished data).
Past tissue slice studies have also measured changes in NADH fluorescence in response to pathological conditions such as hypoxia (Foster et al., 2005; Perez-Pinzon et al., 1998; Perez-Pinzon et al., 1997; Perez-Pinzon et al., 1998) and hypoglycemia (Garofalo et al., 1988). The initiation of hypoxia causes a large, ~25% increase in NADH fluorescence (Fig. 5), which is followed by a steeper increase at the onset of hSD. If reoxygenation occurs within 15–30 s of hSD, NADH fluorescence decreases slowly to baseline (Fig. 5A). If hypoxia is prolonged following hSD (10 min), the increase in NADH increases further (~40% change in fluorescence) but then slows to and remains at a plateau-like elevation. Following reoxygenation, NADH quickly decreases below baseline (hyperoxidation) and remains at decreased levels for the remaining experimental period (Fig. 5B) (Foster et al., 2005). The phenomenon of hyperoxidation has been observed both in hippocampal tissue slices following hypoxia (Perez-Pinzon et al., 1998; Perez-Pinzon et al., 1997; Perez-Pinzon et al., 1998) and in in vivo cortex following ischemia, and may be indicative of severe, irreversible intracellular dysfunction, possibly attributable to ROS-induced damage (Rosenthal et al., 1995).
The measurement of NADH fluorescence in vivo initially utilized a single photodetector focused on the brain surface with a compound microscope (Chance et al., 1962). However, the interpretation of the brain metabolic signal using this method was complicated by optical interference in the regions studied, particularly by alterations in blood vessel size and content due to metabolic activity, since red blood cells contain significant NADH for glycolysis. Jöbsis and coworkers (Jöbsis et al., 1971) were able to calculate the extent to which hemoglobin quenches the NADH signal from the UV reflectance signal (known as the ‘double-beam technique’). In addition, only areas of cortical tissue free from coagulated blood and ruptured blood vessels were examined.
Local stimulation of cortex in vivo results in a very weak NADH signal (≤2% fluorescence decrease following the stimulus train), which is not distinguishable from noise created from biological interference, such as blood pressure induced motion of the brain surface (Lothman et al., 1975; Rosenthal and Jöbsis, 1971). The intrinsic optical signal and tissue penetration of light are also influenced by brain activity and therefore require separate measurement and subtraction from the NADH signal (Fayuk et al., 2002).
The imaging of flavoprotein autofluorescence following neuronal stimulation in the cerebellum has proved more successful (Reinert et al., 2004). In order to discount influences from blood flow and hemoglobin oxygenation, NOS was inhibited (using L-nitroarginine) and reflectance imaging was taken into account. In addition, the study demonstrated that the origin of the autofluorescence signal was flavoprotein by either blocking mitochondrial respiration using CN− or inactivating the flavoproteins using DPI. In both cases, the optical signal was significantly decreased. Therefore, biological interference did not significantly contribute to the biphasic autofluorescence response following stimulation (initial increase of 1.57% ΔF/F followed by a more prolonged decrease of –1.56% ΔF/F).
NADH fluorescence has also been measured in vivo under a number of altered physiological conditions including spreading depression (Mayevsky and Chance, 1974) and ischemia (Anderson et al., 1999; Tomlinson et al., 1993; Welsh et al., 1991). In more recent reports, NADH fluorescence was imaged from the cortex following middle cerebral artery occlusion using charge coupled device (CCD) cameras (Strong et al., 1996; Strong et al., 2000). In these studies, NADH fluorescence transients were imaged to indicate the propagation of peri-infarct depolarizations. Fluorescence increased spontaneously in the ischemic core followed by its propagation through the periinfarct areas, whereas decreases in NADH fluorescence occurred in healthy well-perfused cortex (anterior cerebral artery territory). Hemoglobin interference could not be corrected in this study using the double-beam technique. Therefore in these cases, changes in fluorescence could represent either changes in cortical cellular NADH (i.e., oxidation or reduction) or blood flow. Nonetheless, a decrease in fluorescence or increases in blood flow characteristically occur in normally perfused cortex in response to cortical spreading depression (Mayevsky et al., 1974; Rosenthal and Somjen, 1973) while an increase in fluorescence or decrease in blood flow occur in response to transient focal depolarizations.
A number of different optical techniques are available to quantify NADH and flavoprotein (FAD) fluorescence. Dual-wavelength spectrometry was used in isolated mitochondrial preparations to first associate the absorption and fluorescence of NADH and FAD with the mitochondrial respiratory chain (Chance and Williams, 1955). Redox fluorometry has been a widely used method, which disperses collected fluorescent light into spectral components using a spectrograph. Detection is then performed by a linear photodiode or CCD array (Sick and Perez-Pinzon, 1999). Significant advances in the use of both epifluorescence microscopes and cooled CCD cameras allow for the dynamic measurement of changes in NADH and flavoprotein fluorescence in response to altered physiological conditions such as hypoxia/ischemia (Foster et al., 2005). Choosing the appropriate filter sets, we have been able to measure NADH and FAD levels simultaneously from the same location in acute hippocampal slices (Figs. 4B, 5C; see also (Gerich et al., 2006; Hepp et al., 2005)).
Such ratio-like approaches (Duchen and Biscoe, 1992) might allow correction for cell swelling or changes in the intrinsic optical properties of the tissue under investigation, and we have used them to verify and compare the targeting of mitochondrial metabolism by various mitochondrial inhibitors in rat hippocampal slices (Gerich et al., 2006). All of the above methods involve one-photon excitation at near-UV wavelengths, which inevitably leads to pronounced light scattering, photobleaching and particularly photodamage of tissue samples. The development of multiphoton microscopy to monitor NADH and flavoproteins provides intrinsic three-dimensional resolution as well as increased effectiveness of fluorescence collection, since two photons of much less harmful near-IR (720–750 nm) excitation light may be used in place of one photon of UV light (340–360 nm) (Denk et al., 1990; Huang et al., 2002; Müller et al., 2003).
5.3 Probing mitochondrial metabolism by light absorption
Some of the components of the mitochondrial respiratory chain show characteristic absorption bands, with the light absorption depending on their current oxidative state. These include the cytochromes a, a3, c, and b (Chance and Williams, 1955; Mills and Jöbsis, 1972; Sick and Perez-Pinzon, 1999). Thus, by quantifying optical intensity changes in the distinct absorption bands and comparing them to an insensitive reference wavelength, the relative activity of the single respiratory complexes can be monitored (Chance and Williams, 1955; Mills and Jöbsis, 1972). The detailed distinct wavelengths at which such redox-dependent changes in the cytochromes’ absorption can be quantified are: 605 nm, 550 nm and 565 nm for the a-bands and 445 nm, 419 nm and 430 nm for the ?-bands of cytochromes a/a3, c and b, respectively. At all of these wavelengths, a shift to reducing conditions is indicated by an increased absorption (Chance and Williams, 1955; Sick and Perez-Pinzon, 1999). Due to interference with absorption changes resulting from the hemoglobin/oxy-hemoglobin ratio in the wavelength range beyond 550 nm, the use of the blue-shifted ?-bands of the cytochromes is desirable as opposed to their a-bands (Mills and Jöbsis, 1972).
The advantage of using these absorption changes of intrinsic chromophores for the monitoring of mitochondrial respiratory activity is that many of the problems associated with the use of fluorescence indicators, such as dye-loading, compartmentalization of the dye, photo-bleaching and phototoxicity, are minimized. Also such an approach allows for the direct functional assessment of single respiratory complexes, an option not provided by the more general markers of mitochondrial respiratory activity (NADH/flavoprotein autofluorescence) or ?? m indicators. For example, absorption changes of cytochrome c can be taken as a measure of the availability of O2 in the tissue during various physiological challenges. Yet, these absorbance optical changes are low in magnitude (a few percent), which are much smaller than the responses commonly seen with fluorescence indicators or the use of NADH/flavoprotein autofluorescence. Nevertheless, cytochrome absorption changes have been used successfully in the past to delineate the role of low PO2 affinity cytochromes, such as putative O2 sensors in glomus cells of the carotid body, by correlating cytochrome redox changes to chemoreceptor action potential discharges (Mills and Jöbsis, 1972; Streller et al., 2002), or to elucidate the contribution of the different respiratory complex subunits in electron transfer (Chance and Williams, 1955). Also, the relative reducing shift of the various cytochromes during the transition from normoxia to anoxia was quantified in acute hippocampal tissue slices, showing most pronounced changes for cytochromes a, a3 and c (Sick and Perez-Pinzon, 1999).
5.4 PO2 as a measure of mitochondrial function
The measurement of brain tissue PO2 provides an estimate of the availability and utilization of this critical substrate, during physiological and pathological conditions. Changes in brain tissue PO2 have been measured in a number of studies (both in vitro and in vivo) using small diameter (1–10 μM) O2 electrodes in response to either electrical (Fatt, 1976; Foster et al., 2005) or sensory stimulation (Gijsbers and Melzack, 1967; Meyer et al., 1954; Sick and Kreisman, 1979; Thompson et al., 2003; Travis and Clark, 1965). The types of electrodes used have included needle and polarographic microelectrodes, which require a bias voltage of −0.6 to −0.8 V to become activated. These electrodes consist of either carbon or noble metal (gold, platinum iridium) wire, coated in glass. The Clarke style microelectrode, which consists of a glass insulated Ag/AgCl reference anode with a guard cathode, also contains a saline bridge between the tissue and the active electrode, which protects against tissue contact and therefore protein contamination. Such protein contamination can lead to artifactual PO2 values, such as O2 levels above atmospheric pressure, a physical impossibility (Schiff and Somjen, 1985). Other electrode styles include an O2 permeable membrane to prevent protein contamination.
The Clark style electrode has been used to measure PO2 changes in hippocampal tissue slices in response to synaptic stimulation and hypoxia (Foster et al., 2005). Simultaneous measurements of PO2 (mmHg) and NADH (normalized changes) were taken during synaptic stimulation (Fig. 4A). The oxidative phase of the NADH response was synchronous with a dip in PO2 [also seen in vivo (Thompson et al., 2003)], which suggests that this phase occurred in the mitochondria. The subsequent reduction phase of NADH only slightly overlapped with the PO2 transient, suggesting that this phase took place outside of mitochondria or with less O2 utilization (Fig. 4A). In separate hippocampal slice experiments, the initiation of hypoxia (from 95% O2 to 95% N2) caused the PO2 to decrease rapidly to values of ~7 mmHg (hypoxic threshold) before the occurrence of hSD (Fig. 5b). It is suggested that hSD occurred once the extracellular PO2 value decreased below the equivalent half-maximal respiration (P50) of mitochondria (which is < 0.5 mm Hg, or 5–10 mm Hg less than the extracellular PO2 value measured in isolated mitochondrial preparations) (Gnaiger et al., 1995). Providing that reoxygenation occurred within 15–30 s of hSD, PO2 values recovered to baseline values (Fig. 5A). Measurements of tissue PO2 during stroke conditions may eventually reveal residual underlying metabolism in stroke regions, and mechanisms for protecting cells.
5.5 Determination of cellular ATP content
Since the mitochondrial respiratory chain provides most of the cellular ATP supply, cellular ATP levels critically depend on mitochondrial function. ATP depletion threatens cell viability, due to the eventual failure of ionic homeostasis followed by massive depolarization and severe Ca2+ load. In general, neurons are more susceptible to disturbed ATP production than glial cells due to their higher state of activity, but clear differences exist even among the different types of neurons. The most vulnerable neurons to ischemia are hippocampal CA1 pyramidal neurons, neocortical pyramidal neurons, cerebellar Purkinje neurons and medium spiny neurons in the striatum (Pulsinelli et al., 1982; Schmidt-Kastner and Freund, 1991). In part, mitochondrial dysfunction can be compensated by intensifying glycolytic ATP production, and elevating glucose concentrations (Allen et al., 2005), yet this is usually insufficient to maintain normal cellular function during prolonged or chronic metabolic disturbances. Thus, the measurement of cellular and tissue ATP levels is critical for the analysis of the consequences of mitochondrial dysfunction and the understanding of cellular responses to metabolic insults.
Cellular ATP levels can be determined by optical, i.e., (auto-)fluorescence or absorption based approaches, by nuclear magnetic resonance (NMR) spectroscopy or by High Performance Liquid Chromatography (HPLC). The only non-invasive technique that allows for the continuous determination of cellular ATP levels and which is also applicable to in vivo preparations/intact animals is 31P NMR spectroscopy. Here we will focus on the optically based techniques, particularly adaptable to the study of neurons and tissue slices. These approaches include the luciferin/luciferase assay, detection of NADH absorption in a coupled enzymatic reaction, and the quantification of intracellular Mg2+ levels.
The luciferin/luciferase ATP determination is the most commonly used technique, and also the most sensitive method. It is based on the ATP-dependent oxidation of luciferin by the enzyme luciferase, which is accompanied by the emission of photons (Bowers et al., 1993). Since the emission of photons relies on the chemical reaction itself and does not require any excitation light, it is referred to as bioluminescence. As ATP is the limiting factor, the emitted bioluminescence is proportional to the ATP content of the sample under investigation. However, the quantification of ATP levels requires tissue homogenization and the instantaneous arrest of all enzymatic reactions, to prevent degradation of ATP content upon cell lysis. This is usually achieved successfully by the use of either perchloric or trichloroacetic acid. Even though ATP levels can be determined accurately at a single time point, this approach determines just the static ATP content and does not allow for dynamic or continuous recordings over time. If changes in ATP content during a certain treatment (e.g., hypoxia) have to be measured, multiple samples must be tested, each at a different time point during the course of the experiment.
Another optical approach to determine cellular ATP levels is based on the reduction of NADP in a coupled reaction between hexokinase and glucose-6-phosphate dehydrogenase (Gerich et al., 2006; Lamprecht and Trautschold, 1974):
| (Eqn. 2) |
| (Eqn. 3) |
These reactions (in the presence of ATP) result in a spectrophotometrically detectable increase in NADPH2 absorption in the wavelength range of 340–360 nm. Since ATP is the limiting factor in this enzymatic assay, the amount of NADPH2 formed is directly proportional to the ATP content of the sample. In accordance with the previously described luciferin/luciferase assay, this detection of NADPH2 absorption also requires tissue homogenization, and it does not allow for dynamic, continuous recordings of cellular ATP levels.
A third optical approach to determine cellular ATP content is based on the (inverse) interrelationship of ATP level and the intracellular free Mg2+ concentration ([Mg2+]i). Mg2+ is bound to ATP, but is released when ATP is hydrolyzed to ADP. Accordingly, an increase in [Mg2+]i indicates a decrease in cytosolic ATP levels. Even though an absolute quantification of ATP levels is difficult using this approach, dynamic and continuous monitoring of changes in [Mg2+]i concentration can be performed over longer time intervals. When excited at 340 nm, the Mg2+-sensitive fluorescence dye mag-fura-2 responds to [Mg2+]i changes (Konishi et al., 1991) with an enhanced absorption and fluorescence emission (emission maximum at 490 nm) thereby yielding a measure of [ATP]i. This technique implements a ratiometric approach, by alternately exciting Mag-fura-2 at either its isosbestic point (347 nm) or its absorption maximum (380 nm), hence eliminating problems of dye leakage, bleaching and artifacts resulting from cell volume changes. Magnesium green, another fluorescent dye, has also been used to determine ATP changes indirectly (Leyssens et al., 1996). However, since Mag-fura-2 or magnesium green also respond to changes in [Ca2+]i (Konishi et al., 1991), measurements made with these dyes must be corrected for changes in [Ca2+]i by simultaneously recording the fluorescence of indicators that are specific for Ca2+, such as fura-2 (Haller, 2000; Leyssens et al., 1996).
The use of the above mentioned methods for the determination of cellular ATP levels has improved our understanding of neuronal responses to metabolic insults. In acute rat hippocampal slices in vitro ischemia induced by oxygen glucose deprivation for 7 minutes lowered cellular ATP content by 70% [probed by luciferin/luciferase assay (Galeffi et al., 2000)]. After the transient ischemic insult ATP levels partially recovered over three hours. This recovery could be improved by the benzodiazepine diazepam, which is likely to act via a GABAA–receptor mediated Cl− flux and by preventing mitochondrial cytochrome c release (Galeffi et al., 2000). A similar massive decrease in intracellular ATP levels (~ 90%), accompanied by mitochondrial depolarization, was observed in cultured hippocampal neurons exposed to 30 min oxygen glucose deprivation (Iijima et al., 2003). However, transient mitochondrial impairment (20–25 min) by various inhibitors of complexes I–IV, block of ATP synthase by oligomycin or mitochondrial uncoupling by FCCP caused a less severe ATP reduction in rat hippocampal slices (Gerich et al., 2006). This was obviously due to the ability of hippocampal neurons to compensate, at least partially, for transient mitochondrial inhibition by increased glycolytic ATP production (Allen et al., 2005).
Applied to intact brain slices the luciferin ATP assay also proved capable of yielding a pictorial representation of cellular ATP levels (Kogure and Alonso, 1978) and of indicating the release of ATP at synaptic terminals following tetanic Schaffer collateral stimulation in acute hippocampal slices (Wieraszko et al., 1989). Even dynamic recordings of nutrient-dependent changes in cellular ATP were performed by adenoviral-driven expression of recombinant luciferase in hypothalamic neurons and glial cells (Ainscow et al., 2002).
In rat cardiomyocytes Leyssens and colleagues observed a depletion of cellular ATP in response to FCCP but not oligomycin (Leyssens et al., 1996). Using the Mg2+ sensitive fluorescence indicator magnesium green they were able to demonstrate that FCCP causes a depletion of cellular ATP in an oligomycin-sensitive manner. These results indicate that the activation of cardiac KATP channels upon mitochondrial inhibition only occurs if ATP is depleted, and that ATP depletion is caused by the reversed function of the mitochondrial F0F1 synthase, which hydrolyzes ATP during inhibition of mitochondrial respiration (Leyssens et al., 1996). Similarly, Haller measured a decrease in cytosolic ATP (by 500 μM) in respiratory neurons of the medulla during hypoxia concurrent with the activation of ATP-sensitive K+ channels. These findings support the hypothesis that cellular ATP depletion is required for the activation of ATP-sensitive K+ channels in these neurons (Haller, 2000).
5.6 Reactive oxygen species (ROS)
Various ROS, including H2O2, have been implicated in physiological signal transduction (Dröge, 2002). However, at higher levels, as for example during ischemia, ROS may take on additional roles leading to target damage, depending on their cellular and regional levels and distribution (Chan, 1996, 2001). A critical next step in the detailed analysis of ROS is the application of techniques to directly analyze their cellular and regional distribution, and their exact time course of generation in relation to physiological and/or pathological events.
A variety of ROS-indicators exists, with the most widely used dyes being dichlorodihydrofluorescein (LeBel et al., 1992) and its numerous derivatives, including dihydroethidium (hydroethidine) (HEt) (Gallop et al., 1984), and dihydrorhodamine (Dugan et al., 1995). A membrane permeable form of dichlorodihydrofluorescein is available (2',7'-dichlorodihydrofluorescein diacetate [2',7'-dichlorofluorescin diacetate; H2DCFDA]), which passively enters cells, is trapped inside the cells once the acetate groups have been cleaved by intracellular esterases, and is then oxidized to fluorescent dichlorofluorescein (LeBel et al., 1992). However, it has been found to be quite sensitive to ambient O2 levels, and tends to be oxidized by illumination light alone. In addition, the dye is rapidly extruded from various preparations once it is oxidized. Therefore, a carboxylated analog of H2DCF (5-(and-6)-carboxy-2',7'-dichlorodihydrofluorescein diacetate) as well its di-acetoxymethyl ester [6-carboxy-2',7'-dichlorodihydrofluorescein diacetate, di(acetoxymethyl ester)] have been created, which show improved retention in living cells once they are oxidized (Hempel et al., 1999). Also, a derivative containing a thiol-reactive chloromethyl group is available (5-(and-6)-chloromethyl-2′, 7′-dichlorodihydrofluorescein diacetate [CM-H2DCFDA]) that enables binding to cellular thiol residues and thus improves cellular retention of the dye (Kirkland and Franklin, 2001). Despite these efforts, a high degree of cellular leakage remains common to all of the fluorescein-derived dyes.
HEt is the reduced, non-fluorescent form of ethidium, a marker for double stranded nucleic acids, i.e., DNA, which has been used to monitor ROS formation (Bindokas et al., 1996; Gallop et al., 1984). Once oxidized, it binds or intercalates to DNA, which results in a bright red fluorescence. Since the oxidized dye binds to double-stranded nucleic acids it produces a mostly nuclear staining pattern. Thus the location of fluorescence is misleading as is does not indicate the actual site of oxidation within the cell.
DHR123 is another popular redox indicator (Dugan et al., 1995), which resembles the reduced form of the classical ?? m indicator Rh123 (see above). DHR123 passively enters cells where it can be oxidized by various ROS species to the cationic fluorescent Rh123, which then accumulates in mitochondria (Dugan et al., 1995). Once in the mitochondria, Rh123 is sensitive to changes in the ?? m. Therefore, any further measurements of ROS formation will no longer be accurate, since changes in fluorescence will result from changes in the ?? m as well as ROS formation. Other ROS indicators include reduced, oxidation-sensitive variants of MitoTracker® compounds, which include MitoTracker® orange and MitoTracker® red. The oxidation of these compounds results in mitochondrial staining, similar to DHR123. Because the MitoTracker® dyes are basically not sensitive to changes in ?? m, artifactual changes in fluorescence are avoided.
A disadvantage of these ROS indicators is the lack of selectivity for specific ROS species. For example, the selectivity of HEt for ·O2− (Bindokas et al., 1996) and that of dichlorofluorescein (DCF) derivatives and DHR123 for H2O2 has been questioned in several studies (Batandier et al., 2002; Possel et al., 1997; Royall and Ischiropoulos, 1993). Another disadvantage is the extremely short lifetime of ·O2− (<1 μs) and OH·, which cause H2O2 and ONOO− to be the primary detectable ROS. Furthermore, ROS indicators are quite difficult to use experimentally. They are sensitive to ambient O2 levels, which is critical for physiological viability, and especially to repeated exposure to short wavelength (i.e., UV) illumination, inherent in imaging experiments. Their most serious drawback however, is that once oxidized, the dyes remain in their oxidized state of enhanced fluorescence. Therefore, equilibrium experiments and absolute quantification of cellular ROS levels, which are standard requirements for other ion-sensitive fluorophores such as Ca2+ indicators, are not possible with redox-sensitive dyes.
Recently, a redox-sensitive recombinant green fluorescent protein (GFP) has been developed, which does allow for equilibrium measurements, since its oxidation can be reversed. Its redox-sensing mechanism is based on the introduction of a cysteine pair that, depending on the oxidative status of its SH residues, forms a disulfide bond and modulates the fluorescence emission of the fluorescent protein. A previously introduced variant yellow fluorescent protein (YFP) shows a more than two-fold increase in fluorescence emission during oxidizing conditions (Ostergaard et al., 2001). However, recently a more advanced form of redox-sensitive GFP has been developed that exhibits two distinct absorption maxima, both of which are independently modulated in their absorption properties by the current relative redox state of the cell. Thus, ratiometric excitation is possible, ensuring a broader range of dynamic responses and more stable recording conditions (Hanson et al., 2004). Also, the initially slow response time of redox sensitive fluorescent proteins has been further improved (Cannon and Remington, 2006), which allows for real time monitoring of intracellular redox changes.
Another advantage of these recombinant redox-sensitive fluorescent proteins is that they can be targeted selectively to various cellular organelles or structures, such as the mitochondrion, nucleus and plasma membrane, or simply be distributed in the cytosol (Dooley et al., 2004). Unfortunately, however, these redox GFP indicators are not yet commercially available. Since their use requires cell transfection and subsequent cellular expression, their application is limited to cell/tissue cultures and organotypic slices. Therefore, at present, redox sensitive dyes are still the most commonly used tool for monitoring ROS in acute tissue preparations, such as brain slices.
Since we are interested in studying the role of ROS during both anoxic/ischemic mitochondrial inhibition and hSD, our group has performed experiments to directly visualize ROS formation in hippocampal pyramidal neurons, both in culture and in acute hippocampal slices. In these experiments we tested various DCF derivatives as well as HEt. To circumvent problems such as auto-oxidation by both room air and intense excitation light and to achieve stability of cellular fluorescence, we markedly lowered the frame rate of optical recordings to 15s or less.
In general, in hippocampal slices and cell cultures, HEt was better retained in cells than each of the DCF-derivatives tested. Nevertheless, we observed oxidation of DCF or HEt in response to CN-- or N2-mediated mitochondrial inhibition, mitochondrial uncoupling by FCCP, glutamate-mediated neuronal stimulation and H2O2-induced oxidative stress (Fig. 6A). The oxidation of HEt in response to chemical anoxia (CN−) (Fig. 6B) was decreased in the presence of the free radical scavengers Trolox and ascorbic acid. Since cellular retention of the oxidized dyes was poor following bath loading, we loaded cultured hippocampal neurons individually with H2DCF via patch pipette, to ensure a continuous supply of fresh, reduced dye, via direct cell perfusion (Fig. 6C). This type of loading resulted in bright fluorescence and more pronounced dye-oxidation in response to chemical anoxia or mitochondrial uncoupling. However, a disadvantage of the patch loading approach is that the cytosol becomes thoroughly perfused and diluted (Pusch and Neher, 1988), which alters cellular ROS levels and redox couples such as NADH/NAD+ and GSH/glutathione disulfide (GSSG).
Figure 6. Visualization of the cellular generation of ROS.

A) A cultured hippocampal neuron (loaded with HEt (5 μM)) was exposed to sequential applications of glutamate (500 μM), CN− (1 mM), H2O2 (500 μM) and FCCP (1 μM). ROS production was increased after each of the stimuli as indicated by the increase in HEt fluorescence. The transient nature of these HEt signals and the decrease in baseline indicates that oxidized HEt is rapidly extruded from the cultured neurons (Müller M. unpublished data).
B) Oxidation of HEt (5 μM) in a bulk loaded slice in response to CN−, i.e., chemical anoxia. Application of CN− within a few minutes resulted in the generation of ROS and thus increased HEt fluorescence. In contrast, the presence of the scavengers trolox (0.75 mM) and ascorbic acid (1 mM), decreased the oxidation of HEt by ~40%. The return of HEt fluorescence to baseline levels again suggests rapid extrusion of the oxidized dye from bulk-loaded slices (Müller M. unpublished data).
C) Loading of H2DCF (100 μM) into hippocampal neurons via patch-pipette (Pusch and Neher, 1988). This is a technique often used in conjunction with fluorescence compounds such as Ca2+ indicators or Rh123 (Schuchmann et al., 2000). ROS generation is shown for an H2DCF-loaded hippocampal pyramidal neuron exposed to the mitochondrial uncoupler FCCP. The images show DCF fluorescence intensity recorded before and at the height of FCCP application; fluorescence intensity is displayed in an 8 bit (256 shades) gray scale color code. As a consequence of the higher dye-load, the FCCP-induced increase in DCF fluorescence was more pronounced than in cultured cells bulk loaded by external dye application. A frame rate of 15s was chosen to minimize oxidation of the redox-sensitive dye by excitation light (Müller M. unpublished data).
5.7 Mitochondrial Ca2+ measurements
Mitochondrial Ca2+ levels play a significant role in both regulation of mitochondrial metabolic activity (via cytosolic Ca2+ uptake with activity) and intracellular Ca2+ homeostasis in the nervous system. Ca2+ dynamics within mitochondria illustrate and closely follow mitochondrial function, and can be evaluated with optical imaging. Mitochondria maintain a low resting intra-mitochondrial Ca2+, which is sustained by the Na+/Ca2+ exchanger, which exports Ca2+ against a strong electrochemical gradient. Although the inner mitochondrial membrane is not freely permeable to ions, mitochondria can import Ca2+ from the cytoplasm through a potential-driven Ca2+ uniporter, facilitated by the negative ?? m (Jacobson and Duchen, 2004).
Mitochondrial Ca2+ uptake may play various roles, depending on cell function and condition. For example, physiological fluctuation of Ca2+ levels in the mitochondria has an important regulatory role in ATP production, since the three rate limiting enzymes of the citric acid cycle (pyruvate dehydrogenase, 2-oxoglutarate dehydrogenase, and NAD+-isocitrate dehydrogenase) are all activated and modulated by Ca2+ (Duchen, 2000). To support this hypothesis, some studies have shown that a physiological increase in intracellular Ca2+ causes an increase in the NADH/NAD+ ratio (Duchen, 1992; Hayakawa et al., 2005). Mitochondria also serve as a cellular Ca2+ buffering system, as several studies have shown that agents that block mitochondrial Ca2+ uptake severely compromise the clearance of Ca2+ in the cytosol after a stimulus-induced rise in intracellular Ca2+ (White and Reynolds, 1995). Therefore mitochondria may be neuroprotective by lowering and buffering Ca2+ in the cytosol after excitotoxic stimuli, probably in concert with smooth ER. However, mitochondria may have a limited Ca2+ buffering capacity, as numerous studies have demonstrated that intramitochondrial Ca2+ accumulation in neurons after an excitotoxic insult can result in significant neuronal injury (Stout et al., 1998). When mitochondria are exposed to high Ca2+ levels, Ca2+ uptake may interfere with mitochondrial function, leading to the activation of mPT and cell death pathways such as apoptosis or necrosis. For example mitochondrial Ca2+ accumulation can lead to ROS formation, mitochondrial membrane depolarization, mPT, and a secondary increase in [Ca2+]i (Bindokas et al., 1998; Carriedo et al., 2000).
5.7.1 Mitochondrial Ca2+ imaging
Concepts concerning Ca2+ regulation in mitochondria originated from studies where the mitochondrial Ca2+ uptake was monitored in either isolated mitochondria, or indirectly in cell culture or tissue slices, using cytosolic Ca2+ indicators. Recently, due to advances in imaging techniques such as fast scanning confocal microscopy, two-photon microscopy and deconvolution processing, and the availability of new optical indicators for Ca2+ ions, it is possible to study mitochondrial Ca2+ uptake directly at subcellular levels in living cells. These advances may enhance investigations into the role that Ca2+ may play in regulating mitochondrial function and dysfunction.
A variety of fluorophores is now available for the probing of both intracellular and intra-organelle Ca2+ levels. Acetoxymethyl ester derivatives of fluorescent Ca2+ indicators, such as fura-2, Calcium Green, and Fluo-3, diffuse into cell organelles, including the mitochondria and the ER. However, a variety of factors, such as the chemical structure of the dye, the loading condition and cell type, may strongly influence the degree of compartmentalization of the calcium dye in the target organelle (Takahashi et al., 1999).
The cell permeable form of the rhodamine based Ca2+ indicator (rhod-2 AM) is currently the best candidate for monitoring Ca2+ transients in mitochondria. Rhod-2 is a multivalent cation (Minta et al., 1989) after being cleaved from its membrane-permeable ester form, and is preferentially accumulated in the mitochondria due to the highly negative ?? m (Takahashi et al., 1999). However, selective loading of the dye in mitochondria does require specific loading conditions because of the residual cytosolic dye presence, which may interfere with monitoring mitochondrial Ca2+ levels.
In an early study, isolated cardiac myocytes were incubated with rhod-2 at 4 ºC for 1 h, which allowed the dye to penetrate in the organelles before being hydrolyzed by the cytosolic esterases, which are less active at this temperature. This step was followed by incubation in dye-free solution at 37 ºC for 3–5 hr. At this temperature, the matrix-loaded dye was cleaved by the mitochondrial esterases and trapped inside the organelles due to its positive charges, while dye in the cytosol was likely to be removed by plasma membrane transporters and leakage (Duchen et al., 2003). After these procedures, rhod-2 was concentrated only in punctate subcellular regions corresponding to mitochondria (the staining was more homogeneous when the 37 ºC incubation step was omitted). Electrical stimulation resulted in a strong transient increase in fluorescence in the bright mitochondrial regions; while the areas between the mitochondria remained dark or had a moderate fluorescence increase (Trollinger et al., 1997). Although, various investigators have used different bath-loading protocols, the crucial step in the protocol to obtain selective loading in the mitochondria is the method of incubation after the dye loading. This step should be sufficiently prolonged to allow for the dye to be extruded from the cytosol.
Rhod-2 is a long wavelength Ca2+ indicator (excitation at 552 nm and emission maxima at 581nm) and can be used in combination with lower wavelength cytosolic Ca2+ indicators, such as fluo-3, fluo-4, Calcium Green-1, Oregon Green 488 BAPTA-1 (excitation at 435 nm and emission maxima at 450 nm), fura-2 or indo-1 (excitation at 340/380 nm, with emission maxima at 510 nm). With this dual-dye technique it is possible to simultaneously measure changes in cytosolic Ca2+ and mitochondrial Ca2+ concentrations. For example, using fluorescence deconvolution processing in chromaffin cells double-labeled with rhod-2 AM (1 μM, 35–50 min at 22–25 ºC) and Calcium Green-1 AM (12 μM), it was possible to distinguish a more diffuse distribution of the Calcium Green-1 fluorescence compared with the characteristic punctate appearance of the rhod-2 signal (Babcock et al., 1997). In addition to bath-loading, the cytosolic calcium indicators can also be loaded via patch pipette during whole-cell recording, using the membrane-impermeant form of the dye after bath-loading mitochondria with rhod-2. Several investigators have used this method successfully in cell culture (Babcock et al., 1997), hippocampal slice cultures (Kann et al., 2003) and in acute brain stem slices (Ladewig et al., 2003).
The advantages of this technique are that the cytosolic dye is confined to the cytosol without being compartmentalized either in the mitochondria or the ER, and loading the dye via a patch pipette intrinsically allows the residual cytosolic rhod-2 to be removed from the cell. As mentioned above, the composition of the cytosol as well as Ca2+ transients may be affected by this approach.
With this dual labeling technique it is possible to study the dynamic relationship of Ca2+ transients between the mitochondria and the cytosol. For example a rise in [Ca2+]i in response to plasma membrane depolarization, due to glutamate application or neuronal stimulation, leads to mitochondrial Ca2+ uptake. The kinetics of the two Ca2+ signals differ, with Ca2+ changes in the mitochondria being more sustained than Ca2+ transients in the cytosol, demonstrating that they indeed reflect Ca2+ changes in two separate compartments. In addition it was possible to directly demonstrate that slower cytosolic Ca2+ clearance after the application of the mitochondrial uncoupler CCCP is due to the inhibition of mitochondrial Ca2+ uptake (Babcock et al., 1997).
However there is the possibility that rhod-2 fluorescence could originate partially from the dye trapped in the cytosol and therefore reflect Ca2+changes occurring in both the mitochondrial and the cytosolic compartments. Therefore mitochondria-specific Ca2+indicators (rhod-2) have been used in combination with mitochondria specific markers, such as MitoTracker® Green, to differentiate between mitochondrial and cytosolic rhod-2 fluorescence (Kovacs et al., 2005). The co-localization of both dyes studied by alternating excitation at 488 and 543 nm with a confocal microscope revealed that the dotted rhod-2 fluorescence is colocalized with MitoTracker® Green, and represents intramitochondrial Ca2+. This approach, in combination with high resolution imaging techniques such as confocal or two-photon microscopy, allows monitoring of mitochondrial Ca2+ transients at subcellular levels. For example, using rhod-2 or a lower Ca2+binding affinity variant rhod-ff (Kd 570 nM and Kd 19 μM respectively), it was possible to distinguish within CA3 pyramidal neurons a heterogeneous population of mitochondria, which displays different degrees of Ca2+ uptake during epileptic activity (Kovacs et al., 2005).
In addition, spatial filtering-based methods have been used to differentiate between cytosolic and mitochondrial rhod-2 signals, based on their large size differences. This method, first published by Adam-Vizi in 2001, used brain capillary endothelial cells loaded with rhod-2 derivatives X-rhod-1 (Kd 700 nm) or X-rhod 5 N (Kd 350 μM) (Ex/Em 580/602 nm) and MitoTracker® Green, and high resolution imaging. After the images were decomposed into a spatial frequency representation using a Fourier transformation, it was then possible to distinguish between a high frequency spatial signal represented by the mitochondria, and a low frequency spatial signal represented by the cytosol. This method effectively applies a high pass filter function to remove the cytosolic background component and measure changes in intramitochondrial Ca2+ selectively (Gerencser and Adam-Vizi, 2001; Kovacs et al., 2005). It also allows the detection of “hot spots” and barriers (that limit the diffusion of the mitochondrial Ca2+ signal) within the mitochondrial areas with more intensive Ca2+ uptake (Gerencser and Adam-Vizi, 2005).
5.7.2 Electron probe x-ray microanalysis
The use of fluorescence Ca2+ indicators offers the advantage of monitoring Ca2+ dynamics in real time, allowing for the measurement of rapid changes in mitochondrial Ca2+ concentration. However, the exact magnitude of mitochondrial Ca2+accumulation can be difficult to estimate because of dye saturation. In addition, problems with dye leakage (especially at physiological temperature) and photo bleaching may limit the ability to monitor changes in Ca2+ concentration over long periods of time. Therefore, several investigators have utilized the electron probe x-ray microanalysis technique to overcome many of these limitations.
Electron probe x-ray microanalysis is a quantitative electron microscopic technique that measures both water content (%) and total (free plus bound) concentration of biologically relevant elements (i.e., Na+, K+, Ca2+ in mmol/kg dry or wet weight) simultaneously in cellular compartments. This technique permits optical identification of individual cells and analysis of respective subcellular compartments such as the mitochondria and nuclei (LoPachin and Lehning, 1997; Meldolesi and Grohovaz, 2001). Therefore, after samples are rapidly frozen at various time points during the experiment, changes in Ca2+ concentration can be measured simultaneously in different cells, subcellular regions and organelles. For example, because of the accurate spatial resolution of this method it was possible to measure a rapid mitochondrial Ca2+ increase in the proximal dendrites of CA3 pyramidal neurons after synaptic stimulation in cultured hippocampal slices (Pivovarova et al., 2002). Mitochondria gradually accumulate Ca2+ (1–30 sec) after the stimulus in response to a local rise in intracellular Ca2+. This event is followed by a larger sequestration of Ca2+ in the ER, suggesting that after synaptic stimulation mitochondria serve as buffer systems in collaboration with the ER to modulate cytosolic Ca2+ signals (Pivovarova et al., 2002).
Another advantage of electron probe x-ray microanalysis is that changes in Ca2+ levels can be monitored at different times up to several hours after exposure to various treatments. For example this technique has been useful in determining the long-term effects of an ischemic insult or glutamate exposure on ionic distribution in hippocampal slices. Using electron probe x-ray microanalysis it was demonstrated during oxygen and glucose deprivation that Ca2+, Na+ and Cl− progressively accumulate in the cytoplasm and in the mitochondria in hippocampal slices (LoPachin et al., 2001; Taylor et al., 1999). Interestingly, during reoxygenation (30 min) ionic homeostasis failed to recover, and there was an exacerbation of mitochondrial Ca2+ influx compared with other cellular compartments (70 vs. 43 mmol/kg/dry weight) (LoPachin et al., 2001). Similarly, in cultured hippocampal neurons application of NMDA (200 μM for 20 min) induced mitochondrial dysfunction and a large mitochondrial Ca2+ uptake (529 mmol/kg/dry weight), similar to the Ca2+ concentration required in isolated mitochondria to induce cytochrome-c release. However, there was a difference in the vulnerability to the insult among various neurons. In some cases depending on the degree of Ca2+accumulation the changes in the mitochondria were reversible, but if the accumulation persisted (i.e., elevated Ca2+ levels 2 hours after the insult), mitochondria became irreversibly damaged and the cells were more likely to undergo cell death (Pivovarova et al., 2004). Limiting mitochondrial Ca2+ load after an excitotoxic insult with Ca2+ channel blockers, NMDA antagonists and FCCP diminished neuronal damage (LoPachin et al., 2001; Pivovarova et al., 2004), suggesting that normally, mitochondria have an important role in Ca2+ buffering. However, if during an insult Ca2+ accumulation exceeds the available mitochondrial buffering capacity, injured mitochondria may become responsible for the activation of cell death mechanisms.
6.0 Conclusions
Recent efforts in the investigation of mitochondrial function in intact neurons and the brain in vivo have built upon the considerable knowledge of biochemical pathways and structural organization of mitochondria obtained from studies using isolated mitochondrial preparations. Current research efforts are using a number of classical and emerging experimental techniques within in vitro and in vivo preparations to elucidate the multiple different functional roles that mitochondria exert within the brain. In particular, we have highlighted interests in developing techniques that allow the investigation of mitochondria within their physiological environment as well as their interactions with other cell structures.
In addition, there has been increasing interest in the possible roles that mitochondrial dysfunction may play in several neurological disorders. Events such as increases in ROS production, release of apoptotic factors and calcium accumulation are considered indicators of acute mitochondrial injury after conditions such as ischemia or traumatic brain injury and may be crucial in determining cell death. The application of multiparametrical approaches to study mitochondrial function and dysfunction using the optical and pharmacological tools summarized in this review, allows for the examination of these events in real time. As a result, more information is provided regarding spatial distribution and temporal dynamics, which allows for the identification of specific targets for potential therapeutic interventions.
Acknowledgments
We are grateful to Prof. G. G. Somjen for a critical reading of an earlier version of the manuscript. This study was supported by the DFG research center Molecular Physiology of the Brain, CMPB (MM); SFB 406-TP C14 (MM); Göttingen University (Ausstattungsmittel Juniorprofessur, MM); NIH Grants R21 NS45304 and R01 NS051856-01 (DAT); and by Department of Veterans Affairs Merit Review Research Award (DAT).
Footnotes
Publisher's Disclaimer: This is a PDF file of an unedited manuscript that has been accepted for publication. As a service to our customers we are providing this early version of the manuscript. The manuscript will undergo copyediting, typesetting, and review of the resulting proof before it is published in its final citable form. Please note that during the production process errors may be discovered which could affect the content, and all legal disclaimers that apply to the journal pertain.
References
- Ainscow EK, Mirshamsi S, Tang T, Ashford ML, Rutter GA. Dynamic imaging of free cytosolic ATP concentration during fuel sensing by rat hypothalamic neurones: evidence for ATP-independent control of ATP-sensitive K+ channels. J Physiol. 2002;544:429–45. doi: 10.1113/jphysiol.2002.022434. [DOI] [PMC free article] [PubMed] [Google Scholar]
- Albracht SP, van der Linden E, Faber BW. Quantitative amino acid analysis of bovine NADH: ubiquinone oxidoreductase (Complex I) and related enzymes. Consequences for the number of prosthetic groups. Biochim Biophys Acta. 2003;1557:41–9. doi: 10.1016/s0005-2728(02)00393-6. [DOI] [PubMed] [Google Scholar]
- Allen NJ, Karadottir R, Attwell D. A preferential role for glycolysis in preventing the anoxic depolarization of rat hippocampal area CA1 pyramidal cells. J Neurosci. 2005;25:848–59. doi: 10.1523/JNEUROSCI.4157-04.2005. [DOI] [PMC free article] [PubMed] [Google Scholar]
- Almeida A, Bolanos JP. A transient inhibition of mitochondrial ATP synthesis by nitric oxide synthase activation triggered apoptosis in primary cortical neurons. J Neurochem. 2001;77:676–90. doi: 10.1046/j.1471-4159.2001.00276.x. [DOI] [PubMed] [Google Scholar]
- Amchenkova AA, Bakeeva LE, Chentsov YS, Skulachev VP, Zorov DB. Coupling membranes as energy-transmitting cables. I. Filamentous mitochondria in fibroblasts and mitochondrial clusters in cardiomyocytes. J Cell Biol. 1988;107:481–95. doi: 10.1083/jcb.107.2.481. [DOI] [PMC free article] [PubMed] [Google Scholar]
- Ames A., 3rd CNS energy metabolism as related to function. Brain Res Brain Res Rev. 2000;34:42–68. doi: 10.1016/s0165-0173(00)00038-2. [DOI] [PubMed] [Google Scholar]
- Amiry-Moghaddam M, Lindland H, Zelenin S, Roberg BA, Gundersen BB, Petersen P, Rinvik E, Torgner IA, Ottersen OP. Brain mitochondria contain aquaporin water channels: evidence for the expression of a short AQP9 isoform in the inner mitochondrial membrane. Faseb J. 2005;19:1459–67. doi: 10.1096/fj.04-3515com. [DOI] [PubMed] [Google Scholar]
- Anderson RE, Tan WK, Martin HS, Meyer FB. Effects of glucose and PaO2 modulation on cortical intracellular acidosis, NADH redox state, and infarction in the ischemic penumbra. Stroke. 1999;30:160–70. doi: 10.1161/01.str.30.1.160. [DOI] [PubMed] [Google Scholar]
- Atkins CM, Sweatt JD. Reactive oxygen species mediate activity-dependent neuron-glia signaling in output fibers of the hippocampus. J Neurosci. 1999;19:7241–8. doi: 10.1523/JNEUROSCI.19-17-07241.1999. [DOI] [PMC free article] [PubMed] [Google Scholar]
- Babcock DF, Herrington J, Goodwin PC, Park YB, Hille B. Mitochondrial participation in the intracellular Ca2+ network. J Cell Biol. 1997;136:833–44. doi: 10.1083/jcb.136.4.833. [DOI] [PMC free article] [PubMed] [Google Scholar]
- Babcock GT. How oxygen is activated and reduced in respiration. Proc Natl Acad Sci U S A. 1999;96:12971–3. doi: 10.1073/pnas.96.23.12971. [DOI] [PMC free article] [PubMed] [Google Scholar]
- Bahar S, Fayuk D, Somjen GG, Aitken PG, Turner DA. Mitochondrial and intrinsic optical signals imaged during hypoxia and spreading depression in rat hippocampal slices. J Neurophysiol. 2000;84:311–24. doi: 10.1152/jn.2000.84.1.311. [DOI] [PubMed] [Google Scholar]
- Balaban RS. Regulation of oxidative phosphorylation in the mammalian cell. Am J Physiol. 1990;258:C377–89. doi: 10.1152/ajpcell.1990.258.3.C377. [DOI] [PubMed] [Google Scholar]
- Barja G. Mitochondrial oxygen radical generation and leak: sites of production in states 4 and 3, organ specificity, and relation to aging and longevity. J Bioenerg Biomembr. 1999;31:347–66. doi: 10.1023/a:1005427919188. [DOI] [PubMed] [Google Scholar]
- Barja G, Herrero A. Localization at complex I and mechanism of the higher free radical production of brain nonsynaptic mitochondria in the short-lived rat than in the longevous pigeon. J Bioenerg Biomembr. 1998;30:235–43. doi: 10.1023/a:1020592719405. [DOI] [PubMed] [Google Scholar]
- Batandier C, Fontaine E, Keriel C, Leverve XM. Determination of mitochondrial reactive oxygen species: methodological aspects. J Cell Mol Med. 2002;6:175–87. doi: 10.1111/j.1582-4934.2002.tb00185.x. [DOI] [PMC free article] [PubMed] [Google Scholar]
- Bechmann I, Diano S, Warden CH, Bartfai T, Nitsch R, Horvath TL. Brain mitochondrial uncoupling protein 2 (UCP2): a protective stress signal in neuronal injury. Biochem Pharmacol. 2002;64:363–7. doi: 10.1016/s0006-2952(02)01166-8. [DOI] [PubMed] [Google Scholar]
- Beckman JS, Beckman TW, Chen J, Marshall PA, Freeman BA. Apparent hydroxyl radical production by peroxynitrite: implications for endothelial injury from nitric oxide and superoxide. Proc Natl Acad Sci U S A. 1990;87:1620–4. doi: 10.1073/pnas.87.4.1620. [DOI] [PMC free article] [PubMed] [Google Scholar]
- Behl C, Moosmann B. Oxidative nerve cell death in Alzheimer's disease and stroke: antioxidants as neuroprotective compounds. Biol Chem. 2002;383:521–36. doi: 10.1515/BC.2002.053. [DOI] [PubMed] [Google Scholar]
- Bereiter-Hahn J. Behavior of Mitochondria in the Living Cell. Int Rev of Cytology. 1990;122:1–63. doi: 10.1016/s0074-7696(08)61205-x. [DOI] [PubMed] [Google Scholar]
- Berg JM, Tymoczko JL, Stryer L. Biochemistry. W.H. Freeman; New York: 2002. [Google Scholar]
- Bergmann F, Keller BU. Impact of mitochondrial inhibition on excitability and cytosolic Ca2+ levels in brainstem motoneurones from mouse. J Physiol. 2004;555:45–59. doi: 10.1113/jphysiol.2003.053900. [DOI] [PMC free article] [PubMed] [Google Scholar]
- Bindokas VP, Jordan J, Lee CC, Miller RJ. Superoxide production in rat hippocampal neurons: selective imaging with hydroethidine. J Neurosci. 1996;16:1324–36. doi: 10.1523/JNEUROSCI.16-04-01324.1996. [DOI] [PMC free article] [PubMed] [Google Scholar]
- Bindokas VP, Lee CC, Colmers WF, Miller RJ. Changes in mitochondrial function resulting from synaptic activity in the rat hippocampal slice. J Neurosci. 1998;18:4570–87. doi: 10.1523/JNEUROSCI.18-12-04570.1998. [DOI] [PMC free article] [PubMed] [Google Scholar]
- Biscoe TJ, Duchen MR. Responses of type I cells dissociated from the rabbit carotid body to hypoxia. J Physiol. 1990;428:39–59. doi: 10.1113/jphysiol.1990.sp018199. [DOI] [PMC free article] [PubMed] [Google Scholar]
- Boveris A, Chance B. The mitochondrial generation of hydrogen peroxide. General properties and effect of hyperbaric oxygen. Biochem J. 1973;134:707–16. doi: 10.1042/bj1340707. [DOI] [PMC free article] [PubMed] [Google Scholar]
- Bowers KC, Allshire AP, Cobbold PH. Continuous measurements of cytoplasmic ATP in single cardiomyocytes during simulation of the “oxygen paradox”. Cardiovasc Res. 1993;27:1836–9. doi: 10.1093/cvr/27.10.1836. [DOI] [PubMed] [Google Scholar]
- Brines ML, Tabuteau H, Sundaresan S, Kim J, Spencer DD, de Lanerolle N. Regional distributions of hippocampal Na+,K+-ATPase, cytochrome oxidase, and total protein in temporal lobe epilepsy. Epilepsia. 1995;36:371–83. doi: 10.1111/j.1528-1157.1995.tb01012.x. [DOI] [PubMed] [Google Scholar]
- Briones TL, Suh E, Jozsa L, Rogozinska M, Woods J, Wadowska M. Changes in number of synapses and mitochondria in presynaptic terminals in the dentate gyrus following cerebral ischemia and rehabilitation training. Brain Res. 2005;1033:51–7. doi: 10.1016/j.brainres.2004.11.017. [DOI] [PubMed] [Google Scholar]
- Brown MR, Sullivan PG, Geddes JW. Synaptic mitochondria are more susceptible to Ca2+ overload than nonsynaptic mitochondria. J Biol Chem. 2006;281:11658–68. doi: 10.1074/jbc.M510303200. [DOI] [PubMed] [Google Scholar]
- Brustovetsky N, Brustovetsky T, Purl KJ, Capano M, Crompton M, Dubinsky JM. Increased susceptibility of striatal mitochondria to calcium-induced permeability transition. J Neurosci. 2003;23:4858–67. doi: 10.1523/JNEUROSCI.23-12-04858.2003. [DOI] [PMC free article] [PubMed] [Google Scholar]
- Brustovetsky N, Dubinsky JM. Limitations of cyclosporin A inhibition of the permeability transition in CNS mitochondria. J Neurosci. 2000;20:8229–37. doi: 10.1523/JNEUROSCI.20-22-08229.2000. [DOI] [PMC free article] [PubMed] [Google Scholar]
- Buckingham SD, Esmaeili B, Wood M, Sattelle DB. RNA interference: from model organisms towards therapy for neural and neuromuscular disorders. Hum Mol Genet 13 Spec No. 2004;2:R275–88. doi: 10.1093/hmg/ddh224. [DOI] [PubMed] [Google Scholar]
- Buckler KJ, Vaughan-Jones RD. Effects of mitochondrial uncouplers on intracellular calcium, pH and membrane potential in rat carotid body type I cells. J Physiol. 1998;513 (Pt 3):819–33. doi: 10.1111/j.1469-7793.1998.819ba.x. [DOI] [PMC free article] [PubMed] [Google Scholar]
- Buckman JF, Hernandez H, Kress GJ, Votyakova TV, Pal S, Reynolds IJ. MitoTracker labeling in primary neuronal and astrocytic cultures: influence of mitochondrial membrane potential and oxidants. J Neurosci Methods. 2001;104:165–76. doi: 10.1016/s0165-0270(00)00340-x. [DOI] [PubMed] [Google Scholar]
- Buckman JF, Reynolds IJ. Spontaneous changes in mitochondrial membrane potential in cultured neurons. J Neurosci. 2001;21:5054–65. doi: 10.1523/JNEUROSCI.21-14-05054.2001. [DOI] [PMC free article] [PubMed] [Google Scholar]
- Budd SL, Nicholls DG. A reevaluation of the role of mitochondria in neuronal Ca2+ homeostasis. J Neurochem. 1996;66:403–11. doi: 10.1046/j.1471-4159.1996.66010403.x. [DOI] [PubMed] [Google Scholar]
- Cadenas E, Davies KJ. Mitochondrial free radical generation, oxidative stress, and aging. Free Radic Biol Med. 2000;29:222–30. doi: 10.1016/s0891-5849(00)00317-8. [DOI] [PubMed] [Google Scholar]
- Cain K, Partis MD, Griffiths DE. Dibutylchloromethyltin chloride, a covalent inhibitor of the adenosine triphosphate synthase complex. Biochem J. 1977;166:593–602. doi: 10.1042/bj1660593. [DOI] [PMC free article] [PubMed] [Google Scholar]
- Calabresi P, Gubellini P, Picconi B, Centonze D, Pisani A, Bonsi P, Greengard P, Hipskind RA, Borrelli E, Bernardi G. Inhibition of mitochondrial complex II induces a long-term potentiation of NMDA-mediated synaptic excitation in the striatum requiring endogenous dopamine. J Neurosci. 2001;21:5110–20. doi: 10.1523/JNEUROSCI.21-14-05110.2001. [DOI] [PMC free article] [PubMed] [Google Scholar]
- Cannon MB, Remington SJ. Re-engineering redox-sensitive green fluorescent protein for improved response rate. Protein Sci. 2006;15:45–57. doi: 10.1110/ps.051734306. [DOI] [PMC free article] [PubMed] [Google Scholar]
- Capaldi RA, Murray J, Byrne L, Janes MS, Marusich MF. Immunological approaches to the characterization and diagnosis of mitochondrial disease. Mitochondrion. 2004;4:417–26. doi: 10.1016/j.mito.2004.07.006. [DOI] [PubMed] [Google Scholar]
- Carafoli E. Intracellular calcium homeostasis. Annu Rev Biochem. 1987;56:395–433. doi: 10.1146/annurev.bi.56.070187.002143. [DOI] [PubMed] [Google Scholar]
- Carriedo SG, Sensi SL, Yin HZ, Weiss JH. AMPA exposures induce mitochondrial Ca2+ overload and ROS generation in spinal motor neurons in vitro. J Neurosci. 2000;20:240–50. doi: 10.1523/JNEUROSCI.20-01-00240.2000. [DOI] [PMC free article] [PubMed] [Google Scholar]
- Casteilla L, Rigoulet M, Penicaud L. Mitochondrial ROS metabolism: modulation by uncoupling proteins. IUBMB Life. 2001;52:181–8. doi: 10.1080/15216540152845984. [DOI] [PubMed] [Google Scholar]
- Castejon OJ, de Castejon HV. Structural patterns of injured mitochondria in human oedematous cerebral cortex. Brain Inj. 2004;18:1107–26. doi: 10.1080/02699050410001672332. [DOI] [PubMed] [Google Scholar]
- Chalfie M, Tu Y, Euskirchen G, Ward WW, Prasher DC. Green fluorescent protein as a marker for gene expression. Science. 1994;263:802–5. doi: 10.1126/science.8303295. [DOI] [PubMed] [Google Scholar]
- Chan PH. Role of oxidants in ischemic brain damage. Stroke. 1996;27:1124–9. doi: 10.1161/01.str.27.6.1124. [DOI] [PubMed] [Google Scholar]
- Chan PH. Reactive oxygen radicals in signaling and damage in the ischemic brain. J Cereb Blood Flow Metab. 2001;21:2–14. doi: 10.1097/00004647-200101000-00002. [DOI] [PubMed] [Google Scholar]
- Chan PH. Mitochondria and neuronal death/survival signaling pathways in cerebral ischemia. Neurochem Res. 2004;29:1943–9. doi: 10.1007/s11064-004-6869-x. [DOI] [PubMed] [Google Scholar]
- Chan WC, Nie S. Quantum dot bioconjugates for ultrasensitive nonisotopic detection. Science. 1998;281:2016–8. doi: 10.1126/science.281.5385.2016. [DOI] [PubMed] [Google Scholar]
- Chance B, Cohen P, Jöbsis F, Schoener B. Intracellular oxidation-reduction states in vivo. Science. 1962;137:499–508. doi: 10.1126/science.137.3529.499. [DOI] [PubMed] [Google Scholar]
- Chance B, Williams GR. Respiratory enzymes in oxidative phosphorylation. II. Difference spectra. J Biol Chem. 1955;217:395–407. [PubMed] [Google Scholar]
- Chen Q, Vazquez EJ, Moghaddas S, Hoppel CL, Lesnefsky EJ. Production of reactive oxygen species by mitochondria: central role of complex III. J Biol Chem. 2003;278:36027–31. doi: 10.1074/jbc.M304854200. [DOI] [PubMed] [Google Scholar]
- Chinopoulos C, Starkov AA, Fiskum G. Cyclosporin A-insensitive permeability transition in brain mitochondria: inhibition by 2-aminoethoxydiphenyl borate. J Biol Chem. 2003;278:27382–9. doi: 10.1074/jbc.M303808200. [DOI] [PubMed] [Google Scholar]
- Chuang YC, Chang AY, Lin JW, Hsu SP, Chan SH. Mitochondrial dysfunction and ultrastructural damage in the hippocampus during kainic acid-induced status epilepticus in the rat. Epilepsia. 2004;45:1202–9. doi: 10.1111/j.0013-9580.2004.18204.x. [DOI] [PubMed] [Google Scholar]
- Cobbold PH, Rink TJ. Fluorescence and bioluminescence measurement of cytoplasmic free calcium. Biochem J. 1987;248:313–28. doi: 10.1042/bj2480313. [DOI] [PMC free article] [PubMed] [Google Scholar]
- Coles CJ, Edmondson DE, Singer TP. Inactivation of succinate dehydrogenase by 3-nitropropionate. J Biol Chem. 1979;254:5161–7. [PubMed] [Google Scholar]
- Cooper JM, Schapira AH. Mitochondrial dysfunction in neurodegeneration. J Bioenerg Biomembr. 1997;29:175–83. doi: 10.1023/a:1022642114734. [DOI] [PubMed] [Google Scholar]
- Crompton M. The regulation of mitochondrial calcium transport in heart. Curr Top Membr Transp. 1985;25:231–276. [Google Scholar]
- Crompton M. The mitochondrial permeability transition pore and its role in cell death. Biochem J. 1999;341 (Pt 2):233–49. [PMC free article] [PubMed] [Google Scholar]
- D'Souza GG, Weissig V. Approaches to mitochondrial gene therapy. Curr Gene Ther. 2004;4:317–28. doi: 10.2174/1566523043346200. [DOI] [PubMed] [Google Scholar]
- da-Silva WS, Gomez-Puyou A, de Gomez-Puyou MT, Moreno-Sanchez R, De Felice FG, de Meis L, Oliveira MF, Galina A. Mitochondrial bound hexokinase activity as a preventive antioxidant defense: steady-state ADP formation as a regulatory mechanism of membrane potential and reactive oxygen species generation in mitochondria. J Biol Chem. 2004;279:39846–55. doi: 10.1074/jbc.M403835200. [DOI] [PubMed] [Google Scholar]
- Dahl HH. Getting to the nucleus of mitochondrial disorders: identification of respiratory chain-enzyme genes causing Leigh syndrome. Am J Hum Genet. 1998;63:1594–7. doi: 10.1086/302169. [DOI] [PMC free article] [PubMed] [Google Scholar]
- de la Monte SM, Luong T, Neely TR, Robinson D, Wands JR. Mitochondrial DNA damage as a mechanism of cell loss in Alzheimer's disease. Lab Invest. 2000;80:1323–35. doi: 10.1038/labinvest.3780140. [DOI] [PubMed] [Google Scholar]
- De Vos KJ, Allan VJ, Grierson AJ, Sheetz MP. Mitochondrial function and actin regulate dynamin-related protein 1-dependent mitochondrial fission. Curr Biol. 2005;15:678–83. doi: 10.1016/j.cub.2005.02.064. [DOI] [PubMed] [Google Scholar]
- Dean RT, Fu S, Stocker R, Davies MJ. Biochemistry and pathology of radical-mediated protein oxidation. Biochem J. 1997;324 (Pt 1):1–18. doi: 10.1042/bj3240001. [DOI] [PMC free article] [PubMed] [Google Scholar]
- Dedov VN, Roufogalis BD. Organisation of mitochondria in living sensory neurons. FEBS Lett. 1999;456:171–4. doi: 10.1016/s0014-5793(99)00951-5. [DOI] [PubMed] [Google Scholar]
- Degli Esposti M. Inhibitors of NADH-ubiquinone reductase: an overview. Biochim Biophys Acta. 1998;1364:222–35. doi: 10.1016/s0005-2728(98)00029-2. [DOI] [PubMed] [Google Scholar]
- Demchenko IT, Oury TD, Crapo JD, Piantadosi CA. Regulation of the brain's vascular responses to oxygen. Circ Res. 2002;91:1031–7. doi: 10.1161/01.res.0000043500.03647.81. [DOI] [PubMed] [Google Scholar]
- Denk W, Strickler JH, Webb WW. Two-photon laser scanning fluorescence microscopy. Science. 1990;248:73–6. doi: 10.1126/science.2321027. [DOI] [PubMed] [Google Scholar]
- Derfus AM, Chan WCW, Bhatia SN. Intracellular delivery of quantum dots for live cell labelling and organelle tracking. Advanced Materials. 2004;16:961–966. [Google Scholar]
- Derfus AM, Chan WCW, Bhatia SN. Probing the cytotoxicity of semiconductor quantum dots. Nano Letters. 2004;4:11–18. doi: 10.1021/nl0347334. [DOI] [PMC free article] [PubMed] [Google Scholar]
- Dooley CT, Dore TM, Hanson GT, Jackson WC, Remington SJ, Tsien RY. Imaging dynamic redox changes in mammalian cells with green fluorescent protein indicators. J Biol Chem. 2004;279:22284–93. doi: 10.1074/jbc.M312847200. [DOI] [PubMed] [Google Scholar]
- Douglas RM, Lai JC, Bian S, Cummins L, Moczydlowski E, Haddad GG. The calcium-sensitive large-conductance potassium channel (BK/MAXI K) is present in the inner mitochondrial membrane of rat brain. Neuroscience. 2006;139:1249–61. doi: 10.1016/j.neuroscience.2006.01.061. [DOI] [PubMed] [Google Scholar]
- Dröge W. Free radicals in the physiological control of cell function. Physiol Rev. 2002;82:47–95. doi: 10.1152/physrev.00018.2001. [DOI] [PubMed] [Google Scholar]
- Duchen MR. Ca2+-dependent changes in the mitochondrial energetics in single dissociated mouse sensory neurons. Biochem J. 1992;283 (Pt 1):41–50. doi: 10.1042/bj2830041. [DOI] [PMC free article] [PubMed] [Google Scholar]
- Duchen MR. Contributions of mitochondria to animal physiology: from homeostatic sensor to calcium signalling and cell death. J Physiol. 1999;516 (Pt 1):1–17. doi: 10.1111/j.1469-7793.1999.001aa.x. [DOI] [PMC free article] [PubMed] [Google Scholar]
- Duchen MR. Mitochondria and calcium: from cell signalling to cell death. J Physiol 529 Pt. 2000;1:57–68. doi: 10.1111/j.1469-7793.2000.00057.x. [DOI] [PMC free article] [PubMed] [Google Scholar]
- Duchen MR, Biscoe TJ. Mitochondrial function in type I cells isolated from rabbit arterial chemoreceptors. J Physiol. 1992;450:13–31. doi: 10.1113/jphysiol.1992.sp019114. [DOI] [PMC free article] [PubMed] [Google Scholar]
- Duchen MR, Biscoe TJ. Relative mitochondrial membrane potential and [Ca2+]i in type I cells isolated from the rabbit carotid body. J Physiol. 1992;450:33–61. doi: 10.1113/jphysiol.1992.sp019115. [DOI] [PMC free article] [PubMed] [Google Scholar]
- Duchen MR, Surin A, Jacobson J. Imaging mitochondrial function in intact cells. Methods Enzymol. 2003;361:353–89. doi: 10.1016/s0076-6879(03)61019-0. [DOI] [PubMed] [Google Scholar]
- Dugan LL, Sensi SL, Canzoniero LM, Handran SD, Rothman SM, Lin TS, Goldberg MP, Choi DW. Mitochondrial production of reactive oxygen species in cortical neurons following exposure to N-methyl-D-aspartate. J Neurosci. 1995;15:6377–88. doi: 10.1523/JNEUROSCI.15-10-06377.1995. [DOI] [PMC free article] [PubMed] [Google Scholar]
- Ebenstein Y, Mokari T, Bahin U. Fluorescence quantum yield of CdSe/ZnS nanocrystals investigated by correlated atomic-force and single-particle fluorescence microscopy. Appl Phys Lett. 2002;80:4033–4035. [Google Scholar]
- Ehrengruber MU, Hennou S, Bueler H, Naim HY, Deglon N, Lundstrom K. Gene transfer into neurons from hippocampal slices: comparison of recombinant Semliki Forest Virus, adenovirus, adeno-associated virus, lentivirus, and measles virus. Mol Cell Neurosci. 2001;17:855–71. doi: 10.1006/mcne.2001.0982. [DOI] [PubMed] [Google Scholar]
- Elston T, Wang H, Oster G. Energy transduction in ATP synthase. Nature. 1998;391:510–3. doi: 10.1038/35185. [DOI] [PubMed] [Google Scholar]
- Emaus RK, Grunwald R, Lemasters JJ. Rhodamine 123 as a probe of transmembrane potential in isolated rat-liver mitochondria: spectral and metabolic properties. Biochim Biophys Acta. 1986;850:436–48. doi: 10.1016/0005-2728(86)90112-x. [DOI] [PubMed] [Google Scholar]
- Englund M, Hyllienmark L, Brismar T. Chemical hypoxia in hippocampal pyramidal cells affects membrane potential differentially depending on resting potential. Neuroscience. 2001;106:89–94. doi: 10.1016/s0306-4522(01)00259-7. [DOI] [PubMed] [Google Scholar]
- Erecinska M, Silver IA. ATP and brain function. J Cereb Blood Flow Metab. 1989;9:2–19. doi: 10.1038/jcbfm.1989.2. [DOI] [PubMed] [Google Scholar]
- Fatt I. Polarographic oxygen sensors. CRC; Cleveland: 1976. [Google Scholar]
- Fayuk D, Aitken PG, Somjen GG, Turner DA. Two different mechanisms underlie reversible, intrinsic optical signals in rat hippocampal slices. J Neurophysiol. 2002;87:1924–37. doi: 10.1152/jn.00231.2001. [DOI] [PubMed] [Google Scholar]
- Fiskum G. Intracellular levels and distribution of Ca2+ in digitonin-permeabilized cells. Cell Calcium. 1985;6:25–37. doi: 10.1016/0143-4160(85)90032-6. [DOI] [PubMed] [Google Scholar]
- Foster KA, Beaver CJ, Turner DA. Interaction between tissue oxygen tension and NADH imaging during synaptic stimulation and hypoxia in rat hippocampal slices. Neuroscience. 2005;132:645–57. doi: 10.1016/j.neuroscience.2005.01.040. [DOI] [PubMed] [Google Scholar]
- Freund TF, Buzsaki G, Leon A, Baimbridge KG, Somogyi P. Relationship of neuronal vulnerability and calcium binding protein immunoreactivity in ischemia. Exp Brain Res. 1990;83:55–66. doi: 10.1007/BF00232193. [DOI] [PubMed] [Google Scholar]
- Fujii F, Nodasaka Y, Nishimura G, Tamura M. Anoxia induces matrix shrinkage accompanied by an increase in light scattering in isolated brain mitochondria. Brain Res. 2004;999:29–39. doi: 10.1016/j.brainres.2003.11.017. [DOI] [PubMed] [Google Scholar]
- Galeffi F, Sinnar S, Schwartz-Bloom RD. Diazepam promotes ATP recovery and prevents cytochrome c release in hippocampal slices after in vitro ischemia. J Neurochem. 2000;75:1242–9. doi: 10.1046/j.1471-4159.2000.0751242.x. [DOI] [PubMed] [Google Scholar]
- Gallop PM, Paz MA, Henson E, Latt SA. Dynamic approaches to the delivery of reporter reagents into living cells. BioTechniques. 1984;2:32–36. [Google Scholar]
- Garofalo O, Cox DW, Bachelard HS. Brain levels of NADH and NAD+ under hypoxic and hypoglycaemic conditions in vitro. J Neurochem. 1988;51:172–6. doi: 10.1111/j.1471-4159.1988.tb04851.x. [DOI] [PubMed] [Google Scholar]
- Gerencser AA, Adam-Vizi V. Selective, high-resolution fluorescence imaging of mitochondrial Ca2+ concentration. Cell Calcium. 2001;30:311–21. doi: 10.1054/ceca.2001.0238. [DOI] [PubMed] [Google Scholar]
- Gerencser AA, Adam-Vizi V. Mitochondrial Ca2+ dynamics reveals limited intramitochondrial Ca2+ diffusion. Biophys J. 2005;88:698–714. doi: 10.1529/biophysj.104.050062. [DOI] [PMC free article] [PubMed] [Google Scholar]
- Gerich FJ, Hepp S, Probst I, Müller M. Mitochondrial inhibition prior to oxygen-withdrawal facilitates the occurrence of hypoxia-induced spreading depression in rat hippocampal slices. J Neurophysiol. 2006;96:492–504. doi: 10.1152/jn.01015.2005. [DOI] [PubMed] [Google Scholar]
- Gijsbers KJ, Melzack R. Oxygen tension changes evoked in the brain by visual stimulation. Science. 1967;156:1392–3. doi: 10.1126/science.156.3780.1392. [DOI] [PubMed] [Google Scholar]
- Gillessen T, Grasshoff C, Szinicz L. Mitochondrial permeability transition can be directly monitored in living neurons. Biomed Pharmacother. 2002;56:186–93. doi: 10.1016/s0753-3322(02)00184-1. [DOI] [PubMed] [Google Scholar]
- Gledhill JR, Walker JE. Inhibition sites in F1-ATPase from bovine heart mitochondria. Biochem J. 2005;386:591–8. doi: 10.1042/BJ20041513. [DOI] [PMC free article] [PubMed] [Google Scholar]
- Gnaiger E, Steinlechner-Maran R, Mendez G, Eberl T, Margreiter R. Control of mitochondrial and cellular respiration by oxygen. J Bioenerg Biomembr. 1995;27:583–96. doi: 10.1007/BF02111656. [DOI] [PubMed] [Google Scholar]
- Grecco HE, Lidke KA, Heintzmann R, Lidke DS, Spagnuolo C, Martinez OE, Jares-Erijman EA, Jovin TM. Ensemble and single particle photophysical properties (two-photon excitation, anisotropy, FRET, lifetime, spectral conversion) of commercial quantum dots in solution and in live cells. Microsc Res Tech. 2004;65:169–79. doi: 10.1002/jemt.20129. [DOI] [PubMed] [Google Scholar]
- Gunasekar PG, Sun PW, Kanthasamy AG, Borowitz JL, Isom GE. Cyanide-induced neurotoxicity involves nitric oxide and reactive oxygen species generation after N-methyl-D-aspartate receptor activation. J Pharmacol Exp Ther. 1996;277:150–5. [PubMed] [Google Scholar]
- Gunter TE, Gunter KK, Sheu SS, Gavin CE. Mitochondrial calcium transport: physiological and pathological relevance. Am J Physiol. 1994;267:C313–39. doi: 10.1152/ajpcell.1994.267.2.C313. [DOI] [PubMed] [Google Scholar]
- Gunter TE, Pfeiffer DR. Mechanisms by which mitochondria transport calcium. Am J Physiol. 1990;258:C755–86. doi: 10.1152/ajpcell.1990.258.5.C755. [DOI] [PubMed] [Google Scholar]
- Hales KG, Fuller MT. Developmentally regulated mitochondrial fusion mediated by a conserved, novel, predicted GTPase. Cell. 1997;90:121–9. doi: 10.1016/s0092-8674(00)80319-0. [DOI] [PubMed] [Google Scholar]
- Halestrap AP, Connern CP, Griffiths EJ, Kerr PM. Cyclosporin A binding to mitochondrial cyclophilin inhibits the permeability transition pore and protects hearts from ischaemia/reperfusion injury. Mol Cell Biochem. 1997;174:167–72. [PubMed] [Google Scholar]
- Halestrap AP, McStay GP, Clarke SJ. The permeability transition pore complex: another view. Biochimie. 2002;84:153–66. doi: 10.1016/s0300-9084(02)01375-5. [DOI] [PubMed] [Google Scholar]
- Haller M. PhD thesis. Georg-August-Universität; Göttingen: 2000. Structure and function of KATP channels in inspiratory neurons of mice. [Google Scholar]
- Halliwell B, Gutteridge JM. Oxygen toxicity, oxygen radicals, transition metals and disease. Biochem J. 1984;219:1–14. doi: 10.1042/bj2190001. [DOI] [PMC free article] [PubMed] [Google Scholar]
- Hammarström AK, Gage PW. Inhibition of oxidative metabolism increases persistent sodium current in rat CA1 hippocampal neurons. J Physiol. 1998;510 (Pt 3):735–41. doi: 10.1111/j.1469-7793.1998.735bj.x. [DOI] [PMC free article] [PubMed] [Google Scholar]
- Hansen AJ. Effect of anoxia on ion distribution in the brain. Physiol Rev. 1985;65:101–48. doi: 10.1152/physrev.1985.65.1.101. [DOI] [PubMed] [Google Scholar]
- Hanson GT, Aggeler R, Oglesbee D, Cannon M, Capaldi RA, Tsien RY, Remington SJ. Investigating mitochondrial redox potential with redox-sensitive green fluorescent protein indicators. J Biol Chem. 2004;279:13044–53. doi: 10.1074/jbc.M312846200. [DOI] [PubMed] [Google Scholar]
- Hara H, Kato H, Kogure K. Protective effect of alpha-tocopherol on ischemic neuronal damage in the gerbil hippocampus. Brain Res. 1990;510:335–8. doi: 10.1016/0006-8993(90)91386-u. [DOI] [PubMed] [Google Scholar]
- Hara H, Kogure K. Prevention of hippocampus neuronal damage in ischemic gerbils by a novel lipid peroxidation inhibitor (quinazoline derivative) J Pharmacol Exp Ther. 1990;255:906–13. [PubMed] [Google Scholar]
- Hassinen I, Chance B. Oxidation-reduction properties of the mitochondrial flavoprotein chain. Biochem Biophys Res Commun. 1968;31:895–900. doi: 10.1016/0006-291x(68)90536-6. [DOI] [PubMed] [Google Scholar]
- Hayakawa Y, Nemoto T, Iino M, Kasai H. Rapid Ca2+-dependent increase in oxygen consumption by mitochondria in single mammalian central neurons. Cell Calcium. 2005;37:359–70. doi: 10.1016/j.ceca.2004.11.005. [DOI] [PubMed] [Google Scholar]
- Hempel SL, Buettner GR, O'Malley YQ, Wessels DA, Flaherty DM. Dihydrofluorescein diacetate is superior for detecting intracellular oxidants: comparison with 2',7'-dichlorodihydrofluorescein diacetate, 5(and 6)-carboxy-2',7'-dichlorodihydrofluorescein diacetate, and dihydrorhodamine 123. Free Radic Biol Med. 1999;27:146–59. doi: 10.1016/s0891-5849(99)00061-1. [DOI] [PubMed] [Google Scholar]
- Hepp S, Gerich FJ, Müller M. Sulfhydryl oxidation reduces hippocampal susceptibility to hypoxia-induced spreading depression by activating BK-channels. J Neurophysiol. 2005;94:1091–103. doi: 10.1152/jn.00291.2005. [DOI] [PubMed] [Google Scholar]
- Hevner RF, Duff RS, Wong-Riley MT. Coordination of ATP production and consumption in brain: parallel regulation of cytochrome oxidase and Na+, K+-ATPase. Neurosci Lett. 1992;138:188–92. doi: 10.1016/0304-3940(92)90502-x. [DOI] [PubMed] [Google Scholar]
- Hollinshead M, Sanderson J, Vaux DJ. Anti-biotin antibodies offer superior organelle-specific labeling of mitochondria over avidin or streptavidin. J Histochem Cytochem. 1997;45:1053–7. doi: 10.1177/002215549704500803. [DOI] [PubMed] [Google Scholar]
- Hommel JD, Sears RM, Georgescu D, Simmons DL, DiLeone RJ. Local gene knockdown in the brain using viral-mediated RNA interference. Nat Med. 2003;9:1539–44. doi: 10.1038/nm964. [DOI] [PubMed] [Google Scholar]
- Huang S, Heikal AA, Webb WW. Two-photon flourescence spectroscopy and microscopy of NAD(P)H and flavoprotein. Biophys J. 2002;82:2811–2825. doi: 10.1016/S0006-3495(02)75621-X. [DOI] [PMC free article] [PubMed] [Google Scholar]
- Iijima T, Mishima T, Tohyama M, Akagawa K, Iwao Y. Mitochondrial membrane potential and intracellular ATP content after transient experimental ischemia in the cultured hippocampal neuron. Neurochem Int. 2003;43:263–9. doi: 10.1016/s0197-0186(02)00228-0. [DOI] [PubMed] [Google Scholar]
- Jacobson J, Duchen MR. Interplay between mitochondria and cellular calcium signalling. Mol Cell Biochem. 2004;256#x02013;257:209–18. doi: 10.1023/b:mcbi.0000009869.29827.df. [DOI] [PubMed] [Google Scholar]
- Jaiswal JK, Mattoussi H, Mauro JM, Simon SM. Long-term multiple color imaging of live cells using quantum dot bioconjugates. Nat Biotechnol. 2003;21:47–51. doi: 10.1038/nbt767. [DOI] [PubMed] [Google Scholar]
- Jemmerson R, Dubinsky JM, Brustovetsky N. Cytochrome C release from CNS mitochondria and potential for clinical intervention in apoptosis-mediated CNS diseases. Antioxid Redox Signal. 2005;7:1158–72. doi: 10.1089/ars.2005.7.1158. [DOI] [PubMed] [Google Scholar]
- Jensen JR, Rehder V. FCCP releases Ca2+ from a non-mitochondrial store in an identified Helisoma neuron. Brain Res. 1991;551:311–4. doi: 10.1016/0006-8993(91)90947-t. [DOI] [PubMed] [Google Scholar]
- Jöbsis FF, O'Connor M, Vitale A, Vreman H. Intracellular redox changes in functioning cerebral cortex. I. Metabolic effects of epileptiform activity. J Neurophysiol. 1971;34:735–49. doi: 10.1152/jn.1971.34.5.735. [DOI] [PubMed] [Google Scholar]
- Jones DP. Intracellular diffusion gradients of O2 and ATP. Am J Physiol. 1986;250:C663–75. doi: 10.1152/ajpcell.1986.250.5.C663. [DOI] [PubMed] [Google Scholar]
- Juthberg SK, Brismar T. Effect of metabolic inhibitors on membrane potential and ion conductance of rat astrocytes. Cell Mol Neurobiol. 1997;17:367–77. doi: 10.1023/A:1026331226241. [DOI] [PMC free article] [PubMed] [Google Scholar]
- Kaal EC, Vlug AS, Versleijen MW, Kuilman M, Joosten EA, Bar PR. Chronic mitochondrial inhibition induces selective motoneuron death in vitro: a new model for amyotrophic lateral sclerosis. J Neurochem. 2000;74:1158–65. doi: 10.1046/j.1471-4159.2000.741158.x. [DOI] [PubMed] [Google Scholar]
- Kaila K, Mattsson K, Voipio J. Fall in intracellular pH and increase in resting tension induced by a mitochondrial uncoupling agent in crayfish muscle. J Physiol. 1989;408:271–93. doi: 10.1113/jphysiol.1989.sp017459. [DOI] [PMC free article] [PubMed] [Google Scholar]
- Kaim G, Dimroth P. ATP synthesis by F-type ATP synthase is obligatorily dependent on the transmembrane voltage. Embo J. 1999;18:4118–27. doi: 10.1093/emboj/18.15.4118. [DOI] [PMC free article] [PubMed] [Google Scholar]
- Kamsler A, Segal M. Hydrogen peroxide modulation of synaptic plasticity. J Neurosci. 2003;23:269–76. doi: 10.1523/JNEUROSCI.23-01-00269.2003. [DOI] [PMC free article] [PubMed] [Google Scholar]
- Kamsler A, Segal M. Paradoxical actions of hydrogen peroxide on long-term potentiation in transgenic superoxide dismutase-1 mice. J Neurosci. 2003;23:10359–67. doi: 10.1523/JNEUROSCI.23-32-10359.2003. [DOI] [PMC free article] [PubMed] [Google Scholar]
- Kann O, Schuchmann S, Buchheim K, Heinemann U. Coupling of neuronal activity and mitochondrial metabolism as revealed by NAD(P)H fluorescence signals in organotypic hippocampal slice cultures of the rat. Neuroscience. 2003;119:87–100. doi: 10.1016/s0306-4522(03)00026-5. [DOI] [PubMed] [Google Scholar]
- Kasischke KA, Vishwasrao HD, Fisher PJ, Zipfel WR, Webb WW. Neural activity triggers neuronal oxidative metabolism followed by astrocytic glycolysis. Science. 2004;305:99–103. doi: 10.1126/science.1096485. [DOI] [PubMed] [Google Scholar]
- Kass IS, Lipton P. Mechanisms involved in irreversible anoxic damage to the in vitro rat hippocampal slice. J Physiol. 1982;332:459–72. doi: 10.1113/jphysiol.1982.sp014424. [DOI] [PMC free article] [PubMed] [Google Scholar]
- Keller JN, Kindy MS, Holtsberg FW, St Clair DK, Yen HC, Germeyer A, Steiner SM, Bruce-Keller AJ, Hutchins JB, Mattson MP. Mitochondrial manganese superoxide dismutase prevents neural apoptosis and reduces ischemic brain injury: suppression of peroxynitrite production, lipid peroxidation, and mitochondrial dysfunction. J Neurosci. 1998;18:687–97. doi: 10.1523/JNEUROSCI.18-02-00687.1998. [DOI] [PMC free article] [PubMed] [Google Scholar]
- Khodorov B, Pinelis V, Vergun O, Storozhevykh T, Vinskaya N. Mitochondrial deenergization underlies neuronal calcium overload following a prolonged glutamate challenge. FEBS Lett. 1996;397:230–4. doi: 10.1016/s0014-5793(96)01139-8. [DOI] [PubMed] [Google Scholar]
- Khodorov BI, Storozhevykh TP, Surin AM, Yuryavichyus AI, Sorokina EG, Borodin AV, Vinskaya NP, Khaspekov LG, Pinelis VG. The leading role of mitochondrial depolarization in the mechanism of glutamate-induced disruptions in Ca2+ homeostasis. Neurosci Behav Physiol. 2002;32:541–7. doi: 10.1023/a:1019819925257. [DOI] [PubMed] [Google Scholar]
- Kiedrowski L, Costa E. Glutamate-induced destabilization of intracellular calcium concentration homeostasis in cultured cerebellar granule cells: role of mitochondria in calcium buffering. Mol Pharmacol. 1995;47:140–7. [PubMed] [Google Scholar]
- Kim DY, Won SJ, Gwag BJ. Analysis of mitochondrial free radical generation in animal models of neuronal disease. Free Radic Biol Med. 2002;33:715–23. doi: 10.1016/s0891-5849(02)00968-1. [DOI] [PubMed] [Google Scholar]
- Kirkland RA, Franklin JL. Evidence for redox regulation of cytochrome C release during programmed neuronal death: antioxidant effects of protein synthesis and caspase inhibition. J Neurosci. 2001;21:1949–63. doi: 10.1523/JNEUROSCI.21-06-01949.2001. [DOI] [PMC free article] [PubMed] [Google Scholar]
- Klingenberg M, Echtay KS. Uncoupling proteins: the issues from a biochemist point of view. Biochim Biophys Acta. 2001;1504:128–43. doi: 10.1016/s0005-2728(00)00242-5. [DOI] [PubMed] [Google Scholar]
- Knapp LT, Klann E. Role of reactive oxygen species in hippocampal long-term potentiation: contributory or inhibitory? J Neurosci Res. 2002;70:1–7. doi: 10.1002/jnr.10371. [DOI] [PubMed] [Google Scholar]
- Kogure K, Alonso OF. A pictorial representation of endogenous brain ATP by a bioluminescent method. Brain Res. 1978;154:273–84. doi: 10.1016/0006-8993(78)90700-x. [DOI] [PubMed] [Google Scholar]
- Kong J, Xu Z. Massive mitochondrial degeneration in motor neurons triggers the onset of amyotrophic lateral sclerosis in mice expressing a mutant SOD1. J Neurosci. 1998;18:3241–50. doi: 10.1523/JNEUROSCI.18-09-03241.1998. [DOI] [PMC free article] [PubMed] [Google Scholar]
- König K. Multiphoton microscopy in life sciences. J Microsc. 2000;200:83–104. doi: 10.1046/j.1365-2818.2000.00738.x. [DOI] [PubMed] [Google Scholar]
- Konishi M, Hollingworth S, Harkins AB, Baylor SM. Myoplasmic calcium transients in intact frog skeletal muscle fibers monitored with the fluorescent indicator furaptra. J Gen Physiol. 1991;97:271–301. doi: 10.1085/jgp.97.2.271. [DOI] [PMC free article] [PubMed] [Google Scholar]
- Korde AS, Pettigrew LC, Craddock SD, Maragos WF. The mitochondrial uncoupler 2,4-dinitrophenol attenuates tissue damage and improves mitochondrial homeostasis following transient focal cerebral ischemia. J Neurochem. 2005;94:1676–84. doi: 10.1111/j.1471-4159.2005.03328.x. [DOI] [PubMed] [Google Scholar]
- Kovacs R, Kardos J, Heinemann U, Kann O. Mitochondrial calcium ion and membrane potential transients follow the pattern of epileptiform discharges in hippocampal slice cultures. J Neurosci. 2005;25:4260–9. doi: 10.1523/JNEUROSCI.4000-04.2005. [DOI] [PMC free article] [PubMed] [Google Scholar]
- Kovacs R, Schuchmann S, Gabriel S, Kann O, Kardos J, Heinemann U. Free radical-mediated cell damage after experimental status epilepticus in hippocampal slice culture. J Neurophysiol. 2002;88:2909–18. doi: 10.1152/jn.00149.2002. [DOI] [PubMed] [Google Scholar]
- Kristal BS, Dubinsky JM. Mitochondrial permeability transition in the central nervous system: induction by calcium cycling-dependent and -independent pathways. J Neurochem. 1997;69:524–38. doi: 10.1046/j.1471-4159.1997.69020524.x. [DOI] [PubMed] [Google Scholar]
- Kristian T. Metabolic stages, mitochondria and calcium in hypoxic/ischemic brain damage. Cell Calcium. 2004;36:221–33. doi: 10.1016/j.ceca.2004.02.016. [DOI] [PubMed] [Google Scholar]
- Kristian T, Bernardi P, Siesjo BK. Acidosis promotes the permeability transition in energized mitochondria: implications for reperfusion injury. J Neurotrauma. 2001;18:1059–74. doi: 10.1089/08977150152693755. [DOI] [PubMed] [Google Scholar]
- Kroemer G, Dallaporta B, Resche-Rigon M. The mitochondrial death/life regulator in apoptosis and necrosis. Annu Rev Physiol. 1998;60:619–42. doi: 10.1146/annurev.physiol.60.1.619. [DOI] [PubMed] [Google Scholar]
- Kulik A, Ballanyi K. Mitochondrial mediation of cyanide-evoked calcium rises in dorsal vagal neurons in situ. Eur J Physiol. 1998;435:P12–1. [Google Scholar]
- Kunz WS. Spectral properties of fluorescent flavoproteins of isolated rat liver mitochondria. FEBS Lett. 1986;195:92–6. doi: 10.1016/0014-5793(86)80137-5. [DOI] [PubMed] [Google Scholar]
- Kunz WS, Kunz W. Contribution of different enzymes to flavoprotein fluorescence of isolated rat liver mitochondria. Biochim Biophys Acta. 1985;841:237–46. doi: 10.1016/0304-4165(85)90064-9. [DOI] [PubMed] [Google Scholar]
- Lacza Z, Snipes JA, Kis B, Szabo C, Grover G, Busija DW. Investigation of the subunit composition and the pharmacology of the mitochondrial ATP-dependent K+ channel in the brain. Brain Res. 2003;994:27–36. doi: 10.1016/j.brainres.2003.09.046. [DOI] [PubMed] [Google Scholar]
- Ladewig T, Kloppenburg P, Lalley PM, Zipfel WR, Webb WW, Keller BU. Spatial profiles of store-dependent calcium release in motoneurones of the nucleus hypoglossus from newborn mouse. J Physiol. 2003;547:775–87. doi: 10.1113/jphysiol.2002.033605. [DOI] [PMC free article] [PubMed] [Google Scholar]
- Lai B, Zhang L, Dong LY, Zhu YH, Sun FY, Zheng P. Inhibition of Qi site of mitochondrial complex III with antimycin A decreases persistent and transient sodium currents via reactive oxygen species and protein kinase C in rat hippocampal CA1 cells. Exp Neurol. 2005;194:484–94. doi: 10.1016/j.expneurol.2005.03.005. [DOI] [PubMed] [Google Scholar]
- Lamprecht W, Trautschold I. Bestimmung mit Hexokinase und Glukose-6-phosphat-Dehydrogenase. In: Bergmeyer HU, editor. Methoden der enzymatischen Analyse. Vol. 2. Verlag Chemie; Weinheim: 1974. pp. 2151–2160. [Google Scholar]
- LeBel CP, Ischiropoulos H, Bondy SC. Evaluation of the probe 2',7'-dichlorofluorescin as an indicator of reactive oxygen species formation and oxidative stress. Chem Res Toxicol. 1992;5:227–31. doi: 10.1021/tx00026a012. [DOI] [PubMed] [Google Scholar]
- Lei B, Adachi N, Arai T. Measurement of the extracellular H2O2 in the brain by microdialysis. Brain Res Brain Res Protoc. 1998;3:33–6. doi: 10.1016/s1385-299x(98)00018-x. [DOI] [PubMed] [Google Scholar]
- Leverve XM, Fontaine E. Role of substrates in the regulation of mitochondrial function in situ. IUBMB Life. 2001;52:221–9. doi: 10.1080/15216540152846037. [DOI] [PubMed] [Google Scholar]
- Lewis RM, Lewis HW. Mitochondria (and other cytoplasmatic structures) in tissue cultures. Ann J Anat. 1914;17:339–401. [Google Scholar]
- Leyssens A, Nowicky AV, Patterson L, Crompton M, Duchen MR. The relationship between mitochondrial state, ATP hydrolysis, [Mg2+]i and [Ca2+]i studied in isolated rat cardiomyocytes. J Physiol. 1996;496 (Pt 1):111–28. doi: 10.1113/jphysiol.1996.sp021669. [DOI] [PMC free article] [PubMed] [Google Scholar]
- Li Y, Trush MA. Diphenyleneiodonium, an NAD(P)H oxidase inhibitor, also potently inhibits mitochondrial reactive oxygen species production. Biochem Biophys Res Commun. 1998;253:295–9. doi: 10.1006/bbrc.1998.9729. [DOI] [PubMed] [Google Scholar]
- Liberatore GT, Jackson-Lewis V, Vukosavic S, Mandir AS, Vila M, McAuliffe WG, Dawson VL, Dawson TM, Przedborski S. Inducible nitric oxide synthase stimulates dopaminergic neurodegeneration in the MPTP model of Parkinson disease. Nat Med. 1999;5:1403–9. doi: 10.1038/70978. [DOI] [PubMed] [Google Scholar]
- Ligon LA, Steward O. Role of microtubules and actin filaments in the movement of mitochondria in the axons and dendrites of cultured hippocampal neurons. J Comp Neurol. 2000;427:351–61. doi: 10.1002/1096-9861(20001120)427:3<351::aid-cne3>3.0.co;2-r. [DOI] [PubMed] [Google Scholar]
- Lipton P. Ischemic cell death in brain neurons. Physiol Rev. 1999;79:1431–568. doi: 10.1152/physrev.1999.79.4.1431. [DOI] [PubMed] [Google Scholar]
- Lipton P, Whittingham TS. Reduced ATP concentration as a basis for synaptic transmission failure during hypoxia in the in vitro guinea-pig hippocampus. J Physiol. 1982;325:51–65. doi: 10.1113/jphysiol.1982.sp014135. [DOI] [PMC free article] [PubMed] [Google Scholar]
- Lipton SA, Choi YB, Pan ZH, Lei SZ, Chen HS, Sucher NJ, Loscalzo J, Singel DJ, Stamler JS. A redox-based mechanism for the neuroprotective and neurodestructive effects of nitric oxide and related nitroso-compounds. Nature. 1993;364:626–32. doi: 10.1038/364626a0. [DOI] [PubMed] [Google Scholar]
- Lipton SA, Choi YB, Takahashi H, Zhang D, Li W, Godzik A, Bankston LA. Cysteine regulation of protein function--as exemplified by NMDA-receptor modulation. Trends Neurosci. 2002;25:474–80. doi: 10.1016/s0166-2236(02)02245-2. [DOI] [PubMed] [Google Scholar]
- Lipton SA, Nicotera P. Calcium, free radicals and excitotoxins in neuronal apoptosis. Cell Calcium. 1998;23:165–71. doi: 10.1016/s0143-4160(98)90115-4. [DOI] [PubMed] [Google Scholar]
- Liu D, Slevin JR, Lu C, Chan SL, Hansson M, Elmer E, Mattson MP. Involvement of mitochondrial K+ release and cellular efflux in ischemic and apoptotic neuronal death. J Neurochem. 2003;86:966–79. doi: 10.1046/j.1471-4159.2003.01913.x. [DOI] [PubMed] [Google Scholar]
- Loomis WF, Lipmann F. Reversible inhibition of the coupling between phosporylation and oxidation. J Biol Chem. 1948;173:807–8. [PubMed] [Google Scholar]
- LoPachin RM, Gaughan CL, Lehning EJ, Weber ML, Taylor CP. Effects of ion channel blockade on the distribution of Na, K, Ca and other elements in oxygen-glucose deprived CA1 hippocampal neurons. Neuroscience. 2001;103:971–83. doi: 10.1016/s0306-4522(01)00035-5. [DOI] [PubMed] [Google Scholar]
- LoPachin RM, Lehning EJ. Mechanism of calcium entry during axon injury and degeneration. Toxicol Appl Pharmacol. 1997;143:233–44. doi: 10.1006/taap.1997.8106. [DOI] [PubMed] [Google Scholar]
- Lothman E, Lamanna J, Cordingley G, Rosenthal M, Somjen G. Responses of electrical potential, potassium levels, and oxidative metabolic activity of the cerebral neocortex of cats. Brain Res. 1975;88:15–36. doi: 10.1016/0006-8993(75)90943-9. [DOI] [PubMed] [Google Scholar]
- Lovric J, Bazzi HS, Cuie Y, Fortin GR, Winnik FM, Maysinger D. Differences in subcellular distribution and toxicity of green and red emitting CdTe quantum dots. J Mol Med. 2005;83:377–85. doi: 10.1007/s00109-004-0629-x. [DOI] [PubMed] [Google Scholar]
- Lovric J, Cho SJ, Winnik FM, Maysinger D. Unmodified cadmium telluride quantum dots induce reactive oxygen species formation leading to multiple organelle damage and cell death. Chem Biol. 2005;12:1227–34. doi: 10.1016/j.chembiol.2005.09.008. [DOI] [PubMed] [Google Scholar]
- Luetjens CM, Bui NT, Sengpiel B, Münstermann G, Poppe M, Krohn AJ, Bauerbach E, Krieglstein J, Prehn JH. Delayed mitochondrial dysfunction in excitotoxic neuron death: cytochrome c release and a secondary increase in superoxide production. J Neurosci. 2000;20:5715–23. doi: 10.1523/JNEUROSCI.20-15-05715.2000. [DOI] [PMC free article] [PubMed] [Google Scholar]
- Majno G, Joris I. Apoptosis, oncosis, and necrosis. An overview of cell death. Am J Pathol. 1995;146:3–15. [PMC free article] [PubMed] [Google Scholar]
- Martin BL, Wu D, Jakes S, Graves DJ. Chemical influences on the specificity of tyrosine phosphorylation. J Biol Chem. 1990;265:7108–11. [PubMed] [Google Scholar]
- Matsuyama S, Llopis J, Deveraux QL, Tsien RY, Reed JC. Changes in intramitochondrial and cytosolic pH: early events that modulate caspase activation during apoptosis. Nat Cell Biol. 2000;2:318–25. doi: 10.1038/35014006. [DOI] [PubMed] [Google Scholar]
- Mattiasson G, Shamloo M, Gido G, Mathi K, Tomasevic G, Yi S, Warden CH, Castilho RF, Melcher T, Gonzalez-Zulueta M, Nikolich K, Wieloch T. Uncoupling protein-2 prevents neuronal death and diminishes brain dysfunction after stroke and brain trauma. Nat Med. 2003;9:1062–8. doi: 10.1038/nm903. [DOI] [PubMed] [Google Scholar]
- Mayevsky A, Chance B. Repetitive patterns of metabolic changes during cortical spreading depression of the awake rat. Brain Res. 1974;65:529–33. doi: 10.1016/0006-8993(74)90243-1. [DOI] [PubMed] [Google Scholar]
- Mayevsky A, Zeuthen T, Chance B. Measurements of extracellular potassium, ECoG and pyridine nucleotide levels during cortical spreading depression in rats. Brain Res. 1974;76:347–9. doi: 10.1016/0006-8993(74)90467-3. [DOI] [PubMed] [Google Scholar]
- Medintz IL, Uyeda HT, Goldman ER, Mattoussi H. Quantum dot bioconjugates for imaging, labelling and sensing. Nat Mater. 2005;4:435–46. doi: 10.1038/nmat1390. [DOI] [PubMed] [Google Scholar]
- Meech RW, Thomas RC. Effect of measured calcium chloride injections on the membrane potential and internal pH of snail neurones. J Physiol. 1980;298:111–29. doi: 10.1113/jphysiol.1980.sp013070. [DOI] [PMC free article] [PubMed] [Google Scholar]
- Meldolesi J, Grohovaz F. Total calcium ultrastructure: advances in excitable cells. Cell Calcium. 2001;30:1–8. doi: 10.1054/ceca.2001.0216. [DOI] [PubMed] [Google Scholar]
- Meyer JS, Fang HC, Denny-Brown D. Polarographic study of cerebral collateral circulation. AMA Arch Neurol Psychiatry. 1954;72:296–312. doi: 10.1001/archneurpsyc.1954.02330030030003. [DOI] [PubMed] [Google Scholar]
- Mills E, Jöbsis FF. Mitochondrial respiratory chain of carotid body and chemoreceptor response to changes in oxygen tension. J Neurophysiol. 1972;35:405–28. doi: 10.1152/jn.1972.35.4.405. [DOI] [PubMed] [Google Scholar]
- Minta A, Kao JP, Tsien RY. Fluorescent indicators for cytosolic calcium based on rhodamine and fluorescein chromophores. J Biol Chem. 1989;264:8171–8. [PubMed] [Google Scholar]
- Mironov SL, Ivannikov MV, Johansson M. [Ca2+]i signaling between mitochondria and endoplasmic reticulum in neurons is regulated by microtubules. From mitochondrial permeability transition pore to Ca2+-induced Ca2+ release. J Biol Chem. 2005;280:715–21. doi: 10.1074/jbc.M409819200. [DOI] [PubMed] [Google Scholar]
- Mitchell P. Coupling of phosphorylation to electron and hydrogen transfer by a chemi-osmotic type of mechanism. Nature. 1961;191:144–8. doi: 10.1038/191144a0. [DOI] [PubMed] [Google Scholar]
- Mitchell P. Chemiosmotic coupling in oxidative and photosynthetic phosphorylation. Biol Rev Camb Philos Soc. 1966;41:445–502. doi: 10.1111/j.1469-185x.1966.tb01501.x. [DOI] [PubMed] [Google Scholar]
- Miyoshi H. Structure-activity relationships of some complex I inhibitors. Biochim Biophys Acta. 1998;1364:236–44. doi: 10.1016/s0005-2728(98)00030-9. [DOI] [PubMed] [Google Scholar]
- Moghaddas S, Hoppel CL, Lesnefsky EJ. Aging defect at the Qo site of complex III augments oxyradical production in rat heart interfibrillar mitochondria. Arch Biochem Biophys. 2003;414:59–66. doi: 10.1016/s0003-9861(03)00166-8. [DOI] [PubMed] [Google Scholar]
- Morris RL, Hollenbeck PJ. Axonal transport of mitochondria along microtubules and F-actin in living vertebrate neurons. J Cell Biol. 1995;131:1315–26. doi: 10.1083/jcb.131.5.1315. [DOI] [PMC free article] [PubMed] [Google Scholar]
- Müller M, Ballanyi K. Dynamic recording of cell death in the in vitro dorsal vagal nucleus of rats in response to metabolic arrest. J Neurophysiol. 2003;89:551–61. doi: 10.1152/jn.00559.2002. [DOI] [PubMed] [Google Scholar]
- Müller M, Brockhaus J, Ballanyi K. ATP-independent anoxic activation of ATP-sensitive K+ channels in dorsal vagal neurons of juvenile mice in situ. Neuroscience. 2002;109:313–28. doi: 10.1016/s0306-4522(01)00498-5. [DOI] [PubMed] [Google Scholar]
- Müller M, Mironov SL, Ivannikov MV, Schmidt J, Richter DW. Mitochondrial organization and motility probed by two-photon microscopy in cultured mouse brainstem neurons. Exp Cell Res. 2005;303:114–27. doi: 10.1016/j.yexcr.2004.09.025. [DOI] [PubMed] [Google Scholar]
- Müller M, Schmidt J, Mironov SL, Richter DW. Construction and performance of a custom-built two-photon laser scanning system. J Phys D: Appl Phys. 2003;36:1747–1757. [Google Scholar]
- Müller M, Somjen GG. Na+ and K+ concentrations, extra- and intracellular voltages, and the effect of TTX in hypoxic rat hippocampal slices. J Neurophysiol. 2000;83:735–45. doi: 10.1152/jn.2000.83.2.735. [DOI] [PubMed] [Google Scholar]
- Murphy AN, Fiskum G, Beal MF. Mitochondria in neurodegeneration: bioenergetic function in cell life and death. J Cereb Blood Flow Metab. 1999;19:231–45. doi: 10.1097/00004647-199903000-00001. [DOI] [PubMed] [Google Scholar]
- Negre-Salvayre A, Hirtz C, Carrera G, Cazenave R, Troly M, Salvayre R, Penicaud L, Casteilla L. A role for uncoupling protein-2 as a regulator of mitochondrial hydrogen peroxide generation. Faseb J. 1997;11:809–15. [PubMed] [Google Scholar]
- Nicholls D, Akerman K. Mitochondrial calcium transport. Biochim Biophys Acta. 1982;683:57–88. doi: 10.1016/0304-4173(82)90013-1. [DOI] [PubMed] [Google Scholar]
- Nicholls DG. A role for the mitochondrion in the protection of cells against calcium overload? Prog Brain Res. 1985;63:97–106. doi: 10.1016/S0079-6123(08)61978-0. [DOI] [PubMed] [Google Scholar]
- Nicholls DG. Intracellular calcium homeostasis. Br Med Bull. 1986;42:353–8. doi: 10.1093/oxfordjournals.bmb.a072152. [DOI] [PubMed] [Google Scholar]
- Nicholls DG, Budd SL. Mitochondria and neuronal survival. Physiol Rev. 2000;80:315–60. doi: 10.1152/physrev.2000.80.1.315. [DOI] [PubMed] [Google Scholar]
- Nicholls DG, Chalmers S. The integration of mitochondrial calcium transport and storage. J Bioenerg Biomembr. 2004;36:277–81. doi: 10.1023/B:JOBB.0000041753.52832.f3. [DOI] [PubMed] [Google Scholar]
- Nicholls DG, Scott ID. The regulation of brain mitochondrial calcium-ion transport. The role of ATP in the discrimination between kinetic and membrane-potential-dependent calcium-ion efflux mechanisms. Biochem J. 1980;186:833–9. doi: 10.1042/bj1860833. [DOI] [PMC free article] [PubMed] [Google Scholar]
- Nicholls DG, Ward MW. Mitochondrial membrane potential and neuronal glutamate excitotoxicity: mortality and millivolts. Trends Neurosci. 2000;23:166–74. doi: 10.1016/s0166-2236(99)01534-9. [DOI] [PubMed] [Google Scholar]
- Nirmal M, Dabbousi BO, Bawendi MG, Macklin JJ, Trautman JK, Harris TD, Brus LE. Fluorescence intermittency in single cadmium selenide nanocrystals. Nature. 1996;383:802–4. [Google Scholar]
- O'Rourke B. Pathophysiological and protective roles of mitochondrial ion channels. J Physiol 529 Pt. 2000;1:23–36. doi: 10.1111/j.1469-7793.2000.00023.x. [DOI] [PMC free article] [PubMed] [Google Scholar]
- Ostergaard H, Henriksen A, Hansen FG, Winther JR. Shedding light on disulfide bond formation: engineering a redox switch in green fluorescent protein. Embo J. 2001;20:5853–62. doi: 10.1093/emboj/20.21.5853. [DOI] [PMC free article] [PubMed] [Google Scholar]
- Parak WJ, Pellegrino T, Plank C. Labelling of cells with quantum dots. Nanotechnology. 2005;16:R9–R25. doi: 10.1088/0957-4484/16/2/R01. [DOI] [PubMed] [Google Scholar]
- Patel MN, Yim GK, Isom GE. Blockade of N-methyl-D-aspartate receptors prevents cyanide-induced neuronal injury in primary hippocampal cultures. Toxicol Appl Pharmacol. 1992;115:124–9. doi: 10.1016/0041-008x(92)90375-3. [DOI] [PubMed] [Google Scholar]
- Penefsky HS. Mechanism of inhibition of mitochondrial adenosine triphosphatase by dicyclohexylcarbodiimide and oligomycin: relationship to ATP synthesis. Proc Natl Acad Sci U S A. 1985;82:1589–93. doi: 10.1073/pnas.82.6.1589. [DOI] [PMC free article] [PubMed] [Google Scholar]
- Perez-Pinzon MA, Mumford PL, Carranza V, Sick TJ. Calcium influx from the extracellular space promotes NADH hyperoxidation and electrical dysfunction after anoxia in hippocampal slices. J Cereb Blood Flow Metab. 1998;18:215–21. doi: 10.1097/00004647-199802000-00013. [DOI] [PubMed] [Google Scholar]
- Perez-Pinzon MA, Mumford PL, Rosenthal M, Sick TJ. Antioxidants, mitochondrial hyperoxidation and electrical recovery after anoxia in hippocampal slices. Brain Res. 1997;754:163–70. doi: 10.1016/s0006-8993(97)00066-8. [DOI] [PubMed] [Google Scholar]
- Perez-Pinzon MA, Mumford PL, Sick TJ. Prolonged anoxic depolarization exacerbates NADH hyperoxidation and promotes poor electrical recovery after anoxia in hippocampal slices. Brain Res. 1998;786:165–70. doi: 10.1016/s0006-8993(97)01438-8. [DOI] [PubMed] [Google Scholar]
- Perkins GA, Renken CW, Frey TG, Ellisman MH. Membrane architecture of mitochondria in neurons of the central nervous system. J Neurosci Res. 2001;66:857–65. doi: 10.1002/jnr.10050. [DOI] [PubMed] [Google Scholar]
- Piantadosi CA, Zhang J. Mitochondrial generation of reactive oxygen species after brain ischemia in the rat. Stroke. 1996;27:327–31. doi: 10.1161/01.str.27.2.327. discussion 332. [DOI] [PubMed] [Google Scholar]
- Pivovarova NB, Nguyen HV, Winters CA, Brantner CA, Smith CL, Andrews SB. Excitotoxic calcium overload in a subpopulation of mitochondria triggers delayed death in hippocampal neurons. J Neurosci. 2004;24:5611–22. doi: 10.1523/JNEUROSCI.0531-04.2004. [DOI] [PMC free article] [PubMed] [Google Scholar]
- Pivovarova NB, Pozzo-Miller LD, Hongpaisan J, Andrews SB. Correlated calcium uptake and release by mitochondria and endoplasmic reticulum of CA3 hippocampal dendrites after afferent synaptic stimulation. J Neurosci. 2002;22:10653–61. doi: 10.1523/JNEUROSCI.22-24-10653.2002. [DOI] [PMC free article] [PubMed] [Google Scholar]
- Poot M, Zhang YZ, Kramer JA, Wells KS, Jones LJ, Hanzel DK, Lugade AG, Singer VL, Haugland RP. Analysis of mitochondrial morphology and function with novel fixable fluorescent stains. J Histochem Cytochem. 1996;44:1363–72. doi: 10.1177/44.12.8985128. [DOI] [PubMed] [Google Scholar]
- Possel H, Noack H, Augustin W, Keilhoff G, Wolf G. 2,7-Dihydrodichlorofluorescein diacetate as a fluorescent marker for peroxynitrite formation. FEBS Lett. 1997;416:175–8. doi: 10.1016/s0014-5793(97)01197-6. [DOI] [PubMed] [Google Scholar]
- Prabhakaran K, Li L, Borowitz JL, Isom GE. Cyanide induces different modes of death in cortical and mesencephalon cells. J Pharmacol Exp Ther. 2002;303:510–9. doi: 10.1124/jpet.102.039453. [DOI] [PubMed] [Google Scholar]
- Prehn JH, Bindokas VP, Marcuccilli CJ, Krajewski S, Reed JC, Miller RJ. Regulation of neuronal Bcl2 protein expression and calcium homeostasis by transforming growth factor type beta confers wide-ranging protection on rat hippocampal neurons. Proc Natl Acad Sci U S A. 1994;91:12599–603. doi: 10.1073/pnas.91.26.12599. [DOI] [PMC free article] [PubMed] [Google Scholar]
- Pulsinelli WA, Brierley JB, Plum F. Temporal profile of neuronal damage in a model of transient forebrain ischemia. Ann Neurol. 1982;11:491–8. doi: 10.1002/ana.410110509. [DOI] [PubMed] [Google Scholar]
- Pusch M, Neher E. Rates of diffusional exchange between small cells and a measuring patch pipette. Pflugers Arch. 1988;411:204–11. doi: 10.1007/BF00582316. [DOI] [PubMed] [Google Scholar]
- Pysh JJ, Khan T. Variations in mitochondrial structure and content of neurons and neuroglia in rat brain: an electron microscopic study. Brain Res. 1972;36:1–18. doi: 10.1016/0006-8993(72)90762-7. [DOI] [PubMed] [Google Scholar]
- Rao KV, Norenberg MD. Manganese induces the mitochondrial permeability transition in cultured astrocytes. J Biol Chem. 2004;279:32333–8. doi: 10.1074/jbc.M402096200. [DOI] [PubMed] [Google Scholar]
- Rasmussen H, Barrett PQ. Calcium messenger system: an integrated view. Physiol Rev. 1984;64:938–84. doi: 10.1152/physrev.1984.64.3.938. [DOI] [PubMed] [Google Scholar]
- Reed DJ, Savage MK. Influence of metabolic inhibitors on mitochondrial permeability transition and glutathione status. Biochim Biophys Acta. 1995;1271:43–50. doi: 10.1016/0925-4439(95)00008-r. [DOI] [PubMed] [Google Scholar]
- Reinert KC, Dunbar RL, Gao W, Chen G, Ebner TJ. Flavoprotein autofluorescence imaging of neuronal activation in the cerebellar cortex in vivo. J Neurophysiol. 2004;92:199–211. doi: 10.1152/jn.01275.2003. [DOI] [PubMed] [Google Scholar]
- Riepe MW, Kasischke K, Raupach A. Acetylsalicylic acid increases tolerance against hypoxic and chemical hypoxia. Stroke. 1997;28:2006–11. doi: 10.1161/01.str.28.10.2006. [DOI] [PubMed] [Google Scholar]
- Rieske JS, Baum H, Stoner CD, Lipton SH. On the antimycin-sensitive cleavage of complex 3 of the mitochondrial respiratory chain. J Biol Chem. 1967;242:4854–66. [PubMed] [Google Scholar]
- Rintoul GL, Bennett VJ, Papaconstandinou NA, Reynolds IJ. Nitric oxide inhibits mitochondrial movement in forebrain neurons associated with disruption of mitochondrial membrane potential. J Neurochem. 2006 doi: 10.1111/j.1471-4159.2006.03788.x. [DOI] [PubMed] [Google Scholar]
- Rintoul GL, Filiano AJ, Brocard JB, Kress GJ, Reynolds IJ. Glutamate decreases mitochondrial size and movement in primary forebrain neurons. J Neurosci. 2003;23:7881–8. doi: 10.1523/JNEUROSCI.23-21-07881.2003. [DOI] [PMC free article] [PubMed] [Google Scholar]
- Rizzuto R, Brini M, Pizzo P, Murgia M, Pozzan T. Chimeric green fluorescent protein as a tool for visualizing subcellular organelles in living cells. Curr Biol. 1995;5:635–42. doi: 10.1016/s0960-9822(95)00128-x. [DOI] [PubMed] [Google Scholar]
- Rosenthal M, Feng ZC, Raffin CN, Harrison M, Sick TJ. Mitochondrial hyperoxidation signals residual intracellular dysfunction after global ischemia in rat neocortex. J Cereb Blood Flow Metab. 1995;15:655–65. doi: 10.1038/jcbfm.1995.81. [DOI] [PubMed] [Google Scholar]
- Rosenthal M, Jöbsis FF. Intracellular redox changes in functioning cerebral cortex. II. Effects of direct cortical stimulation. J Neurophysiol. 1971;34:750–62. doi: 10.1152/jn.1971.34.5.750. [DOI] [PubMed] [Google Scholar]
- Rosenthal M, Somjen G. Spreading depression, sustained potential shifts, and metabolic activity of cerebral cortex of cats. J Neurophysiol. 1973;36:739–49. doi: 10.1152/jn.1973.36.4.739. [DOI] [PubMed] [Google Scholar]
- Royall JA, Ischiropoulos H. Evaluation of 2',7'-dichlorofluorescin and dihydrorhodamine 123 as fluorescent probes for intracellular H2O2 in cultured endothelial cells. Arch Biochem Biophys. 1993;302:348–55. doi: 10.1006/abbi.1993.1222. [DOI] [PubMed] [Google Scholar]
- Ruben L, Hutchinson A, Moehlman J. Calcium homeostasis in Trypanosoma brucei. Identification of a pH-sensitive non-mitochondrial calcium pool. J Biol Chem. 1991;266:24351–8. [PubMed] [Google Scholar]
- Saulle E, Gubellini P, Picconi B, Centonze D, Tropepi D, Pisani A, Morari M, Marti M, Rossi L, Papa M, Bernardi G, Calabresi P. Neuronal vulnerability following inhibition of mitochondrial complex II: a possible ionic mechanism for Huntington's disease. Mol Cell Neurosci. 2004;25:9–20. doi: 10.1016/j.mcn.2003.09.013. [DOI] [PubMed] [Google Scholar]
- Scaduto RC, Jr, Grotyohann LW. Measurement of mitochondrial membrane potential using fluorescent rhodamine derivatives. Biophys J. 1999;76:469–77. doi: 10.1016/S0006-3495(99)77214-0. [DOI] [PMC free article] [PubMed] [Google Scholar]
- Schiff SJ, Somjen GG. Overshoot of oxygen pressure in post-hypoxic brain tissue: a re-evaluation. Brain Res. 1985;344:150–3. doi: 10.1016/0006-8993(85)91200-4. [DOI] [PubMed] [Google Scholar]
- Schild L, Huppelsberg J, Kahlert S, Keilhoff G, Reiser G. Brain mitochondria are primed by moderate Ca2+ rise upon hypoxia/reoxygenation for functional breakdown and morphological disintegration. J Biol Chem. 2003;278:25454–60. doi: 10.1074/jbc.M302743200. [DOI] [PubMed] [Google Scholar]
- Schmidt-Kastner R, Freund TF. Selective vulnerability of the hippocampus in brain ischemia. Neuroscience. 1991;40:599–636. doi: 10.1016/0306-4522(91)90001-5. [DOI] [PubMed] [Google Scholar]
- Schuchmann S, Lückermann M, Kulik A, Heinemann U, Ballanyi K. Ca2+- and metabolism-related changes of mitochondrial potential in voltage-clamped CA1 pyramidal neurons in situ. J Neurophysiol. 2000;83:1710–21. doi: 10.1152/jn.2000.83.3.1710. [DOI] [PubMed] [Google Scholar]
- Schulz JB, Beal MF. Mitochondrial dysfunction in movement disorders. Curr Opin Neurol. 1994;7:333–9. doi: 10.1097/00019052-199408000-00010. [DOI] [PubMed] [Google Scholar]
- Schurr A, Payne RS, Miller JJ, Tseng MT. Preischemic hyperglycemia-aggravated damage: evidence that lactate utilization is beneficial and glucose-induced corticosterone release is detrimental. J Neurosci Res. 2001;66:782–9. doi: 10.1002/jnr.10065. [DOI] [PubMed] [Google Scholar]
- Seharaseyon J, Ohler A, Sasaki N, Fraser H, Sato T, Johns DC, O'Rourke B, Marban E. Molecular composition of mitochondrial ATP-sensitive potassium channels probed by viral Kir gene transfer. J Mol Cell Cardiol. 2000;32:1923–30. doi: 10.1006/jmcc.2000.1226. [DOI] [PubMed] [Google Scholar]
- Sengpiel B, Preis E, Krieglstein J, Prehn JH. NMDA-induced superoxide production and neurotoxicity in cultured rat hippocampal neurons: role of mitochondria. Eur J Neurosci. 1998;10:1903–10. doi: 10.1046/j.1460-9568.1998.00202.x. [DOI] [PubMed] [Google Scholar]
- Senior AE. ATP synthesis by oxidative phosphorylation. Physiol Rev. 1988;68:177–231. doi: 10.1152/physrev.1988.68.1.177. [DOI] [PubMed] [Google Scholar]
- Serrano F, Klann E. Reactive oxygen species and synaptic plasticity in the aging hippocampus. Ageing Res Rev. 2004;3:431–43. doi: 10.1016/j.arr.2004.05.002. [DOI] [PubMed] [Google Scholar]
- Shuttleworth CW, Brennan AM, Connor JA. NAD(P)H fluorescence imaging of postsynaptic neuronal activation in murine hippocampal slices. J Neurosci. 2003;23:3196–208. doi: 10.1523/JNEUROSCI.23-08-03196.2003. [DOI] [PMC free article] [PubMed] [Google Scholar]
- Sick TJ, Kreisman NR. Local tissue oxygen tension as an index of changes in oxidative metabolism in the bullfrog optic tectum. Brain Res. 1979;169:575–9. doi: 10.1016/0006-8993(79)90407-4. [DOI] [PubMed] [Google Scholar]
- Sick TJ, Perez-Pinzon MA. Optical Methods for Probing Mitochondrial Function in Brain Slices. Methods. 1999;18:104–108. doi: 10.1006/meth.1999.0763. [DOI] [PubMed] [Google Scholar]
- Simbula G, Glascott PA, Jr, Akita S, Hoek JB, Farber JL. Two mechanisms by which ATP depletion potentiates induction of the mitochondrial permeability transition. Am J Physiol. 1997;273:C479–88. doi: 10.1152/ajpcell.1997.273.2.C479. [DOI] [PubMed] [Google Scholar]
- Sipos I, Tretter L, Adam-Vizi V. Quantitative relationship between inhibition of respiratory complexes and formation of reactive oxygen species in isolated nerve terminals. J Neurochem. 2003;84:112–8. doi: 10.1046/j.1471-4159.2003.01513.x. [DOI] [PubMed] [Google Scholar]
- Skulachev VP. Mitochondrial filaments and clusters as intracellular power-transmitting cables. Trends Biochem Sci. 2001;26:23–9. doi: 10.1016/s0968-0004(00)01735-7. [DOI] [PubMed] [Google Scholar]
- Smaili SS, Russell JT. Permeability transition pore regulates both mitochondrial membrane potential and agonist-evoked Ca2+ signals in oligodendrocyte progenitors. Cell Calcium. 1999;26:121–30. doi: 10.1054/ceca.1999.0061. [DOI] [PubMed] [Google Scholar]
- Smiley ST, Reers M, Mottola-Hartshorn C, Lin M, Chen A, Smith TW, Steele GD, Jr, Chen LB. Intracellular heterogeneity in mitochondrial membrane potentials revealed by a J-aggregate-forming lipophilic cation JC-1. Proc Natl Acad Sci U S A. 1991;88:3671–5. doi: 10.1073/pnas.88.9.3671. [DOI] [PMC free article] [PubMed] [Google Scholar]
- Somjen GG, Aitken PG, Czeh GL, Herreras O, Jing J, Young JN. Mechanism of spreading depression: a review of recent findings and a hypothesis. Can J Physiol Pharmacol. 1992;70(Suppl):S248–54. doi: 10.1139/y92-268. [DOI] [PubMed] [Google Scholar]
- Stamer K, Vogel R, Thies E, Mandelkow E, Mandelkow EM. Tau blocks traffic of organelles, neurofilaments, and APP vesicles in neurons and enhances oxidative stress. J Cell Biol. 2002;156:1051–63. doi: 10.1083/jcb.200108057. [DOI] [PMC free article] [PubMed] [Google Scholar]
- Starkov AA, Fiskum G. Regulation of brain mitochondrial H2O2 production by membrane potential and NAD(P)H redox state. J Neurochem. 2003;86:1101–7. doi: 10.1046/j.1471-4159.2003.01908.x. [DOI] [PubMed] [Google Scholar]
- Stock D, Gibbons C, Arechaga I, Leslie AG, Walker JE. The rotary mechanism of ATP synthase. Curr Opin Struct Biol. 2000;10:672–9. doi: 10.1016/s0959-440x(00)00147-0. [DOI] [PubMed] [Google Scholar]
- Storozhevykh TP, Yuryavichyus AI, Sorokina EG, Pinelis VG. Induction of cyclosporin A-sensitive pore in mitochondria of intact neurons during uncoupling of oxidative phosphorylation. Bull Exp Biol Med. 2001;131:440–3. doi: 10.1023/a:1017963629229. [DOI] [PubMed] [Google Scholar]
- Stout AK, Raphael HM, Kanterewicz BI, Klann E, Reynolds IJ. Glutamate-induced neuron death requires mitochondrial calcium uptake. Nat Neurosci. 1998;1:366–73. doi: 10.1038/1577. [DOI] [PubMed] [Google Scholar]
- Streller T, Huckstorf C, Pfeiffer C, Acker H. Unusual cytochrome a592 with low PO2 affinity correlates as putative oxygen sensor with rat carotid body chemoreceptor discharge. Faseb J. 2002;16:1277–9. doi: 10.1096/fj.02-0166fje. [DOI] [PubMed] [Google Scholar]
- Strong AJ, Harland SP, Meldrum BS, Whittington DJ. The use of in vivo fluorescence image sequences to indicate the occurrence and propagation of transient focal depolarizations in cerebral ischemia. J Cereb Blood Flow Metab. 1996;16:367–77. doi: 10.1097/00004647-199605000-00003. [DOI] [PubMed] [Google Scholar]
- Strong AJ, Smith SE, Whittington DJ, Meldrum BS, Parsons AA, Krupinski J, Hunter AJ, Patel S, Robertson C. Factors influencing the frequency of fluorescence transients as markers of peri-infarct depolarizations in focal cerebral ischemia. Stroke. 2000;31:214–22. doi: 10.1161/01.str.31.1.214. [DOI] [PubMed] [Google Scholar]
- Sun F, Huo X, Zhai Y, Wang A, Xu J, Su D, Bartlam M, Rao Z. Crystal structure of mitochondrial respiratory membrane protein complex II. Cell. 2005;121:1043–57. doi: 10.1016/j.cell.2005.05.025. [DOI] [PubMed] [Google Scholar]
- Sun P, Rane SG, Gunasekar PG, Borowitz JL, Isom GE. Modulation of the NMDA receptor by cyanide: enhancement of receptor-mediated responses. J Pharmacol Exp Ther. 1997;280:1341–8. [PubMed] [Google Scholar]
- Szabados T, Dul C, Majtenyi K, Hargitai J, Penzes Z, Urbanics R. A chronic Alzheimer's model evoked by mitochondrial poison sodium azide for pharmacological investigations. Behav Brain Res. 2004;154:31–40. doi: 10.1016/j.bbr.2004.01.016. [DOI] [PubMed] [Google Scholar]
- Takahashi A, Camacho P, Lechleiter JD, Herman B. Measurement of intracellular calcium. Physiol Rev. 1999;79:1089–125. doi: 10.1152/physrev.1999.79.4.1089. [DOI] [PubMed] [Google Scholar]
- Takeda Y, Perez-Pinzon MA, Ginsberg MD, Sick TJ. Mitochondria consume energy and compromise cellular membrane potential by reversing ATP synthetase activity during focal ischemia in rats. J Cereb Blood Flow Metab. 2004;24:986–92. doi: 10.1097/01.WCB.0000127966.84050.61. [DOI] [PubMed] [Google Scholar]
- Taylor CP, Weber ML, Gaughan CL, Lehning EJ, LoPachin RM. Oxygen/glucose deprivation in hippocampal slices: altered intraneuronal elemental composition predicts structural and functional damage. J Neurosci. 1999;19:619–29. doi: 10.1523/JNEUROSCI.19-02-00619.1999. [DOI] [PMC free article] [PubMed] [Google Scholar]
- Teruel MN, Blanpied TA, Shen K, Augustine GJ, Meyer T. A versatile microporation technique for the transfection of cultured CNS neurons. J Neurosci Methods. 1999;93:37–48. doi: 10.1016/s0165-0270(99)00112-0. [DOI] [PubMed] [Google Scholar]
- Thayer SA, Miller RJ. Regulation of the intracellular free calcium concentration in single rat dorsal root ganglion neurones in vitro. J Physiol. 1990;425:85–115. doi: 10.1113/jphysiol.1990.sp018094. [DOI] [PMC free article] [PubMed] [Google Scholar]
- Thiels E, Urban NN, Gonzalez-Burgos GR, Kanterewicz BI, Barrionuevo G, Chu CT, Oury TD, Klann E. Impairment of long-term potentiation and associative memory in mice that overexpress extracellular superoxide dismutase. J Neurosci. 2000;20:7631–9. doi: 10.1523/JNEUROSCI.20-20-07631.2000. [DOI] [PMC free article] [PubMed] [Google Scholar]
- Thompson JK, Peterson MR, Freeman RD. Single-neuron activity and tissue oxygenation in the cerebral cortex. Science. 2003;299:1070–2. doi: 10.1126/science.1079220. [DOI] [PubMed] [Google Scholar]
- Tombaugh GC, Somjen GG. Effects of extracellular pH on voltage-gated Na+, K+ and Ca2+ currents in isolated rat CA1 neurons. J Physiol. 1996;493 (Pt 3):719–32. doi: 10.1113/jphysiol.1996.sp021417. [DOI] [PMC free article] [PubMed] [Google Scholar]
- Tombaugh GC, Somjen GG. Differential sensitivity to intracellular pH among high- and low-threshold Ca2+ currents in isolated rat CA1 neurons. J Neurophysiol. 1997;77:639–53. doi: 10.1152/jn.1997.77.2.639. [DOI] [PubMed] [Google Scholar]
- Tomlinson FH, Anderson RE, Meyer FB. Brain pHi, cerebral blood flow, and NADH fluorescence during severe incomplete global ischemia in rabbits. Stroke. 1993;24:435–43. doi: 10.1161/01.str.24.3.435. [DOI] [PubMed] [Google Scholar]
- Travis RP, Jr, Clark LC., Jr Changes in evoked brain oxygen during sensory stimulation and conditioning. Electroencephalogr Clin Neurophysiol. 1965;19:484–91. doi: 10.1016/0013-4694(65)90188-4. [DOI] [PubMed] [Google Scholar]
- Tretter L, Chinopoulos C, Adam-Vizi V. Enhanced depolarization-evoked calcium signal and reduced [ATP]/[ADP] ratio are unrelated events induced by oxidative stress in synaptosomes. J Neurochem. 1997;69:2529–37. doi: 10.1046/j.1471-4159.1997.69062529.x. [DOI] [PubMed] [Google Scholar]
- Trollinger DR, Cascio WE, Lemasters JJ. Selective loading of Rhod 2 into mitochondria shows mitochondrial Ca2+ transients during the contractile cycle in adult rabbit cardiac myocytes. Biochem Biophys Res Commun. 1997;236:738–42. doi: 10.1006/bbrc.1997.7042. [DOI] [PubMed] [Google Scholar]
- Truelove D, Shuaib A, Ijaz S, Richardson S, Kalra J. Superoxide dismutase, catalase, and U78517F attenuate neuronal damage in gerbils with repeated brief ischemic insults. Neurochem Res. 1994;19:665–71. doi: 10.1007/BF00967704. [DOI] [PubMed] [Google Scholar]
- Urushitani M, Nakamizo T, Inoue R, Sawada H, Kihara T, Honda K, Akaike A, Shimohama S. N-methyl-D-aspartate receptor-mediated mitochondrial Ca2+ overload in acute excitotoxic motor neuron death: a mechanism distinct from chronic neurotoxicity after Ca2+ influx. J Neurosci Res. 2001;63:377–87. doi: 10.1002/1097-4547(20010301)63:5<377::AID-JNR1032>3.0.CO;2-#. [DOI] [PubMed] [Google Scholar]
- van Rossum D, Hanisch UK. Cytoskeletal dynamics in dendritic spines: direct modulation by glutamate receptors? Trends Neurosci. 1999;22:290–5. doi: 10.1016/s0166-2236(99)01404-6. [DOI] [PubMed] [Google Scholar]
- Vergun O, Reynolds IJ. Fluctuations in mitochondrial membrane potential in single isolated brain mitochondria: modulation by adenine nucleotides and Ca2+ Biophys J. 2004;87:3585–93. doi: 10.1529/biophysj.104.042671. [DOI] [PMC free article] [PubMed] [Google Scholar]
- Villalba M, Martinez-Serrano A, Gomez-Puertas P, Blanco P, Börner C, Villa A, Casado M, Gimenez C, Pereira R, Bogonez E, Pozzan T, Satrustegui J. The role of pyruvate in neuronal calcium homeostasis. Effects on intracellular calcium pools. J Biol Chem. 1994;269:2468–76. [PubMed] [Google Scholar]
- von Lewinski F, Keller BU. Mitochondrial Ca2+ buffering in hypoglossal motoneurons from mouse. Neurosci Lett. 2005;380:203–8. doi: 10.1016/j.neulet.2005.01.010. [DOI] [PubMed] [Google Scholar]
- Votyakova TV, Reynolds IJ. ΔΨm-dependent and -independent production of reactive oxygen species by rat brain mitochondria. J Neurochem. 2001;79:266–77. doi: 10.1046/j.1471-4159.2001.00548.x. [DOI] [PubMed] [Google Scholar]
- Walker JE. The regulation of catalysis in ATP synthase. Curr Opin Struct Biol. 1994;4:912–8. doi: 10.1016/0959-440x(94)90274-7. [DOI] [PubMed] [Google Scholar]
- Walker JE. Determination of the structures of respiratory enzyme complexes from mammalian mitochondria. Biochim Biophys Acta. 1995;1271:221–7. doi: 10.1016/0925-4439(95)00031-x. [DOI] [PubMed] [Google Scholar]
- Washbourne P, McAllister AK. Techniques for gene transfer into neurons. Curr Opin Neurobiol. 2002;12:566–73. doi: 10.1016/s0959-4388(02)00365-3. [DOI] [PubMed] [Google Scholar]
- Wei G, Hough CJ, Sarvey JM. The mitochondrial toxin, 3-nitropropionic acid, induces extracellular Zn2+ accumulation in rat hippocampus slices. Neurosci Lett. 2004;370:118–22. doi: 10.1016/j.neulet.2004.08.027. [DOI] [PubMed] [Google Scholar]
- Welsh FA, Marcy VR, Sims RE. NADH fluorescence and regional energy metabolites during focal ischemia and reperfusion of rat brain. J Cereb Blood Flow Metab. 1991;11:459–65. doi: 10.1038/jcbfm.1991.88. [DOI] [PubMed] [Google Scholar]
- Werth JL, Thayer SA. Mitochondria buffer physiological calcium loads in cultured rat dorsal root ganglion neurons. J Neurosci. 1994;14:348–56. doi: 10.1523/JNEUROSCI.14-01-00348.1994. [DOI] [PMC free article] [PubMed] [Google Scholar]
- White RJ, Reynolds IJ. Mitochondria and Na+/Ca2+ exchange buffer glutamate-induced calcium loads in cultured cortical neurons. J Neurosci. 1995;15:1318–28. doi: 10.1523/JNEUROSCI.15-02-01318.1995. [DOI] [PMC free article] [PubMed] [Google Scholar]
- White RJ, Reynolds IJ. Mitochondrial depolarization in glutamate-stimulated neurons: an early signal specific to excitotoxin exposure. J Neurosci. 1996;16:5688–97. doi: 10.1523/JNEUROSCI.16-18-05688.1996. [DOI] [PMC free article] [PubMed] [Google Scholar]
- Wieraszko A, Goldsmith G, Seyfried TN. Stimulation-dependent release of adenosine triphosphate from hippocampal slices. Brain Res. 1989;485:244–50. doi: 10.1016/0006-8993(89)90567-2. [DOI] [PubMed] [Google Scholar]
- Wilson JE. Isozymes of mammalian hexokinase: structure, subcellular localization and metabolic function. J Exp Biol. 2003;206:2049–57. doi: 10.1242/jeb.00241. [DOI] [PubMed] [Google Scholar]
- Wong-Riley MT. Cytochrome oxidase: an endogenous metabolic marker for neuronal activity. Trends Neurosci. 1989;12:94–101. doi: 10.1016/0166-2236(89)90165-3. [DOI] [PubMed] [Google Scholar]
- Woodfield K, Ruck A, Brdiczka D, Halestrap AP. Direct demonstration of a specific interaction between cyclophilin-D and the adenine nucleotide translocase confirms their role in the mitochondrial permeability transition. Biochem J. 1998;336 (Pt 2):287–90. doi: 10.1042/bj3360287. [DOI] [PMC free article] [PubMed] [Google Scholar]
- Wozniak MJ, Melzer M, Dorner C, Haring HU, Lammers R. The novel protein KBP regulates mitochondria localization by interaction with a kinesin-like protein. BMC Cell Biol. 2005;6:35. doi: 10.1186/1471-2121-6-35. [DOI] [PMC free article] [PubMed] [Google Scholar]
- Yaffe MP. The cutting edge of mitochondrial fusion. Nat Cell Biol. 2003;5:497–9. doi: 10.1038/ncb0603-497b. [DOI] [PubMed] [Google Scholar]
- Yao J, Larson DR, Vishwasrao HD, Zipfel WR, Webb WW. Blinking and nonradiant dark fraction of water-soluble quantum dots in aqueous solution. Proc Natl Acad Sci U S A. 2005;102:14284–9. doi: 10.1073/pnas.0506523102. [DOI] [PMC free article] [PubMed] [Google Scholar]
- Yermolaieva O, Brot N, Weissbach H, Heinemann SH, Hoshi T. Reactive oxygen species and nitric oxide mediate plasticity of neuronal calcium signaling. Proc Natl Acad Sci U S A. 2000;97:448–53. doi: 10.1073/pnas.97.1.448. [DOI] [PMC free article] [PubMed] [Google Scholar]