

Abstract
Peroxisome proliferator-activated receptor gamma (PPARγ) is a nuclear receptor regulated by the insulin-sensitizing thiazolidinediones (TZDs). We studied selective modulation of endogenous genes by PPARγ ligands using microarray, RNA expression kinetics, and chromatin immunoprecipitation (ChIP) in 3T3-L1 adipocytes. We found over 300 genes that were significantly regulated the TZDs pioglitazone, rosiglitazone, troglitazone. TZD-mediated expression profiles were unique but overlapping. Ninety-one genes were commonly regulated by all three ligands. TZD time course and dose response studies revealed gene- and TZD-specific expression kinetics. PEPCK expression was induced rapidly but PDK4 expression was induced gradually. Troglitazone EC50 values for PEPCK, PDK4, and RGS2 regulation were greater than those for pioglitazone and rosiglitazone. TZDs differentially induced histone acetylation of and PPARγ recruitment to target gene promoters. Selective modulation of PPARγ by TZDs resulted in distinct expression profiles and transcription kinetics which may be due to differential promoter activation and chromatin remodeling of target genes.
Keywords: thiazolidinedione (TZD), selective peroxisome proliferator-activated receptor modulator (SPPARM), microarray, chromatin immunoprecipitation, transcription, 3T3-L1 adipocytes
Introduction
The nuclear receptor peroxisome proliferator-activated receptor gamma (PPARγ) plays a significant role in mediating insulin sensitivity [1]. Natural ligands of PPARγ include fatty acids and prostaglandin derivatives, synthetic ligands of PPARγ include the insulin-sensitizing thiazolidinediones (TZDs). PPARγ heterodimerizes with the retinoid X receptor (RXR) and binds to PPAR response elements (PPREs) in promoters of target genes. TZDs enhance insulin sensitivity presumably by regulating PPARγ-mediated gene expression. PPARγ ligands regulate the expression of many genes [2-4], including those involved in regulating metabolism (e.g., PEPCK [4, 5] and GyK [6]) and insulin action (e.g., annexin II [7], CAP [2, 4, 8], and RGS2 [9]). Expression of the PPARγ gene itself is down-regulated by PPARγ ligands [10, 11]. TZD-induced changes in gene expression can be observed a few hours after treatment and at doses that correlate with PPARγ activation and insulin-sensitization [8]. Despite these studies, the genes responsible for PPARγ ligand-induced insulin sensitization are still not known.
TZDs are potent insulin-sensitizing agents in vivo. However, their PPARγ binding affinities and transcriptional activities differ [12, 13]. How do different PPARγ ligands bind the same receptor protein, PPARγ, and effect ligand-specific physiological outcomes [14] and transcriptional activity [13]? Gene expression differences exhibited by PPARγ ligands are potentially explained by the selective PPAR modulator (SPPARM) model [14]. In this model, PPARγ ligands differentially regulate gene expression by conferring ligand-specific conformations to PPARγ. For example, the receptor conformation induced by ligand A may favor different interactions with transcriptional coregulators and promoter DNAs than the conformation induced by ligand B. Thus, ligands A and B would each have ligand-specific transcriptional activity. Ligand-induced changes in PPARγ conformation and ligand-selective interaction of PPARγ and coactivators have been reported in vitro [2, 13, 15-17]. The molecular mechanisms that regulate ligand-selective modulation of endogenous PPARγ target genes and physiological potency are not well characterized.
Herein, we report PPARγ ligand-selective modulation of endogenous gene expression profiles, gene regulation kinetics, and promoter activation. We found that the expression profiles of three TZDs were unique but overlapping. We identified a Core Set of 91 genes commonly regulated by the TZDs. Some of these genes are known modulators of insulin sensitivity and some may be previously unidentified modulators of insulin sensitivity. We have demonstrated gene-specific and ligand-specific gene regulation using time course and dose response expression studies. Our data suggest that the SPPARM concept is manifested by differential regulation of target gene promoters including recruitment of PPARγ and histone acetylation.
Materials and Methods
Materials
3T3-L1 adipocytes were differentiated as described [18] and studied 12-16 days post-differentiation. TZDs were obtained from Pfizer, Inc. (La Jolla, CA). PD068235 was a gift from Heidi Camp and Todd Leff. RNeasy Kits (Qiagen) were used to prepare total RNA. Antibodies – anti-acetylated histone H4 (Upstate Biotechnology), anti-PPARγ (Geneka/Active Motif, Santa Cruz Biotechnology, Cell Signaling Technology and Cayman Chemicals).
Microarray analyses
Biotinylated-cRNA made from each RNA preparation was used to probe Affymetrix Murine Genome U74Aver2 GeneChips (Affymetrix) (Invitrogen protocol). Briefly, cDNA was synthesized with the SuperScript Choice system (Invitrogen) using a T7-(dT)24 oligomer (Ambion). Biotin-labeled cRNA probes were in vitro transcribed using the BioArray High Yield RNA Transcript Labeling Kit (Enzo Life Sciences). Gene expression levels, expressed as average difference scores, were determined using Affymetrix MAS 5.0 software. Statistical analyses were conducted using a paired-test version of the VAMPIRE algorithm for microarray data [19, 20]. Statistically significant expression changes were identified using a Bonferroni error threshold of αBonf=0.05, which accounts for multiple-testing errors. Data from individual RNA samples were generated (controls n=9, pioglitazone n=5, rosiglitazone and troglitazone n=7 each) and pooled with data from a previous study [20] (controls n=3, pioglitazone n=2, rosiglitazone and troglitazone n=3 each). Data from experiments conducted in parallel were paired for statistical analyses. We used the statistical tool GOby [19] to detect significantly enriched representation of Gene Ontology (GO) terms in our gene expression profiles compared to the total microarray gene set (Bonferroni error threshold of αBonf=0.05). VAMPIRE and GOby tools are accessible online [19].
Chromatin immunoprecipitation (ChIP)
Our ChIP method is adapted from two protocols [21, 22]. See supplementary material.
Semi-quantitative reverse transcriptase (RT)-PCR and ChIP PCR
RNA amounts used for RT-PCR were within a linear range of amplification for each target gene in 25 cycle programs (One Step RT-PCR kit, Qiagen). Ethidium bromide-stained RT-PCR products in acrylamide gels were visualized and quantified using the digital Kodak 3D Imagestation and associated software (Kodak). Triplicate ChIP DNA samples were amplified (HotStart, Qiagen) using a 35 cycle PCR program (in the linear range of amplification for all targets). PCR products were quantified as described above. IP sample PCR product signals were normalized to input DNA control samples. Non-specific signal from IgG control IPs was subtracted from each test antibody IP (PPARγ or acetylated histone H4) signal. See supplementary material for primer sequences.
Statistical analyses
Student's t test and one-way ANOVA were used for statistical analyses of RT-PCR and ChIP data. A p-value cutoff of 0.05 was used to determine significance. Statistical analyses of microarray data are described above.
Results
Distinct but overlapping expression profiles of PPARγ ligands
We characterized the microarray expression profiles induced by three TZDs in fully differentiated 3T3-L1 adipocytes. Cells were treated 24hr with vehicle (DMSO) or individual TZDs pioglitazone, rosiglitazone, and troglitazone at doses known to elicit maximal biological effects (20μM, 1μM, and 20μM, respectively) [13, 23-25]. We identified 326 genes that were activated or repressed after treatment with any one of the TZDs. Each TZD had a unique expression profile, similar to that of the other TZDs. A Core Set of 91 genes was commonly regulated by all three TZDs (Table 1A), of which 35 genes were activated and 56 were repressed after ligand treatment. Fifty-nine genes were commonly regulated by two of the three TZDs (Table 1B). Genes in Table 1 that have a PPRE in their promoter are indicated. For some genes, the ligand-induced fold changes in expression were similar for the three ligands but one or more ligand effects were not significantly different from the control. Overlap between the TZD-induced expression profiles, as predicted by the SPPARM model, is shown schematically in Figure 1. The TZD expression profiles have statistically distinct features, e.g., fold changes in expression of Hmox1, EST-EntrezGene ID#70186, and Cidea (Table 1B) are significantly different between the TZDs. Most Core Set genes (Table 1A) have Gene Ontology (GO) term annotations that describe their function and/or cellular localization (EntrezGene database, National Center for Biotechnology Information). We analyzed the Core Set of genes for enrichment of GO terms using GOby [19] and found significant enrichment of GO terms associated with the regulation of glucose and lipid metabolism, mitochondrial function, and gene expression.
Figure 1. Venn diagrams of TZD expression profiles.

The total number of genes regulated by a particular TZD is shown next to the name. The number of genes uniquely regulated by a TZD is contained in the non-overlapping regions of each circle. The numbers of genes similarly regulated by two or three TZDs are contained in the overlapping regions of the circles. Replicates: pioglitazone, n=7; rosiglitazone and troglitazone, n=10 each.
Gene- and ligand-specific kinetics of PPARγ target gene expression
We used TZD treatment doses and duration that would induce maximal expression changes in our microarray studies. While maximal doses are useful for identifying target genes, differences in gene sensitivity and ligand specificity at submaximal incubation times and ligand doses can be informative regarding gene regulation. We conducted time course and dose response studies of TZD-induced expression changes in the target genes PEPCK (Pck1), PDK4, CAP (Sorbs1), PPARγ, and RGS2 using semi-quantitative RT-PCR. The magnitude of expression change varied for these five genes (e.g., PEPCK was activated ∼5-fold and CAP was activated ∼2-fold). To directly compare the kinetics of activation or repression for the different genes, we expressed these data as a percent of the 24hr expression change observed at maximal ligand dose for each ligand/gene combination.
PEPCK, PDK4 and CAP were activated by all three TZDs (Table 1A and Figures 2A-C), however, their time course curves differ. The half-maximal time of PEPCK and CAP activation at was 2-3hr. PDK4 expression increased more slowly, with a half-maximal activation time of 10-12hr. These different time course profiles exemplify the kinetic variations one would expect for different mechanisms of gene regulation. TZD-mediated repression of RGS2 was greater than repression of PPARγ after 24hr (Table 1A). However, the time course profiles for PPARγ and RGS2 down-regulation by TZDs were not different when normalized for maximal expression change (Figures 2D&E). The half-maximal repression time for these genes was less than four hours.
Figure 2. Time course curves for TZD-regulated genes.

Genes activated (A-C) and repressed (D&E) by pioglitazone (20μM, triangles), rosiglitazone (1μM, circles), and troglitazone (20μM, squares). Data are expressed as a percent of the 24 hr mRNA expression response for each TZD, averages ± SE. n=4-6 per condition.
We observed further evidence of gene-specific regulation in 24hr dose response studies (Figures 3A-C). PEPCK and CAP were similarly activated by pioglitazone (EC50 ∼0.28uM) (Figure 3A) but PDK4 was significantly less sensitive (EC50 ∼0.6uM). PEPCK, CAP and PDK4 activation by rosiglitazone were similar in pattern to their activation by pioglitazone. However, the rosiglitazone response curves were not statistically different from each other (PEPCK and PDK4, Figure 3B; CAP not shown). In contrast, the troglitazone dose response curves for these genes were overlapping (PEPCK and PDK4, Figure 3C; CAP not shown). In general, the genes had the same rank in TZD sensitivity, i.e. PEPCK ≫ PDK4. The dose response curves were not different between PPARγ and RGS2.
Figure 3. Dose response curves for TZD-regulated genes.

A-C. Gene-specific regulation. *ANOVA, p<0.05 PDK4 vs PEPCK and CAP. D-G. SPPARM effects. Max doses: pioglitazone (20μM, triangles), rosiglitazone (1μM, circles), and troglitazone (20μM, squares). *ANOVA, p<0.05 troglitazone vs pioglitazone and rosiglitazone. Data are expressed as a percent of the max dose mRNA expression response for each TZD, averages ± SE. n=2-4 per condition.
We observed SPPARM effects in ligand-specific dose response curves (Figures 3D-G). TZD doses are expressed as a fraction of max dose to normalize for differences in max dose between the ligands. Pioglitazone and rosiglitazone were significantly more potent (EC50 values ∼0.014 and 0.03 of max, respectively) in activating PEPCK than troglitazone (EC50 ∼0.14 of max) (Figure 3D). Pioglitazone and rosiglitazone were also significantly more potent than troglitazone in activating PDK4 (Figure 3E) and repressing RGS2 (Figure 3G). CAP dose response curves were not significantly different between the three ligands (Figure 3F), but potency relationships between the ligands were similar to what we observed with PEPCK, PDK4 and RGS2. The difference between the troglitazone EC50 values and the pioglitazone and rosiglitazone EC50 values cannot simply be explained by ligand-receptor affinity differences since reported the receptor binding affinities of these three ligands are neither the same rank order nor the same order of magnitude as the gene activation EC50 value differences we observed (Discussion, [12]). We have observed SPPARM effects in expression studies of antagonism between different PPARγ ligands (see supplemental material).
TZDs alter histone acetylation at target gene promoters
Histone acetylation and chromatin remodeling of promoters are mechanisms regulating gene transcription [26]. We used chromatin immunoprecipitation (ChIP) to assess histone H4 acetylation in the functional PPRE-containing promoter regions of PEPCK, FATP, and AQP7 [5, 27, 28] after 45min incubation with vehicle or TZDs. PPARγ protein levels did not change during this short TZD treatment. Results generated from our ChIP studies are shown in Figure 4. Pioglitazone and rosiglitazone induced significant increases in PEPCK and AQP7 promoter histone H4 acetylation (Figure 4B). Rosiglitazone also increased FATP promoter histone H4 acetylation. Troglitazone treatment decreased PEPCK and FATP promoter histone H4 acetylation. Pioglitazone- and rosiglitazone-induced histone H4 acetylation was significantly greater than troglitazone-induced histone H4 acetylation at each promoter. These data indicate that the dynamics of chromatin remodeling are ligand-specific.
Figure 4. ChIP studies of endogenous promoters.
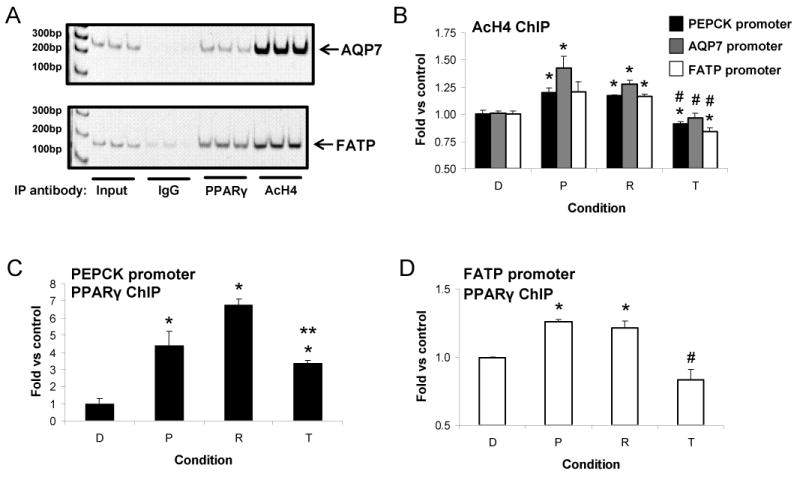
A. Representative AQP7 and FATP triplicate promoter PCR products from input DNA and IP samples. Antibodies: IgG – control, PPARγ, AcH4 – acetylated histone H4. B. AcH4 ChIP studies of PEPCK, AQP7, and FATP promoters. C&D. PPARγ ChIP studies of PEPCK and FATP promoters, respectively. ChIP data are averages ± SE from two independent experiments, each done in duplicate. D – DMSO control, P – pioglitazone, R – rosiglitazone, T – troglitazone. * p<0.05 vs DMSO control, ** p<0.05 vs rosiglitazone, # p<0.05 vs pioglitazone and rosiglitazone.
TZDs increase PPARγ occupancy at target gene promoters
Activation of promoters is also associated with changes in nuclear receptor occupancy. Little is known about whether PPARγ constitutively associates with target promoters or associates with target promoters after it is ligand bound. We used ChIP to examine TZD-induced changes in PPARγ occupancy at the PPRE-containing promoter regions of PEPCK and FATP. A cocktail of five antibodies was used to IP PPARγ. TZDs significantly increased the association of PPARγ and the PEPCK promoter (Figure 4C), although, troglitazone was significantly weaker than rosiglitazone. Pioglitazone and rosiglitazone induced a small, significant increase in the presence of PPARγ at the FATP promoter, each being significantly greater than that induced by troglitazone (Figure 4D).
Discussion
The SPPARM model depicts PPARγ transcriptional activity as function of specific, ligand-induced three-dimensional conformations and distinct coregulator and promoter DNA interactions which induce distinct expression profiles and physiological outcomes [14]. Evidence of differential PPARγ ligand transcriptional activity has been reported using artificial constructs [2, 13]. We have used several approaches to demonstrate the SPPARM phenomenon and gene-specific regulation of endogenous PPARγ target genes. Expression profiles of three TZDs were overlapping (Core Set of 91 genes commonly regulated) but unique (171 genes significantly regulated by only one of three TZDs). TZDs are potent insulin-sensitizers, thus, we hypothesized that the Core Set (Table 1A) would contain genes that mediate PPARγ ligand-induced insulin sensitization. The Core Set includes genes previously known to be PPARγ targets and modulators of insulin sensitivity. Several are interesting to note, given our hypothesis that genes down-regulated by TZDs dampen insulin action and genes up-regulated by TZDs enhance insulin action. For example, RGS2 is down-regulated by the TZDs (Table 1A) and inhibits insulin-stimulated GLUT4 translocation in 3T3-L1 adipocytes [9]. Annexin II is up-regulated by PPARγ ligands (Table 1A, [4, 7]) and enhances insulin action [7]. Other Core Set genes regulate lipid and glucose metabolism (Gyk [6], CAP [2, 4, 8], PEPCK [4, 5]). We speculate that our Core Set also contains previously unrecognized modulators of insulin sensitivity.
We observed gene-specific and ligand-specific kinetic profiles of endogenous PPARγ target gene expression. Our time course data show that increased expression of PEPCK and CAP is rapid whereas PDK4 is delayed. PPARγ can regulate target genes directly by binding to the target gene promoter, or indirectly by binding to or regulating expression of another transcription factor that modulates the target gene. The PEPCK and CAP promoters, but not the PDK4 promoter, have a PPRE. Thus, our results support the notion that PEPCK (previously shown [23]) and CAP are direct PPARγ targets and that PDK4 is an indirect PPARγ target. Submaximal doses of pioglitazone were similarly potent in activating PEPCK and CAP after 24hr, but significantly less potent in activating PDK4. Submaximal doses of rosiglitazone yielded similar results. Interestingly, PEPCK and PDK4 activation by troglitazone did not differ. Troglitazone was less potent than either pioglitazone or rosiglitazone in regulating PEPCK, PDK4, CAP, and RGS2 expression. These SPPARM effects on expression are consistent with results from our ChIP studies of TZD-induced chromatin remodeling.
Activation of promoters is associated with chromatin remodeling involving histone acetylation and nuclear receptor recruitment [26]. We found that pioglitazone and rosiglitazone, but not troglitazone treatment, increased PEPCK, AQP7, and FATP promoter histone H4 acetylation. We speculate that troglitazone may be less potent than pioglitazone and rosiglitazone in initiating histone acetylation. It is commonly thought that PPARγ/RXR constitutively binds to PPREs in target promoters and that ligands bind to the promoter-resident PPARγ/RXR to effect transcriptional regulation. However, many nuclear receptors associate with their promoters in a ligand-dependent manner [26]. Our data show that TZD treatment induces PPARγ recruitment to promoters of endogenous genes. Fluorescence spectroscopy studies support this finding [29]. TZDs increased co-immunoprecipitation of PPARγ protein and the PEPCK promoter, although troglitazone had a significantly weaker effect than rosiglitazone. Interestingly, troglitazone treatment decreased histone H4 acetylation as it increased PPARγ association with the PEPCK promoter. It is possible that, after 45min, troglitazone-bound PPARγ has associated with the promoter but that histone H4 remodeling has not yet progressed. Troglitazone consistently elicited weaker acetylated histone H4 and PPARγ ChIP responses than did pioglitazone and rosiglitazone. Troglitazone-bound PPARγ may have weaker promoter affinity and/or reduced epitope accessibility in the promoter complexes we analyzed.
Relative TZD potency in regulating gene expression and promoter remodeling most likely varies by gene and is a mechanism by which PPARγ ligands have unique expression profiles. Ligand-specific differences in expression kinetics and promoter dynamics cannot be attributed entirely to differences in ligand affinity for PPARγ. TZD IC50 values for human PPARγ ligand binding domain are the following: 41+/-18nM rosiglitazone, 4830+/-130nM pioglitazone, 7970+/-580nM troglitazone [12]. If a ligand's transcriptional potency were solely determined by PPARγ affinity, then one would expect that transcriptional potency would parallel receptor affinity. Instead, the TZD rank potency for inducing PEPCK and PDK4 expression and PEPCK chromatin remodeling is pioglitazone = rosiglitazone ≫ troglitazone. Our results suggest that pioglitazone- and rosiglitazone-bound PPARγ have greater affinity than troglitazone-bound PPARγ for the promoter DNAs and/or transcriptional activators that regulate PEPCK and PDK4 expression.
We have demonstrated the SPPARM model in endogenous gene regulation using genome-wide expression profiling, RNA expression kinetic studies, and promoter dynamics analyses. Selectively modulation of PPARγ activity leads to distinct transcriptional and physiological outcomes. Promoter environment conditions vary by cell type, species, and pathology, adding to the complexity of PPARγ ligand-mediated gene expression and insulin sensitization. Further studies of the mechanisms that regulate gene transcription coincident with insulin sensitization are critical for improving the design of insulin sensitizing compounds.
Supplementary Material
Acknowledgments
This work was supported by grants from the National Institutes of Health, NIDDK KO1-DK62025 (DDS), NIDDK RO1-DK33651 (JM Olefsky), and by the University of California Discovery Program Project #bio03-10383 (BioStar) with matching funds from Pfizer, Inc. (JM Olefsky). JM Olefsky is a consultant for Pfizer, Inc.
Footnotes
Publisher's Disclaimer: This is a PDF file of an unedited manuscript that has been accepted for publication. As a service to our customers we are providing this early version of the manuscript. The manuscript will undergo copyediting, typesetting, and review of the resulting proof before it is published in its final citable form. Please note that during the production process errors may be discovered which could affect the content, and all legal disclaimers that apply to the journal pertain.
References
- 1.Olefsky JM, Saltiel AR. PPARγ and the Treatment of Insulin Resistance. Trends in Endocrinology and Metabolism. 2000;11:362–368. doi: 10.1016/s1043-2760(00)00306-4. [DOI] [PubMed] [Google Scholar]
- 2.Berger JP, Petro AE, Macnaul KL, et al. Distinct properties and advantages of a novel PPARγ selective modulator. Mol Endocrinol. 2003;17:662–676. doi: 10.1210/me.2002-0217. [DOI] [PubMed] [Google Scholar]
- 3.Wilson-Fritch L, Burkart A, Bell G, et al. Mitochondrial biogenesis and remodeling during adipogenesis and in response to the insulin sensitizer rosiglitazone. Mol Cell Biol. 2003;23:1085–1094. doi: 10.1128/MCB.23.3.1085-1094.2003. [DOI] [PMC free article] [PubMed] [Google Scholar]
- 4.Way JM, Harrington WW, Brown KK, et al. Comprehensive messenger ribonucleic acid profiling reveals that PPARγ activation has coordinate effects on gene expression in multiple insulin-sensitive tissues. Endocrinology. 2001;142:1269–1277. doi: 10.1210/endo.142.3.8037. [DOI] [PubMed] [Google Scholar]
- 5.Huang J, Hsia SH, Imamura T, et al. Annexin II is a thiazolidinedione-responsive gene involved in insulin-induced glucose transporter isoform 4 translocation in 3T3-L1 adipocytes. Endocrinology. 2004;145:1579–1586. doi: 10.1210/en.2003-1197. [DOI] [PubMed] [Google Scholar]
- 6.Ribon V, Johnson JH, Camp HS, et al. Thiazolidinediones and insulin resistance: PPARγ activation stimulates expression of the CAP gene. Proc Natl Acad Sci U S A. 1998;95:14751–14756. doi: 10.1073/pnas.95.25.14751. [DOI] [PMC free article] [PubMed] [Google Scholar]
- 7.Imamura T, Vollenweider P, Egawa K, et al. G alpha-q/11 protein plays a key role in insulin-induced glucose transport in 3T3-L1 adipocytes. Mol Cell Biol. 1999;19:6765–6774. doi: 10.1128/mcb.19.10.6765. [DOI] [PMC free article] [PubMed] [Google Scholar]
- 8.Beale EG, Forest C, Hammer RE. Regulation of cytosolic phosphoenolpyruvate carboxykinase gene expression in adipocytes. Biochimie. 2003;85:1207–1211. doi: 10.1016/j.biochi.2003.10.012. [DOI] [PubMed] [Google Scholar]
- 9.Guan HP, Li Y, Jensen MV, et al. A futile metabolic cycle activated in adipocytes by antidiabetic agents. Nat Med. 2002;8:1122–1128. doi: 10.1038/nm780. [DOI] [PubMed] [Google Scholar]
- 10.Hauser S, Adelmant G, Sarraf P, et al. Degradation of the PPARγ is linked to ligand-dependent activation. J Biol Chem. 2000;275:18527–18533. doi: 10.1074/jbc.M001297200. [DOI] [PubMed] [Google Scholar]
- 11.Camp HS, Whitton AL, Tafuri SR. PPARγ activators down-regulate the expression of PPARγ in 3T3-L1 adipocytes. FEBS Lett. 1999;447:186–190. doi: 10.1016/s0014-5793(99)00268-9. [DOI] [PubMed] [Google Scholar]
- 12.Young PW, Buckle DR, Cantello BCC, et al. Identification of High-Affinity Binding Sites for the Insulin Sensitizer Rosiglitazone (BRL-49653) in Rodent and Human Adipocytes Using a Radioiodinated Ligand for PPARγ. J Pharmacol Exp Ther. 1998;284:751–759. [PubMed] [Google Scholar]
- 13.Camp HS, Li O, Wise SC, et al. Differential activation of PPARγ by troglitazone and rosiglitazone. Diabetes. 2000;49:539–547. doi: 10.2337/diabetes.49.4.539. [DOI] [PubMed] [Google Scholar]
- 14.Olefsky JM. Treatment of insulin resistance with PPARγ agonists. J Clin Invest. 2000;106:467–472. doi: 10.1172/JCI10843. [DOI] [PMC free article] [PubMed] [Google Scholar]
- 15.Wu Y, Chin WW, Wang Y, et al. Ligand and coactivator identity determines the requirement of the charge clamp for coactivation of the PPARγ. J Biol Chem. 2003;278:8637–8644. doi: 10.1074/jbc.M210910200. [DOI] [PubMed] [Google Scholar]
- 16.Wang Y, Porter WW, Suh N, et al. A synthetic triterpenoid, 2-cyano-3,12-dioxooleana-1,9-dien-28-oic acid (CDDO), is a ligand for the PPARγ. Mol Endocrinol. 2000;14:1550–1556. doi: 10.1210/mend.14.10.0545. [DOI] [PubMed] [Google Scholar]
- 17.Rocchi S, Picard F, Vamecq J, et al. A unique PPARγ with potent insulin-sensitizing yet weak adipogenic activity. Mol Cell. 2001;8:737–747. doi: 10.1016/s1097-2765(01)00353-7. [DOI] [PubMed] [Google Scholar]
- 18.Worrall DS, Olefsky JM. The effects of intracellular calcium depletion on insulin signaling in 3T3-L1 adipocytes. Mol Endocrinol. 2002;16:378–389. doi: 10.1210/mend.16.2.0776. [DOI] [PubMed] [Google Scholar]
- 19.Hsiao A, Ideker T, Olefsky JM, et al. VAMPIRE microarray suite: a web-based platform for the interpretation of gene expression data. Nucl Acids Res. 2005;33:W627–632. doi: 10.1093/nar/gki443. [DOI] [PMC free article] [PubMed] [Google Scholar]
- 20.Hsiao A, Worrall DS, Olefsky JM, et al. Variance-modeled posterior inference of microarray data: detecting gene-expression changes in 3T3-L1 adipocytes. Bioinformatics. 2004;20:3108–3127. doi: 10.1093/bioinformatics/bth371. [DOI] [PubMed] [Google Scholar]
- 21.Baek SH, Ohgi KA, Rose DW, et al. Exchange of N-CoR corepressor and Tip60 coactivator complexes links gene expression by NF-kappaB and beta-amyloid precursor protein. Cell. 2002;110:55–67. doi: 10.1016/s0092-8674(02)00809-7. [DOI] [PubMed] [Google Scholar]
- 22.Kaeser MD, Iggo RD. Chromatin immunoprecipitation analysis fails to support the latency model for regulation of p53 DNA binding activity in vivo. Proc Natl Acad Sci U S A. 2002;99:95–100. doi: 10.1073/pnas.012283399. [DOI] [PMC free article] [PubMed] [Google Scholar]
- 23.Berger J, Tanen M, Elbrecht A, et al. PPARγ Ligands Inhibit Adipocyte 11beta - Hydroxysteroid Dehydrogenase Type 1 Expression and Activity. J Biol Chem. 2001;276:12629–12635. doi: 10.1074/jbc.M003592200. [DOI] [PubMed] [Google Scholar]
- 24.Sakamoto J, Kimura H, Moriyama S, et al. Activation of human peroxisome proliferator-activated receptor (PPAR) subtypes by pioglitazone. Biochem Biophys Res Commun. 2000;278:704–711. doi: 10.1006/bbrc.2000.3868. [DOI] [PubMed] [Google Scholar]
- 25.Wurch T, Junquero D, Delhon A, et al. Pharmacological analysis of wild-type alpha, gamma and delta subtypes of the human peroxisome proliferator-activated receptor. Naunyn Schmiedebergs Arch Pharmacol. 2002;365:133–140. doi: 10.1007/s00210-001-0504-z. [DOI] [PubMed] [Google Scholar]
- 26.Perissi V, Rosenfeld MG. Controlling Nuclear Receptors: The Circular Logic of Cofactor Cycles. Nature Reviews Molecular Cell Biology. 2005;6:542. doi: 10.1038/nrm1680. [DOI] [PubMed] [Google Scholar]
- 27.Frohnert BI, Hui TY, Bernlohr DA. Identification of a functional peroxisome proliferator-responsive element in the murine fatty acid transport protein gene. J Biol Chem. 1999;274:3970–3977. doi: 10.1074/jbc.274.7.3970. [DOI] [PubMed] [Google Scholar]
- 28.Kishida K, Shimomura I, Nishizawa H, et al. Enhancement of the aquaporin adipose gene expression by a PPARγ. J Biol Chem. 2001;276:48572–48579. doi: 10.1074/jbc.M108213200. [DOI] [PubMed] [Google Scholar]
- 29.Feige JN, Gelman L, Tudor C, et al. Fluorescence Imaging Reveals the Nuclear Behavior of Peroxisome Proliferator-activated Receptor/Retinoid X Receptor Heterodimers in the Absence and Presence of Ligand. J Biol Chem. 2005;280:17880–17890. doi: 10.1074/jbc.M500786200. [DOI] [PubMed] [Google Scholar]
- 30.Camp HS, Chaudhry A, Leff T. A novel potent antagonist of PPARγ blocks adipocyte differentiation but does not revert the phenotype of terminally differentiated adipocytes. Endocrinology. 2001;142:3207–3213. doi: 10.1210/endo.142.7.8254. [DOI] [PubMed] [Google Scholar]
Associated Data
This section collects any data citations, data availability statements, or supplementary materials included in this article.