

Abstract
Fibroblast growth factor 14 (FGF14) belongs to the intracellular FGF homologous factor subfamily of FGF proteins (iFGFs) that are not secreted and do not activate tyrosine kinase receptors. The iFGFs, however, have been shown to interact with the pore-forming (α) subunits of voltage-gated Na+ (Nav) channels. The neurological phenotypes seen in Fgf14−/− mice and the identification of an FGF14 missense mutation (FGF14F145S) in a Dutch family presenting with cognitive impairment and spinocerebellar ataxia suggest links between FGF14 and neuronal functioning. Here, we demonstrate that the expression of FGF14F145S reduces Nav α subunit expression at the axon initial segment, attenuates Nav channel currents, and reduces the excitability of hippocampal neurons. In addition, and in contrast with wild-type FGF14, FGF14F145S does not interact directly with Nav channel α subunits. Rather, FGF14F145S associates with wild-type FGF14 and disrupts the interaction between wild-type FGF14 and Nav α subunits, suggesting that the mutant FGF14F145S protein acts as a dominant negative, interfering with the interaction between wild-type FGF14 and Nav channel α subunits and altering neuronal excitability.
Keywords: FHFs, Nav channels, action potentials, repetitive firing, axon initial segment, α subunit
Introduction
Fibroblast growth factor 14 (FGF14) belongs to the intracellular FGF homologous factor family (iFGFs), a distinct set of four neuronally expressed FGFs (iFGF11–14) that are not secreted and do not activate tyrosine kinase receptors (Ornitz and Itoh, 2001; Olsen et al., 2003; Itoh and Ornitz, 2004; Goldfarb, 2005). A missense mutation in the FGF14 gene, FGF14F145S, was identified in a Dutch family presenting with multiple neurological deficits including impaired cognitive abilities and spinocerebellar ataxia (Van Swieten et al., 2003), and is now classified as spinocerebellar ataxia 27 [OMIM (Online Mendelian Inheritance in Man) number 609307, SCA27].
The spectrum of neurological phenotypes evident in SCA27 individuals suggests that FGF14 is important for the normal functioning of multiple areas of the central, and possibly the peripheral, nervous system (Manto, 2005). Consistent with this suggestion, genetic ablation of Fgf14 in mice (Fgf14−/−) results in ataxia, paroxysmal dystonia (Wang et al., 2002), and cognitive impairment (Wozniak et al., 2007). Protein modeling studies suggest that the phenylalanine (F) to serine (S) mutation at residue 145 reduces FGF14 stability, resulting in loss of FGF14 function (Olsen et al., 2003; Van Swieten et al., 2003). The autosomal-dominant nature of the FGF14F145S mutation and the similarity between the phenotypes of SCA27 patients and Fgf1d4−/− mice further suggests that the FGF14F145S mutation results in a loss of FGF14 function.
In the hippocampus, Fgf14 is expressed in pyramidal neurons and in the dentate gyrus (Smallwood et al., 1996; Wang et al., 2002; Lou et al., 2005; Xiao et al., 2007), and loss of FGF14 in Fgf14−/− mice results in impaired long-term potentiation at Schaffer collaterals–CA1 synapses (Xiao et al., 2007). It has been demonstrated that the iFGFs interact directly with the pore-forming (α) subunits of neuronal and cardiac voltage-gated Na+ (Nav) channels and heterologous coexpression of FGF12, FGF13, or FGF14 with Nav α subunits differentially affects Nav current densities and the voltage dependences of Nav channel activation and inactivation (Liu et al., 2001, 2003; Wittmack et al., 2004; Lou et al., 2005; Rush et al., 2006). In rat hippocampal neurons, heterologously expressed FGF14 colocalizes with native Nav channels at the axon initial segment (AIS) (Lou et al., 2005), a specialized subcellular domain of high-Nav channel density that regulates action potential initiation and propagation (Clark et al., 2005; Meeks et al., 2005; Khaliq and Raman, 2006; Van Wart et al., 2007).
Alterations in Nav channel expression or function will impact neuronal membrane excitability and information processing in neuronal circuits. Indeed, mutations in genes encoding Nav channel subunits (Bechtold and Smith, 2005; Meisler and Kearney, 2005) or alterations in the expression of proteins necessary for the localization of Nav channels at the AIS (Garrido et al., 2003b) dramatically affect the output properties of central neurons. Together, these observations suggest that FGF14F145S expression might affect neuronal excitability by interfering with the functioning of Nav channels. The experiments here were designed to test this hypothesis and to explore the mechanism(s) underlying the functional effects of FGF14F145S.
Materials and Methods
Plasmids.
The Fgf14-Gfp (Fgf14-1b-Gfp), Fgf14-myc (Fgf14-1b-myc), and hSpry-Myc fusion constructs were generated and characterized as described previously (Lou et al., 2005). The F145S mutation in Fgf14 was introduced into the Fgf14-Gfp and Fgf14-myc constructs and verified by sequencing. The numbering used for the FGF14 protein sequence is based on the numbering system for human FGF14-1a (Van Swieten et al., 2003). The myc-GluR6 construct (Coussen et al., 2002) was a gift from Dr. C. Mulle (University of Bordeaux, Bordeaux, France).
Cell culture and transient transfections.
All reagents were purchased from Sigma (St. Louis, MO) unless noted otherwise. HEK-293 cells stably expressing rat Nav1.2 (HEK-Nav1.2 cells) were maintained in DMEM (Invitrogen, Carlsbad, CA); supplemented with 10% fetal bovine serum, 100 U/ml penicillin, 100 μg/ml streptomycin, and 500 μg/ml G418 (Invitrogen); and incubated at 37°C with 5% CO2. Cells were transfected at 90–100% confluency using Lipofectamine 2000 (Invitrogen), according to manufacturer's instructions.
Hippocampal cultures were prepared from embryonic day 18 rat embryos using previously described methods (Goslin et al., 1998). Briefly, hippocampi were dissected and dissociated using trypsin and trituration through a Pasteur pipette. Neurons were plated at low density (1–5 × 10⁵ cells per dish) on poly-l-lysine-coated coverslips in 60 mm culture dishes in MEM supplemented with 10% horse serum. After 2–4 h, coverslips (containing neurons) were inverted and placed over a glial feeder layer in serum-free MEM with 0.1% ovalbumin and 1 mm pyruvate (N2.1 medium; Invitrogen) separated by ∼1 mm wax dot spacers. The presence of the spacer prevented contact between the neurons on the coverslips and the glial feeder layer. Cultures were maintained in N2.1 medium in the presence of 100 μm d,l-2-amino-5-phosphonovaleric acid (APV; Research Biochemicals, Natick, MA), to prevent glutamate excitotoxicity, for up to 10 d. To prevent the overgrowth of the glia, cultures were treated with cytosine arabinoside (5 μm; Calbiochem, La Jolla, CA) at 3 d in vitro (DIV). Transfections were performed using Lipofectamine 2000 (Invitrogen) at 9 DIV for imaging and current-clamp recordings and at 0 DIV for voltage-clamp recordings.
Immunofluorescence.
Rat hippocampal neurons (10 or 14 DIV) were fixed in fresh 4% paraformaldehyde and 4% sucrose in PBS for 15 min and permeabilized with 0.25% Triton X-100. After blocking with 10% BSA for ∼30 min at 37°C, neurons were incubated at room temperature for 12–16 h with one of the following combinations of primary antibodies: mouse monoclonal anti-Pan Nav α subunit (diluted 1:100; Sigma) and rabbit polyclonal anti-microtubule-associated protein 2 (MAP2; diluted 1:1000; Chemicon, Temecula, CA); or mouse monoclonal anti-FGF14 (diluted 1:1000; Antibodies, Davis, CA) and chicken polyclonal anti-βIV-spectrin (diluted 1:2000). The FGF14 monoclonal antibody was developed against a GST-FGF14-1b fusion protein (pET-42-GST-FGF14-1b) and affinity purified. The affinity-purified chicken anti-βIV-spectrin antibody (Komada and Soriano, 2002; Nishimura et al., 2007) was generously provided to us by Dr. M. Komada (Tokyo Institute of Technology, Tokyo, Japan). All antibodies were diluted (as the concentrations noted) in PBS containing 3% BSA.
After incubations with the primary antibody combinations, neurons were washed three times in PBS and incubated for 2 h at 37°C with appropriate secondary antibodies: Alexa 647-conjugated goat anti-mouse IgG1 (1:500) together with aminomethylcoumarin (AMCA)-conjugated goat anti-rabbit IgG (1:100; Vector Laboratories, Burlingame, CA) for the cells stained with the mouse monoclonal anti-Pan Nav α subunit and the rabbit polyclonal anti-MAP2 antibodies; or Alexa 568-conjugated goat anti-mouse IgG and Alexa 488-conjugated goat anti-chicken IgY for the cells stained with the mouse monoclonal anti-FGF14 and chicken polyclonal anti-βIV-spectrin antibodies. Coverslips were then washed (three times) with PBS and mounted in elvanol (Tris-HCl, glycerol, and polyvinyl alcohol with 2% 1,4-diazabicyclo“2,2,2” octane) or in Prolong Gold anti-fade reagent (Invitrogen). Images were acquired using an Axoplan 2 or Axio Imager epifluorescence microscope (Zeiss, Oberkochen, Germany) with a 63× objective. Images were acquired with a CCD camera using MetaMorph (Universal Imaging, Downingtown, PA) or with an Axio Cam MRm using the Axio Vision software (Zeiss).
Image quantification.
For pixel intensity quantification, image files from each group, from two independent sets of transfections, were acquired blindly. Images were saved as TIFF files and analyzed with MetaMorph (Universal Imaging). On each cell analyzed, a line, 3 pixels in width and 20 μm in length, was drawn down the axon on an overlay image of the monomeric red fluorescent protein (mRFP) or green fluorescent protein (GFP) and MAP2 staining. This line was then transferred to the Alexa 647 image, which reflected the Nav α subunit labeling. In each cell, the axon was unequivocally identified as a thin process, positive for mRFP or GFP and negative for MAP2. The “starting point” for length measurements was the point of reduced MAP2 staining intensity; this proved to be a reliable marker of increased Nav channel density, corresponding to the AIS, in GFP-expressing (control) neurons. To adjust for uneven illumination, images were processed for flat-field correction, before analysis. The intensity of off-cell background fluorescence was numerically subtracted at the end of the line-scan analysis. Total fluorescence intensity of immunolabeled Nav channels at the AIS was measured from cells in each experimental group. To combine data from independent sets of transfections, total fluorescence intensity values were normalized to the mean value of the GFP control of that set. Intensity profiles of individual and average traces for each experimental group were generated by plotting pixel intensity values along distance. Data were tabulated and analyzed with Excel, Origin, and SigmaStat (Jendel Corporation, San Rafael, CA).
Immunoprecipitations.
HEK-293 cells, stably expressing the rat Nav1.2 α subunit, were washed twice with PBS and lysed in the following lysis buffer: 20 mm Tris-HCl, 150 mm NaCl, and 1% NP-40 or Triton X-100. Protease inhibitor mixture (Cocktail #3; Calbiochem) was added immediately before cell lysis. Cell extracts were collected and sonicated for 20 s and centrifuged at 4°C, at 15,000 × g for 15 min. Supernatants were collected and incubated with rabbit anti-myc agarose beads (Sigma) for 2 h at 4°C with agitation. After washing five times with lysis buffer, 2× sample buffer (Bio-Rad, Hercules, CA) containing 50 mm TCEP “tris(2-carboxyethyl) phosphine” was added. Lysates were then heated for 10–15 min at 65°C and resolved on 7.5% or 4–15% polyacrylamide gradient gels (Bio-Rad). Resolved proteins were transferred to polyvinylidene difluoride membranes (Millipore, Bedford, MA) for 2 h at 4°C and blocked in Tris-buffered saline with 5% skim milk and 0.1% Tween 20. Membranes were then incubated in blocking buffer containing a monoclonal anti-myc (1:1000; Santa Cruz Biotechnology, Santa Cruz, CA) or anti-PanNav channel (1:1000; Sigma) antibody overnight at 4°C. Washed membranes were incubated with goat anti-mouse HRP (1:5000–10,000) detected with SuperSignal Fempto chemiluminescent substrate (Pierce, Rockford, IL). Signals were revealed either with Kodak (Rochester, NY) BioMax films or with Chemidoc XRS (Bio-Rad). Data were analyzed using Quantity One software (Bio-Rad).
Electrophysiology.
Recordings were obtained from rat hippocampal neurons isolated at 1 DIV (for voltage-clamp recordings) or 10 DIV (for current-clamp recordings) at room temperature (20–22°C) ∼12–18 h after transfection using a Dagan Corporation (Minneapolis, MN) model 3900 amplifier. Borosilicate glass pipettes were fabricated using a P-87 micropipette puller (Sutter Instruments, Novato, CA); tip resistances were 2.5–5 MΩ. For voltage-clamp recordings, the extracellular bath solution contained (in mm) 140 NaCl, 3 KCl, 1 MgCl2, 1 CaCl2, and 20 HEPES, pH 7.3; the bath solution also contained bicuculline (10 μm), CNQX (6-cyano-7-nitroquinoxaline-2,3-dione; 30 μm), and APV (100 μm) to block synaptic activity mediated by GABA, AMPA, and NMDA receptors, respectively. Recording pipettes contained (in mm) 140 CsF, 1 EGTA, 10 NaCl, and 10 HEPES, pH 7.3. For current-clamp recordings, the extracellular bath solution contained (in mm) 140 NaCl, 4 KCl, 10 HEPES, 10 glucose, 2 MgCl2, and 2 CaCl2, pH 7.3, and the intracellular recording solution contained (in mm) 130 KCl, 10 HEPES, 10 glucose, 1.1 CaCl2, 2.6 BAPTA, 3 MgATP, and 0.5 NaGTP, pH 7.3.
After seal formation and membrane rupture, whole-cell membrane currents, evoked in response to brief (5 ms) hyperpolarizing voltage steps to −80 mV from a holding potential of −70 mV, were recorded. Input resistances, series resistances, and whole-cell capacitances were derived from these uncompensated current records. Capacitative transients and series resistances were then compensated electronically (by ∼80–90%) before recording voltage-gated currents. Data were acquired at 50 kHz and filtered at 5 kHz before digitization and storage. All experimental parameters were controlled using the Clampex 9.2 software (Molecular Devices, Union City, CA), interfaced to the electrophysiological equipment using a Digidata 1322A analog-to-digital interface (Molecular Devices). Voltage-dependent inward Na+ (Nav) currents were evoked by brief (50–100 ms) depolarizing voltage steps to test potentials between −60 and +60 mV from a holding potential of −90 mV. For measurement of steady-state inactivation, cells were stepped to varying conditioning potentials between −130 and −20 mV for 750 ms (from a holding potential of −90 mV) before the test depolarizations to −10 mV (to measure the amplitude of the Nav currents).
Single action potentials and action potential trains were recorded in response to brief (2 ms) and prolonged (0.5–1 s), respectively, depolarizing current injections of variable amplitudes. To determine the effects of suppression of Nav currents on action potential waveforms in hippocampal neurons, cells were exposed to brief applications of 1–10 nm tetrodotoxin (TTX), delivered locally from a micropipette using a gravity-based perfusion system.
Data analysis.
Analysis of electrophysiological data were performed using Clampfit 9.2 (Molecular Devices), Origin 6.1 (OriginLab Corporation, Northampton, MA), and Prizm 4 (Graph Pad, San Diego, CA). Peak Nav current densities were obtained by dividing peak Nav current amplitudes in each cell by the whole-cell membrane capacitance (measured in the same cell), and the Nav conductance (at each test potential and in each cell), GNa, was calculated using the following equation:
where INa is the current amplitude at voltage Vm and Erev is the calculated Na+ reversal potential. Normalized conductances were then calculated as GNa/GNa,Max, where GNa,Max is the maximal conductance. Steady-state activation curves were derived by plotting the normalized GNa(GNa/GNa,Max) as a function of test potential and fitted using a Boltzman equation of the following form:
where Va is the membrane potential of half-maximal activation and k is the slope factor.
For steady-state inactivation, normalized current amplitudes (INa/INa,Max) at each test potential in each cell were determined, and mean values were plotted as a function of prepulse potential (Vm) and fitted using a Boltzman equation of the following form:
where Vh is the voltage of half-maximal inactivation and k is the slope factor.
Statistical analysis.
All the results are presented as means ± SEM. The statistical significance of differences between groups was assessed using either a parametric t test or nonparametric t test, based on the distribution of the samples underlying the populations, and was set at p < 0.05. Statistical analysis was performed using SigmaStat (Jendel Corporation).
Results
Expression of FGF14F145S disrupts localization of Nav channels at the AIS
To explore directly the effects of FGF14F145S on the distribution and localization of neuronal Nav channels, rat hippocampal neurons were cotransfected with cDNA constructs encoding mRFP (mRfp) and GFP-tagged FGF14F145S (FGF14F145S-Gfp). Parallel experiments were conducted on cells cotransfected with constructs encoding mRfp and either an epitope (GFP)-tagged wild-type Fgf14-1b (Fgf14-Gfp) or Gfp alone. Approximately 24 h after transfection, cells were fixed and stained with a monoclonal anti-Pan Nav α subunit-specific antibody and with a polyclonal antibody against the MAP2, a commonly used somato-dendritic marker (Garrido et al., 2003b; Fache et al., 2004). In neurons transfected with the Gfp construct (Fig. 1A–F), robust Nav channel expression was evident in the proximal regions of thin MAP2-negative processes (Fig. 1B,C,F), corresponding to the AIS (Garrido et al., 2003a; Van Wart et al., 2007). In contrast, in neurons expressing FGF14F145S-GFP (Fig. 1G–L), Nav channel labeling in the AIS was markedly reduced (Fig. 1H,L), whereas in hippocampal neurons expressing (wild-type) FGF14-GFP (Lou et al., 2005) (Fig. 1M–R), Nav channel labeling in the AIS was increased (Fig. 1N,R).
Figure 1.
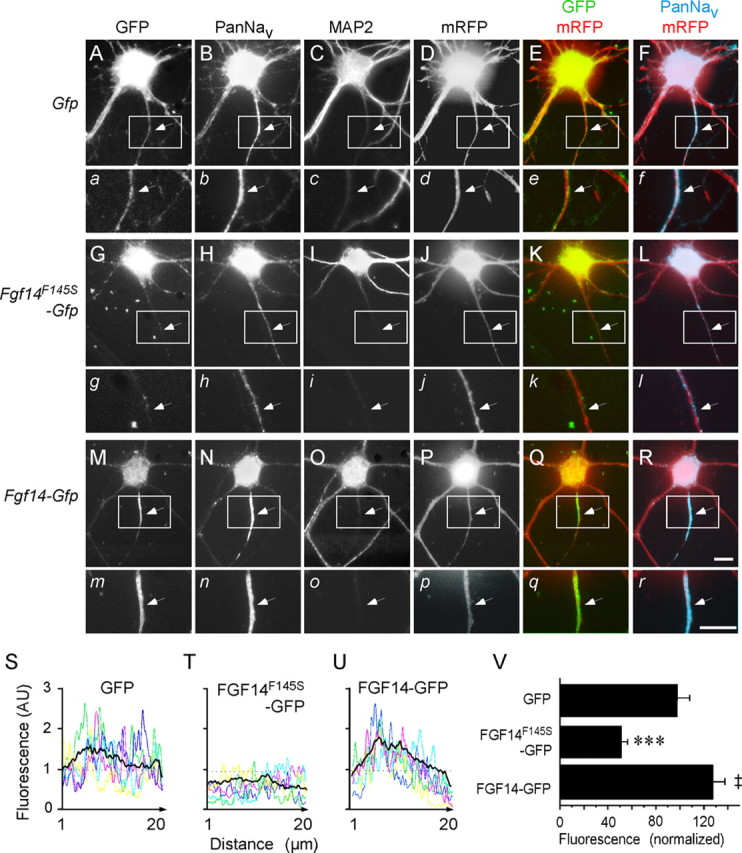
Nav channel localization at the AIS is disrupted by expression of FGF14F145S. A–R, Fluorescence images of rat hippocampal neurons expressing mRFP together with GFP (A–F), FGF14F145S-GFP (G–L), or FGF14-GFP (M–R) stained with a monoclonal anti-Nav α subunit-specific antibody, PanNav, visualized with an Alexa 647-conjugated secondary antibody (B, H, N), and a polyclonal anti-MAP2 antibody, visualized with an AMCA-conjugated secondary antibody (C, I, O). GFP fluorescence images are shown in A, G, and M, and mRFP fluorescence images are shown in D, J, and P. Overlay images of GFP and mRFP are shown in the green and red channels (E, K, Q). Overlay images of PanNav and mRFP are shown in cyan and red channels (F, L, R). The bottom panels (a–r) are high-magnification images of the boxed regions in each of the corresponding panels A–R, presented to highlight the AIS regions (arrows). Comparing B, H, and N, it is evident that the intensity of the Nav α subunit labeling in the AIS regions is lower in the FGF14F145S-expressing neuron (H) and is higher in the FGF14-expressing neuron (N) than in the cell expressing GFP (B). Scale bars, 10 μm. S–U, Representative examples of Nav α subunit immunofluorescence intensity line scans along the AIS regions in individual neurons expressing GFP (S), FGF14F145S-GFP (T), or FGF14-GFP (U). In each panel, the black line indicates the mean fluorescence intensity profile obtained from GFP-expressing (S; n = 20), FGF14F145S-GFP-expressing (T; n = 23), or FGF14-GFP-expressing (U; n = 28) neurons from one set of transfections. V, Mean ± SEM of Nav α subunit immunofluorescence intensities in GFP-expressing (n = 40), FGF14F145S-GFP-expressing (n = 47), and FGF14-GFP-expressing (n = 58) cells are plotted. Values were normalized to the mean control value determined in GFP-expressing cells (‡p < 0.05; ***p < 0.001).
For quantification of Nav α subunit expression, line-scan analyses of fluorescence intensities along the AIS region in individual hippocampal neurons (Fig. 1S–U) were performed. These analyses revealed that the total fluorescence intensity of immunolabeled Nav channels was markedly reduced (by ∼50%) in neurons expressing FGF14F145S (Fig. 1T) compared with cells expressing GFP (Fig. 1S) or FGF14-GFP (Fig. 1U). The mean ± SEM Nav α subunit labeling intensity along the AIS in neurons expressing FGF14F145S (n = 47) was 54 ± 6% of the (mean ± SEM) intensity in GFP-expressing cells, a value that is significantly (p < 0.001) lower than in cells expressing GFP (n = 40) or FGF14-GFP (n = 58) (Fig. 1V). Average Nav α subunit labeling intensity in the AIS was also significantly (‡p < 0.05) higher in FGF14-GFP-expressing, compared with GFP-expressing (Fig. 1V) cells. In addition, although detectable in the MAP2-positive somato-dendritic compartments of hippocampal neurons, FGF14F145S was barely or not detectable in axons and was not enriched at the AIS (Fig. 1G). Thus, in contrast to wild-type FGF14 (Fig. 1M,N), FGF14F145S does not colocalize in hippocampal neurons with native Nav channel α subunits at the AIS (Fig. 1G,H).
Expression of FGF14F145S suppresses peak Nav current densities in hippocampal neurons
It has previously been demonstrated that overexpression of FGF14-GFP in isolated rat hippocampal neurons modulates Nav channel currents (INa), increasing peak current densities and shifting the voltage dependences of current activation and inactivation (Lou et al., 2005). To determine directly the effects of FGF14F145S on endogenous neuronal Nav current densities and properties, whole-cell voltage-clamp recordings were obtained from hippocampal neurons 12–24 h after transfection with FGF14F145S-Gfp, Fgf14-Gfp, or Gfp. Recordings were obtained from cells lacking extensive neurites to ensure adequate voltage-clamp control. Representative recordings from GFP-, FGF14F145S-GFP-, and FGF14-GFP-expressing cells are illustrated in Figure 2A–C. Robust, rapidly activating Nav currents were routinely recorded from all GFP-expressing (n = 38), FGF14F145S-expressing (n = 29), and FGF14-expressing (n = 17) cells (Fig. 2). Peak Nav current densities, however, were significantly (p < 0.001) lower in cells expressing FGF14F145S (−61 ± 13 pA/pF) than in cells expressing GFP (−150 ± 15 pA/pF) (Fig. 2D). Although peak Nav current densities were reduced, expression of FGF14F145S did not measurably affect the kinetic properties of the currents. There were, however, small but statistically significant (p < 0.005) shifts in the voltage dependences of Nav channel activation (approximately +5 mV depolarizing shift) and inactivation (−6 mV hyperpolarizing shift) in cells expressing FGF14F145S compared with cells expressing GFP (Fig. 2E, Table 1).
Figure 2.

Expression of FGF14F145S attenuates peak Nav current densities in hippocampal neurons. A–C, Representative whole-cell voltage-gated inward Na+ (Nav) currents recorded from isolated hippocampal neurons in response to depolarizing voltage steps to potentials ranging from −60 to +40 mV from a holding potential of −90 mV as described in Materials and Methods. The voltage-clamp protocol is illustrated below the current records. D, Mean ± SEM peak Nav current densities in hippocampal neurons expressing FGF14F145S-GFP (n = 29) are significantly (***p < 0.001) lower than in cells expressing GFP (n = 38), whereas mean ± SEM peak Nav current densities in FGF14-GFP (n = 17)-expressing cells are significantly (*p < 0.01) higher. E, Small but statistically significant (**p < 0.005) differences in the voltage dependences of Nav channel activation and inactivation are evident in cells overexpressing FGF14 and in cells expressing FGF14F145S compared with cells expressing only GFP (see also Table 1).
Table 1.
Voltage-gated Na+ currents in rat hippocampal neurons
| Cells | Peak density (pA/pF) | V1/2 (act) (mV) | kact (mV) | V1/2 (inact) (mV) | kinact (mV) |
|---|---|---|---|---|---|
| GFP | −150 ± 15 (38) | −27 ± 1 (22) | 6.0 ± 0.3 (22) | −60 ± 1 (27) | 6.1 ± 0.2 (27) |
| FGF14 | −242 ± 24 (17)* | −33 ± 1 (13)** | 3.6 ± 0.3 (13)*** | −56 ± 1 (10)** | 5.4 ± 0.2 (10) |
| FGF14F145S | −61 ± 13 (29)*** | −22 ± 2 (9)** | 6.4 ± 0.3 (9) | −66 ± 1 (9)** | 8.0 ± 0.5 (9)*** |
All values are means ± SEM; numbers in parentheses are the numbers of cells analyzed. Values are significantly different from those determined in cells expressing GFP alone at the *p < 0.01, **p < 0.005, and ***p < 0.001 levels.
The effects of FGF14F145S expression on peak Nav current densities were distinct from those produced by overexpression of wild-type FGF14 (Fig. 2D). Consistent with previous findings (Lou et al., 2005), Nav current densities were, on average, increased by ∼50% (Fig. 2D) in hippocampal neurons transfected with FGF14, to a mean ± SEM of 242 ± 24 pA/pF (n = 17), a value that is significantly (p < 0.01) higher than in cells expressing GFP (Table 1). Expression of wild-type FGF14 also resulted in small but statistically significant (p < 0.005) shifts in the voltage dependences of Nav channel activation (approximately −6 mV hyperpolarizing shift) and inactivation (approximately +4 mV depolarizing shift) (Fig. 2E, Table 1). The effects of overexpression of wild-type FGF14 on peak Nav current densities and on Nav channel activation and inactivation therefore are opposite to those produced by expression of the FGF14 mutant protein FGF14F145S (Fig. 2E) (see Discussion).
Expression of FGF14F145S decreases the excitability of hippocampal neurons
To explore the functional consequences of the observed reductions in peak Nav current densities in cells expressing FGF14F145S, whole-cell current-clamp recordings were obtained from hippocampal neurons expressing FGF14F145S, GFP, or wild-type FGF14. As demonstrated previously for wild-type (nontransfected) rat hippocampal neurons (Colbert and Pan, 2002; Clark et al., 2005; Meeks et al., 2005), action potentials, evoked in response to brief (2 ms) depolarizing current injections, in GFP-expressing cells rose rapidly to a maximal potential of approximately +50 mV, and repolarization was rapid (Fig. 3A). The waveforms of individual action potentials in cells expressing FGF14F145S were indistinguishable from those recorded in GFP-expressing cells, although more current was required to reach the threshold for action potential generation (Fig. 3B). In cells expressing FGF14 (Fig. 3C), action potential waveforms were also indistinguishable from those in GFP-expressing neurons (Fig. 3A). Further analyses revealed that mean ± SEM input resistances (Fig. 3D) and action potential durations (Fig. 3E) in GFP-, FGF14-, and FGF14F145S-expressing neurons were not significantly different. The mean ± SEM current (444 ± 27 pA; n = 13) required to evoke single action potentials in FGF14F145S-expressing cells (Fig. 3F), however, was significantly (p < 0.001) larger than in cells expressing GFP (331 ± 26 pA; n = 25) or FGF14 (354 ± 37 pA; n = 8).
Figure 3.

Expression of FGF14F145S reduces the excitability of hippocampal neurons. A–C, Single action potentials, evoked by brief (2 ms) depolarizing current injections, were recorded from isolated (rat) hippocampal neurons expressing GFP (A), FGF14F145S-GFP (B), or FGF14-GFP (C), as described in Materials and Methods. The amplitudes and durations of the injected currents are illustrated below the voltage records. Although larger-amplitude currents were required to evoke action potentials in FGF14F145S-GFP-expressing cells (B) compared with FGF14-GFP-expressing (C) and GFP-expressing (A) cells, action potentials in all cells are brief and afterhyperpolarizations are pronounced. In addition, there are no significant differences in the waveforms of the action potentials in cells expressing FGF14F145S-GFP (B) compared with cells expressing wild-type FGF14-GFP (C) or GFP (A). D, E, The input resistances (D) and the durations of single action potentials, measured at 50% repolarization (APD50) (E), in FGF14F145S-GFP-, FGF14-GFP-, and GFP-expressing cells are indistinguishable. F, The mean ± SEM current (Ithresh) required to elicit single action potentials, however, was significantly (**p < 0.005) higher in cells expressing FGF14F145S-GFP (n = 13) compared with cells expressing GFP (n = 25) or wild-type FGF14-GFP (n = 8).
In response to prolonged (500 ms) low-amplitude (10–100 pA) depolarizing current injections, GFP-expressing rat hippocampal neurons fired repetitively and at frequencies that varied with the stimulus strength (Fig. 4A,B). Repetitive firing was also readily evoked in FGF14-GFP-expressing neurons (Fig. 4C,D). The responses to prolonged current injections and the maximal firing frequencies were similar to those recorded in wild-type (GFP-expressing) neurons. In FGF14F145S-expressing neurons, however, excitability was reduced (Fig. 4E,F). Similar to the responses to brief current injections (Fig. 3), larger currents were required to evoke action potentials (and repetitive firing) in FGF14F145S-expressing cells than in cells expressing GFP or wild-type FGF14 (Fig. 4E, Table 2). In addition, repetitive firing was markedly attenuated in FGF14F145S-expressing cells, and ∼70% of the cells fired fewer than four action potentials during 500 ms depolarizing current injections, regardless of the magnitude of injected current ((Figs. 4F, (5D) (p < 0; 1, n = 16). Action potentials in FGF14F145S-expressing cells were otherwise indistinguishable from those in GFP- and FGF14-expressing cells, displaying comparable voltage thresholds, amplitudes, and durations (Table 2).
Figure 4.

Expression of FGF14F145S attenuates repetitive firing in hippocampal neurons. Repetitive firing in isolated hippocampal neurons expressing GFP (A), FGF14-GFP (C), or FGF14F145S-GFP (E) was evoked in response to prolonged (500 ms) depolarizing current injections, as described in Materialss and Methods. Representative examples are illustrated, and the amplitudes of the injected currents are illustrated below the voltage records. A, Hippocampal neurons expressing GFP typically fire repetitively and at rates that vary with the amplitude of the injected current. B, Distribution of maximal number of action potentials evoked in individual GFP-expressing cells (n = 27) during 500 ms, 90 pA current injections. C, The repetitive firing properties of cells expressing FGF14-GFP are similar (to those of cells expressing GFP), with average firing rates increasing with the stimulus intensity. D, The distribution of the maximal number of evoked action potentials in FGF14-GFP-expressing cells (n = 13) is similar to cells expressing GFP (B). E, Repetitive firing is attenuated markedly in neurons expressing FGF14F145S (n = 16), and repetitive firing rates in most FGF14F145S-expressing cells do not increase substantially in response to increasing the amplitudes of the injected currents. F, Histogram showing the distribution of the maximal numbers of action potentials fired (during 500 ms depolarizing 90 pA current injections) in FGF14F145S-GFP-expressing cells is skewed to the left (fewer action potentials) compared with cells expressing GFP (B) or FGF14-GFP (D). The mean number of action potentials evoked in FGF14F145S-GFP-expressing cells is significantly (*p < 0.01) lower than in GFP or FGF14-GFP expressing cells. Arrows in B, D, and F indicate the mean number of action potentials elicited in response to 500 ms, 90 pA current injections.
Table 2.
Passive and active membrane properties of rat hippocampal neurons
| Cm (pF) | Rin (GΩ) | Vm (mV) | Ithreshold (pA) | Vthreshold (mV) | APA (mV) | APD50 (ms) | |
|---|---|---|---|---|---|---|---|
| GFP (n = 30) | 44 ± 3 | 0.7 ± 0.1 | −56 ± 1 | 38 ± 6 | −28 ± 0.9 | 81 ± 2 | 3.7 ± 0.3 |
| FGF14 (n = 13) | 53 ± 4 | 0.7 ± 0.1 | −55 ± 1 | 34 ± 6 | −28 ± 1.4 | 78 ± 3 | 4.4 ± 0.2 |
| FGF14F145S (n = 16) | 49 ± 5 | 0.7 ± 0.1 | −58 ± 1 | 62 ± 7*** | −26 ± 1.3 | 76 ± 4 | 4.4 ± 0.4 |
| GFP (n = 6) | 52 ± 6 | 0.7 ± 0.1 | −57 ± 2 | 24 ± 4 | −30 ± 0.5 | 89 ± 8 | 3.8 ± 1.2 |
| +1 nm TTX (n = 4) | 56 ± 8* | −30 ± 0.9 | 87 ± 5 | 3.1 ± 0.3 | |||
| +5 nm TTX (n = 4) | 88 ± 6** | −25 ± 3.7 | 87 ± 1 | 4.1 ± 0.5 |
All values are means ± SEM. APA, Action potential amplitude; APD50, action potential duration at 50% repolarization.
***p < 0.001, significantly different from the values measured in GFP- or FGF14-expressing cells
**p < 0.005 and
*p < 0.01, significantly different from those measured in control recordings in the absence of TTX.
Figure 5.

Application of low concentrations of TTX reduces excitability and attenuates repetitive firing in hippocampal neurons, mimicking the effects of FGF14F145S expression. Action potentials were recorded, as described in the legend to Figure 4, from GFP-expressing (wild-type) hippocampal neurons before and after local applications of 1–5 nm TTX. A, Representative action potentials recorded from a GFP-expressing hippocampal pyramidal neuron in response to increasing depolarizing current injections. B, After application of 5 nm TTX, more current was required to evoke action potentials to fire, and repetitive firing was reduced. C, D, The effects of TTX on firing properties are similar to those seen in cells expressing FGF14F145S-GFP. The mean ± SEM (n = 4) current (C) required to evoke action potentials was increased significantly (**p < 0.01; ***p < 0.001), whereas the mean ± SEM number of spikes (D) evoked (during 1 s depolarizing current injections) was reduced significantly (*p < 0.01); **p < 0.01 in GFP-expressing cells exposed to 5 nm TTX. Exposure to 1 nm TTX (n = 4) also increased the mean ± SEM current required to evoke action potentials (‡p = 0.05) in GFP-expressing cells. Repetitive firing was also reduced after exposure to 1 nm TTX, although the mean ± SEM number of spikes evoked was not statistically lower than control. The mean ± SEM current required to evoke action potentials (C) and the mean ± SEM maximal number of spikes evoked during 1 s depolarizing current injections in FGF14F145S-expressing cells (D) are plotted here for comparison.
If the only mode of action of FGF14F145S was to reduce the number of available Nav channels, then application of the specific Nav channel blocker (Catterall et al., 2005) TTX at low (1–5) nanomolar concentrations should mimic the effects of FGF14F145S on membrane excitability. Indeed, additional experiments revealed that exposure of GFP-expressing neurons to 1–5 nm TTX markedly increased the amplitudes of the currents required to evoke action potentials (Fig. 5A–C), consistent with blockade of a fraction of available Nav channels. In addition, exposure to TTX decreased the number of action potentials recorded in response to prolonged (500 ms) depolarizing current injections (Fig. 5D), without significantly affecting the amplitudes or the durations of individual action potentials (Table 2). Thus, the deficits in neuronal excitability observed in FGF14F145S-expressing neurons are mimicked by the application of low (1–5) nanomolar concentrations of TTX. At higher (≥10 nm) TTX concentrations, rat hippocampal neurons ceased firing altogether.
FGF14F145S functions as a dominant negative
Previous studies have demonstrated that wild-type FGF14 coimmunoprecipitates with Nav1.1 and Nav1.5 α subunits (Lou et al., 2005). To determine whether FGF14 (and/or FGF14F145S) also interacts with the major Nav α subunit in hippocampal neurons, Nav1.2 (Schaller and Caldwell, 2000), myc-tagged Fgf14 (Fgf14-myc), or FGF14F145S (FGF14F145S-myc) was transiently transfected into HEK-293 cells stably expressing Nav1.2 (HEK-Nav1.2 cells). In addition, control experiments were performed on cells transiently transfected with hSpry-myc, which encodes an unrelated protein that has also been myc tagged at the C terminus. Using anti-myc agarose beads, FGF14-myc (as well as FGF14F145S-myc and hSpry-myc) was efficiently immunoprecipitated from extracts of transiently transfected HEK-Nav1.2 cells (Fig. 6A). In addition, similar to the previously demonstrated interactions between FGF14 and the Nav1.1 and Nav1.5 α subunits (Lou et al., 2005), Nav1.2 coimmunoprecipitated with FGF14-myc in a dose-dependent manner (Fig. 6A,B). In contrast, Nav1.2 did not coimmunoprecipitate with FGF14F145S-myc (Fig. 6C), suggesting that the observed effects of FGF14F145S on hippocampal Nav currents (Fig. 2) likely do not result from a direct interaction between FGF14F145S and Nav α subunits. Control experiments revealed that Nav1.2 also does not coimmunoprecipitate from cells expressing the unrelated protein hSpry-myc (Fig. 6A,C). Together, these results suggest that the effects of FGF14F145S on hippocampal Nav channels likely are indirect.
Figure 6.

FGF14F145S does not interact directly with Nav α subunits. A, HEK-Nav1.2 cells were transiently transfected with varying concentrations (2–0.2 μg) of Fgf14-myc or with the (negative) control plasmid hSpry-myc (10 μg). Western blots of whole-cell lysates (left panels) revealed a constant level of Nav1.2 expression and variable levels of expression of FGF14-myc, paralleling the concentrations of Fgf14-myc used in the transfection (left). After immunoprecipitation of cell extracts with anti-myc agarose beads (IP: Myc), immunoblots (IB) were probed with either an anti-myc or an anti-Pan Nav α subunit antibody (right). As is evident, Nav1.2 coimmunoprecipitates with the anti-myc agarose beads from cells expressing FGF14-myc but not from cells expressing hSpry-myc. B, In addition, quantification of the relative intensities of the anti-myc and anti-Nav1.2 bands from the Western blots of the coimmunoprecipitated (Nav1.2 and FGF14) proteins revealed parallel efficiencies as a function of the amount of Fgf14-myc used in the transfections. C, HEK-Nav1.2 cells were transiently transfected with Fgf14-myc, FGF14F145S-myc, or with the hSpry-myc control plasmid. Western blots of lysates from these cells (left) revealed uniform levels of Nav1.2 and robust expression of FGF14-myc, FGF14F145S-myc, or hSpry-myc. After immunoprecipitations with anti-myc beads (IP: Myc), immunoblots (IB) were performed (right) using the anti-myc or anti-Pan Nav α subunit antibodies. In contrast to FGF14-myc (A), Nav1.2 was not coimmunoprecipitated from cells expressing FGF14F145S-myc (or hSpry-myc) using anti-myc agarose beads.
To test the hypothesis that FGF14F145S acts by interfering with the interaction between wild-type FGF14 and Nav channel α subunits, HEK-Nav1.2 cells were transiently transfected with FGF14F145S-Gfp and Fgf14-myc, and immunoprecipitations were again performed with anti-myc agarose beads. Control experiments were, as described above, also performed on cells transiently transfected with the hSpry-myc construct. As illustrated in Figure 7A, substantially less Nav1.2 coimmunoprecipitated from cells cotransfected with FGF14F145S-Gfp and Fgf14-myc compared with cells transfected with the Fgf14-myc construct alone. Quantification of immunoprecipitated Nav1.2 protein in blots from six independent experiments demonstrated that the fraction of Nav1.2 coimmunoprecipitating with FGF14-myc was progressively reduced as the amount of transfected FGF14F145S-Gfp was increased (Fig. 7B). Importantly, the expression levels of FGF14-myc in cells with and without FGF14F145S-GFP were similar (Fig. 7A), suggesting that neither the expression nor the stability of the wild-type FGF14 protein was affected by the presence of the FGF14F145S mutant protein.
Figure 7.

FGF14F145S disrupts the interaction between FGF14 and Nav1.2 and coimmunoprecipitates with wild-type FGF14. A, HEK-Nav1.2 cells were transiently transfected with Fgf14-myc and increasing amounts of FGF14F145S-Gfp or with the (negative) control hSpry-myc construct. After immunoprecipitation with anti-myc agarose beads (IP: Myc), immunoblots (IB) were performed with either the anti-Pan Nav α subunit or the anti-myc monoclonal antibody (left). As is evident, increasing the amount of FGF14F145S–GFP reduced the amount of Nav1.2 that coimmunoprecipitated with the anti-myc beads (FGF14). As was also illustrated in Figure 6, Nav1.2 does not coimmunoprecipitate with hSpry-myc. B, Densitometric ratio of coimmunoprecipitated Nav1.2/FGF14-myc plotted as a function of the FGF14F145S-Gfp used in the transfections. These analyses revealed that increasing the amount of FGF14F145S-Gfp significantly (*p < 0.01) reduced the amount of Nav1.2 coprecipitating with anti-myc agarose beads. C, HEK-293 cells were transiently transfected with Fgf14-myc (or with the control plasmid myc-GluR6) and either Fgf14-Gfp or FGF14F145S-Gfp. Western blots of whole-cell lysates (left) confirmed expression of the tagged constructs. Whole-cell lysates were immunoprecipitated with anti-myc agarose beads (IP: Myc), and immunoblots (IB) were performed using either the anti-myc or anti-GFP antibody (right). Both FGF14-GFP and FGF14F145S-GFP were coimmunoprecipitated with the myc-tagged FGF14. The association appears to be specific for FGF14 because myc-GluR6 did not coimmunoprecipitate with either FGF14-GFP or FGF14F145S-GFP. D, The interaction between FGF14F145S-GFP and FGF14-myc was also evident in the presence of Nav1.2. HEK-Nav1.2 cells were transiently transfected with Fgf14-myc and with increasing concentrations of FGF14F145S-Gfp. Western blots of lysates from these cells (left) revealed expression of FGF14-myc and increasing concentrations of FGF14F145S-GFP. In addition, FGF14F145S-GFP was coimmunoprecipitated with FGF14-myc from these cells (IP: Myc) using anti-myc agarose beads (right).
The reduction in immunoprecipitated Nav1.2 protein (with the anti-myc antibody) from HEK-Nav1.2 cells cotransfected with Fgf14-myc and FGF14F145S-Gfp (Fig. 7A,B) suggested that FGF14F145S might interfere with the interaction between wild-type FGF14 and Nav1.2 by associating with FGF14. To test this hypothesis directly, Fgf14-myc and FGF14F145S-Gfp were cotransfected into HEK-293 cells, and whole-cell lysates were immunoprecipitated using the anti-myc agarose beads. Control experiments were performed on Fgf14-GFP or FGF14F145S-GFP cells cotransfected with a construct encoding a myc-tagged glutamate receptor subunit, myc-GluR6. As illustrated in Figure 7C, FGF14F145S-GFP, like FGF14-GFP, coimmunoprecipitated with FGF14-myc, suggesting that the single amino acid mutation, F145S, which is present in the conserved FGF core domain, did not affect the ability of the FGF14 protein to self-associate. FGF14F145S-GFP also coimmunoprecipitated with FGF14-myc when coexpressed in HEK-Nav1.2 cells (Fig. 7D), findings consistent with the suggestion that the mutant FGF14F145S protein interacts with wild-type FGF14, disrupting the interaction (of wild-type FGF14) with Nav1.2 (Fig. 7A,B) and, consequently, the subcellular distribution of Nav1.2 channels (see Discussion).
This model of FGF14F145S action, together with the finding that heterologously expressed FGF14-GFP is enriched at the AIS (Fig. 1), suggests that endogenous FGF14, and potentially other iFGFs, are also enriched at the AIS. In collaboration with the National Institute of Neurological Disorders and Stroke–Nationa l Institute of Mental Health-sponsored NeuroMabs Facility at the University of California at Davis, we have recently developed a mouse monoclonal antibody targeted against FGF14 (see Materials and Methods). This reagent has now allowed visualization of endogenous FGF14 in primary hippocampal neurons (Fig. 8). As illustrated in Figure 8A–C, robust expression of FGF14 is evident in MAP2-negative processes (axons). In addition, FGF14 expression is colocalized with βIV-spectrin (Fig. 8D–F), a structural protein that is highly enriched in the AIS and that regulates sodium channel clustering (at the AIS) through ankyrin-G (Komada and Soriano, 2002; Nishimura et al., 2007).
Figure 8.

Endogenous FGF14 is readily detected in isolated rat hippocampal neurons, concentrated in the AIS. Fluorescence images of rat hippocampal neurons at 14 DIV show double labeling for FGF14 and either MAP2 (A–C) or βIV-spectrin (D–F). FGF14 is shown in red, whereas MAP2 and βIV-spectrin are shown in green in the overlay images in C and F. As is evident, FGF14 staining was present in MAP2-negative processes (C), colocalized with βIV-spectrin (F) at the AIS (arrows). Scale bar, 10 μm.
Discussion
The results presented here demonstrate that expression of the human FGF14 mutant protein FGF14F145S reduces the expression of Nav α subunits at the AIS, attenuates Nav current densities, and decreases the excitability of hippocampal neurons. Although the apparent regulation of Nav current densities and Nav channel subcellular localization might reflect independent functions of FGF14, the phenotypic consequences of expression of FGF14F145S on neuronal firing properties are clearly consistent with the observed decreases in functional Nav channel densities observed in the voltage-clamp experiments. A reduction in the number of functional Nav channels, for example, would account for the findings that larger currents (Ithreshold) were required to evoke action potentials and that maximal firing frequencies were reduced in cells expressing FGF14F145S. In addition, the changes in excitability identified in hippocampal neurons expressing FGF14F145S were mimicked by applications of low concentrations (1–5 nm) of the specific Nav channel blocker TTX (Catterall et al., 2005). The currents required to evoke action potentials were increased, and repetitive firing was attenuated in hippocampal neurons after exposure to 1–5 nm TTX. As would be expected, action potentials could not be generated in cells exposed to higher concentrations (≥10 nm) of TTX.
Importantly, the passive membrane properties of hippocampal neurons expressing FGF14F145S and the waveforms of evoked action potentials in these cells (Table 2) were indistinguishable from those measured in wild-type neurons. These observations suggest that other voltage-dependent currents, such as Ca2+ and K+ currents, which are also expressed in hippocampal neurons and contribute to the regulation of membrane excitability (Reyes, 2001), are not affected by the expression of FGF14F145S. Consistent with this hypothesis, voltage-clamp recordings from GFP-, FGF14-GFP-, and FGF14F145S-GFP-expressing cells revealed no significant differences in the densities or the properties of repolarizing voltage-gated or inwardly rectifying K+ channels (data not shown). Thus, the changes in membrane excitability described here in hippocampal neurons expressing FGF14F145S are consistent with a specific effect of the mutant protein on the expression/functioning of Nav channels. Interestingly, a recent study of granule cells in cerebellar slices from mice lacking FGF12 (Fgf12−/−) and/or FGF14 (Fgf14−/−) revealed marked changes in granule cell excitability that were also attributed to altered Nav channel functioning (Goldfarb et al., 2007).
FGF14F145S acts as a dominant negative, interfering with the functioning of FGF14
The electrophysiological effects of FGF14F145S expression in hippocampal neurons are distinct from those produced by overexpression of wild-type FGF14, which augments Nav current densities, but does not measurably affect the firing properties of hippocampal neurons. The lack of effect of FGF14 overexpression on the firing properties of hippocampal neurons (Fig. 4) despite observed increases in Nav current densities (Fig. 2) suggests that the number of functional Nav channels expressed in hippocampal neurons is already in excess of the number required to maintain maximal firing. The biochemical studies presented here also demonstrate that, unlike wild-type FGF14, heterologously expressed FGF14F145S does not coimmunoprecipitate with, and therefore does not interact directly with, neuronal Nav1.2 α subunits. The mutant FGF14F145S protein, like wild-type FGF14 protein, however, coimmunoprecipitated with wild-type FGF14 and, in addition, affected the association of wild-type FGF14 with Nav1.2 α subunits. Together, these observations suggest that endogenous FGF14 likely functions as an oligomeric protein and, furthermore, that FGF14F145S, by interacting with wild-type FGF14 protein, acts as a dominant negative to disrupt the association between (wild-type) FGF14 and Nav channel α subunits.
The results presented here also suggest that the single missense mutation, F145S, in the FGF14 gene in individuals afflicted with the autosomal-dominant neurodegenerative disorder SCA27 results in a loss of function by blocking the interaction(s) between wild-type FGF14 and Nav α subunits, thereby reducing the number of functional Nav channels and reducing neuronal excitability. Based on these observations, expression of FGF14F145S would be expected to result in phenotypes in brain areas where FGF14 is highly expressed, such as the cerebellum, hippocampus, and striatum (Wang et al., 2000). Alterations in Nav channel expression/function in these brain regions might contribute to the progressive ataxia, cognitive impairments, and motor deficits seen in SCA27 individuals (Van Swieten et al., 2003). Previous studies have demonstrated that Fgf14−/− mice display multiple neurological phenotypes, including ataxia and cognitive impairment (Wang et al., 2002; Wozniak et al., 2007; Xiao et al., 2007), that are remarkably similar to those observed in SCA27 patients, further supporting the proposed loss-of-function model for FGF14F145S.
Intracellular FGFs as novel regulators of neuronal membrane excitability
When heterologously expressed in hippocampal neurons, FGF14-GFP was found highly enriched at the AIS, colocalized with endogenous Nav channels. Consistent with this expression pattern, endogenous FGF14, detected with a newly developed (anti-FGF14) specific monoclonal antibody, is readily detected in isolated hippocampal neurons in MAP2-negative processes and colocalized with βIV-spectrin at the AIS. This pattern of endogenous FGF14 expression, together with the observations that the FGF14F145S mutant protein does not interact with Nav channels or localize at the AIS, strongly suggests that FGF14F145S acts by disrupting the interaction between FGF14 and Nav channel α subunits at the AIS. Additional experiments are needed to test this hypothesis directly.
The experiments here also revealed that, in neurons expressing FGF14F145S, Nav α subunit expression at the AIS was reduced. Because the biochemical data presented demonstrate that FGF14F145S interacts with wild-type FGF14 (and not Nav α subunits), these results suggest that FGF14F145S interferes with endogenous FGF14 interactions with Nav α subunits at the AIS in hippocampal neurons and, through this mechanism, attenuates neuronal excitability by interfering with the trafficking or the stabilization of Nav channels. Previous studies have demonstrated that other iFGFs, notably FGF12 and FGF13, also interact with Nav α subunits in heterologous expression systems, differentially affecting cell-surface Nav current densities and the voltage dependences of Nav channel activation and inactivation (Liu et al., 2001, 2003; Wittmack et al., 2004; Rush et al., 2006). The other iFGFs therefore may also play similar functional roles in the regulation of Nav channel functioning, either alone or in combination with FGF14. Studies focused on exploring potential redundancy between various members of the iFGF family will be necessary to test this hypothesis directly.
Wild-type FGF14 could regulate neuronal Nav channel expression, localization, and functioning by a variety of different mechanisms. Interestingly, the functional effects of FGF14 are reminiscent of the modulatory effects of Nav channel accessory (β) subunits, which have been shown to affect Nav channel assembly, surface expression, and (biophysical) properties (Isom et al., 1994; Catterall, 2000; Isom, 2002), and are similar to those of FGF14 (and the other iFGFs). These observations suggest the interesting possibility that the iFGFs might modulate Nav α–Nav β subunit–subunit interactions. It is certainly also possible that the iFGFs exert direct (or indirect) effects on the biosynthesis and/or the stability or the trafficking of assembled Nav channels (Garrido et al., 2001). Indeed, FGF12, FGF13 (Schoorlemmer and Goldfarb, 2002), and FGF14 (J.-Y. Lou and D. M. Ornitz, unpublished data) interact with JIP-2, a component of the kinesin-dependent cargo system involved in axonal transport (Verhey et al., 2001; Hirokawa and Takemura, 2005). Thus, FGF14 (and other iFGFs) might play a role in directing Nav channel localization to the AIS through a kinesin-mediated pathway. Targeting motifs required for axonal and AIS localization are found in the C-terminal tails and in the II–III intracellular loops of Nav α subunits (Garrido et al., 2001, 2003a,b). Because FGF12 (Liu et al., 2001, 2003), FGF13 (Wittmack et al., 2004) and FGF14 (Lou et al., 2005) interact with the C termini of some Nav α subunits, FGF14 (and the other iFGFs) might affect the function of domains important for Nav α subunit subcellular localization. For example, FGF14 might affect the interaction of other proteins, such as ankyrin-G, which is required for proper Nav α subunit localization (Garrido et al., 2003a). Clearly, studies focused on exploring the possibility that FGF14 interacts directly with ankyrin-G and/or affects the interactions between ankyrin-G and Nav channel α subunits, as well as studies focused on exploring the molecular mechanisms involved in mediating the decrease expression of Nav channels at the AIS observed on expression of FGF14F145S, are needed to test each of these hypotheses directly.
In addition to providing molecular insights into the mechanisms involved in mediating the action of the SCA27 mutant FGF14F145S protein, the results presented here clearly suggest that expression of FGF14F145S would be expected to have dramatic physiological consequences. A decrease in the number of Nav channels at the AIS, for example, is expected to inhibit action potential initiation (Meeks et al., 2005) and affect both the forwardpropagation and the backpropagation of action potentials. Decreased efficacy of forward action potential propagation, in turn, would be expected to reduce the reliability of synaptic transmission (Debanne, 2004) and synaptic remodeling (Clark and Hausser, 2006), whereas decreased fidelity of backpropagating action potentials would be expected to affect dendritic signal integration (Waters et al., 2005; Sjostrom and Hausser, 2006). Interestingly, loss of FGF14 in Fgf14−/− mice resulted in decreased frequency of mEPSCs and attenuation of long-term potentiation at CA3–CA1 synapses in the hippocampus (Xiao et al., 2007). Additional studies focused on exploring directly the effects of FGF14F145S on synaptic functioning and synaptic plasticity will be of interest.
Footnotes
This work was supported by Washington University, National Institutes of Health Grant NS030676 (J.M.N.), and the McDonnell Center for Cellular and Molecular Neurobiology (D.M.O. and J.M.N.). J.-Y.L. was supported by Cardiovascular Pharmacology Training Grant T32-HL07275 and the Medical Scientist Training Program, Washington University. We thank Dr. M. Komada (Tokyo Institute of Technology, Tokyo, Japan) for providing the affinity-purified chicken anti-βIV-spectrin antibody and Dr. C. Mulle (University of Bordeaux, Bordeaux, France) for providing the myc-GluR6 construct. In addition, we thank Dr. T. K. Pilgram for advice on statistical analyses and H. Wu and L. Li for technical assistance in the preparation and maintenance of hippocampal cultures.
References
- Bechtold DA, Smith KJ. Sodium-mediated axonal degeneration in inflammatory demyelinating disease. J Neurol Sci. 2005;233:27–35. doi: 10.1016/j.jns.2005.03.003. [DOI] [PubMed] [Google Scholar]
- Catterall WA. From ionic currents to molecular mechanisms: the structure and function of voltage-gated sodium channels. Neuron. 2000;26:13–25. doi: 10.1016/s0896-6273(00)81133-2. [DOI] [PubMed] [Google Scholar]
- Catterall WA, Goldin AL, Waxman SG. International Union of Pharmacology. XLVII. Nomenclature and structure-function relationships of voltage-gated sodium channels. Pharmacol Rev. 2005;57:397–409. doi: 10.1124/pr.57.4.4. [DOI] [PubMed] [Google Scholar]
- Clark B, Hausser M. Neural coding: hybrid analog and digital signalling in axons. Curr Biol. 2006;16:R585–R588. doi: 10.1016/j.cub.2006.07.007. [DOI] [PubMed] [Google Scholar]
- Clark BA, Monsivais P, Branco T, London M, Hausser M. The site of action potential initiation in cerebellar Purkinje neurons. Nat Neurosci. 2005;8:137–139. doi: 10.1038/nn1390. [DOI] [PubMed] [Google Scholar]
- Colbert CM, Pan E. Ion channel properties underlying axonal action potential initiation in pyramidal neurons. Nat Neurosci. 2002;5:533–538. doi: 10.1038/nn0602-857. [DOI] [PubMed] [Google Scholar]
- Coussen F, Normand E, Marchal C, Costet P, Choquet D, Lambert M, Mege RM, Mulle C. Recruitment of the kainate receptor subunit glutamate receptor 6 by cadherin/catenin complexes. J Neurosci. 2002;22:6426–6436. doi: 10.1523/JNEUROSCI.22-15-06426.2002. [DOI] [PMC free article] [PubMed] [Google Scholar]
- Debanne D. Information processing in the axon. Nat Rev Neurosci. 2004;5:304–316. doi: 10.1038/nrn1397. [DOI] [PubMed] [Google Scholar]
- Fache MP, Moussif A, Fernandes F, Giraud P, Garrido JJ, Dargent B. Endocytotic elimination and domain-selective tethering constitute a potential mechanism of protein segregation at the axonal initial segment. J Cell Biol. 2004;166:571–578. doi: 10.1083/jcb.200312155. [DOI] [PMC free article] [PubMed] [Google Scholar]
- Garrido JJ, Fernandes F, Giraud P, Mouret I, Pasqualini E, Fache MP, Jullien F, Dargent B. Identification of an axonal determinant in the C-terminus of the sodium channel Na(v)1.2. EMBO J. 2001;20:5950–5961. doi: 10.1093/emboj/20.21.5950. [DOI] [PMC free article] [PubMed] [Google Scholar]
- Garrido JJ, Giraud P, Carlier E, Fernandes F, Moussif A, Fache MP, Debanne D, Dargent B. A targeting motif involved in sodium channel clustering at the axonal initial segment. Science. 2003a;300:2091–2094. doi: 10.1126/science.1085167. [DOI] [PubMed] [Google Scholar]
- Garrido JJ, Fernandes F, Moussif A, Fache MP, Giraud P, Dargent B. Dynamic compartmentalization of the voltage-gated sodium channels in axons. Biol Cell. 2003b;95:437–445. doi: 10.1016/s0248-4900(03)00091-1. [DOI] [PubMed] [Google Scholar]
- Goldfarb M. Fibroblast growth factor homologous factors: evolution, structure, and function. Cytokine Growth Factor Rev. 2005;16:215–220. doi: 10.1016/j.cytogfr.2005.02.002. [DOI] [PMC free article] [PubMed] [Google Scholar]
- Goldfarb M, Schoorlemmer J, Williams A, Diwakar S, Wang Q, Huang X, Giza J, Tchetchik D, Kelley K, Vega A, Matthews G, Rossi P, Ornitz DM, D'Angelo E. Fibroblast growth factor homologous factors control neuronal excitability through modulation of voltage-gated sodium channels. Neuron. 2007;55:449–463. doi: 10.1016/j.neuron.2007.07.006. [DOI] [PMC free article] [PubMed] [Google Scholar]
- Goslin K, Asmussen H, Banker G. Rat hippocampal neurons in low-density culture. In: Banker G, Goslin K, editors. Culturing nerve cells. Cambridge, MA: MIT; 1998. pp. 339–370. [Google Scholar]
- Hirokawa N, Takemura R. Molecular motors and mechanisms of directional transport in neurons. Nat Rev Neurosci. 2005;6:201–214. doi: 10.1038/nrn1624. [DOI] [PubMed] [Google Scholar]
- Isom LL. Beta subunits: players in neuronal hyperexcitability? Novartis Found Symp. 2002;241:124–138. discussion 138–143, 226–232. [PubMed] [Google Scholar]
- Isom LL, De Jongh KS, Catterall WA. Auxiliary subunits of voltage-gated ion channels. Neuron. 1994;12:1183–1194. doi: 10.1016/0896-6273(94)90436-7. [DOI] [PubMed] [Google Scholar]
- Itoh N, Ornitz DM. Evolution of the Fgf and Fgfr gene families. Trends Genet. 2004;20:563–569. doi: 10.1016/j.tig.2004.08.007. [DOI] [PubMed] [Google Scholar]
- Khaliq ZM, Raman IM. Relative contributions of axonal and somatic Na channels to action potential initiation in cerebellar Purkinje neurons. J Neurosci. 2006;26:1935–1944. doi: 10.1523/JNEUROSCI.4664-05.2006. [DOI] [PMC free article] [PubMed] [Google Scholar]
- Komada M, Soriano P. “Beta”IV-spectrin regulates sodium channel clustering through ankyrin-G at axon initial segments and nodes of Ranvier. J Cell Biol. 2002;156:337–348. doi: 10.1083/jcb.200110003. [DOI] [PMC free article] [PubMed] [Google Scholar]
- Liu C, Dib-Hajj SD, Waxman SG. Fibroblast growth factor homologous factor 1B binds to the C terminus of the tetrodotoxin-resistant sodium channel rNav1.9a (NaN) J Biol Chem. 2001;276:18925–18933. doi: 10.1074/jbc.M101606200. [DOI] [PubMed] [Google Scholar]
- Liu CJ, Dib-Hajj SD, Renganathan M, Cummins TR, Waxman SG. Modulation of the cardiac sodium channel Na(v)1.5 by fibroblast growth factor homologous factor 1B. J Biol Chem. 2003;278:1029–1036. doi: 10.1074/jbc.M207074200. [DOI] [PubMed] [Google Scholar]
- Lou JY, Laezza F, Gerber BR, Xiao M, Yamada KA, Hartmann H, Craig AM, Nerbonne JM, Ornitz DM. Fibroblast growth factor 14 is an intracellular modulator of voltage-gated sodium channels. J Physiol (Lond) 2005;569:179–193. doi: 10.1113/jphysiol.2005.097220. [DOI] [PMC free article] [PubMed] [Google Scholar]
- Manto MU. The wide spectrum of spinocerebellar ataxias (SCAs) Cerebellum. 2005;4:2–6. doi: 10.1080/14734220510007914. [DOI] [PubMed] [Google Scholar]
- Meeks JP, Jiang X, Mennerick S. Action potential fidelity during normal and epileptiform activity in paired soma-axon recordings from rat hippocampus. J Physiol (Lond) 2005;566:425–441. doi: 10.1113/jphysiol.2005.089086. [DOI] [PMC free article] [PubMed] [Google Scholar]
- Meisler MH, Kearney JA. Sodium channel mutations in epilepsy and other neurological disorders. J Clin Invest. 2005;115:2010–2017. doi: 10.1172/JCI25466. [DOI] [PMC free article] [PubMed] [Google Scholar]
- Nishimura K, Akiyama H, Komada M, Kamiguchi H. betaIV-spectrin forms a diffusion barrier against L1CAM at the axon initial segment. Mol Cell Neurosci. 2007;34:422–430. doi: 10.1016/j.mcn.2006.11.017. [DOI] [PubMed] [Google Scholar]
- Olsen SK, Garbi M, Zampieri N, Eliseenkova AV, Ornitz DM, Goldfarb M, Mohammadi M. Fibroblast growth factor (FGF) homologous factors share structural but not functional homology with FGFs. J Biol Chem. 2003;278:34226–34236. doi: 10.1074/jbc.M303183200. [DOI] [PubMed] [Google Scholar]
- Ornitz DM, Itoh N. Fibroblast growth factors. Genome Biol. 2001;2 doi: 10.1186/gb-2001-2-3-reviews3005. REVIEWS3005. [DOI] [PMC free article] [PubMed] [Google Scholar]
- Reyes A. Influence of dendritic conductances on the input-output properties of neurons. Annu Rev Neurosci. 2001;24:653–675. doi: 10.1146/annurev.neuro.24.1.653. [DOI] [PubMed] [Google Scholar]
- Rush AM, Wittmack EK, Tyrrell L, Black JA, Dib-Hajj SD, Waxman SG. Differential modulation of sodium channel Na(v)1.6 by two members of the fibroblast growth factor homologous factor 2 subfamily. Eur J Neurosci. 2006;23:2551–2562. doi: 10.1111/j.1460-9568.2006.04789.x. [DOI] [PubMed] [Google Scholar]
- Schaller KL, Caldwell JH. Developmental and regional expression of sodium channel isoform NaCh6 in the rat central nervous system. J Comp Neurol. 2000;420:84–97. [PubMed] [Google Scholar]
- Schoorlemmer J, Goldfarb M. Fibroblast growth factor homologous factors and the islet brain-2 scaffold protein regulate activation of a stress-activated protein kinase. J Biol Chem. 2002;277:49111–49119. doi: 10.1074/jbc.M205520200. [DOI] [PMC free article] [PubMed] [Google Scholar]
- Sjostrom PJ, Hausser M. A cooperative switch determines the sign of synaptic plasticity in distal dendrites of neocortical pyramidal neurons. Neuron. 2006;51:227–238. doi: 10.1016/j.neuron.2006.06.017. [DOI] [PMC free article] [PubMed] [Google Scholar]
- Smallwood PM, Munoz-Sanjuan I, Tong P, Macke JP, Hendry SH, Gilbert DJ, Copeland NG, Jenkins NA, Nathans J. Fibroblast growth factor (FGF) homologous factors: new members of the FGF family implicated in nervous system development. Proc Natl Acad Sci USA. 1996;93:9850–9857. doi: 10.1073/pnas.93.18.9850. [DOI] [PMC free article] [PubMed] [Google Scholar]
- Van Swieten JC, Brusse E, De Graaf BM, Krieger E, Van De Graaf R, De Koning I, Maat-Kievit A, Leegwater P, Dooijes D, Oostra BA, Heutink P. A mutation in the fibroblast growth factor 14 gene is associated with autosomal dominant cerebellar ataxia. Am J Hum Genet. 2003;72:191–199. doi: 10.1086/345488. [DOI] [PMC free article] [PubMed] [Google Scholar]
- Van Wart A, Trimmer JS, Matthews G. Polarized distribution of ion channels within microdomains of the axon initial segment. J Comp Neurol. 2007;500:339–352. doi: 10.1002/cne.21173. [DOI] [PubMed] [Google Scholar]
- Verhey KJ, Meyer D, Deehan R, Blenis J, Schnapp BJ, Rapoport TA, Margolis B. Cargo of kinesin identified as JIP scaffolding proteins and associated signaling molecules. J Cell Biol. 2001;152:959–970. doi: 10.1083/jcb.152.5.959. [DOI] [PMC free article] [PubMed] [Google Scholar]
- Wang Q, McEwen DG, Ornitz DM. Subcellular and developmental expression of alternatively spliced forms of fibroblast growth factor 14. Mech Dev. 2000;90:283–287. doi: 10.1016/s0925-4773(99)00241-5. [DOI] [PubMed] [Google Scholar]
- Wang Q, Bardgett ME, Wong M, Wozniak DF, Lou J, McNeil BD, Chen C, Nardi A, Reid DC, Yamada K, Ornitz DM. Ataxia and paroxysmal dyskinesia in mice lacking axonally transported FGF14. Neuron. 2002;35:25–38. doi: 10.1016/s0896-6273(02)00744-4. [DOI] [PubMed] [Google Scholar]
- Waters J, Schaefer A, Sakmann B. Backpropagating action potentials in neurones: measurement, mechanisms and potential functions. Prog Biophys Mol Biol. 2005;87:145–170. doi: 10.1016/j.pbiomolbio.2004.06.009. [DOI] [PubMed] [Google Scholar]
- Wittmack EK, Rush AM, Craner MJ, Goldfarb M, Waxman SG, Dib-Hajj SD. Fibroblast growth factor homologous factor 2B: association with Nav1.6 and selective colocalization at nodes of Ranvier of dorsal root axons. J Neurosci. 2004;24:6765–6775. doi: 10.1523/JNEUROSCI.1628-04.2004. [DOI] [PMC free article] [PubMed] [Google Scholar]
- Wozniak DF, Xiao M, Xu L, Yamada KA, Ornitz DM. Impaired spatial learning and defective theta burst induced LTP in mice lacking fibroblast growth factor 14. Neurobiol Dis. 2007;26:14–26. doi: 10.1016/j.nbd.2006.11.014. [DOI] [PMC free article] [PubMed] [Google Scholar]
- Xiao M, Xu L, Laezza F, Yamada K, Feng S, Ornitz DM. Impaired hippocampal synaptic transmission and plasticity in mice lacking fibroblast growth factor 14. Mol Cell Neurosci. 2007;34:366–377. doi: 10.1016/j.mcn.2006.11.020. [DOI] [PubMed] [Google Scholar]