

Abstract
Na+ channels are often spliced but little is known about the functional consequences of splicing. We have been studying the regulation of Na+ current inactivation in an electric fish model in which systematic variation in the rate of inactivation of the electric organ Na+ current shapes the electric organ discharge (EOD), a sexually dimorphic, androgen-sensitive communication signal. Here, we examine the relationship between an Na+ channel (Nav1.4b), which has two splice forms, and the waveform of the EOD. One splice form (Nav1.4bL) possesses a novel first exon that encodes a 51 aa N-terminal extension. This is the first report of an Na+ channel with alternative splicing in the N terminal. This N terminal is present in zebrafish suggesting its general importance in regulating Na+ currents in teleosts. The extended N terminal significantly speeds fast inactivation, shifts steady-state inactivation, and dramatically enhances recovery from inactivation, essentially fulfilling the functions of a β subunit. Both splice forms are equally expressed in muscle in electric fish and zebrafish but Nav1.4bL is the dominant form in the electric organ implying electric organ-specific transcriptional regulation. Transcript abundance of Nav1.4bL in the electric organ is positively correlated with EOD frequency and lowered by androgens. Thus, shaping of the EOD waveform involves the androgenic regulation of a rapidly inactivating splice form of an Na+ channel. Our results emphasize the role of splicing in the regulation of a vertebrate Na+ channel and its contribution to a known behavior.
Keywords: androgen, electric organ, neuroethology, oocyte, sodium channel, splice variant
Introduction
Na+ channels are composed of an Na+ channel α subunit, and one or more β subunit. Na+ channels may also be spliced (Sarao et al., 1991; Thackeray and Ganetzky, 1995; Kerr et al., 2004; Raymond et al., 2004; Wood, 2005). The consequences of Na+ channel splicing have been studied in invertebrates (Tan et al., 2002; Du et al., 2006), but little investigated in vertebrates (Dietrich et al., 1998; Akopian et al., 1999; Ou et al., 2005). It is not clear what role Na+ channel splicing plays in the nervous system. We have been studying the functional consequences of Na+ channel splicing in the electric organ (EO) of an electric fish where Na+ currents play a key role in shaping a social signal. The waveform of this signal is related to the rate of inactivation of the Na+ current providing a functional context in which to interpret the role of splicing.
The electric organ discharge (EOD) of the weakly electric fish Sternopygus macrurus is a regular series of rounded pulses approximating a sine wave (see Fig. 1). EOD frequency is set by a brainstem pacemaker whereas the duration of each pulse depends on the membrane properties of the cells of the EO, the electrocytes. Subtle variation in the discharge conveys information about the species, sex, and individual identity of the emitter (Hopkins, 1974). Ion currents of the EO are tightly regulated to achieve this level of precision (Ferrari et al., 1995; McAnelly and Zakon, 2000). Males emit long EOD pulses at low frequencies and their electrocyte Na+ currents inactivate slowly, females emit short EOD pulses at high frequencies and their electrocyte Na+ currents inactivate rapidly, and the properties of juvenile EODs and Na+ currents are intermediate. Androgens lower EOD frequency, broaden the EOD pulse, and slow the rate of Na+ current inactivation in the electrocytes (Ferrari et al., 1995).
Figure 1.

Relationship between the EOD and Na+ current inactivation kinetics. A, EOD frequency is determined by the firing rate of pacemaker neurons in the pacemaker nucleus. The ∼50 pacemaker neurons are electrotonically coupled and fire simultaneously. Each action potential travels down to spinal motor neurons (not depicted) and these innervate the electrocytes, the cells of the electric organ. There is a 1:1 relationship between the firing rate of the pacemaker neurons and the EOD frequency as each descending action potential initiates a pulse from the electric organ. B, The duration of each pulse of the EOD is determined by the membrane properties of the electrocytes. Males generate long-duration pulses at low frequencies (top left), females generate short-duration pulses at high frequencies (bottom left). EOD pulse duration depends on the duration of the electrocyte action potentials (note stylized action potential riding on current injection, center), whose duration is mostly determined by the rate of inactivation of the electrocyte Na+ current (right). [This figure is reprinted from Liu et al. (2007), their Fig. 1].
Two Na+ channel α subunit (Nav1.4a and Nav1.4b) orthologs of the mammalian muscle Na+ channel gene Nav1.4 (Lopreato et al., 2001) and a β subunit (β1) are expressed in the Sternopygus EO (Zakon et al., 2006; Liu et al., 2007). Androgenic regulation of the β subunit accounts for some of the variation in this social signal (Liu et al., 2007).
Here, we examine the role of the Na+ channel α subunit Nav1.4b in shaping the EOD. We found that Nav1.4b is spliced; both splice forms are equally represented in muscle but one splice form (Nav1.4bL) predominates in the EO. Nav1.4bL possesses a novel first exon encoding a 51 aa N-terminal extension that significantly affects fast and steady-state inactivation and recovery from inactivation, functionally substituting for a β subunit. Nav1.4b is threefold higher in the EO of fish with rapidly inactivating Na+ currents (typically females) than in those with slowly inactivating Na+ currents (typically males). Transcript abundance is lowered twofold by androgens. Androgenic regulation of this Na+ channel gene and the predominant expression of its novel rapidly inactivating splice form in the EO aid in shaping a social signal.
Materials and Methods
Experimental animals.
Gold-lined black knifefish (Sternopygus macrurus) were housed in aquaria in the laboratory at ∼25°C and on a 12 h light/dark cycle. All fish used in this study were sexually immature adults of both sexes. EOD frequencies were measured with an amplifier (Grass P-15) and a multimeter (Fluke) on the frequency counter setting.
For harvesting EOs only, each fish was removed from its aquarium, placed on a countertop in a net, and its tail was rapidly cut with scissors. The fish was immediately returned to its aquarium to recover. When multiple tissues were taken, fish were killed with 1.0% phenoxyethanol, and brain, muscle, and heart were removed.
Zebrafish (Danio rerio) were obtained from a local vendor and temporarily housed in the laboratory aquaria. Tissues (brain, muscle, and heart) were taken after fish were killed with 1.0% phenoxyethanol. Rat leg muscle was obtained from the laboratory of Dr. Hitoshi Morikawa at the University of Texas at Austin. These procedures were in accordance with the University of Texas Institutional Animal Care and Use Committee protocols.
Molecular biology.
Total RNA and genomic DNA were isolated as described previously (Lopreato et al., 2001). Total RNA (10 μg) from each tissue type was used to perform 5′ and 3′ rapid amplification of cDNA ends (RACE) with the FirstChoice RLM-RACE kit (Ambion). The proximal promoter sequence were identified by 5′ rapid amplification of genomic ends (RAGE) following the method described previously (Liu and Baird, 2001).
To examine the relative abundance of smNav1.4a and smNav1.4b (sm, Sternopygus macrurus) in EO, one-step reverse transcriptase (RT)-PCRs were set up with 100 ng of pooled total RNA isolated from three medium-EOD-frequency fish and primers designed to amplify a region of the loop II–III in both genes. Reactions were stopped after every third cycle between 24 and 39 cycles. RT-PCR products were analyzed on a 2% agarose gel.
To examine the relative abundance of smNav1.4bL and smNav1.4bS, 90 ng of total RNA isolated from pooled EO and muscle was used in 20 μl one-step PCRs. Primers designed specifically for either exon were used to amplify exon 1L and exon 1S. Reactions were stopped after 24, 27, 30 and 33 cycles, and analyzed on a 1.5% agarose gel.
Real-time quantitative RT-PCR was performed as described previously (Liu et al., 2007).
Immunoprecipitation and Western blot.
Two antibodies were used in this study. One polyclonal rabbit antibody (Na1-NT) was generated and affinity-purified by Sigma-Genosys against the peptide NRTAHVKKSEKLKLW. The other polyclonal rabbit antibody (pan-Na channel antibody) was against a conserved region in all Na+ channels (Upstate Biotechnology).
Electric organ, brain, and muscle from four Sternopygus were quickly dissected, pooled, and homogenized in ice-cold lysis buffer (50 mm Tris-Cl, pH 8.0, 150 mm NaCl, 10 mm EDTA, 1% Triton X-100) freshly mixed with protease inhibitors (Roche). Cell lysates were incubated for 2 h and centrifuged at 10,000 × g for 10 min to remove the insoluble fraction. Cell lysate containing 1 mg of solubilized protein was cleared with 100 μl of protein A-agarose (Upstate Biotechnology), then mixed with 5 μg of Na1-NT antibody and incubated overnight. The sample was added with 50 μl of protein A-agarose again, incubated for 2 h, collected by 1 min centrifugation, washed three times with ice-cold lysis buffer, and finally resuspended in 50 μl 2× Laemmli sample buffer. All incubation and centrifugation steps were performed at 4°C. Immunoprecipitated samples were used in Western blot probed with pan-Na channel antibody as described previously (Liu et al., 2007).
To compare the smNav1.4bL expression semiquantitatively, pan-Na channel antibody was used to immunoprecipitate all Na+ channels from the tails of four high-frequency fish and four low-frequency fish with the method above. Immunoprecipitated samples were pooled into two groups and 10 μl from each group were loaded on 7.5% Tris-HCl SDS-PAGE gels in duplicates. One gel was stained with Coomassie blue (Bio-Rad) and the other was used in Western blot probed with Na1-NT antibody with 1:2500 primary antibody and 1:100,000 secondary antibody and treated with Supersignal West Femto Chemiluminescent substrate (Pierce). SDS-PAGE gels and Western blot film were scanned and analyzed semiquantitatively with ImageJ software available at http://rsb.info.nih.gov/ij/.
Expression of Nav1.4 genes in Xenopus oocytes.
The full-length sequence of smNav1.4bL was cloned by PCRs and ligated into a vector derived from pGEMHE (Liman et al., 1992). smNav1.4bS was obtained by cutting the beginning sequence of smNav1.4bL including the first start codon out of the plasmid. The P30-deletion mutant was made by site-directed mutagenesis with QuikChange XL Mutagenesis kit (Stratagene). All plasmids constructed in this study were linearized by SpeI and used as templates to synthesize cRNA using T7 mMessage mMachine in vitro transcription kit (Ambion).
Electrophysiological experiments were performed as described previously (Liu et al., 2007). Typical Na+ currents were obtained by presenting a series of voltage-clamp steps (−60 to +35 mV, 50 ms) from a holding potential of −90 mV. Current–voltage (I–V) relationships were plotted. Conductance was calculated by G = I/(Vm − Vrev) and normalized conductance–voltage curves were fit with a Boltzmann equation. Steady-state inactivation curves were obtained by presenting a test pulse (50 ms, −10 mV) after a series of conditioning pulses (−100–0 mV, 50 ms) with intervals of 1 s for smNav1.4b and 10 s for hNav1.4 at −90 mV to allow full recovery from inactivation. Currents were normalized and fit with a Boltzmann equation. The time constant of fast inactivation (τh) was tested by a depolarization step from −90 to −10 mV. τh was extracted from a single exponential fit over the range where the current decayed from 90 to 10%. Recovery from fast inactivation was studied by two pulses protocol. Cells were prepulsed to −10 mV for 50 ms to inactivate all of the current, and then recovery potential at −90 mV with increasing recovery durations were applied before the test pulse to −10 mV (50 ms) to assay the fraction of current recovered. Normalized peak current amplitudes were plotted and fitted to a single exponential function and the time constant was determined. Data analysis was performed using a combination of Clampfit 8.2 (Molecular Devices) and Origin 7.0 (OriginLab).
All values are presented as mean ± SEM. Statistical differences were derived from one-way ANOVA using SPSS (SPSS). Linear correlation between gene expression and EOD frequency was done in Origin 7.0. A summary of the results of all statistical tests is given in supplemental Tables 2–4 (available at www.jneurosci.org as supplemental material).
Results
Identification of the cDNA sequence of a novel Nav1.4 with an extended N terminus
Partial sequence of smNav1.4b, one of the two mammalian Nav1.4 homologs, was identified previously (Lopreato et al., 2001). Using RT-PCR and 5′ and 3′ RACE to obtain the full-length sequence of smNav1.4b, we observed two transcripts of this gene in EO and muscle of Sternopygus (Figs. 1, 2A). Interestingly, the longer band showed an extraordinary dominance in the EO, in contrast to comparable abundances of the two transcripts in the muscle. Further cloning and sequencing of the genomic sequence around the beginning of smNav1.4b revealed that this gene has two exclusive first exons that we named 1S and 1L according to their sizes, separated by at least 1.2 kb (Fig. 2B). The most significant difference between the two alternative first exons is that exon 1L contains a start codon but exon 1S does not (Fig. 2B); thus, the two mRNA transcripts will be translated into two different proteins. One protein (smNav1.4bL, translated from exon 1L) has an extra 51 aa segment in the N terminus, which makes its N terminus ∼50% longer than the other (smNav1.4bS), of which the translation starts in the second exon. Structural analyses (Chou and Fasman, 1974; Garnier et al., 1978) predict a helix in the middle of this extended N-terminal segment of Nav1.4b; this helix contains six positively charged amino acids and it is adjacent to a possible proline hinge (Fig. 3). The extra 51 aa N-terminal segment in smNav1.4bL is composed of 41% nonpolar and 59% polar and charged residues. Hydrophilicity predictions suggest that this segment is located inside the cell.
Figure 2.

Identification of a novel Nav1.4 with an extended N terminus in Sternopygus. A, RT-PCR showed alternative splicing patterns in the electric organ (E) and skeletal muscle (M) of Sternopygus macrurus and in the skeletal muscle of the zebrafish (Danio rerio) and the rat (Rattus norvegicus). The DNA ladder (L) is in base pairs. B, Schematic illustration of the alternative splice pattern of Nav1.4 in the three species. Each block represents an exon with the assigned name marked above. The size of each intron and exon is marked below if known.
Figure 3.

Extended N terminus of smNav1.4bL. A, Alignment of translated N-terminal amino acid sequences of Nav1.4b in Sternopygus macrurus (smNav1.4bL) and the zebrafish Danio rerio (drNav1.4bL), the other EO-expressing Na+ channel gene from S. macrurus (smNav1.4a), and their human ortholog (hNav1.4). Residues with similar functionality are shaded. Round dots mark the positively charged residues in the predicted helical region of the extended N terminus of smNav1.4bL. A square marks the proline residue immediately after the helix and mutated in this study. B, Immunoprecipitation of Na+ channel with N-terminal specific antibody followed by labeling with a pan-Na+ channel antibody on Western blots confirms the translation of the extended N terminus and the expression of the long splice form of smNav1.4b in Sternopygus muscle and EO.
We wished to determine whether this pattern of splicing is unique to this species, found more generally in teleosts, or widely observed in other vertebrates so we examined the mRNA splicing pattern of Nav1.4b in the zebrafish (Danio rerio) and Nav1.4 in the rat (Rattus norvegicus). In the zebrafish skeletal muscle, the pattern of two transcripts is very similar to that of Sternopygus (Figs. 2, 3): exon 1L also contains a start codon, the extra segment of N terminus is translated from exon 1L, and the helical structure and multiple positively charged residues in this helix all show high similarities to those in Sternopygus (Fig. 3). In rat muscle, we also identified two rNav1.4 transcripts (Fig. 2A), but in a different pattern: both transcripts include a distant exon 1 but one transcript splices out a proximal cassette exon 1A (Fig. 2B, supplemental Table 1, available at www.jneurosci.org as supplemental material). Neither the distant first exon nor the proximal cassette exon contains a start codon; thus, the two transcripts will be translated into identical protein products, although the presence of the cassette exon may still affect the translation process. The transcript containing the cassette exon is novel. Its abundance seems fairly low in the leg muscle. The exact locations of the exons and introns in zebrafish and rat were identified in their genomes (supplemental Table 1, available at www.jneurosci.org as supplemental material). Notably, the distance between exon 1S and 1L is 34.4 kb, far longer than the average intron size in zebrafish (0.2 kb) and other animals (Vinogradov, 1999; Mattick and Gagen, 2001).
Immunopreciptation and Western blot confirm the existence of smNav1.4bL protein
Bioinfomatic analysis of start codons on NetStart 1.0 prediction server (http://www.cbs.dtu.dk/services/NetStart/) ranked the start codon in exon 1L and the first start codon in exon 1S with the second and ninth highest scores of all 56 predicted start codons in the whole sequence, suggesting that both of these start codons have a high probability of being translation initiation sites.
To confirm that this novel N terminus is translated and part of the mature Na+ channel, we generated a polyclonal antibody against the α-helix (Fig. 3A) in this region. We used this antibody to immunoprecipitate solubilized proteins from EO and muscle, then probed them with a pan-Na channel antibody (the epitope is identical to smNav1.4b sequence) in a Western blot. The presence of a band at ∼280 kDa (Fig. 3B) confirms that the smNav1.4bL splice form is indeed translated in EO and muscle.
The extended N terminus influences Na+ current inactivation
To examine whether the extended N terminus contributes to Na+ channel function, we constructed plasmids containing full-length sequences of smNav1.4bL and smNav1.4bS and injected cRNA into Xenopus oocytes. We compared the activation and inactivation voltage dependencies (as determined by V1/2 values from a Boltzmann equation) and time constants of fast inactivation and rate of recovery from inactivation (as determined by fits with a single exponential function) of smNav1.4bL, smNav1.4bS, and their human ortholog hNav1.4.
The three channels did not differ in their voltage dependence of activation (Fig. 4B, Table 1). smNav1.4bS and hNav1.4 showed similar voltage dependences for steady-state inactivation. However, smNav1.4bL inactivated at significantly more negative membrane potentials than the other two channels (p < 0.01). smNav1.4bS inactivated significantly more rapidly than hNav1.4, but smNav1.4bL inactivated more rapidly than both of these (p < 0.001) (Fig. 4A, Table 1). In the absence of a β subunit, Nav1.4bS recovered from inactivation slowly (Fig. 5E, Table 1). Surprisingly, even without a β subunit, smNav1.4bL recovered from inactivation very rapidly (∼350 times faster than smNav1.4bS) (Fig. 5F, Table 1). Because the only difference between Nav1.4bS and Nav1.4bL is the extended N-terminal segment, the increase in the speed of fast inactivation, the negative shift in voltage dependence of steady-state inactivation, and the significant enhancement of recovery from inactivation must be caused by the extended N-terminal segment. These are all attributes that are conferred on Na+ currents by coexpression with a β subunit.
Figure 4.

Properties of hNav1.4, smNav1.4bS, and smNav1.4bL expressed in Xenopus oocytes. A, Averaged peak current traces show that smNav1.4bL inactivates faster than smNav1.4bS and both are faster than their human ortholog hNav1.4. B, The three channels show no significant difference in voltage-dependent activation. C, smNav1.4bL shows a leftward shift of steady-state inactivation compared with the other two channels. Results of hNav1.4 and smNav1.4bS in this figure and Figure 5A–D were published previously by Liu et al. (2007) and replotted with smNav1.4bL for comparison.
Table 1.
Biophysical properties of expressed Na+ channels
| hNav1.4 | smNav1.4bS | smNav1.4bL | smNav1.4bL–P30Δ | |
|---|---|---|---|---|
| Activation V1/2 (mV) | ||||
| α only | −28.66 ± 3.3, n = 8 | −28.53 ± 1.51, n = 10 | −26.86 ± 0.70, n = 15 | −27.99 ± 0.98, n = 17 |
| α + β1L | −24.60 ± 1.35, n = 24 | −30.30 ± 0.99, n = 14 | −28.07 ± 1.42, n = 8 | −26.90 ± 0.80, n = 7 |
| α + β1S | −25.69 ± 1.17, n = 16 | −31.16 ± 1.38, n = 9 | −28.74 ± 1.18, n = 16 | N/A |
| Inactivation V1/2 (mV) | ||||
| α only | −48.35 ± 2.37, n = 11 | −43.01 ± 1.48, n = 21 | −58.98 ± 0.94, n = 15 | −53.91 ± 0.78, n = 21 |
| α + β1L | −52.76 ± 0.92, n = 24 | −59.22 ± 1.33, n = 10 | −61.85 ± 1.15, n = 7 | −53.56 ± 1.73, n = 11 |
| α + β1S | −52.02 ± 0.93, n = 16 | −56.18 ± 1.19, n = 24 | −61.03 ± 1.31, n = 13 | N/A |
| Inactivation τh (ms) | ||||
| α only | 9.04 ± 0.18, n = 26 | 2.63 ± 0.10, n = 14 | 1.31 ± 0.05, n = 14 | 2.45 ± 0.19, n = 26 |
| α + β1L | 1.23 ± 0.08, n = 23 | 1.81 ± 0.15, n = 12 | 0.78 ± 0.03, n = 7 | 1.72 ± 0.16, n = 15 |
| α + β1S | 2.09 ± 0.14, n = 21 | 1.95 ± 0.11, n = 22 | 1.08 ± 0.08, n = 23 | N/A |
| Recovery τ (ms) | ||||
| α only | N/A | 825.8 ± 74.3, n = 6 | 2.99 ± 0.28, n = 14 | 2.63 ± 0.27, n = 6 |
| α + β1L | N/A | 1.68 ± 0.17, n = 12 | 1.39 ± 0.14, n = 7 | 1.10 ± 0.05, n = 5 |
| α + β1S | N/A | 1.60 ± 0.18, n = 4 | 1.61 ± 0.30, n = 7 | N/A |
p values from ANOVA between groups are listed in supplemental Tables 2–4 (available at www.jneurosci.org as supplemental material).
Figure 5.

β1 subunits differentially modulate smNav1.4bL and smNav1.4bS. A, B, Both alternatively spliced β1 subunits speed up the inactivation (A) and negatively shift the steady-state voltage dependence of inactivation (B) of smNav1.4bS. C, The β1L subunit slightly but significantly speeds up the inactivation of smNav1.4bL, whereas β1S has no effect. D, β1 subunits do not shift the voltage dependence of steady-state inactivation of smNav1.4bL. E, smNav1.4bS shows extraordinarily slow recovery from inactivation, but the recovery is much faster when coexpressed with a β1 subunit (for clarity, only β1L is illustrated). F, In contrast, smNav1.4bL shows fast recovery from inactivation with or without a β1 subunit.
β1 subunits have only a small effect on smNav1.4bL
Because the extended N-terminal segment appeared to substitute for a β subunit, we reasoned that the response of the Nav1.4bL splice form to coexpression with a β subunit would be attenuated or absent. Because the EO evolved from skeletal muscle and the β1 subunit is the only auxiliary subunit found in skeletal muscle, we coexpressed the α subunits with the β1 subunit. The β1 subunit of teleosts itself has two alternative splice forms found recently by us and two other groups (Chopra et al., 2007; Fein et al., 2007; Liu et al., 2007), and we coexpressed each α subunit splice form with both β1 subunit splice forms from Sternopygus.
The coexpression of either β1 subunit had no effect on voltage dependence of activation of any of the channels. Coexpression of either β1 splice variant with smNav1.4bS [as in the study by Liu et al. (2007)] significantly shifted steady-state inactivation curve leftward by ∼20 mV (p < 0.001), sped up τh (p < 0.001), and drastically increased the rate of recovery from inactivation (p < 0.001) (Fig. 5, Table 1). Indeed, the addition of a β1 subunit to smNav1.4bS caused it to behave much like smNav1.4bL alone. Coexpression of either β subunit with smNav1.4bL had no effect on steady-state inactivation. Coexpression with the β1L subunit sped up τh (p < 0.05) and recovery from inactivation (p < 0.01). The β1S subunit had no significant effects on τh or recovery from inactivation. Thus, the N terminal substitutes for and attenuates the response to the β1 subunit.
Deletion of a proline strongly affects inactivation kinetics
The rigid structure of proline often forms a sharp bend in a peptide chain. Several prolines are located between the two predicted α helices in the N terminus of smNav1.4bL (Fig. 2A), including a proline (P30) immediately after the predicted helix in the extended N-terminal segment of smNav1.4bL; this proline is conserved in zebrafish. In an initial attempt to understand the function of the extended N-terminal sequence, this proline was deleted from smNav1.4bL by site-directed mutagenesis. This is expected to sharply divert the orientation of the positively charged helix.
Not surprisingly, deletion of this proline had no effect on the voltage dependence of activation (Fig. 6B, Table 1). However, the proline deletion slowed the inactivation speed of smNav1.4bL almost twofold (p < 0.001), making it statistically indistinguishable from smNav1.4bS (Fig. 6A, Table 1). The voltage dependence of steady-state inactivation was shifted rightward (Fig. 6C), but was not significantly different from wild type smNav1.4bL. The proline deletion had no effect on the rapid recovery from inactivation of smNav1.4bL (Fig. 6D). The proline deletion, therefore, dissociated the processes of fast inactivation and recovery from inactivation.
Figure 6.

Deletion of a proline in the extended N terminal partially abolishes the difference between smNav1.4bL and smNav1.4bS. A, Representative current traces show that the proline deletion slows the inactivation of smNav1.4bL. B, The three channels show no significant difference in voltage-dependent activation. C, The deletion of the proline shifts the voltage-dependent inactivation toward the direction of smNav1.4bS. D, The deletion of proline does not significantly change the recovery from inactivation.
Similar to wild-type smNav1.4bL, coexpression of β1L with mutant P30 deletion sped τh (p < 0.05) and recovery from inactivation (p < 0.05), but had no significant effect on voltage dependence of activation and inactivation (Table 1).
Tissue distribution pattern of smNav1.4b transcripts
5′ RACE of Nav1.4b in Sternopygus suggested a preferential expression of exon 1L in the EO, despite the longer size of its amplicon and, therefore, presumably lower amplification efficacy in PCRs (Fig. 2A). To further compare the expression level of each transcript between EO and muscle, we performed semiquantitative RT-PCR with primers specifically designed for exon 1L and 1S and total RNA isolated from pooled tissues of three medium-EOD-frequency (∼90 Hz) fish. The same amount of total RNA from each tissue was used in RT-PCRs and amplified for 24, 27, 30, and 33 cycles. Because of possibly different amplification efficacies of different primer pairs, comparisons can only be made on the same transcript between tissue types, but not on different transcripts in the same tissue. Figures 2A and 7A show that smNav1.4bL is expressed in EO and muscle at comparable levels, whereas smNav1.4bS is strongly repressed in EO.
Figure 7.

Semiquantitative RT-PCR reveals the expression profiles of Na+ channels in muscle and electric organ of Sternopygus. A, RT-PCR with primers specific to smNav1.4bL or smNav1.4bS. The same amount of total RNA from the electric organ and skeletal muscle was loaded as template. One-step RT-PCRs were set up identically but stopped after different numbers of cycles. Comparison is made between tissue types for each splice form, showing that smNav1.4bL (L) has a comparable abundance in muscle and electric organ whereas smNav1.4bS (S) is very low in the electric organ. B, smNav1.4a and smNav1.4b have a comparable abundance in the electric organ of midfrequency EOD (∼90 Hz) fish. One-step RT-PCRs with primers in conserved regions were set up identically but stopped after different numbers of cycles. Products with expected sizes (519 bp, top band, from smNav1.4a and 450bp, bottom band, from smNav1.4b) were separated and shown in a 2% agarose gel. Comparisons made between the two genes show that they have comparable abundance in a sample of fish with a midrange EOD frequency.
smNav1.4a and smNav1.4b are expressed in electric organ at comparable levels
We next compared the expression of total smNav1.4b with smNav1.4a in the EO. One-step RT-PCRs were set up with primers designed to amplify a shared region, but with different lengths, in smNav1.4a and smNav1.4b (519 and 450 bp, respectively). Total RNA was isolated from the same sample of EOs from three medium-EOD-frequency fish as above. Reactions were stopped every third cycle between 24 and 39 cycles and loaded on an agarose gel (Fig. 7B). The results showed smNav1.4a (top band) and smNav1.4b (bottom band) have comparable abundance in fish with midfrequency EODs.
mRNA level of smNav1.4bL correlates with EOD frequency
We then used real-time quantitative RT-PCR to examine the mRNA levels of smNav1.4a (that does not appear to be spliced), total smNav1.4b, and the smNav1.4bL splice form (levels of Nav1.4bS were too low in all fish for accurate detection with a one-step PCR procedure) in samples of EO from a number of fish across the EOD frequency range to test whether the levels of their mRNA vary with EOD frequency. The amplification of the most variable region in these two Na+ channels, the domain II-III loop, was examined to assay mRNA levels of smNav1.4b and smNav1.4a for maximum specificity.
The mRNA level of smNav1.4a showed no significant difference between high- (>100 Hz; 0.96 ± 0.14) and low-EOD-frequency (<80 Hz; 1.00 ± 0.13, low-frequency group normalized to 1.0) fish when fish were grouped into two frequency classes, nor did the mRNA level of smNav1.4a correlate with EOD frequency (Fig. 8A). However, the total mRNA level of smNav1.4b was significantly higher in high- (1.39 ± 0.13) than in low-EOD-frequency (1.00 ± 0.05) fish and the normalized mRNA level of smNav1.4b positively correlated with EOD frequency (Fig. 8B).
Figure 8.

The expression of smNav1.4a, smNav1.4b, and the smNav1.4bL splice variant versus EOD frequency. Measurements are by RT-PCR and normalized to 18S RNA. A, mRNA level of smNav1.4a shows no significant correlation with each individual's EOD frequency. B, C, mRNA levels of smNav1.4b and its major splice variant smNav1.4bL are significantly higher in fish with high than with low EOD frequencies and positively correlated with EOD frequency. D, Protein samples from the EO of fish with high or low EOD frequencies were immunoprecipitated by a pan Na+ channel antibody, loaded on SDS-PAGE gels, and stained with either Coomassie blue (bottom) or blotted with the antibody against smNav1.4bL extended N terminus (top, slight difference in apparent molecular weight because of “smiling” on the gel). The comparison shows that a greater proportion of the total Na+ channel protein is Nav1.4bL in fish with higher EOD frequencies. CTL, Control.
Primers were designed to exon 1L of Nav1.4bL to specifically measure its abundance. Low-EOD-frequency fish had significantly lower levels of smNav1.4bL mRNA than high-EOD-frequency fish (1.00 ± 0.13; high, 2.71 ± 0.49) and the mRNA level of Nav1.4bL positively correlated with the EOD frequency (Fig. 8C). The low level of Nav1.4bS mRNA in the EO across the EOD frequency range suggests it plays little or no role in determining the characteristics of the Na+ current in the EO (although it is likely to be important in muscle).
Differences in Nav1.4bL were confirmed on the protein level using a pan-Na+ channel antibody to immunoprecipitate all Na+ channel protein from the EO and then probing the Western blot with the N-terminal extension-specific antibody (Fig. 8D).
DHT affects expression of sodium channels in electric organ
DHT lowers the EOD frequency of Sternopygus, broadens the electrocyte action potential, and slows down the inactivation of Na+ current in electrocytes (Ferrari et al., 1995). We next examined whether DHT influences the expression of the two Nav1.4 orthologs. We implanted fish intraperitoneally with DHT-filled SILASTIC capsules that significantly elevated serum DHT compared with the control group, which received empty capsules (DHT implant, 9.8 ± 2.7 ng/ml; control, 0.52 ± 0.50 ng/ml; p < 0.0001).
The EOD frequency of DHT-implanted fish began decreasing 3 d after the implant and was statistically significant from the controls after 7 d (control group, 123.15 ± 8.96 Hz; DHT group,100.86 ± 3.90 Hz; t test, p = 0.03). We dissected the fish tails 18 d after the implant when the EOD frequency of the DHT group stabilized and still significantly differed from the control group (control group, 125.00 ± 9.94 Hz; DHT group, 83.92 ± 1.88 Hz; p = 0.0004). Real-time quantitative RT-PCR showed that the total smNav1.4b mRNA as well as mRNA of the Nav1.4bL splice form were lowered (Fig. 9) (Nav1.4b total: control group, 1.00 ± 0.13 Hz; DHT group, 0.55 ± 0.05 Hz; p = 0.003; smNav1.4bL: control group, 1.00 ± 0.21 Hz, DHT group, 0.53 ± 0.05 Hz; p = 0.01. The mRNA level of smNav1.4a was not affected by DHT (control group, 1.00 ± 0.16 Hz; DHT group, 0.91 ± 0.04 Hz; p = 0.46).
Figure 9.
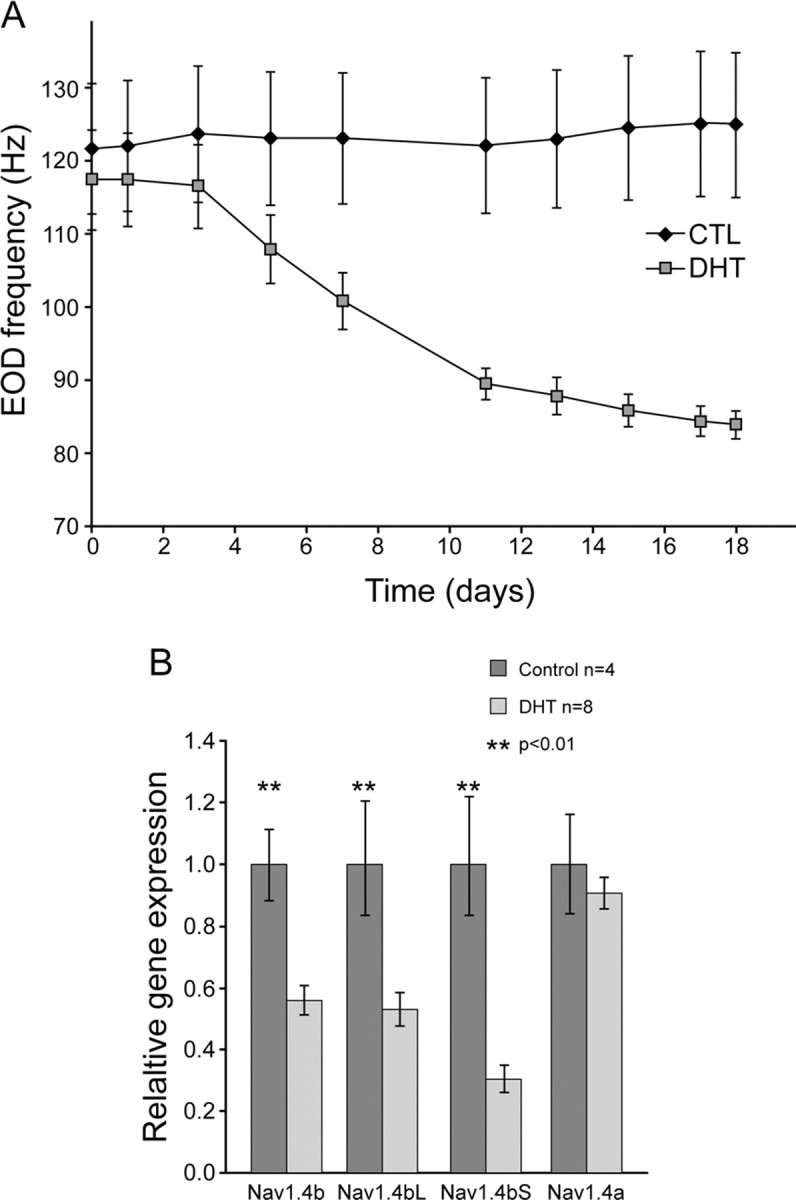
DHT lowered the EOD frequency and the expression of smNav1.4b. A, DHT implants lowered the EOD frequency over a period of 18 d. The EOD frequency was significantly different by 7 d after the DHT implant. B, Real-time quantitative RT-PCR shows that the expression of smNav1.4b and its splice variant Nav1.4bL are lowered by DHT implants. There is no significant change in the expression of smNav1.4a. [The data in A have been published previously in and are adapted from Liu et al. (2007), their Fig. 7A]. CTL, Control.
To locate the where DHT might act on genomic DNA, the intron between exon 1L and exon 2 and the genomic DNA sequence 1.2 kb upstream of exon 1L were cloned by PCR and 5′ RAGE. Transcriptional factor analysis on a bioinformatics server (Genomatix) identified a putative androgen receptor (AR) binding site at 702–720 bp in the intron between exon 1L and exon 2.
Discussion
A novel alternatively spliced N terminus in an Na+ channel
5′ RACE revealed two alternative first exons of smNav1.4b, one of which possesses a novel predicted start site that extends the N terminus by 51 aa. Recognition of the predicted novel N terminal by a specific antibody confirmed that this start site is used for translation. The same pattern of exons, including the start site, was observed in the zebrafish, suggesting that this variant may be common to other teleosts. We observed a different set of alternative exons in the 5′ end of the rat ortholog (Nav1.4) but, as is true of other Na+ channels with transcriptional variants at the 5′ end, these were in the untranslated region (Shang and Dudley, 2005). Alternative splicing has been observed at a variety of sites in the coding region of Na+ channels (Sarao et al., 1991; Schaller et al., 1992; Plummer et al., 1997; Dietrich et al., 1998; Wang et al., 2003), but our finding is the first example of splicing at the N terminal. Alternative splicing of the N terminal has been noted in calcium-activated potassium channels (slo) in Drosophila (Becker et al., 1995; Bohm et al., 2000), shaker-type Kv channels (Stocker et al., 1990; French et al., 2005), and L-type Ca2+ channels (Blumenstein et al., 2002). N-terminal splicing may be a general mechanism for regulation of ion channels.
The novel splice form influences Na+ current inactivation
The N terminus extension causes drastic changes in multiple aspects of the inactivation of the current: it inactivates ∼50% faster, there is a −16 mV shift in the V1/2 of steady-state inactivation, and there is a strikingly faster rate of recovery from inactivation. These are the same properties that are conferred on an Na+ channel α subunit by coexpression with a β subunit. Thus, the extended N terminal not only influences inactivation, but it functionally substitutes for a β subunit.
The C terminus influences the rate of inactivation of Na+ channels (Mantegazza et al., 2001; Cormier et al., 2002). An extended N terminal may be unique to teleosts, but it raises the question as to whether the “normal” N terminal of the Na+ channel participates in inactivation. Surprisingly, this has not been studied in detail, but a few lines of evidence suggest that it is likely. Biochemical evidence indicates that the N and C termini interact (Sun et al., 1995; Zhang et al., 2000). The phosphorylation of a serine in the N terminal (S36) (Tateyama et al., 2003) of the cardiac Na+ channel (Nav1.5) influences the inactivation of Na+ current, and this appears to be attributable to an interaction of this site with a phosphorylated residue in the C terminal. This serine is not conserved across Na+ channels, so it may be unique to this channel type. Finally, missense mutations in the N terminal of the brain-expressed Na+ channel Nav1.1 are correlated with various types of epilepsy (Mulley et al., 2005) and a mutation in the N terminal of the heart-expressing Nav1.5 is correlated with long QT syndrome (Priori et al., 2002). None of these mutations have been studied in expression systems, so it is unknown how they affect the Na+ current.
We do not know how the fish's extended N terminus interacts with the Na+ channel. The N terminus of a mammalian (rNav1.4) Na+ channel interacts with the C terminus by electrostatic forces with two helices at 13–30 (N terminal) and 1716–1737 (C terminal) (Zhang et al., 2000). Perhaps the extended N terminus interferes with such an electrostatic interaction, thereby affecting inactivation. The basic residues are condensed in the predicted α-helical region of the extended N terminal (6 of 17 aa between 14 and 31), thus they may compete with the basic residue-rich region in the C terminus (6 of 22, 1716–1737 in hNav1.4). Several prolines located between the two helices of the N terminus may act as hinges to facilitate the movement of N terminus into position. Indeed, deletion of the proline closest to the helix from the smNav1.4bL by site-directed mutagenesis significantly perturbed the effect of the N terminal on inactivation rate, although it only modestly effected steady-state inactivation and had no effect on recovery from inactivation. This dissociation of entry into and recovery from fast inactivation by the proline mutation is supported in the literature in which various manipulations of Na+ channels influence one process but not the other (Dib-Hajj et al., 1997).
Expression of Na+ channel splice forms in muscle and electric organ
Exon 1L of Nav1.4b is predominant in the EO, whereas the two exons are expressed equally in muscle in electric fish and zebrafish. How is the expression of 1L is enhanced, or more likely, the expression of 1S repressed? One possibility is tissue-specific transcriptional factors that regulate transcription initiation. We observed multiple transcription initiation sites of smNav1.4b transcripts, which might be the downstream targets for tissue-specific regulations. Search for promoter sites on a bioinformatics server (http://www.fruitfly.org/seq_tools/promoter.html) revealed only one putative promoter at 850 bp upstream of exon 1L, probably because of the limited number of fish specific promoter sequences in the database. Further bioinformatics study and quantitative measurements are needed to address this question.
Androgenic regulation of sodium channel expression
Systemic administration of DHT decreases the mRNA levels of total Nav1.4b transcript as well as the Nav1.4bL splice form. The slopes of the lines indicating the relationship between total Nav1.4b and EOD frequency, and Nav1.4bL and EOD frequency, are similar (Fig. 8B,C), and the extent of suppression of total Nav1.4b mRNA and mRNA of the Nav1.4bL splice form by DHT are similar (Fig. 9B), suggesting that DHT regulates levels of Nav1.4b but not its splicing.
Steroids enhance or repress gene expression via nuclear receptors (Chew and Gallo, 1998; Walters and Nemere, 2004). The steroidal repression of gene expression can involve several complex mechanisms (Dobrzycka et al., 2003). One possibility is that the DHT–AR complex may bind in the vicinity of the Nav1.4b gene and recruit histone deacetylase and nucleosome remodeling complexes to represses gene expression. We performed 5′ RAGE and identified ∼1 kb genomic DNA sequence upstream of exon 1L and the intron sequence between exon 1L and exon 2 and located a putative AR binding site in the intron. Because this intron is contained in transcription products of both Nav1.4bL and Nav1.4S, AR binding here may abort the transcription of both splice forms. Notably, this putative AR binding site is not found in the homolgous 2.3 kb intron in zebrafish. An antibody against AR of Sternopygus is needed for experimental confirmation (such as chromatin immunoprecipitation) of the association between AR and this site, which may help reveal the mechanism of DHT repression on the Nav1.4b gene.
The relationship between EOD pulse duration and Na+ channel expression
The systematic variation in EOD pulse duration is caused by coregulated variation in the activation kinetics of a delayed rectifier and the inactivation kinetics of the Na+ current (Ferrari et al., 1995; McAnelly and Zakon, 2000). The rate of inactivation of the electrocyte Na+ current varies systematically with the most rapid inactivation in mature females (τ = 0.5–1.0 ms) to the slowest in males (τ = 4.0–4.7 ms) (Ferrari et al., 1995).
Figure 10 illustrates schematically how the transcript abundance of Nav1.4a, Nav1.4bL (Nav1.4bS levels are so low that we do not believe they play a role in the EO), and the total levels of β1 are expressed in the EO as a function of EOD waveform. Fish with the shortest EOD pulse durations (and highest EOD frequencies) have the highest levels of total β1 subunit (Liu et al., 2007) and smNav1.4bL, whereas smNav1.4a is expressed at a constant level. We have not been able to express Nav1.4a in Xenopus oocytes, but we propose that Nav1.4a possesses slow inactivation kinetics as it is the predominant channel expressed in male electrocytes and the Na+ current of males inactivates slowly.
Figure 10.

A hypothesis for molecular regulation of the rate of inactivation of the Na+ current in the Sternopygus electrocyte. A, Schematic illustration of how mRNA levels of smNav1.4a, smNav1.4bL, and the β1 subunit vary with systematic variation in EOD waveform and electrocyte Na+ current. B, We hypothesize that smNav1.4a inactivates slowly. In this study, we show that smNav1.4bL activates rapidly. We hypothesize that two factors regulate the rate of inactivation: (1) as the ratio of smNav1.4bL to smNav1.4a increases, the average rate of inactivation of the population of Na+ channels will be faster; (2) because β1 subunits speed the rate of inactivation of Na+ currents, the increase in levels of β1 will speed both currents, especially Nav1.4a.
We hypothesize that the graded increase in the rate of inactivation of Na+ current in fish with ever-shorter EOD pulses derives from two factors. First, the increasing ratio of rapidly inactivating smNav1.4bL channels to (hypothetically) slowly inactivating Nav1.4a channels in the total population of Na+ channel α subunits would increase the overall speed of Na+ current inactivation. Second, increases in the total level of the β1 subunit would likely cause Na+ currents to inactivate more rapidly. Fish have two β1 splice forms that have nearly identical effects on Na+ currents (Fein et al., 2007; Liu et al., 2007). Thus, we consider only total levels of β1. β1 subunits have a slight effect on Nav1.4bL as these currents already inactivate rapidly. However, as the total level of the β1 subunit rises with respect to Nav1.4a, a greater number of Nav1.4a channels will have an associated β1 subunit and will inactivate more rapidly. This would be most likely if the affinity of the β1 subunit were greater for Nav1.4a than Nav1.4bL. Future experiments will allow us to test this hypothesis.
Footnotes
This work was supported by National Institutes of Health Grant R01NS025513. We thank Maggie Patay for fish care, Marianna Grenadier for help with artwork, Dr. Lynne McAnelly for help with dissections, The Yerkes National Primate Research Center (Emory University) Biomarkers Core laboratory for DHT analysis, and the University of Texas DNA Facility for help with sequencing.
References
- Akopian AN, Okuse K, Souslova V, England S, Ogata N, Wood JN. Trans-splicing of a voltage-gated sodium channel is regulated by nerve growth factor. FEBS Lett. 1999;445:177–182. doi: 10.1016/s0014-5793(99)00126-x. [DOI] [PubMed] [Google Scholar]
- Becker MN, Brenner R, Atkinson NS. Tissue-specific expression of a Drosophila calcium-activated potassium channel. J Neurosci. 1995;15:6250–6259. doi: 10.1523/JNEUROSCI.15-09-06250.1995. [DOI] [PMC free article] [PubMed] [Google Scholar]
- Blumenstein Y, Kanevsky N, Sahar G, Barzilai R, Ivanina T, Dascal N. A novel long N-terminal isoform of human L-type Ca2+ channel is up-regulated by protein kinase C. J Biol Chem. 2002;277:3419–3423. doi: 10.1074/jbc.C100642200. [DOI] [PubMed] [Google Scholar]
- Bohm RA, Wang B, Brenner R, Atkinson NS. Transcriptional control of Ca(2+)-activated K(+) channel expression: identification of a second, evolutionarily conserved, neuronal promoter. J Exp Biol. 2000;203:693–704. doi: 10.1242/jeb.203.4.693. [DOI] [PubMed] [Google Scholar]
- Chew LJ, Gallo V. Regulation of ion channel expression in neural cells by hormones and growth factors. Mol Neurobiol. 1998;18:175–225. doi: 10.1007/BF02741300. [DOI] [PubMed] [Google Scholar]
- Chopra SS, Watanabe H, Zhong TP, Roden DM. Molecular cloning and analysis of zebrafish voltage-gated sodium channel beta subunit genes: implications for the evolution of electrical signaling in vertebrates. BMC Evol Biol. 2007;7:113. doi: 10.1186/1471-2148-7-113. [DOI] [PMC free article] [PubMed] [Google Scholar]
- Chou PY, Fasman GD. Prediction of protein conformation. Biochemistry. 1974;13:222–245. doi: 10.1021/bi00699a002. [DOI] [PubMed] [Google Scholar]
- Cormier JW, Rivolta I, Tateyama M, Yang AS, Kass RS. Secondary structure of the human cardiac Na+ channel C terminus: evidence for a role of helical structures in modulation of channel inactivation. J Biol Chem. 2002;277:9233–9241. doi: 10.1074/jbc.M110204200. [DOI] [PubMed] [Google Scholar]
- Dib-Hajj SD, Ishikawa K, Cummins TR, Waxman SG. Insertion of a SNS-specific tetrapeptide in S3–S4 linker of D4 accelerates recovery from inactivation of skeletal muscle voltage-gated Na channel mu1 in HEK293 cells. FEBS Lett. 1997;416:11–14. doi: 10.1016/s0014-5793(97)01154-x. [DOI] [PubMed] [Google Scholar]
- Dietrich PS, McGivern JG, Delgado SG, Koch BD, Eglen RM, Hunter JC, Sangameswaran L. Functional analysis of a voltage-gated sodium channel and its splice variant from rat dorsal root ganglia. J Neurochem. 1998;70:2262–2272. doi: 10.1046/j.1471-4159.1998.70062262.x. [DOI] [PubMed] [Google Scholar]
- Dobrzycka KM, Townson SM, Jiang S, Oesterreich S. Estrogen receptor corepressors–a role in human breast cancer? Endocr Relat Cancer. 2003;10:517–536. doi: 10.1677/erc.0.0100517. [DOI] [PubMed] [Google Scholar]
- Du Y, Liu Z, Nomura Y, Khambay B, Dong K. An alanine in segment 3 of domain III (IIIS3) of the cockroach sodium channel contributes to the low pyrethroid sensitivity of an alternative splice variant. Insect Biochem Mol Biol. 2006;36:161–168. doi: 10.1016/j.ibmb.2005.11.008. [DOI] [PMC free article] [PubMed] [Google Scholar]
- Fein AJ, Meadows LS, Chen C, Slat EA, Isom LL. Cloning and expression of a zebrafish SCN1B ortholog and identification of a species-specific splice variant. BMC Genomics. 2007;8:226. doi: 10.1186/1471-2164-8-226. [DOI] [PMC free article] [PubMed] [Google Scholar]
- Ferrari MB, McAnelly ML, Zakon HH. Individual variation in and androgen-modulation of the sodium current in electric organ. J Neurosci. 1995;15:4023–4032. doi: 10.1523/JNEUROSCI.15-05-04023.1995. [DOI] [PMC free article] [PubMed] [Google Scholar]
- French LB, Singh A, Luik R, Harris-Warrick RM. Structural requirements for rapid inactivation and voltage dependence in splice variants of lobster Shaker potassium channels. J Recept Signal Transduct Res. 2005;25:73–97. doi: 10.1081/rrs-200068115. [DOI] [PubMed] [Google Scholar]
- Garnier J, Osguthorpe DJ, Robson B. Analysis of the accuracy and implications of simple methods for predicting the secondary structure of globular proteins. J Mol Biol. 1978;120:97–120. doi: 10.1016/0022-2836(78)90297-8. [DOI] [PubMed] [Google Scholar]
- Hopkins CD. Electric communication in the reproductive behavior of Sternopygus macrurus (Gymnotoidei) Z Tierpsychol. 1974;35:518–535. doi: 10.1111/j.1439-0310.1974.tb00465.x. [DOI] [PubMed] [Google Scholar]
- Kerr NC, Holmes FE, Wynick D. Novel isoforms of the sodium channels Nav1.8 and Nav1.5 are produced by a conserved mechanism in mouse and rat. J Biol Chem. 2004;279:24826–24833. doi: 10.1074/jbc.M401281200. [DOI] [PMC free article] [PubMed] [Google Scholar]
- Liman ER, Tytgat J, Hess P. Subunit stoichiometry of a mammalian K+ channel determined by construction of multimeric cDNAs. Neuron. 1992;9:861–871. doi: 10.1016/0896-6273(92)90239-a. [DOI] [PubMed] [Google Scholar]
- Liu H, Wu MM, Zakon HH. Individual variation and hormonal modulation of a sodium channel β subunit in the electric organ correlate with variation in a social signal. Dev Neurobiol. 2007;67:1289–1304. doi: 10.1002/dneu.20404. [DOI] [PubMed] [Google Scholar]
- Liu X, Baird W. Rapid amplification of genomic DNA ends by Nla III partial digestion and polynucleotide tailing. Plant Mol Biol Rep. 2001;19:261. [Google Scholar]
- Lopreato GF, Lu Y, Southwell A, Atkinson NS, Hillis DM, Wilcox TP, Zakon HH. Evolution and divergence of sodium channel genes in vertebrates. Proc Natl Acad Sci U S A. 2001;98:7588–7592. doi: 10.1073/pnas.131171798. [DOI] [PMC free article] [PubMed] [Google Scholar]
- Mantegazza M, Yu FH, Catterall WA, Scheuer T. Role of the C-terminal domain in inactivation of brain and cardiac sodium channels. Proc Natl Acad Sci U S A. 2001;98:15348–15353. doi: 10.1073/pnas.211563298. [DOI] [PMC free article] [PubMed] [Google Scholar]
- Mattick JS, Gagen MJ. The evolution of controlled multitasked gene networks: the role of introns and other noncoding RNAs in the development of complex organisms. Mol Biol Evol. 2001;18:1611–1630. doi: 10.1093/oxfordjournals.molbev.a003951. [DOI] [PubMed] [Google Scholar]
- McAnelly ML, Zakon HH. Coregulation of voltage-dependent kinetics of Na(+) and K(+) currents in electric organ. J Neurosci. 2000;20:3408–3414. doi: 10.1523/JNEUROSCI.20-09-03408.2000. [DOI] [PMC free article] [PubMed] [Google Scholar]
- Mulley JC, Scheffer IE, Petrou S, Dibbens LM, Berkovic SF, Harkin LA. SCN1A mutations and epilepsy. Hum Mutat. 2005;25:535–542. doi: 10.1002/humu.20178. [DOI] [PubMed] [Google Scholar]
- Ou SW, Kameyama A, Hao LY, Horiuchi M, Minobe E, Wang WY, Makita N, Kameyama M. Tetrodotoxin-resistant Na+ channels in human neuroblastoma cells are encoded by new variants of Nav1.5/SCN5A. Eur J Neurosci. 2005;22:793–801. doi: 10.1111/j.1460-9568.2005.04280.x. [DOI] [PubMed] [Google Scholar]
- Plummer NW, McBurney MW, Meisler MH. Alternative splicing of the sodium channel SCN8A predicts a truncated two-domain protein in fetal brain and non-neuronal cells. J Biol Chem. 1997;272:24008–24015. doi: 10.1074/jbc.272.38.24008. [DOI] [PubMed] [Google Scholar]
- Priori SG, Napolitano C, Gasparini M, Pappone C, Della Bella P, Giordano U, Bloise R, Giustetto C, De Nardis R, Grillo M, Ronchetti E, Faggiano G, Nastoli J. Natural history of Brugada syndrome: insights for risk stratification and management. Circulation. 2002;105:1342–1347. doi: 10.1161/hc1102.105288. [DOI] [PubMed] [Google Scholar]
- Raymond CK, Castle J, Garrett-Engele P, Armour CD, Kan Z, Tsinoremas N, Johnson JM. Expression of alternatively spliced sodium channel alpha-subunit genes. Unique splicing patterns are observed in dorsal root ganglia. J Biol Chem. 2004;279:46234–46241. doi: 10.1074/jbc.M406387200. [DOI] [PubMed] [Google Scholar]
- Sarao R, Gupta SK, Auld VJ, Dunn RJ. Developmentally regulated alternative RNA splicing of rat brain sodium channel mRNAs. Nucleic Acids Res. 1991;19:5673–5679. doi: 10.1093/nar/19.20.5673. [DOI] [PMC free article] [PubMed] [Google Scholar]
- Schaller KL, Krzemien DM, McKenna NM, Caldwell JH. Alternatively spliced sodium channel transcripts in brain and muscle. J Neurosci. 1992;12:1370–1381. doi: 10.1523/JNEUROSCI.12-04-01370.1992. [DOI] [PMC free article] [PubMed] [Google Scholar]
- Shang LL, Dudley SC., Jr Tandem promoters and developmentally regulated 5′- and 3′-mRNA untranslated regions of the mouse Scn5a cardiac sodium channel. J Biol Chem. 2005;280:933–940. doi: 10.1074/jbc.M409977200. [DOI] [PubMed] [Google Scholar]
- Stocker M, Stuhmer W, Wittka R, Wang X, Müller R, Ferrus A, Pongs O. Alternative Shaker transcripts express either rapidly inactivating or noninactivating K+ channels. Proc Natl Acad Sci U S A. 1990;87:8903–8907. doi: 10.1073/pnas.87.22.8903. [DOI] [PMC free article] [PubMed] [Google Scholar]
- Sun W, Barchi RL, Cohen SA. Probing sodium channel cytoplasmic domain structure. Evidence for the interaction of the rSkM1 amino and carboxyl termini. J Biol Chem. 1995;270:22271–22276. doi: 10.1074/jbc.270.38.22271. [DOI] [PubMed] [Google Scholar]
- Tan J, Liu Z, Nomura Y, Goldin AL, Dong K. Alternative splicing of an insect sodium channel gene generates pharmacologically distinct sodium channels. J Neurosci. 2002;22:5300–5309. doi: 10.1523/JNEUROSCI.22-13-05300.2002. [DOI] [PMC free article] [PubMed] [Google Scholar]
- Tateyama M, Rivolta I, Clancy CE, Kass RS. Modulation of cardiac sodium channel gating by protein kinase A can be altered by disease-linked mutation. J Biol Chem. 2003;278:46718–46726. doi: 10.1074/jbc.M308977200. [DOI] [PubMed] [Google Scholar]
- Thackeray JR, Ganetzky B. Conserved alternative splicing patterns and splicing signals in the Drosophila sodium channel gene para. Genetics. 1995;141:203–214. doi: 10.1093/genetics/141.1.203. [DOI] [PMC free article] [PubMed] [Google Scholar]
- Vinogradov AE. Intron-genome size relationship on a large evolutionary scale. J Mol Evol. 1999;49:376–384. doi: 10.1007/pl00006561. [DOI] [PubMed] [Google Scholar]
- Walters MR, Nemere I. Receptors for steroid hormones: membrane-associated and nuclear forms. Cell Mol Life Sci. 2004;61:2309–2321. doi: 10.1007/s00018-004-4065-4. [DOI] [PMC free article] [PubMed] [Google Scholar]
- Wang R, Huang ZY, Dong K. Molecular characterization of an arachnid sodium channel gene from the varroa mite (Varroa destructor) Insect Biochem Mol Biol. 2003;33:733–739. doi: 10.1016/s0965-1748(03)00068-7. [DOI] [PubMed] [Google Scholar]
- Wood JN. Future directions in sodium channel research. In: Parnham MJ, Coward K, Baker MD, editors. Sodium channels, pain, and analgesia. Basel: Birkhäuser; 2005. pp. 181–193. [Google Scholar]
- Zakon HH, Lu Y, Zwickl DJ, Hillis DM. Sodium channel genes and the evolution of diversity in communication signals of electric fishes: convergent molecular evolution. Proc Natl Acad Sci U S A. 2006;103:3675–3680. doi: 10.1073/pnas.0600160103. [DOI] [PMC free article] [PubMed] [Google Scholar]
- Zhang H, Kolibal S, Vanderkooi JM, Cohen SA, Kallen RG. A carboxy-terminal alpha-helical segment in the rat skeletal muscle voltage-dependent Na+ channel is responsible for its interaction with the amino-terminus. Biochim Biophys Acta. 1467;406:418. doi: 10.1016/s0005-2736(00)00238-8. [DOI] [PubMed] [Google Scholar]