

Abstract
This study sought to identify the gene expression patterns of porcine bone marrow-derived MSC in response to hypoxia and investigate novel specific hypoxic targets that may have a role in determining MSC proliferation/survival and differentiation. MSC from fifteen animals were incubated in 1% oxygen and 8% carbon dioxide for 6, 12 and 24 hours. RNA samples were isolated and assayed with Affymetrix porcine arrays and quantitative reverse transcription PCR. Significant gene expression levels among the four groups of normoxia, 6-, 12- and 24-hours hypoxia were identified. The pattern in the 12-hours hypoxia group was similar to that of 24-hours. Of 23,924 probes, 377 and 210 genes were regulated in the 6- and 24-hours hypoxia groups, respectively. Functional classification of the hypoxic regulated genes was mainly clustered in cell proliferation and response to stress. However, the major upregulated genes in the 6-hours group were activated in cell cycle phases; the genes in the 24-hours hypoxia were evenly separated into cell differentiation, apoptosis and cellular metabolic processes. Twenty-eight genes were upregulated in all hypoxia groups; these genes are considered as hypoxic targets. Our results identified a genome-wide hypoxia induced gene expression pattern in porcine MSC. This study provides a global view of molecular events in the cells during exposure to hypoxia and revealed a set of novel candidate hypoxic targets.
Keywords: Swine gene expression, hypoxia, porcine bone marrow stem cell, mesenchymal stem cell, fibroblast cell
Introduction
Mesenchymal stem cells (MSC) are self-renewing and multipotent cells capable of differentiating into multiple cell types, osteocytes, adipocytes, myocytes, and endothelial progenitor cells (1, 2). Adult human MSC can be isolated from bone marrow, adipose tissue, umbilical cord blood, lung and liver (3-5). Recent studies have shown that after myocardial infarction, limited tissue regeneration can be achieved through the differentiation of resident cardiac stem cells or circulating progenitor cells mobilized from bone marrow (6, 7). Several researchers have shown that bone marrow derived MSC (BM-MSC) enhance endothelial progenitor cell regeneration in ischemic or hypoxic conditions (8, 9). Additional studies reported that autologous MSC are able to improve cardiac function in swine and rat infarction models (10, 11). Despite these recent discoveries, molecular mechanisms that govern MSC self-renewal, expansion, migration and multilineage differentiation in ischemic or hypoxic conditions are not well understood.
Analysis of a genome-wide expression profiling has been used in the assessment of cancer progression, prediction of diagnostic biomarkers and evaluation of outcomes of gene therapy (12, 13). The hypoxia induced gene expression profiles of human, mouse and rat BM-MSC have been demonstrated based on each different experimental setting (14, 15). We hypothesize that the gene expression profile in BM-MSC under hypoxic conditions provides a dynamic picture of ongoing molecular activities in the cells as they adapt to the microenvironment. Elucidating this genomic response may guide us to a better understanding of molecular mechanisms of the cells' response to hypoxia and aid the detection of novel hypoxic targets for further study. Swine have been used as an excellent preclinical large animal research model for wound repair, reproductive diseases, cancer, diabetes, and cardiovascular diseases studies (16-18). In genomic basis terms, pigs are analogous to humans. GeneChip® Porcine Genome Array is a valuable tool for investigating gene expression pattern in porcine animal model. Nevertheless, its application has been limited by the lack of genomic information in pig gene resources. (http://www.ncbi.nlm.nih.gov/projects/genome/guide/pig/).
In this study, we focused on the molecular changes that lead to injury or adaptation to hypoxic stress using porcine bone marrow derived stem cells as in vitro mode system. Our goals are to establish a comprehensive profiling of swine hypoxic transcripts and to discover new hypoxic targets that may determine stem cell survival and differentiation. To achieve these aims, we conducted a porcine BM-MSC microarray based on expression profilings at various time points following exposure to hypoxia. This was in order to catch a dynamic biological process of cellular adaptation to a low oxygen microenvironment. We present a wide-range of assessments of gene expression patterns in adult porcine BM-MSC in response to hypoxia, along with an investigation of specific hypoxic targets that may be involved with the processes of repairing ischemic cells or tissues. To better understand swine hypoxia modulated targets, we completed a number of the hypoxia induced porcine transcripts' genomic information utilizing human genomic information. The data was also compared with the hypoxic genes expression patterns in non-stem cells from the same species, swine aorta-derived fibroblast cells (aFBC) by qRT-PCR in order to further understand the molecular activities within MSC or fibroblast when they respond to low oxygen stress.
Material and Methods
Swine bone marrow derived mesenchymal stem cell isolation
Animal application and procedures were approved by the Animal Care and Use Committee of the National Heart, Lung and Blood Institute, and the investigation conformed to the Guide for the Care and Use of Laboratory Animals (National Academy Press, 1996, Washington, DC). Bone marrow aspirates were collected from 15 Yorkshire domestic pigs (Age: 81 ± 10 days; Female: 13, male: 2). The bone marrow mononuclear cells were separated from red blood cells and granulocytes by a modified protocol using Lymphocyte Separation Medium (Mediatech Inc., Manassas, VA). The mononuclear cells were divided into two populations and resuspended either in Endothelial Growth Media-2 (EGM-2) (Lonza, Allendale, NJ) with 5% FBS (fetal bovine serum) or Dubellco's Modified Eagle Medium (DMEM) (Invitrogen) with 10% FBS, then transferred into two non-coated T-75 cell culture flasks and placed in a 37°C and 5% CO2 humidified cell culture incubator for MSC adhesion and expansion. Three days later, the non-adherent cells were collected and transferred into a fresh cell culture flask and the adherent cells were left in the cell culture flasks for expansion and passage. The cultured BM-MSC were characterized by FACS for cell surface markers, adipogenesis and osteogenesis assays for multi-potent differentiation lineages (19).
Primary swine aorta-derived fibroblasts isolation
Under sterile conditions, the healthy adult swine thoracic aorta was dissected, rinsed in serum-free DMEM supplemented with 1X PenStrep. After trim-off the adventitial tissues, the aorta was then incubated with 0.25% trypsin for 20 minutes at 37°C. The aortic endothelium were then flushed with serum-free DMEM, the yielding cells were collected, washed two times with serum-free medium, centrifuged and cultured in E GM2 (containing FGF and three other growth factors) with 5% FBS in a 37°C and 5% CO2 humidified cell culture for 3 days. After 3 passages, when the cells were uniformed with typical spindle-shaped fibroblast morphologies, they were replaced with DMEM/10% FBS for two more passages. Then the cells were characterized through immunocytochemistry and FACS after the two passages with DMEM (Sup. Fig.1).
Exposure to hypoxia
The BM-MSC were seeded at a density of 2×10⁵ cells/well in a 6-well plate and cultured in normal conditions overnight. The cells were then placed with 1mL of fresh cell culture medium (DMEM or EGM2) and either incubated in a monitored hypoxic chamber at 37°C, 1% O2 and 8 % CO2 (BioSpherix, Redfield, New York) for 6, 12, 24 and 48 hours for the hypoxia groups (6hr H, 12hr H, 24hr and 48hr H) or cultured under normal condition as the normoxia control group (N). The aFBC were seeded into 6-well plates with fresh medium under normoxic condition for overnight. Then, the cells with 1ml fresh medium were placed into either the hypoxic chamber (hypoxia) or the normal cell culture incubator (normoxia as the control group) for 6, 24 and 48 hours.
RNA preparation and porcine genome array
A total of 72 RNA samples from 15 swine BN-MSC and 3 swine aFBC were isolated using RNeasy kit (Qiagen, Valencia CA). Twenty MSC RNA samples of 5Ns and 15Hs (5 samples in each time point: 6hr H, 12hr H and 24hr H) were hybridized to a porcine cDNA microarray (GeneChip® Porcine Genome Affymetix, Santa Clara, CA), which contains 23,937 probe sets representing 20,201 genes in a pig. An additional 40 MSC RNAs and 12 aFBC RNAs from 13 pigs were prepared for data confirmation using quantitative RT-PCR (qRT-PCR).
Data normalization and pattern recognition
RAM normalization of signal intensities from each hybridized array was conducted using the GenespringGX9.0 software package (Agilent Technologies, Foster City, CA). Within normalized log ratios of gene expression levels, we first identified genes with significant differential expression with normoxia (baseline control) and three hypoxic groups using Significance Analysis of Microarray (SAM, Stanford University, CA) and Prediction Analysis of Microarray (PAM)(20) in R package and Analysis of Variance ANOVA in GenespringGX9.0 package. Differentially expressed genes were determined based on a minimum of two fold change, the false discovery rate (FDR < 0.1) via permutations of repeated measurements in SAM (21) and false negative rate (p-value < 0.05) according to ANOVA.
Homologous search and functional classification of the significant modulated genes were analyzed via NCBI Pig Genomic Resources (http://www.ncbi.nlm.nih.gov/projects/genome/guide/pig/), GeneBank, Affymetix database and DAVID Bioinformatics Resources 2008 (http://david.abcc.ncifcrf.gov/home.jsp).
qRT-PCR
Template cDNAs were synthesized from 500ng of total RNA using SuperScripttm III kit (Invitrogen Life Technologies, Carlsbad, CA) and random hexamers. The cDNA template was mixed with PCR reaction, containing 100nM of both forward and reverse primers, Universal PCR master mix with SYBR Green 1 (QuantiTect™ SYBR Green RT-PCR Kit, QIAGEN Inc, Valencia, CA). PCR amplification was performed on a multicolor Real-time PCR detection system (IQ™ 5, Bio-Rad Lab. Inc. Hercules, CA) as follows: 10 min of initial denaturation at 95°C followed by 45 cycles of 15 sec. of denaturation at 95°C and 1 min of annealing/extension at 60°C.
Each sample was analyzed in duplicates. Three RT-PCR reactions were performed for the examination of each signal gene. For normalization, the average of the expression level of two house-keeper genes, swine Beta-actin (β-actin) and beta 2 microglobulin (β2M), were used. Analysis of relative quantification was performed as previously described (12). The sequences of primers are listed in supplemental Table.
Results
Identification of gene expression profile in MSC
Using the gene expression pattern as a guide, we first searched the samples from both normoxic and hypoxic conditions for differential patterns and relationships among those patterns using GeneSprinGX9.0 and PAM software. The results of both analyses showed that all samples were gathered into two major groups; normoxia and hypoxia. 10× cross-validation probabilities for each given sample were found by PAM, which indicated that all five samples in N (normoxia) group were clearly distinct from any of the other three hypoxic groups (Figure 1. A). As shown in Figure 1, the distinct expression patterns of the 6hr H and 24hr H were also identified. The samples in the 12hr H however, were somewhat less distinct and more like either in the 24hr H or 6hr H, with the majority being similar to the 24hr H group.
Figure 1. Overview the gene expression pattern in the cells during exposure in hypoxic condition.
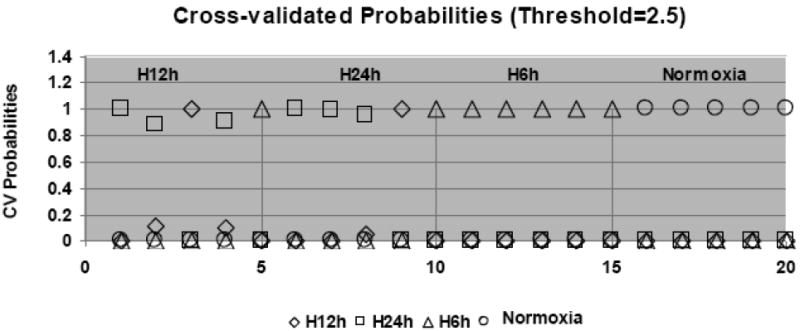
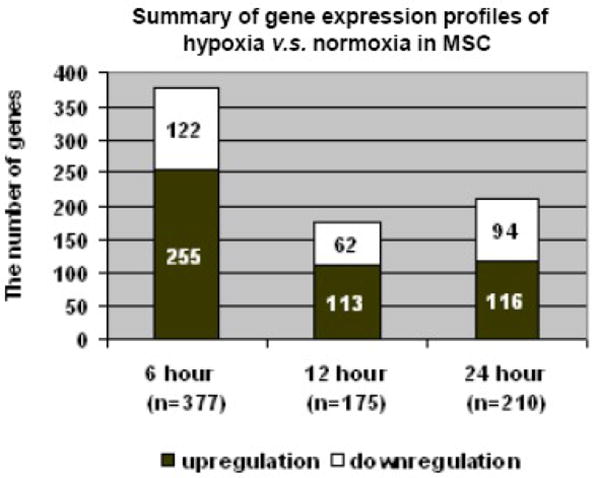
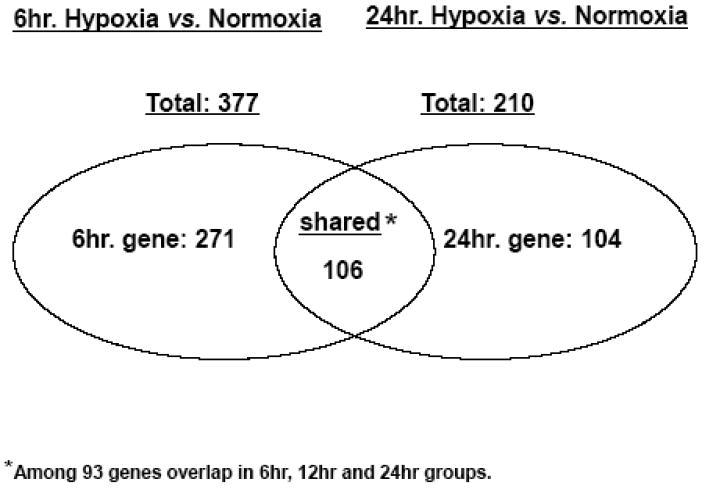
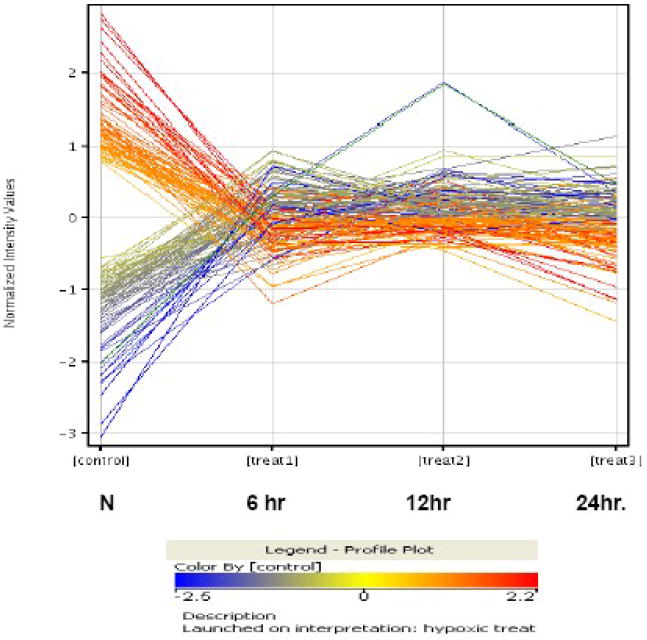
(A). The summary of PAM, showing 10x cross-validation probabilities for each given sample. Each sample's classification is marked by the symbols explained in the key at the bottom of the graph. All the samples of the 6hr hypoxic and normoxia are classified correctly; however, 4 and 2 of 12hr and 24hr hypoxia are misclassified, respectively. (B). The bar graph illustrates the features of the up- or down- regulated genes in three hypoxic groups. Comparing to normoxia, the upregulated genes in the 6hr hypoxia are almost two times greater than the downregulated genes. However, the numbers of upregulated genes in 24hr hypoxia are close to the number of down-regulated genes. (C). A paired analysis of significant gene expression in the 6hr H vs. N and 24hr H vs. N. The left Venn diagram represents the total number of genes that were significantly differentially expressed between the 6hr hypoxia, whereas the right Venn diagram represent the total number of genes significantly differentially expressed between 24hr hypoxia and normoxia. (D). A profile plot that summarized an analysis from GenespringGX9.0 displayed a dynamic gene regulation profile in cells during exposure in hypoxia in different time point. All hypoxia groups compared to the normoxia, each line represents one gene. The red color signifies the gene was highly expression in normoxia and lower expression in hypoxic samples and blue denote a lower expressed genes in control but higher in hypoxic groups.
Identification of differentially regulated genes in hypoxic group
To identify significant differentially regulated hypoxic targets, multiple microarray analyses were performed. The normoxic (N) group, as baseline control, was compared with each hypoxic (H) group. The significant differentially expressed genes among N; 6, 12 and 24hr H groups were identified concurrently by ANOVA at p ≤ 0.05 (GeneSpringGX9.0) and SAM (FDR < 0.1, Fold-change ≥ 2). Of the 20,201 genes analyzed, 377 genes were rapidly regulated in the 6hr H group compared to the N group. Only 182 genes were differentially expressed in the 12hr H group compared with N group. 81% (148/181) of the genes appeared as a similar regulation pattern either in the 6 or 24hr H groups, indicating that there is no specific transcriptional expressional pattern in this 12hr H group. This outcome further confirmed the finding in another analysis of sample classification by PAM. According to this data set, the observations suggest that there was no specific gene expression profile in 12hr H. Therefore, we selected 6 and 24hr H time points for further analysis.
Two hundred and eleven genes were significantly up- or down-regulated in 24hr H (Figure 1 B). As seen, 70% (266/377) of the regulated genes were over-expressed in 6hr H, and roughly equal numbers of up-and down-regulated genes were over-expressed in 24hr H. One hundred and six genes shared a similar expression pattern in the 6 and 24hr Hs; among those, 93 genes overlapped in the 6, 12 and 24hr Hs (Figure 1, C and D). Notably, these 93 genes were the most differentially modulated in all three hypoxic groups.
Fifty-three of the 106 in-common porcine transcribed loci are highly similar to matched human transcripts with their protein similarity of over 80 percent. Among the 53 genes, VEGFA, PDGFA, SOX9, BNIP3, HES1, JUN, IGF1 and PLAGL1 have been known to be hypoxic targets and play important roles in low oxygen or ischemia induced angiogenesis signaling, cell proliferation, survival and apoptosis pathways (8, 9, 22-25) (Table 1).
Table 1. The list of significantly differential expressed genes in the 6 hour and 24 hour hypoxia.
Listing of genes that were over 2-fold differentially expressed in hypoxia and normoxia, and over 90% protein similarity to human.
| Unigene (pig) | Unigene (human) | Gene symbol | Gene Name | %* | Fold change** | |
|---|---|---|---|---|---|---|
|
| ||||||
| 6hr | 24hr | |||||
| Ssc.4984 | Hs.483444 | CXCL14 | chemokine (C-X-C motif) ligand 14 | 98 | 9.53 | 4.32 |
| Ssc.30876 | Hs.660435 | PRDM5 | PR domain containing 5 | 97 | 6.55 | 5.12 |
| Ssc.21920 | Hs.631760 | DHRS13 | dehydrogenase-reductase (SDR family) member 13 | 92 | 4.70 | 2.90 |
| Ssc.56741 | Hs.250666 | HES1 | hairy and enhancer of split 1, (Drosophila) | 100 | 4.11 | 2.44 |
| Ssc.9075 | Hs.525704 | C-JUN | C-JUN protein (jun oncogene) | 95 | 3.92 | 3.64 |
| Ssc.6391 | Hs.473721 | SLC2A1 | solute carrier family 2 (facilitated glucose transporter) member 1 | 99 | 3.73 | 2.07 |
| Ssc.9399 | Hs.592304 | ERO1L | ERO1-like | 98 | 3.37 | 2.58 |
| Ssc.20177 | Hs.502511 | SPI1 | spleen focus forming virus (SFFV) proviral integration oncogene spi1 | 98 | 3.01 | 4.01 |
| Ssc.1674 | Hs.655169 | SLC2A3 | solute carrier family 2 (facilitated glucose transporter), member 3 | 90 | 3.00 | 3.33 |
| Ssc.26417 | Hs.502876 | RHOB | Ras homolog gene family member B | 100 | 2.76 | 2.05 |
| Ssc.16443 | Hs.144873 | BNIP3 | BCL2/adenovirus E1B 19kDa interacting protein 3 | 90 | 2.74 | 2.28 |
| Ssc.19163 | Hs.501023 | MAXI1 | MAX interactor 1 | 98 | 2.73 | 2.85 |
| Ssc.9781 | Hs.414795 | SERPINE1 | serpin peptidase inhibitor, clade E (nexin, plasminogen activator inhibitor type 1), member 1 | 91 | 2.70 | 2.03 |
| Ssc.55343 | Hs.149098 | SMTN | smoothelin | 97 | 2.63 | 2.16 |
| Ssc.4538 | Hs.25338 | PRSS23 | protease serine 23 | 97 | 2.56 | 3.46 |
| Ssc.54191 | Hs.277035 | MGLL | monoglyceride lipase | 91 | 2.56 | 3.28 |
| Ssc.6382 | Hs.458513 | PPP1R3B | protein phosphatase 1, regulatory (inhibitor) subunit 3B | 91 | 2.43 | 2.27 |
| Ssc.55173 | Hs.535898 | PDGFA | platelet-derived growth factor alpha polypeptide | 90 | 2.42 | 2.16 |
| Ssc.56186 | Hs.593339 | HMGB1 | high-mobility group box 1 | 100 | 2.40 | 2.41 |
| Ssc.20115 | Hs.655280 | DDB2 | damage-specific DNA binding protein 2 48kDa | 91 | 2.23 | 2.11 |
| Ssc.5157 | Hs.635508 | FXYD6 | FXYD domain containing ion transport regulator 6 | 95 | 2.22 | 4.25 |
| Ssc.50004 | Hs.50382 | TJP2 | tight junction protein 2 (zona occludens 2) | 92 | 2.21 | 2.28 |
| Ssc.16373 | Hs.707993 | SOX9 | SRY (sex determining region Y)-box 9 | 98 | 2.20 | 2.32 |
| Ssc.9380 | Hs.110571 | GADD45B | growth arrest and DNA-damage-inducible beta | 99 | 2.20 | 2.21 |
| Ssc.24770 | Hs.444975 | PLAGL1 | pleiomorphic adenoma gene-like 1 | 95 | 2.16 | 2.04 |
| Ssc.57541 | Hs.73793 | VEGFA | vascular endothelial growth factor | 95 | 2.09 | 2.30 |
| Ssc.57662 | Hs.466937 | PPP1R13L | protein phosphatase 1 regulatory (inhibitor) subunit 13 like | 93 | 2.07 | 2.07 |
| Ssc.36928 | Hs.464071 | PGD | phosphogluconate dehydrogenase | 94 | 0.50 | 0.33 |
| Ssc.53998 | Hs.590876 | TBC1D10 | TBC1 domain family, member 20 | 100 | 0.49 | 0.50 |
| Ssc.3921 | Hs.468410 | EPAS1 | endothelial PAS domain protein 1 | 94 | 0.48 | 0.42 |
| Ssc.13553 | Hs.657795 | GNA14 | guanine nucleotide binding protein (G protein), alpha 14 | 99 | 0.48 | 0.49 |
| Ssc.32207 | Hs.19904 | CTH | cystathionase (cystathionine gamma-lyase) | 90 | 0.44 | 0.42 |
| Ssc.24968 | Hs.271695 | NOB1 | NIN1/RPN12 binding protein 1 homolog (S. cerevisiae) | 95 | 0.43 | 0.47 |
| Ssc.25164 | Hs.298654 | DUSP6 | dual specificity phosphatase 6 | 100 | 0.41 | 0.43 |
| Ssc.19398 | Hs.603111 | RND2 | Rho family GTPase 2 | 99 | 0.40 | 0.38 |
| Ssc.3476 | Hs.495728 | PIR | pirin (iron-binding nuclear protein) | 94 | 0.39 | 0.31 |
| Ssc.26696 | Hs.128055 | OSGIN1 | oxidative stress induced growth inhibitor 1 | 91 | 0.39 | 0.36 |
| Ssc.23488 | Hs.271510 | GSR | glutathione reductase | 98 | 0.38 | 0.34 |
| Ssc.40123 | Hs.659346 | CPXM1 | carboxypeptidase X (M14 family), member 1 | 90 | 0.36 | 0.30 |
| Ssc.16231 | Hs.160562 | IGF1 | insulin-like growth, factor | 98 | 0.32 | 0.20 |
| Ssc.5776 | Hs.524741 | ARPC3 | actin related protein 2/3 complex subunit 3 21kDa | 100 | 0.32 | 0.42 |
| Ssc.15970 | Hs.248122 | MCHR17 | melanin-concentrating hormone receptor 1 | 98 | 0.31 | 0.28 |
| Ssc.6928 | Hs.76392 | ALDH1A1 | aldehyde dehydrogenase 1 family member A1 | 95 | 0.27 | 0.27 |
| Ssc.54099 | Hs.522891 | CXCL12 | chemokine (C-X-C motif) ligand 12 (stromal cell-derived factor 1) | 95 | 0.26 | 0.22 |
| Ssc.57526 | Hs.708065 | TXNRD1 | thioredoxin reductase 1 | 94 | 0.24 | 0.23 |
| Ssc.8789 | Hs.355284 | SRXN1 | sulfiredoxin 1 homolog (S. cerevisiae) | 99 | 0.24 | 0.19 |
% of protein squence similarity in porcine and human,;
fold chang rate in hypoxia to normaxia
By analyzing the gene expression profile, we reconstructed two main phases of cellular response to hypoxia; rapid response (6hr H) and adaptive response (24hr H). We also obtained a set of 106 genes that were modulated consistently under hypoxic conditions. The discovery of these gene sets is an incentive for advanced functional annotation in gene ontology (GO). Additionally, novel unknown genes may be discovered to play important roles in the cellular response to hypoxia.
Functional classification and pathway search
To obtain the distinctive biological functional uniqueness of the modulated genes in the 6 and 24hr H groups; 223 and 113 significant modulated transcripts in the 6 and 24hr H groups were analyzed, respectively. The porcine transcribed loci (Ssc.) with high protein similarities to human (over 80%) were annotated via DAVID and GeneGo for their biological processes in signaling pathways. The analyzed functional classifications are briefly summarized in Table 2 and Figure 2. As shown, the most enhanced cellular pathway in the 6hr H group was cell cycle (KEGG term 04110). Twenty genes, GADD45β (growth arrest and DNA-damage-inducible β), PCNA, CDK1-2, Cyclin A, B and E, MCM 2-5 and 7(Mini-chromosome maintenance), CDC20, PLK1, ESP1 and BUBR1 were all over-expressed throughout all cell cycle phases. However, TGFβ2 was down-regulated by itself in G1 to S phase (Fig. 2. B). Five other pathways including p53 signal pathway, nitrogen metabolism, MAPK signaling pathway, focal adhesion and cytokine-cytokine receptor interaction signaling pathways were clustered as top hit pathways in both the 6 and 24hr H groups. In addition, adipocytokine signaling pathway, PPAR signaling pathway and fatty acid metabolism pathway were only classified in the 24hr H genes. The results indicated that the genes in 6hr hypoxia group promote high activities in MSC cell division and proliferation, while enhancing the cells' ability to enter the multi-potency lineage in order to adapt the low oxygen environment. The genes known to be related in these pathways are DDB2, DUSP6, GADD45B, IBSP, PAGFA, PPP1R3B and VEGFA. However, many genes and pathways not yet revealed in the context of hypoxia were also identified.
Table 2. Functional classification of hypoxic genes at the 6hour and 24hour time points.
| Biological process (GO term level 4) |
6 hour (n =167)** | 24 hour (n =82)** | ||||
|---|---|---|---|---|---|---|
|
| ||||||
| count | % | p value | count | % | p value | |
| cell cycle phase | 38 | 22.8 | 1.6E-24 | n/a | n/a | n/a |
| mitosis | 35 | 21.0 | 7.1E-28 | n/a | n/a | n/a |
| negative regulation of cellular process | 28 | 16.8 | 4.5E-04 | 13 | 15.9 | 5.8E-02 |
| cell development | 28 | 16.8 | 1.9E-03 | 13 | 15.9 | 1.0E-01 |
| regulation of cell cycle | 28 | 16.8 | 1.8E-10 | 6 | 7.3 | 2.5E-01 |
| positive regulation of cellular process | 24 | 14.4 | 1.9E-03 | 14 | 17.1 | 1.1E-02 |
| programmed cell death | 23 | 13.8 | 2.0E-04 | 11 | 13.4 | 3.0E-02 |
| transcription from RNA polymerase II promoter | 17 | 10.2 | 6.9E-03 | 9 | 11.0 | 6.5E-02 |
| positive regulation of cellular metabolic process | 12 | 7.2 | 1.2E-02 | 7 | 8.5 | 5.1E-02 |
| organ morphogenesis | 11 | 6.6 | 2.9E-02 | 8 | 9.8 | 1.7E-02 |
| positive regulation of transcription | 11 | 6.6 | 6.1E-03 | 6 | 7.3 | 5.9E-02 |
| negative regulation of cellular metabolic process | 10 | 6.0 | 4.5E-02 | 5 | 6.1 | 2.4E-01 |
| blood vessel morphogenesis (angiogenesis) | 7 | 4.2 | 1.5E-02 | 5 | 6.1 | 2.2E-02 |
| nitrogen compound biosynthetic process | 6 | 3.6 | 1.0E-02 | 4 | 4.9 | 8.6E-01 |
| cytoskeleton-dependent intracellular transport | 6 | 3.6 | 2.1E-02 | n/a | n/a | n/a |
| organ development (lung, respiratory, ect.) | n/a | n/a | n/a | 17 | 20.7 | 7.1E-03 |
| cellular homeostasis | n/a | n/a | n/a | 7 | 8.5 | 1.5E-02 |
| regulation of protein metabolic process | n/a | n/a | n/a | 6 | 7.3 | 4.8E-02 |
The number of genes in DAVID database
Figure 2. Pathway analysis.
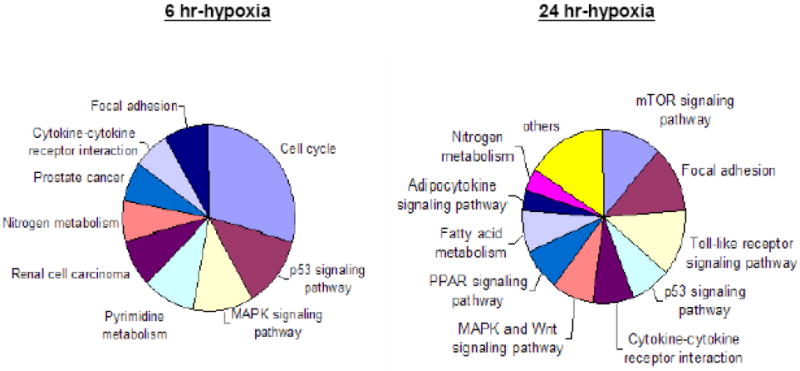
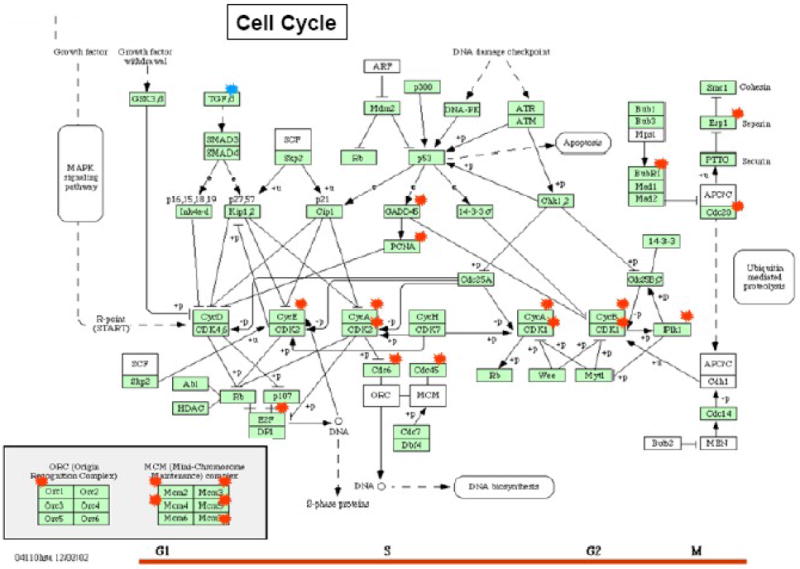
(A). Pie graphs illustrate the proportions of the regulated genes enriched in cell signaling pathway. (B). Illustration of the hypoxia induced genes employed in the cell cycle pathway (KEGG database) The Red and blue symbol represent the genes up- or down-regulated in 6hr H group, respectively.
The top hits of the biological processes at GO level 4 (Gene Ontology term,) in both the 6 and 24hr Hs were summarized in Table 2. As shown, 24 and 13 genes in the 6hr and 24hr H groups, respectively, were enhanced for the function of programmed cell death. Seven genes in the 6hr H and five in 24hr H were associated with blood vessel morphogenesis. Thirty-eight genes in the 6hr H were associated with cell cycle phases, with 35 of the 38 connected to the mitosis phase. Seventeen genes in the 24hr H group were involved in organ development (respiratory development) (EASY score p value <0.001). Adding the results of the pathway analysis and GO together the 6hr H genes were, however, more specific to the mitosis phase of cell division, whereas the 24hr H group genes were more related to cell adhesion regulation of cell morphogenesis, catabolism, and lipid metabolism.
Prediction and validation of novel hypoxic targets
A typical approach for a microarray study is to identify unique differential regulated targets. In order to find the hypoxia induced targets, Prediction Analysis of Microarray (PAM) was performed on each pair of the sample groups with the purpose of cross-validating the identification of differentially expressed genes. Hypoxia and normoxia were segregated into separate groups and then distinguished between the 24hr hypoxia and normoxia at the error rate less then 0.001. Based on these results, 87 transcripts were identified to be differentially expressed in all H vs. N in the prediction analysis but also existed in the significant modulated gene list of SAM and ANOVA's (Table 1. Figure 3). Of these 87 swine transcripts, 47 are homologous genes that are accessible to human and/or pig genome database. The hypoxia enriched genes SOX9, HES1, CXCL14, DDB2, BNIP3, PDGFA, SERPINE1 and IGF1 are not only known to be involved in hypoxia induced biological activities but also reportedly play a role in multi-influenced differentiation in MSC (14, 26-30). Nevertheless, other upregulated genes in this dataset, FXYD6, PRDM5 and PRSS23, were not reported to be modulated by hypoxia.
Figure 3. Hypoxic targets prediction and data validation.
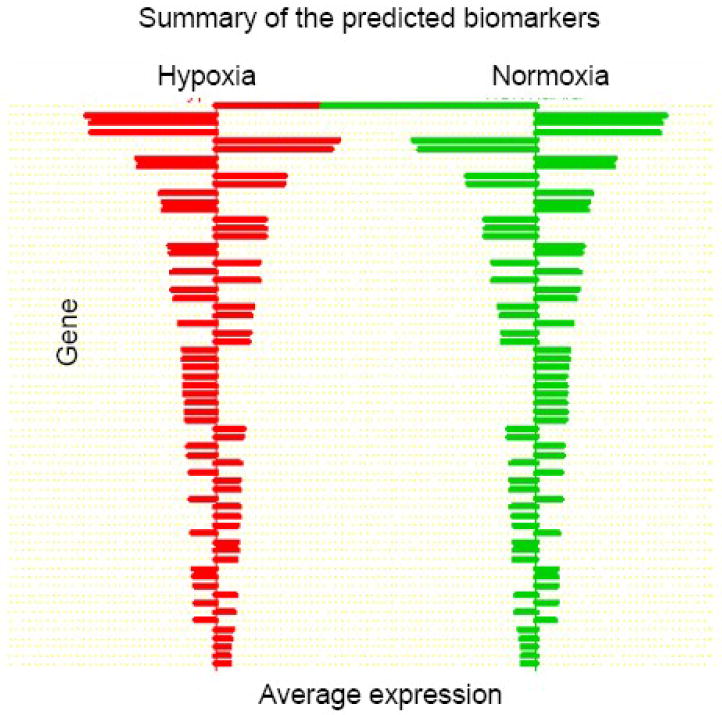
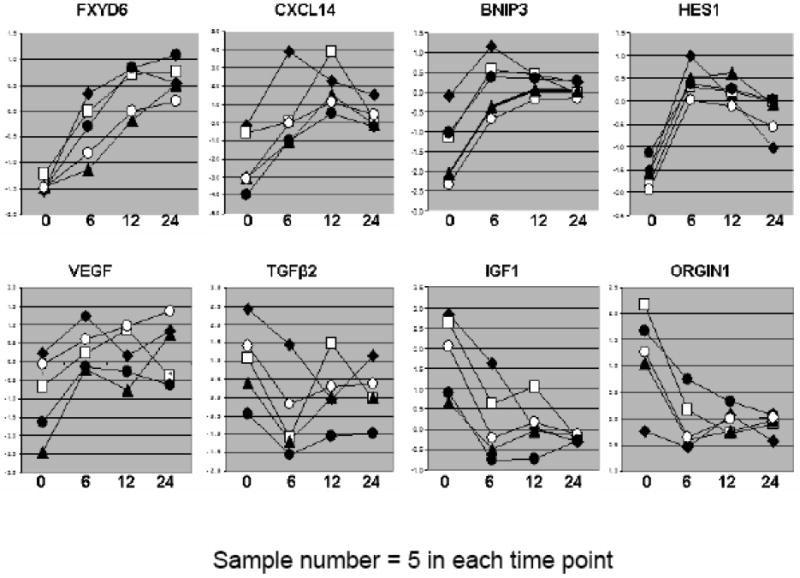
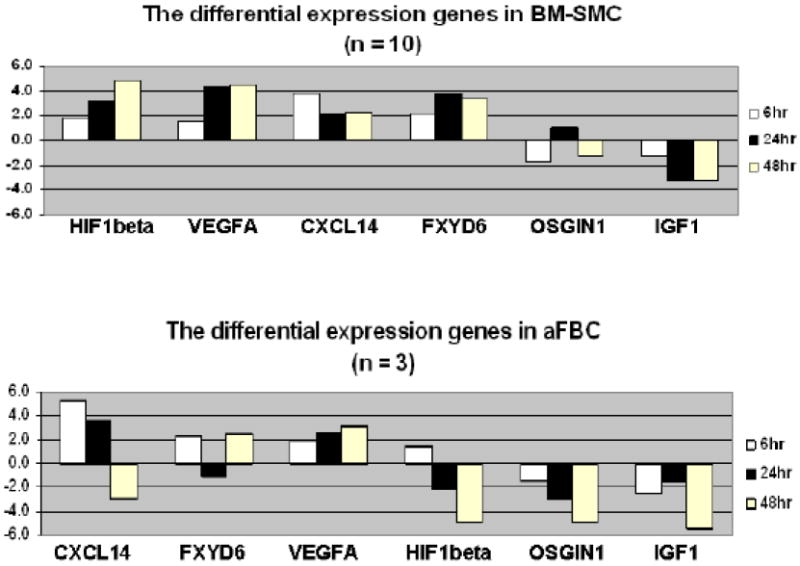
(A). Centroids from comparison between hypoxia and normoxia for biomarker prediction by PAM. Upregulated genes are designated by rightward-extending bars; those that down regulated protrude to lift. (B). Dynamic gene expression in sample by GeneSpring9.0. The y-axis represents gene expression lever and x-axis stands for the time of cell treated with hypoxia. (C). qRT-PCR validation. Six individual genes were tested for the validation of microarray data. The y-axis stands for the relative expression level between hypoxia and normoxia (fold change, hypoxia/normoxia).
Among all the differentially expressed genes identified, we selected several genes that were related to cell proliferation, differentiation and growth factors for microarray data validation by qRT-PCR. Figure 3 shows mRNA significantly differential expression levels in microarray and qRT-PCR. Six genes; ARNT (HIF1β), VEGFA, CXCL14, FXYD6, BNIP3 and HES1 were relatively over-expressed in hypoxic groups. IGF1 and OSG1N1 were all down regulated in the hypoxic MSC groups compared with their corresponding normoxic controls. Similarly, VEGFA, CXCL14, FAXYD6 transcripts were all up regulated in the hypoxic swine aortic fibroblast samples whereas IGF1 and OSGIN1 were down regulated in this group as well. ARNT, the HIF1β (aryl hydrocarbon receptor nuclear translocator) were neither significantly up- nor down-expressed in hypoxic treated aFBC v.s. normoxic cells. However, ARNT expression pattern tended to down-regulate along with the time of cell exposure to hypoxia (Figure 3, C).
Discussion
The purpose of this study was to catch dynamic activities in large-scaled transcripts that were induced by hypoxia (swine BM-MSC during exposure to 1% oxygen and 8% CO2 conditions). As a large animal model, swine have been used for many preclinical trials. As a result, swine models have been invaluable in elucidating general strategies, biological pathways, processes, and for guiding the development of hypotheses to test. Unfortunately, functional genomic information about swine is incomplete, which limits the ability to characterize regulated gene expression profiles. To solve this problem, we manually searched the latest transcript information in a pig genomic resource, using each pig transcript Unigene ID and/or GenBank accession number in accordance with the corresponding human transcript with over 80% protein sequence similarity. As a result, over 50% of the hypoxic genes in our porcine gene dataset matched with the corresponding human genes. These conclusions allowed us to obtain additional information from human genomic resources. In this study, we characterized swine BM-MSC response when exposed to hypoxia at three different time points. We showed that (1) a large number of genes involved in cell development, program cell death and organ morphogenesis were differentially regulated in the three hypoxia groups, (2) the dominant up-regulated genes in 6hr H MSC were involved in cell cycle phase, primarily in the mitosis phase, whereas genes in 24hr H MSC were more involved in organ development; and (3) the MSC response to hypoxia was somewhat similar for all time points, but different between 6hr and 24hr H time points. Our data revealed that overall the changes of gene regulation in 12hr H group are less than that of 6 and 24hr Hs (Fig. 1. D). This finding is similar to previous reports (15, 31).
Twenty-one genes in the 6hr H group were selected; they were involved in cell cycle pathway (KEGG) via pathway analysis. Surprisingly, 20 genes including MCMs, CDCs, Cyclins, GADD45, PCNA, BUB1B, PLK1, ORCIL, ESPL1 and E2F were up-regulated and distributed into all four phases of cell cycle. The Growth arrest-DNA-damage-inducible gene β (GADD45β) is a member of the group of genes that respond to environmental stress by mediating activation of the p38/JNK pathway (32, 33). The protein responsible for proliferating cell nuclear antigen (PCNA) responds to DNA damage, is involved in the RAD6-dependent DNA repair pathway and is likely to be a cancer risk biomarker (34, 35). The one down-regulated gene, TGFβ2, has been reported to be up-regulated in hypoxic conditions and plays a role in cellular proliferation, differentiation, and other functions in various cell types. It has been reported that TGFβ2 is induced by HIFs and is thus over-expressed in human peritoneal fibroblasts and human peritoneal mesothelial cells when exposed to hypoxia (28, 36). Contrarily, the TGFβ2 was found to down-regulate at the 6hr H vs. N group in our data set. TGFβ2 also showed a 1.8-fold down-regulation in both the 12 and 24hr H groups. This disagreement may be due to cDNA sequence variation of swine and human genes. As a result of expression level variation, the cell responds to a low oxygen environment, resulting TGFβ2 to regulate differently in BM-MSC and other cell types. Combining the 21 gene functional specialties together, the cell cycling regulation should be triggered by the stress of cells in hypoxic condition. The numbers of signaling pathways such as MAPK, p53, TGFβ and VEGFA signaling and metabolic pathways were also activated and played a role in hypoxic cell starvation in order to adapt to the changing environment.
MSC have shown pro-angiogenic properties in several in vivo models (1, 37, 38). The biologic process of angiogenesis is activated in the cells that survive hypoxic or ischemic conditions (9, 24, 39). VEGFA is a well known factor that plays an important role in angiogenesis in the face of hypoxia or ischemia. To better understand our data sets and look for new hypoxic targets or angiogenic cofactors, a set of hypoxic regulated genes were mapped on the HIF and VEGFA network (Sup. Figure 2). The proteins of many genes like JUN, FGF1, BCL2, FLT1, PDGFA and SERPINE1 appear in the HIF and VEGFA molecular network. These genes were all up-regulated in this study. However, some genes, IGF and IGF1R, PLAU, and ORIGN1 (oxidative stress induced growth inhibitor 1) were all down-regulated. These genes are well known for their involvement with cell survival regulation after the stress of ultraviolet radiation, inflammation or starvation.
In our study, several genes that have not been reported previously for their involvement in the regulation of cells surviving in hypoxic conditions but consistently appeared in our statistical dataset were discovered. Therefore, we carefully validated and confirmed these genes' expression levels in normoxia and hypoxia using conventional PCR and qRT-PCR. The genes' FXYD domain containing ion transport regulator 6 (FXYD6) (40) and protease serine 23 (PRSS23) were over expressed in the hypoxic conditions of this study, and were located on cellular membrane via gene ontology. These genes may be the novel hypoxic targets of BM-MSC for further study.
Oxygen is crucial to cell survival and function. Different cell types behave differently under hypoxic stress. The stress in cells always interacts with complex of various environmental factors, which contribute in various degrees to the overall stress. However, oxygen shortage induced factors also have some common signals and response pathways in diverse cells and therefore, these factors have the potential to modulate the effects of each other through cross-talking. Furthermore, the cells that survive under hypoxic condition and may partially achieve their functional stages (15, 41-43). Our limited hypoxic aFBC transcriptional data showed that these transcripts, VEGFA, CXCL14, FXYD6, IGF1 and OSIGN1 alteration are comparable in both aFBC and MSC under hypoxic condition. These results indicate that these genes interact similarly with the hypoxic environment in both swine aFBC and MSC. Previous studies have shown that hypoxia can trigger cell cycle pathways and activate serial biological responses, such as stress response, cell injure and damage responses, in many cell types; including fibroblasts and stem cells (15, 41-43). Fibroblasts play a major role in extracellular matrix turnover and involve in vasculogenesis and tissue remodeling under hypoxic condition (44, 45). MSC are multi-lineage cells that are able to differentiate into diverse cell types when exposure to a low oxygen setting. Therefore, the MSC have a wide range of roles in response to hypoxia in cells; such as cell proliferation, angiogenesis, repair and remodeling of the wounded tissues and blood vessels (19).
In summary, our data confirmed and expanded previous observations regarding genes associated with hypoxia in adult swine bone marrow derived mesenchymal stem cells. We obtained hypoxic transcriptional expression patterns at 6 and 24hr time points, which demonstrated molecular events of swine MSC survival in low oxygen conditions. Finally, several new hypoxic targets have been identified for further study that may have clinical ramifications.
Supplementary Material
Supp. Table. The list of primers for quantitative RT- PCR.
Supp. Figure 1. Distinction of swine aortic derived fibroblast cells, aortic endothelial cells and bone-marrow derived stem cells.
Supp. Figure 2. The HIF and VEGF protein network graph that derived from the HiMAP database. It showed the evidence of literature-confirmed interactions within the Human protein reference database and shared reference into function data source (http://www.himap.org/).
Acknowledgments
Thanks to NHLBI Core Facilities for processing microarray hybridization and data normalization; this work was supported by the Division of Intramural Research, National Heart Lung and Blood Institute, National Institutes of Health.
Footnotes
Publisher's Disclaimer: This is a PDF file of an unedited manuscript that has been accepted for publication. As a service to our customers we are providing this early version of the manuscript. The manuscript will undergo copyediting, typesetting, and review of the resulting proof before it is published in its final citable form. Please note that during the production process errors may be discovered which could affect the content, and all legal disclaimers that apply to the journal pertain.
References
- 1.Barry FP. Biology and clinical applications of mesenchymal stem cells. Birth Defects Res C Embryo Today. 2003;69(3):250. doi: 10.1002/bdrc.10021. [DOI] [PubMed] [Google Scholar]
- 2.Bobis S, Jarocha D, Majka M. Mesenchymal stem cells: characteristics and clinical applications. Folia Histochem Cytobiol. 2006;44(4):215. [PubMed] [Google Scholar]
- 3.Festy F, Hoareau L, Bes-Houtmann S, et al. Surface protein expression between human adipose tissue-derived stromal cells and mature adipocytes. Histochem Cell Biol. 2005;124(2):113. doi: 10.1007/s00418-005-0014-z. [DOI] [PubMed] [Google Scholar]
- 4.Jeong JA, Hong SH, Gang EJ, et al. Differential gene expression profiling of human umbilical cord blood-derived mesenchymal stem cells by DNA microarray. Stem Cells. 2005;23(4):584. doi: 10.1634/stemcells.2004-0304. [DOI] [PubMed] [Google Scholar]
- 5.Kermani AJ, Fathi F, Mowla SJ. Characterization and genetic manipulation of human umbilical cord vein mesenchymal stem cells: potential application in cell-based gene therapy. Rejuvenation Res. 2008;11(2):379. doi: 10.1089/rej.2008.0674. [DOI] [PubMed] [Google Scholar]
- 6.Iop L, Chiavegato A, Callegari A, et al. Different cardiovascular potential of adult- and fetal-type mesenchymal stem cells in a rat model of heart cryoinjury. Cell Transplant. 2008;17(6):679. doi: 10.3727/096368908786092739. [DOI] [PubMed] [Google Scholar]
- 7.Yau TM, Kim C, Ng D, et al. Increasing transplanted cell survival with cell-based angiogenic gene therapy. Ann Thorac Surg. 2005;80(5):1779. doi: 10.1016/j.athoracsur.2005.04.079. [DOI] [PubMed] [Google Scholar]
- 8.Belanger AJ, Lu H, Date T, et al. Hypoxia up-regulates expression of peroxisome proliferator-activated receptor gamma angiopoietin-related gene (PGAR) in cardiomyocytes: role of hypoxia inducible factor 1alpha. J Mol Cell Cardiol. 2002;34(7):765. doi: 10.1006/jmcc.2002.2021. [DOI] [PubMed] [Google Scholar]
- 9.Brat DJ, Kaur B, Van Meir EG. Genetic modulation of hypoxia induced gene expression and angiogenesis: relevance to brain tumors. Front Biosci. 2003;8:d100. doi: 10.2741/942. [DOI] [PubMed] [Google Scholar]
- 10.Shake JG, Gruber PJ, Baumgartner WA, et al. Mesenchymal stem cell implantation in a swine myocardial infarct model: engraftment and functional effects. Ann Thorac Surg. 2002;73(6):1919. doi: 10.1016/s0003-4975(02)03517-8. [DOI] [PubMed] [Google Scholar]
- 11.Tang YL. Autologous mesenchymal stem cells for post-ischemic myocardial repair. Methods Mol Med. 2005;112:183. doi: 10.1385/1-59259-879-x:183. [DOI] [PubMed] [Google Scholar]
- 12.Wang S, Zhan M, Yin J, et al. Transcriptional profiling suggests that Barrett's metaplasia is an early intermediate stage in esophageal adenocarcinogenesis. Oncogene. 2006;25(23):3346. doi: 10.1038/sj.onc.1209357. [DOI] [PubMed] [Google Scholar]
- 13.Xu Y, Selaru FM, Yin J, et al. Artificial neural networks and gene filtering distinguish between global gene expression profiles of Barrett's esophagus and esophageal cancer. Cancer Res. 2002;62(12):3493. [PubMed] [Google Scholar]
- 14.Martin-Rendon E, Hale SJ, Ryan D, et al. Transcriptional profiling of human cord blood CD133+ and cultured bone marrow mesenchymal stem cells in response to hypoxia. Stem Cells. 2007;25(4):1003. doi: 10.1634/stemcells.2006-0398. [DOI] [PubMed] [Google Scholar]
- 15.Ohnishi S, Yasuda T, Kitamura S, Nagaya N. Effect of hypoxia on gene expression of bone marrow-derived mesenchymal stem cells and mononuclear cells. Stem Cells. 2007;25(5):1166. doi: 10.1634/stemcells.2006-0347. [DOI] [PubMed] [Google Scholar]
- 16.Eckert MJ, Perry JT, Sohn VY, et al. Bioprosthetic repair of complex duodenal injury in a porcine model. J Trauma. 2009;66(1):103. doi: 10.1097/TA.0b013e318191bdd6. [DOI] [PubMed] [Google Scholar]
- 17.Ben-Yosef R, Paz A, Levy Y, et al. A novel device for protecting rectum during prostate cancer irradiation: in vivo data on a large mammal model. J Urol. 2009;181(3):1401. doi: 10.1016/j.juro.2008.11.010. [DOI] [PubMed] [Google Scholar]
- 18.Zhang H, Song P, Tang Y, et al. Injection of bone marrow mesenchymal stem cells in the borderline area of infarcted myocardium: heart status and cell distribution. J Thorac Cardiovasc Surg. 2007;134(5):1234. doi: 10.1016/j.jtcvs.2007.07.019. [DOI] [PubMed] [Google Scholar]
- 19.Zhou Y, Wang S, Yu Z, et al. Direct injection of autologous mesenchymal stromal cells improves myocardial function. Biochem Biophys Res Commun. 2009 doi: 10.1016/j.bbrc.2009.10.074. [DOI] [PMC free article] [PubMed] [Google Scholar]
- 20.Tibshirani R, Hastie T, Narasimhan B, Chu G. Diagnosis of multiple cancer types by shrunken centroids of gene expression. Proc Natl Acad Sci U S A. 2002;99(10):6567. doi: 10.1073/pnas.082099299. [DOI] [PMC free article] [PubMed] [Google Scholar]
- 21.Tusher VG, Tibshirani R, Chu G. Significance analysis of microarrays applied to the ionizing radiation response. Proc Natl Acad Sci U S A. 2001;98(9):5116. doi: 10.1073/pnas.091062498. [DOI] [PMC free article] [PubMed] [Google Scholar]
- 22.Beitner-Johnson D, Shull GE, Dedman JR, Millhorn DE. Regulation of gene expression by hypoxia: a molecular approach. Respir Physiol. 1997;110(2-3):87. doi: 10.1016/s0034-5687(97)00075-3. [DOI] [PubMed] [Google Scholar]
- 23.Chang MH, Kuo WW, Li PC, et al. Down regulation of IGF-I and IGF-IR gene expression in right atria tissue of ventricular septal defect infants with right atria hypoxemia. Clin Chim Acta. 2007;379(1-2):81. doi: 10.1016/j.cca.2006.12.021. [DOI] [PubMed] [Google Scholar]
- 24.Kenneth NS, Rocha S. Regulation of gene expression by hypoxia. Biochem J. 2008;414(1):19. doi: 10.1042/BJ20081055. [DOI] [PubMed] [Google Scholar]
- 25.Koritzinsky M, Magagnin MG, van den Beucken T, et al. Gene expression during acute and prolonged hypoxia is regulated by distinct mechanisms of translational control. Embo J. 2006;25(5):1114. doi: 10.1038/sj.emboj.7600998. [DOI] [PMC free article] [PubMed] [Google Scholar]
- 26.Bellot G, Garcia-Medina R, Gounon P, et al. Hypoxia-induced autophagy is mediated through hypoxia-inducible factor induction of BNIP3 and BNIP3L via their BH3 domains. Mol Cell Biol. 2009;29(10):2570. doi: 10.1128/MCB.00166-09. [DOI] [PMC free article] [PubMed] [Google Scholar]
- 27.Kanichai M, Ferguson D, Prendergast PJ, Campbell VA. Hypoxia promotes chondrogenesis in rat mesenchymal stem cells: a role for AKT and hypoxia-inducible factor (HIF)-1alpha. J Cell Physiol. 2008;216(3):708. doi: 10.1002/jcp.21446. [DOI] [PubMed] [Google Scholar]
- 28.Saed GM, Collins KL, Diamond MP. Transforming growth factors beta1, beta2 and beta3 and their receptors are differentially expressed in human peritoneal fibroblasts in response to hypoxia. Am J Reprod Immunol. 2002;48(6):387. doi: 10.1034/j.1600-0897.2002.01090.x. [DOI] [PubMed] [Google Scholar]
- 29.Le AD, Zhang Q, Wu Y, et al. Elevated vascular endothelial growth factor in keloids: relevance to tissue fibrosis. Cells Tissues Organs. 2004;176(1-3):87. doi: 10.1159/000075030. [DOI] [PubMed] [Google Scholar]
- 30.Suga H, Eto H, Inoue K, et al. Cellular and molecular features of lipoma tissue: comparison with normal adipose tissue. Br J Dermatol. 2009 doi: 10.1111/j.1365-2133.2009.09272.x. [DOI] [PubMed] [Google Scholar]
- 31.Wu EH, Li HS, Zhao T, et al. Effect of hypoxia on the gene profile of human bone marrow-derived mesenchymal stem cells. Sheng Li Xue Bao. 2007;59(2):227. [PubMed] [Google Scholar]
- 32.Engelmann A, Speidel D, Bornkamm GW, Deppert W, Stocking C. Gadd45 beta is a prosurvival factor associated with stress-resistant tumors. Oncogene. 2008;27(10):1429. doi: 10.1038/sj.onc.1210772. [DOI] [PubMed] [Google Scholar]
- 33.Papa S, Zazzeroni F, Bubici C, et al. Gadd45 beta mediates the NF-kappa B suppression of JNK signalling by targeting MKK7/JNKK2. Nat Cell Biol. 2004;6(2):146. doi: 10.1038/ncb1093. [DOI] [PubMed] [Google Scholar]
- 34.Kimos MC, Wang S, Borkowski A, et al. Esophagin and proliferating cell nuclear antigen (PCNA) are biomarkers of human esophageal neoplastic progression. Int J Cancer. 2004;111(3):415. doi: 10.1002/ijc.20267. [DOI] [PubMed] [Google Scholar]
- 35.Lee BJ, Wang SG, Roh HJ, Goh EK, Chon KM, Park DY. Changes in expression of p53, proliferating cell nuclear antigen and bcl-2 in recurrent laryngeal cancer after radiotherapy. J Laryngol Otol. 2006;120(7):579. doi: 10.1017/S0022215106001150. [DOI] [PubMed] [Google Scholar]
- 36.Zhang H, Akman HO, Smith EL, Zhao J, Murphy-Ullrich JE, Batuman OA. Cellular response to hypoxia involves signaling via Smad proteins. Blood. 2003;101(6):2253. doi: 10.1182/blood-2002-02-0629. [DOI] [PubMed] [Google Scholar]
- 37.Al-Khaldi A, Eliopoulos N, Martineau D, Lejeune L, Lachapelle K, Galipeau J. Postnatal bone marrow stromal cells elicit a potent VEGF-dependent neoangiogenic response in vivo. Gene Ther. 2003;10(8):621. doi: 10.1038/sj.gt.3301934. [DOI] [PubMed] [Google Scholar]
- 38.Arnhold SJ, Goletz I, Klein H, et al. Isolation and characterization of bone marrow-derived equine mesenchymal stem cells. Am J Vet Res. 2007;68(10):1095. doi: 10.2460/ajvr.68.10.1095. [DOI] [PubMed] [Google Scholar]
- 39.Dioum EM, Clarke SL, Ding K, Repa JJ, Garcia JA. HIF-2alpha-haploinsufficient mice have blunted retinal neovascularization due to impaired expression of a proangiogenic gene battery. Invest Ophthalmol Vis Sci. 2008;49(6):2714. doi: 10.1167/iovs.07-1469. [DOI] [PubMed] [Google Scholar]
- 40.Sweadner KJ, Rael E. The FXYD gene family of small ion transport regulators or channels: cDNA sequence, protein signature sequence, and expression. Genomics. 2000;68(1):41. doi: 10.1006/geno.2000.6274. [DOI] [PubMed] [Google Scholar]
- 41.Detmar M, Brown LF, Berse B, et al. Hypoxia regulates the expression of vascular permeability factor/vascular endothelial growth factor (VPF/VEGF) and its receptors in human skin. J Invest Dermatol. 1997;108(3):263. doi: 10.1111/1523-1747.ep12286453. [DOI] [PubMed] [Google Scholar]
- 42.Das M, Dempsey EC, Bouchey D, Reyland ME, Stenmark KR. Chronic hypoxia induces exaggerated growth responses in pulmonary artery adventitial fibroblasts: potential contribution of specific protein kinase c isozymes. Am J Respir Cell Mol Biol. 2000;22(1):15. doi: 10.1165/ajrcmb.22.1.3536. [DOI] [PubMed] [Google Scholar]
- 43.Early SB, Hise K, Han JK, Borish L, Steinke JW. Hypoxia stimulates inflammatory and fibrotic responses from nasal-polyp derived fibroblasts. Laryngoscope. 2007;117(3):511. doi: 10.1097/MLG.0b013e31802e927b. [DOI] [PubMed] [Google Scholar]
- 44.Karakiulakis G, Papakonstantinou E, Aletras AJ, Tamm M, Roth M. Cell type-specific effect of hypoxia and platelet-derived growth factor-BB on extracellular matrix turnover and its consequences for lung remodeling. J Biol Chem. 2007;282(2):908. doi: 10.1074/jbc.M602178200. [DOI] [PubMed] [Google Scholar]
- 45.Kietzmann T, Knabe W, Schmidt-Kastner R. Hypoxia and hypoxia-inducible factor modulated gene expression in brain: involvement in neuroprotection and cell death. Eur Arch Psychiatry Clin Neurosci. 2001;251(4):170. doi: 10.1007/s004060170037. [DOI] [PubMed] [Google Scholar]
Associated Data
This section collects any data citations, data availability statements, or supplementary materials included in this article.
Supplementary Materials
Supp. Table. The list of primers for quantitative RT- PCR.
Supp. Figure 1. Distinction of swine aortic derived fibroblast cells, aortic endothelial cells and bone-marrow derived stem cells.
Supp. Figure 2. The HIF and VEGF protein network graph that derived from the HiMAP database. It showed the evidence of literature-confirmed interactions within the Human protein reference database and shared reference into function data source (http://www.himap.org/).