

Abstract
Sequence specific transcription factors are essential for pattern formation and cell differentiation processes in mammals. The formation of the abdominal wall depends on a flawless merge of several developmental fields in time and space. Absence of Pitx2 leads to open abdominal wall in mice, while mutations in humans result in umbilical defects, suggesting that a single homeobox transcription factor coordinates the formation and patterning of this anatomical structure. Gene expression analysis from abdominal tissue including the abdominal wall after removal of the major organs, of wild type, Pitx2 heterozygote and mutant mice, at embryonic day 10.5, identified 275 genes with altered expression levels. Pitx2 target genes were clustered using the “David Bioinformatics Functional Annotation Tool” web application, which bins genes according to gene ontology (GO) key word enrichment. This provided a way to both narrow the target gene list and to start identifying potential gene families regulated by Pitx2. Target genes in the most enriched bins were further analyzed for the presence and the evolutionary conservation of Pitx2 consensus binding sequence, TAATCY, on the −20kb, intronic and coding gene sequences. Twenty Pitx2 target genes that passed all the above criteria were classified as genes involved in cell transport and growth. Data from these studies suggest that Pitx2 acts as an inhibitor of protein transport and cell apoptosis contributing to the open body wall phenotype. This work provides the framework to which the developmental network leading to abdominal wall syndromes can be built.
Keywords: Pitx2, Homeobox, Development, Gene Expression Analysis, Gene Regulation, Bioinformatics
1. Introduction
The abdominal wall holds in the intestinal organs and provides stability to the trunk. Classic ventral body wall defects are characterized by a thin body wall, muscular dysplasia and/or absence of midline fusion (Brewer and Williams, 2004a). Congenital abdominal wall defects such as gastroschisis or omphalocele, and abdominal injuries can be a challenge to be repaired due to the musculofascial continuity and the complex vascular supply (Chang et al., 1992).
The molecular mechanisms involved in the developmental processes that occur during the formation of the abdominal wall are not well understood. Cells from the definitive endoderm and lateral plate mesoderm migrate to form the abdominal wall. Abdominal level somites extend ventrally and form the abdominal muscles. In the mouse, ventral abdominal wall formation is initiated at embryonic day 9, (E9.0) when the primary ventral body forms, consisting of a thin epithelial peridermal membrane. The secondary body wall begins to form at E12.0 in both the thoracic and abdominal areas, with the primary contributor being cells from the somites (Christ et al., 1983; Ogi et al., 2005). The developing abdomen is composed of mesenchymal connective tissue and somatic-derived muscles which converge to enclose the internal organs (Brewer and Williams, 2004a, b; Suzuki et al., 2009).
Signaling molecules assist communication between cells and initiate the activation of certain sequence specific transcription factors (SSTFs) in the cells that receive the signal. The combination of active SSTFs at a given time and location defines the regulatory state of the cell. The complementary part of the regulatory apparatus is the regulatory genome that is common to all cells. Expression of each gene is controlled by regulatory sequences, the cis-regulatory modules (CRM) that contain clusters of different transcription factor binding sites. A regulatory gene (node) contains numerous CRMs that control its expression in a spatiotemporal manner during development. Signaling molecules and SSTFs form a network that is essential for pattern formation and cell specification. The identification of gene regulatory networks during abdominal wall development will provide a better understanding of how cells from the mesendoderm will differentiate to form the lining of the abdominal wall and the intestinal tissue.
Several SSTFs are involved in the pathogenesis of congenital body wall defects. The homeobox transcription factor Pitx2 regulates body wall formation and muscle specification (Gage et al., 1999; Kitamura et al., 1999; Lin et al., 1999; Lu et al., 1999). Mutations in human Pitx2 contribute to Axenfeld-Rieger syndrome and Omphalocele and VATRE-Like syndrome (Katz et al., 2004), which are characterized by umbilical abnormalities. Pitx2 functions upstream of several growth factor signaling pathways, that regulate cell-type specific proliferation.
In this study we performed a systems biology approach to identify Pitx2 target genes during mouse abdominal wall development. Gene expression data from microarray experiments were integrated with online gene ontology databases and in house CRM prediction scripts. Abdominal wall tissue from Pitx2 mutant, heterozygote and wild type E10.5 mice were prepared for analysis on Mouse Genome 430 2.0 microarrays, with RMA normalized data (Kioussi and Gross, 2008) and analyzed with SAMExcel (Tusher et al., 2001). This resulted in 324 probe sets, representing 275 unique genes that were differentially expressed. Genes were placed into functional bins such as “differentiation”, “migration”, “adhesion”, and “signaling” based on their gene ontology annotations using DAVID Bioinformatics Functional Annotation Tool (Dennis et al., 2003; Huang et al., 2009). This tool bins genes based on the frequency of occurrence of ontology key words between our genes of interest versus the entire database of known genes. The most enriched bin (Bin1), containing 87 genes, was further analyzed for predicted Pitx2 binding sites in the −20kb region. Genes with a minimum of two Pitx2 binding sites conserved in at least 3 and 4 species respectively narrowed the list to 25 genes. Target genes containing a second gene with Pitx2 biding sites in both intronic and/or exonic sequences in this −20kb region were eliminated. This resulted in 20 genes that were further analyzed for conserved Pitx2 sites within the gene itself, which included the coding and intronic sequences. These CRM prediction scripts were used to place Pitx2 and its targets in contact to specific tissues of interest. A predicted network model was constructed by using BioTapestry Version 4 to visually link the Pitx2 with its target genes.
2. Materials and methods
2.1. Mice
The Pitx2+/LacZ mice (Lin et al., 1999) were used. Female mice were checked for the presence of vaginal plug (E0.5). Embryos were isolated at E10.5 and yolk sacs were used for genotyping. Tissue from the abdominal wall from each genotype was isolated by cutting across embryos behind the forelimb and in front of the hindlimb, with removal of the neural tube and obvious internal organs.
2.2. RNA Preparation and Microarray Analysis
Abdominal wall tissue was dissected from E10.5 Pitx2+/+ (Wild Type, WT), Pitx2+/LacZ (Heterozygote, HET) and Pitx2LacZ/LacZ (Homozygote, MUT) mice. Total RNA was prepared using Qiagen RNeasy Mini kit, labeled using Affymetrix one-step labeling, and used to probe the Affymetrix Mouse Genome 430 2.0 array. The raw *.cel files were normalized by RMA using RMAExpress (Bolstad et al., 2003; Kioussi and Gross, 2008). The data sets were further processed with SAMExcel with a delta value of 4 and a minimum fold change of 1.5. The significantly differentially expressed genes were analyzed with DAVID Bioinformatics Functional Annotation Tool (Dennis et al., 2003; Huang et al., 2009). The DAVID Functional Annotation Clustering application provided functional clusters of genes that were individually searched for the Pitx2 binding sites.
2.3. Pitx2 Binding Site Analysis and Biotapestry
For initial screening, genomic sequences with −20kb flanking each gene were downloaded from MGI’s link to the mouse reference genome (NCBI v37, mm9). These were processed with a script, binding_site_search.pl that was generated by our lab to determine the location of Pitx2 binding sites, TAATCY, relative to the start of the gene (Amendt et al., 1998; Wilson et al., 1996). For identifying the evolutionary conservation of these Pitx2 binding sites, the −20kb region of selected genes as defined by the gene entry locations in the UCSC Genome Browser on Mouse July 2007 (NCBI37/mm9) Assembly available at http://genome.ucsc.edu/, was downloaded and formatted for binding_site_compare.pl. The script concatenated the alignments from the UCSC Genome Browser, identified the absolute Pitx2 binding site locations for each gene based on the mouse sequence, and reported the species for which each binding site was conserved within. Cytoscape 2.6.3 was utilized for composing visualizations of gene expression data (Shannon et al., 2003). BioTapestry Version 4 was utilized for composing the predicted gene network in the abdominal wall (Longabaugh et al., 2005).
3. Results and Discussion
3.1. Pitx2 Target Gene Clusters in Abdominal Wall
Gene expression analysis was used to identify Pitx2 target genes during abdominal wall development. Total RNA was prepared from tissue of three biological replicates for WT, HET and MUT embryos. Probed RNAs were applied to nine Mouse Genome 430 2.0 microarrays. Scatter plot comparisons (data not shown) within each of the biological triplicates indicated that one of the three array sets was inconsistent with the other two. Thus, results from the six comparable arrays were normalized by RMA. Array results have been deposited for public access at ArrayExpress under the accession number E-MEXP-2332, (Hilton et al., 2010).
Data represented by 45,101 probes and >39,000 transcripts were processed with SAMExcel (Tusher et al., 2001). Pitx2 target genes were selected based on a Δ of 4 and a minimum fold change of 1.5. These thresholds identified with a 1.5% false discovery rate, 324 statistically significant altered probe sets based on t-tests, representing a total of 275 known unique genes. The DAVID Functional Annotation Clustering tool was applied to the above genes and generated 31 bins that covered 265 of the above unique genes. The first 10 bins, with enrichment scores greater than 2.0, can be seen as an example of DAVID output in Table 1. Selected key terms (GOTERMs) such as signal, cell differentiation, organ development etc, were ranked according to their relative frequency of occurrence in the Pitx2 target genes gene-ontology, as compared to their occurrence in all genes identified in the mouse genome. These classifications helped categorize the types of Pitx2 target genes in the developing abdominal wall. The most enriched cluster contained the GOTERM “signal” and “secreted” (Table 1), which include regulatory genes, signaling molecules and sequence specific transcription factors (SSTF) that represent the regulatory apparatus of the cell.
Table 1.
Functional Annotation Clusters for Pitx2 Target Genes in the Abdominal Wall
| Annotation Bin |
Enrichment Score |
GOTERM | # of Genes |
P-Value | Benjamini corrected P-Value |
Average # Pitx2 Binding Sites |
|---|---|---|---|---|---|---|
| 1 | 7.7 | Signal | 86 | 8.89E-14 | 7.60E-11 | 17.7 |
| Secreted | 33 | 2.00E-12 | 8.70E-10 | |||
| 2 | 6.5 | Developmental Process | 86 | 1.49E-10 | 2.90E-05 | 16.6 |
| Organ Development | 49 | 2.20E-08 | 2.70E-01 | |||
| 3 | 5.3 | Extracellular Matrix | 19 | 7.03E-07 | 9.50E-05 | 16.0 |
| Basement Membrane | 7 | 4.90E-04 | 4.70E-02 | |||
| 4 | 4.8 | Biological Adhesion | 28 | 2.30E-06 | 1.70E-03 | 17.7 |
| Cell Adhesion | 28 | 2.26E-06 | 5.50E-02 | |||
| 5 | 2.4 | Enzyme Regulatory Activity | 23 | 7.00E-04 | 3.20E-01 | 17.1 |
| Protease Inhibitor | 10 | 9.60F-04 | 2.50E-01 | |||
| 6 | 2.3 | Cell Proliferation | 19 | 9.60E-04 | 2.50E-01 | 15.3 |
| Regulator of Cell Proliferation | 15 | 1.20E-03 | 2.90E-01 | |||
| 7 | 2.2 | Embryonic Development | 14 | 1.50E-05 | 8.30E-01 | 14 |
| Appendage Morphogenesis | 6 | 4.8-E-03 | 5.40E-01 | |||
| 8 | 2.18 | Regulation of Biological Quality | 20 | 9.70E-03 | 6.90E-01 | 15.6 |
| Growth | 11 | 8.90E-03 | 6.70E-01 | |||
| 9 | 2.1 | Vitamin Binding | 11 | 2.80E-06 | 2.60E-03 | 19.8 |
| Cofactor Binding | 6 | 1.40E-01 | 1.00E00 | |||
| 10 | 2.04 | Actin Binding | 6 | 9.30E-06 | 1.60E-3 | 12.7 |
| Cytoskeleton | 4 | 1.30E-02 | 6.30E-1 |
Significantly differentially regulated probe sets as identified by SAMExcel were entered into DAVID Functional Annotation Clustering tool. Selected GO terms from the first 10 bins with at minimum of a 2.0 enrichment score. Annotation Bin1 exhibited the most significant P values.
3.2. Evolutionarily conserved Pitx2 Binding Sites
To evaluate the Pitx2 target genes, comparative genome analysis was preformed, which included the identification of Pitx2 binding sites in promoter sequences, coding and intronic regions. Initially, the 20kb region upstream of the transcription codon in the genomic sequences of all 265 Pitx2 target genes from Bin1 to Bin10 were searched for the presence of the TAATCY motif to further confirm regulation by Pitx2. The number of Pitx2 binding sites varied from 6 to 33 per gene (Table 2). If genes were directly regulated, one would expect that bins with the highest enrichment score would have the highest number of potential Pitx2 binding sites. Indeed, a decrease of the average number of sites was observed as the enrichment score was decreased. Indirect regulation through the recruitment of co-factor binding complexes however cannot be dismissed, and would likely account for the non linear correlation of average binding sites and enrichment scores. However, we chose to focus on the direct regulation of genes by Pitx2 interaction with predicted binding sites. Because Bin1 was the most significantly enriched as determined by significant P-values from David bioinformatics tools and contained a greater than average number of Pitx2 binding sites, it was chosen for further analysis of Pitx2 binding site conservation. A Perl script was developed that could take in the alignment output for each gene from the UCSC Genome Browser on Mouse July 2007 (NCBI37/mm9) Assembly, and identify the absolute location of each binding site, along with the species that the site was conserved (Kent et al., 2002).
Table 2.
Pitx2 Signaling Target Genes With Evolutionary Conserved Binding Sites
| Gene | Gene Location |
Site Location | Species | Function | Bibliography |
|---|---|---|---|---|---|
|
Hgf hepatocyte growth factor |
Chr5: 16059368– 16125257 |
16044545 16047737 16050952 16051906 16052042 16052047 16052876 |
M, R, H, O, D, Ho M, R, O, D, Ho M, R, H, O, D, Ho M, R, H, O, D, Ho M, R, Ho M, R, H, O, D, Ho M, R, H, O, D |
Organogenesis placenta, liver, muscles, neurons |
Dietrich et al., 1999; Ebens et al., 1996; Maina et al., 1997; Schmidt et al., 1995; Uehara et al., 1995 |
|
Sulf1 sulfatase 1 |
Chr1: 12708626– 12850453 |
12689935 12690965 12694348 12700950 12703579 12703612 12704923 12705011 |
M, D, Ho M, R, H, O, D, Ho M, H, O M, R, H, O, D M, H, O M, R, H, D, Ho M, R, H, O, D, Ho M, R, H, O, D, Ho |
Adult Muscle Development | Langsdorf et al., 2007 |
|
Ttr transthyretin |
Chr18: 20823914– 20832383 |
20805080 20816233 20816262 20816278 20818368 20819472 20819896 20823753 |
M, R, H M, R, H, O, Ho M, H, O M, R, H, O, Ho M, H, O, D, Ho M, R, Ho M, R, H, O M, R, H, O, D, Ho, C, Op |
Visceral Endoderm Development Nerve Regeneration |
Fleming et al., 2007; Kwon and Hadjantonakis, 2009 |
|
Dkk1 dickkopf homolog 1 |
Chr19: 30620353– 30624155 |
30625758 30629096 30639102 30643643 |
M, D, Ho M, R, H, O, Ho M, R, H, O, D, Ho M, H, O |
Limb Development and Patterning | Verani et al., 2007 |
|
Sema3d semaphorin 3D |
Chr5: 12383556– 12587058 |
12367488 12369334 12370226 12383276 |
M, R, H, O M, R, D, Ho M, H, O, Ho M, R, H, O, Op |
Spinal Motor Neuron Development | Cohen et al., 2005 |
|
Tnc tenascin C |
Chr4: 63620819– 63681759 |
63683738 63689818 63690696 63696163 |
M, H, O, D M, H, O, D, Ho M, H, O, Ho M, H, O, D |
Neuron Axon Guidance Myoblast Fusion, Tendon Formation, Sarcomere Assembly |
El-Karef et al., 2007 |
|
Apcdd1 adenomatosis polyposis coli down- regulated 1 |
Chr18: 63081981– 63112849 |
63062451 63062984 63068603 63075658 |
M, H, O, D, Ho M, H, D M, H, O, D, Op M, H, O |
Bone Development | (Hecht et al., 2007) |
|
Fbln5 Fibulin5 |
Chr12: 102988153– 103057298 |
103058272 103068145 103071053 103075085 |
M, R, H, O, Ho M, R, H M, R, H, O, Ho M, H, O |
Smooth Muscle and Vascular Development |
(Spencer et al., 2005) |
|
Gpc4 glypican 4 |
ChrX: 49406198– 49518429 |
49522591 49530364 49535530 49537545 |
M, D, Ho M, R, H, Ho M, R, Ho M, R, H, O, D |
Cell Growth | Ybot-Gonzalez et al., 2005 |
|
Igfbp2 insulin growth factor binding protein 2 |
Chr1: 72871077– 72899048 |
72852648 72860887 72867615 72870401 |
M, Ho, Op M, O, D, Ho, Op M, H, D, Ho M, H, O |
Cell Growth | Kleffens et al., 1999 |
|
Lamγ1 laminin, gamma 1 |
Chr1: 155066052– 155179916 |
155181670 155184013 155193997 |
M, R, H, O, Ho M, R, H, D M, R, H, O, D, Ho |
Muscle and Vascular Development |
Bader et al., 1998; Tiger and Gullberg, 1997 |
|
Podxl podocalyxin-like |
Chr6: 31469488– 31513981 |
31515298 31521648 31525429 31526653 |
M, H, O, Ho M, R, H, O, Ho M, R, O M, R, Ho |
glycosylation | Maltby et al., 2009 |
|
Alb1 albumin |
Chr5: 90889929– 90905627 |
90873620 90878108 90879959 |
M, R, H, O, H M, D, Ho M, R, H, O, D, Ho |
Serum Transport Carrier Protein |
Jin et al., 2009 |
|
Gsn gelsolin |
Chr2: 35135183– 35163412 |
35124567 35125503 35128519 35132821 |
M, H, O M, R, Ho M, H, O, Ho M, H, O, Ho |
Cell Growth and Apopotosis | Mejillano et al., 2004 |
|
Crim1 cysteine rich transmembrane BMP regulator 1 |
Chr17: 78596408– 78773654 |
78580487 78582857 |
M, R, H, O, D, Ho M, R, H, O |
Vascular Endothelial Development | Wilkinson et al., 2007 |
|
Cxcl12 chemokine ligand 12 |
Chr6: 117118553– 117131385 |
117101734 117102255 |
M, R, H, O, D, Ho, Op M, R, D |
Angiogenesis in Early Development Motor Axon Patterning |
Lieberam et al., 2005 |
|
F3 coagulation factor III |
Chr3: 121426527– 121437960 |
121423171 121424657 |
M, R, H, O, Ho M, H, O |
Vascular Development | Ong et al., 2000 |
|
Fstl1 follistatin-like 1 |
Chr16: 37776959– 37836600 |
37757499 37762158 |
M, R, H, O M, H, O |
Nervous System Mesenchyme Development |
Yang et al., 2009 |
|
Pla2r1 phospholipase A2 receptor 1 |
Chr2: 60255600– 60391365 |
60392795 60400516 |
M, H, O, H M, R, D |
Lipid Metabolism | Hanasaki et al., 1997 |
|
Timp2 tissue inhibitor of metalloproteinase 2 |
Chr11: 118162383– 118217054 |
118224740 118233948 |
M, R, D, Ho M, R, O |
Extracellular Matrix Maintenance | Jaworski et al., 2006 |
M, mouse; R, rat; O, orangutan; D, dog; H, human; Ho, horse; Op, opossum, C, chicken
All Pitx2 target genes with at least 2 Pitx2 biding sites were originally selected based on having one site conserved in 3 species (rat, human, orangutan) and an additional second site conserved in 4 species (rat, human, orangutan, dog), resulting in a total of 25 genes. Within these genes, 5 genes were eliminated because of the existence of another gene within the −20kb sequences. All Pitx2 target genes that passed all the above criteria were summarized in Table 2. The top three genes, Hepatocyte growth factor (Hgf), Sulfatase1 (Sulf1) and Thansthyrenin (Ttr) were characterized by up to eight Pitx2 binding sites conserved in up to eight species, while the majority of the target genes had an average of 2–4 conserved Pitx2 binding sites. Almost all of the Pitx2 target genes had multiple highly conserved Pitx2 binding sites at proximal promoter sequences (Fig 1).
Figure 1. Evolutionary Conserved Pitx2 binding Sites.

Comparative analysis of Pitx2 consensus binding sites in the Pitx2 target genes. Genomic consensus sequences 20kb upstream of the transcriptional start site were mapped against the aligned sequences in the top twenty Pitx2 target genes. Red dots indicate a predicted Pitx2 binding site. Vertical red dots indicate the number of species the motif was found.
Comparative analysis of the predicted Pitx2 genes based on the evolutionary conserved binding sites was further analyzed in the intronic and coding sequences (Fig 1). When Pitx2 target genes were placed in order based on the number of Pitx2 binding sites per gene length, the order did not change significantly, when compared to the order based on the number of Pitx2 binding sites within the promoter sequences. The top and bottom genes remained at their respective locations, with some rearrangements occurring in the middle.
3.3. Function of Pitx2 Target Genes
The order of Pitx2 target genes based on the absolute fold change of the Affymetrix gene expression array data was different than the one based on the number of conserved Pitx2 binding sites (Table 3). However, genes at the low end of Table 2 were also positioned at the end of Table 3 suggesting that genes with <2 fold change harbored less Pitx2 binding sites. This group included the chemokine ligand 12 (Cxcl12), cysteine rich transmembrane BMP regulator 1 (Crim1), follistatin-like 1 (Fstl1), phospholipase A2 receptor 1 (Pla2r1), laminin gamma1 (Lamγ1) and tissue inhibitor of metalloprotease 2 (Timp2). Laminins, a family of adhesive glycoproteins, are involved in cell attachment, differentiation and migration (Timpl et al., 1979). Fstl1, an extracellular glycoprotein with antiproliferative effects, acts as a muscle-derived secreted factor with favorable actions on the heart and vasculature (Oshima et al., 2008). Pla2r1, a transmembrane glycoprotein related protein, is involved in cell proliferation, cell migration, lipid mediator production and smooth muscle contraction (Hanasaki et al., 1997). The majority of the Pitx2 target genes with 1.5–2.0 fold change are glycoprotein type proteins involved in vascular development and maintenance (Hanasaki et al., 1997; Jaworski et al., 2006; Lieberam et al., 2005; Wilkinson et al., 2007; Yang et al., 2009).
Table 3.
Gene Expression Profile of Pitx2 Target Genes
| Gene | WT | HET | MUT | ΔFold |
|---|---|---|---|---|
| Alb | 2533±202 | 2146±48 | 497±58 | −5.1±0.2 |
| F3 | 122±31 | 220±3 | 435±25 | 3.6±0.7 |
| Tnc | 836±76 | 923±48 | 3029±113 | 3.6±0.5 |
| Fbln5 | 247±15 | 395±47 | 785±57 | 3.2±0.0 |
| Ttr | 884±62 | 520±40 | 2750±212 | 3.1±0.0 |
| Hgf | 329±39 | 181±14 | 126±1 | −2.6±0.3 |
| Dkk1 | 87±1 | 85±0 | 224±3 | 2.6±0.0 |
| Gsn | 307±11 | 431±44 | 761±39 | 2.5±0.0 |
| Igfbp2 | 2443±152 | 4593±645 | 5580±180 | 2.3±0.2 |
| Sulf1 | 470±28 | 732±80 | 1034±21 | 2.2±0.1 |
| Podxl | 202±2 | 529±155 | 446±236 | 2.2±1.2 |
| Gpc4 | 741±6 | 1588±11 | 1472±9 | 2.0±0.0 |
| Cxcl12 | 1478±1 | 2509±167 | 811±75 | −1.8±0.2 |
| Apcdd1 | 461±12 | 800±9 | 832±37 | 1.8±0.0 |
| Crim1 | 233±1 | 322±37 | 428±5 | 1.8±0.0 |
| Lamc1 | 691±49 | 819±42 | 1173±28 | 1.7±0.1 |
| Fstl1 | 4861±177 | 5925±34 | 7884±572 | 1.6±0.1 |
| Pla2r1 | 157±5 | 220±8 | 252±1 | 1.6±0.1 |
| Timp2 | 1016±44 | 1321±123 | 1656±65 | 1.6±0.1 |
| Sema3d | 219±7 | 210±19 | 330±6 | 1.5±0.1 |
Pitx2 target genes with a fold change between 2.0 and 2.5 were more in order compared the number of Pitx2 binding sites. The genes of this group glypican (Gpc4), Insulin growth factor binding protein 1 (Igfbp2), podocalyxin-like 1 (Podx1) and gelsolin (Gsn) are involved in cell growth and apoptosis (Kleffens et al., 1999; Maltby et al., 2009; Mejillano et al., 2004; Ybot-Gonzalez et al., 2005). Deletions in the Gpc4 gene, a heparan sulfate proteoglycan, are associated with the gigantism syndrome Simpson-Gobaldi-Behmel (SGBS, OMIM: 312870), (Veugelers et al., 2000). Gpc4 is part of the Wnt/planar cell polarity pathway for convergence and extension during zebrafish gastrulation (LeClair et al., 2009).Gsn promotes apoptotic resistance and epithelia mesenchymal transformation via actin filament remodeling (Silacci et al., 2004). Mutation in Gsn is associated with the Familial Amyloid, Finish type polyneuropathy (FAF, OMIM: 105120), (Levy et al., 1990). These genes are also cell cycle related genes, which is significant as Pitx2 regulates organ development upon binding and activation of cell cycle control genes, such as cyclins (Kioussi et al., 2002). Collectively, the gene expression array data and the bioinformatics analysis of the evolutionary conserved Pitx2 binding sites suggest that Pitx2 binds to CRMs of these genes and inhibits tissue specific cell cycle (Fig. 3).
Figure 3. Predicted Pitx2 Network Model in Abdominal Wall.

BioTapestry was used to create a model of the Pitx2 regulatory network in the abdominal wall. Genes within the nested regions are identified as different gene regulatory components. Red and green links represent repressed and activated interactions from pitx2 as found in this study, while blue links represent interactions identified from literature.
Pitx2 target genes with a fold change >3 were the ones with the highest number of conserved Pitx2 conserved binding sites in coding and non-coding sequences. Hgf, commonly known as scatter factor (SF), is a secreted protein that functions as a mitogen with morphogenetic activities in a variety of epithelial cells (Soriano et al., 1995). Hgf is mediated by the Met tyrosine kinase receptor for paracrine signaling during placenta, liver, muscle and neuron moprhogenesis (Ebens et al., 1996; Maina et al., 1997; Schmidt et al., 1995; Uehara et al., 1995). Hgf mutant mice exhibit impaired migration of the myotome towards the forelimbs (Schmidt et al., 1995). Pitx2 mutant mice exhibit severe muscular malformations in head, abdomen and limbs (Hilton et al., 2010; Shih et al., 2007). Met induces Wnt signaling that activates Pitx2 in several tissues. The strong presence of Pitx2 binding sites suggests that Pitx2 promotes Hgf expression in the migrating myotome to the abdominal wall and limbs. Sulfatases (Sulf1, 2) are essential regulators of cellular heparan sulfate-6-O-sulfation for matrix transmission and reception of GDNF signal from muscle to innervating neurons (Ai et al., 2007). Pitx2 can act as a repressor of Sulf1 expression in the abdominal wall tissue (Table 3), and inhibit the GDNF signaling cascade from muscles to neurons. Sulf1 regulates Wnt signaling by modulating sulfation state of cell surface heparin surface proteoglycans (Lin and Perrimon, 2002). A possible mechanism is that Pitx2 inhibits Sulf1 expression that activates Wnt to stimulate Pitx2 expression (Fig. 3). Transthyrein (Ttr), a transporter of hormones and proteins in the plasma is expressed in the visceral endoderm and degraded in the adult liver, kidney and muscle (Kwon and Hadjantonakis, 2009; Makover et al., 1988). The clinical syndromes associated with TTR aggregation are familial amyloid polyneuropathy (FAP) and cardiomyopathy (FAP), in which mutant TTR protein aggregates in peripheral and autonomic nerves and heart (Saraiva, 2001). Pitx2 is highly expressed in the endoderm derived intestinal tissue, and Pitx2 mutants exhibit hypocellular and severely malformed intestines. Pitx2 might act as a repressor to Ttr and further inhibit the transportation of critical molecules for the intestinal growth and development. The Dikkopf homolog 1 (Dkk1), a secreted extracellular protein acts as inhibitor of the Wnt signaling pathway, with high levels in the abdominal organs. A proposed mechanism is that the Wnt/β-catenin pathway activates Pitx2 (Kioussi et al., 2002), which inhibits Dkk1, which in turn negatively regulates Wnt1. Fibulin (fbln-5) is an elastin-binding protein required for assembly and organization of elastic fibers. Fbln-5 is an inhibitor of vascular smooth muscle cell proliferation and migration (Spencer et al., 2005). Pitx2 can inhibit Fbln-5 and promote indirectly the smooth muscle cell proliferation. Interaction of Pitx2 with its target genes is demonstrated in Fig 2. The strength of Pitx2 interactions with its target genes is demonstrated in Fig 2. Stronger interactions as defined by a high number binding sites or a large fold change are represented as genes positioned closer to the core, while weaker interactions are displayed further away. Targets such as ttr, sulf, and hgf remain close to the core, while targets such as Pla2r1, Tmp2, Cxcl12 and Fstl remain far from the core, when comparing their strength of interaction as defined by binding sites or fold change. Genes in the middle rankings of either method of ordering tend to shift within in the middle regions, with a notable exception being Albumin (Alb).
Figure 2. Pitx2 Target Genes Visualized with Cytoscape.
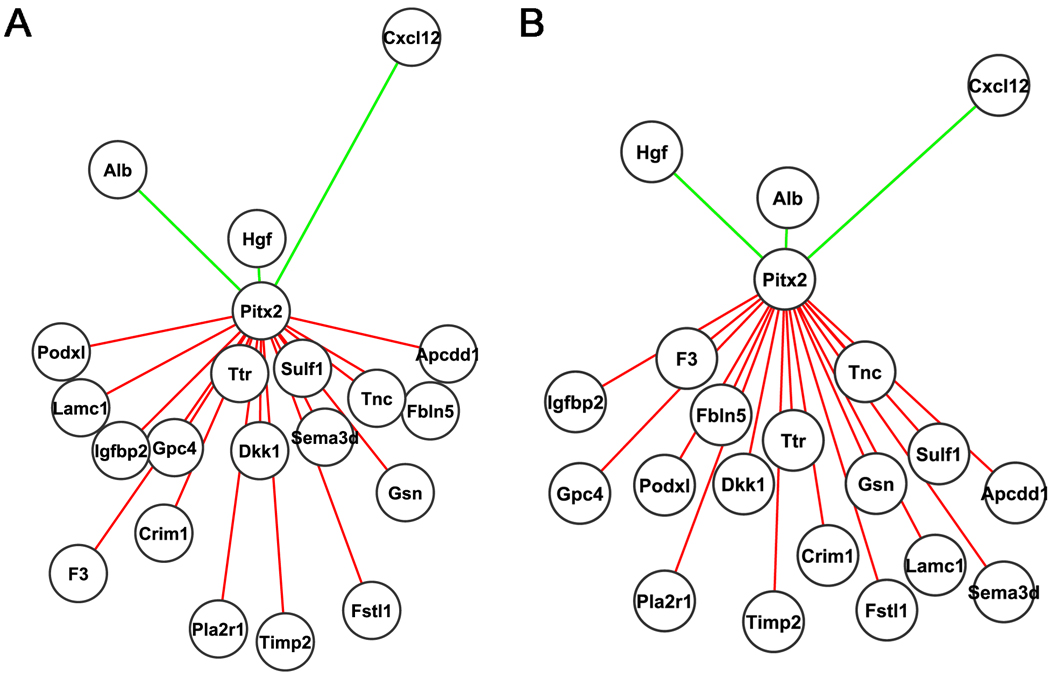
Each circle represents an individual gene with Pitx2 as the core regulator. Red and green lines represent repressed and activated Pitx2 target genes respectively. The length of the lines represents the strength of their relationships. (A) Representation of target gene relations to Pitx2 based on the sum of binding sites and number of species conserved from Table 2. Genes with a greater net number of sites and species are mapped closer to the Pitx2 core. (B) Representation of target gene relations to Pitx2 based on fold change. The greater the fold change the closer the mapping of the gene to Pitx2. It appears that Pitx2 is a general repressor for the majority of our target genes.
The Albumin (Alb) gene exhibited a lower number of conserved binding sites with a higher fold change when compared to the other genes that were selected for analysis. One might explain this discrepancy to the different developmental fields involved in the abdominal wall development. Gene expression analysis was performed in a mixed cell population rather than a specific cell lineage. Another factor might also be the fact the bioinformatics approach is based on direct protein DNA interactions of Pitx2 to its target genes. This is not always the case, as co-regulatory complexes are usually present for the SSTF activation in specific cell lineages. Biological validations should verify the expression profiles of all identified Pitx2 target genes, from which predicted network models as developed in programs such as BioTapestry can be revised. A proposed regulatory network model has been generated based on the network data from these studies and the current literature (Fig 3). This model indicated Pitx2 as a key node for abdominal wall development.
Furthermore, we suggest that Pitx2 regulates cell growth and migration by regulating the expression of genes involved in Wnt trafficking. Twenty percent of the target genes discussed previously in this study have been shown to be involved in the Wnt pathway including Gpc4, HGF, Sulf1, and Dkk1. Pitx2 binding sites might represent CRMs that control gene expression in abdominal wall developmental fields, including skeletal and smooth muscle and endoderm-derived cells. The Pitx2-dependent gene expression can be regulated by modification of the local chromatin due to the presence of coactivator and/or corepressor complexes that have been initiated by Pitx2. Pitx2 occupies cell cycle specific genes, upon Wnt/β-catenin activation, releases the histone deacetylase 1 (HDAC1) and promotes proliferation in muscles (Kioussi et al., 2002). Pitx2 can also occupy and suppress the transcriptional activity of several members of the T-box family in the abdominal wall, by changing the acetylation state of their chromatin (Hilton et al., 2010). Pitx2 may link the Wnt signaling to changes in developmental fields involved in abdominal wall development through the regulation of genes involved in enzymatic activities for transporting information to the cell membrane that can influence cell specification and migration.
4. Conclusion
These studies introduced a systems biology approach to predict the Pitx2 target genes during abdominal wall development. Pitx2 is required for abdominal wall closure and organ formation. We used SAMExcel to analyze microarray data from Pitx2 mutant, heterozygote and wild type mouse embryos to extract significantly altered transcripts. DAVID Functional Annotation Clustering Tool identified genes grouped according to enrichment of reported gene ontology keywords. This provided a lead to investigate the Pitx2 dependent cellular/biological processes in the developing abdominal wall. Our studies suggest that Pitx2 regulates abdominal wall development by regulating the expression of genes encoding for cell surface glycoproteins involved in transporting molecules into the cell, genes involved in enzymatic activities that determine cell specification, and genes involved in cell migration; all which are essential in being able to coordinate the closure of the abdominal wall. This study helps form the transcriptional network for abdominal wall development, placing Pitx2 as an essential node in the developmental circuit. Further biological validations should follow to confirm the predicted network at E10.5, with future studies at later developmental stages to establish the network in a temporal manner.
Acknowledgments
We thank Hsiao-Yen Ma for assisting with animal husbandry, Anne-Marie Girard for microarray processing and Roy Brown for Perl code development. This research was supported by NIH grant AR054406 to CK.
Footnotes
Publisher's Disclaimer: This is a PDF file of an unedited manuscript that has been accepted for publication. As a service to our customers we are providing this early version of the manuscript. The manuscript will undergo copyediting, typesetting, and review of the resulting proof before it is published in its final citable form. Please note that during the production process errors may be discovered which could affect the content, and all legal disclaimers that apply to the journal pertain.
References
- Ai X, Kitazawa T, Do AT, Kusche-Gullberg M, Labosky PA, Emerson CP., Jr SULF1 and SULF2 regulate heparan sulfate-mediated GDNF signaling for esophageal innervation. Development. 2007;134:3327–3338. doi: 10.1242/dev.007674. [DOI] [PubMed] [Google Scholar]
- Amendt BA, Sutherland LB, Semina EV, Russo AF. The molecular basis of Rieger syndrome. Analysis of Pitx2 homeodomain protein activities. J Biol Chem. 1998;273:20066–20072. doi: 10.1074/jbc.273.32.20066. [DOI] [PubMed] [Google Scholar]
- Bader BL, Rayburn H, Crowley D, Hynes RO. Extensive vasculogenesis, angiogenesis, and organogenesis precede lethality in mice lacking all alpha v integrins. Cell. 1998;95:507–519. doi: 10.1016/s0092-8674(00)81618-9. [DOI] [PubMed] [Google Scholar]
- Bolstad BM, Irizarry RA, Astrand M, Speed TP. A comparison of normalization methods for high density oligonucleotide array data based on variance and bias. Bioinformatics. 2003;19:185–193. doi: 10.1093/bioinformatics/19.2.185. [DOI] [PubMed] [Google Scholar]
- Brewer S, Williams T. Finally, a sense of closure? Animal models of human ventral body wall defects. Bioessays. 2004a;26:1307–1321. doi: 10.1002/bies.20137. [DOI] [PubMed] [Google Scholar]
- Brewer S, Williams T. Loss of AP-2alpha impacts multiple aspects of ventral body wall development and closure. Dev Biol. 2004b;267:399–417. doi: 10.1016/j.ydbio.2003.11.021. [DOI] [PubMed] [Google Scholar]
- Chang PY, Yeh ML, Sheu JC, Chen CC. Experience with treatment of gastroschisis and omphalocele. J Formos Med Assoc. 1992;91:447–451. [PubMed] [Google Scholar]
- Christ B, Jacob M, Jacob HJ. On the origin and development of the ventrolateral abdominal muscles in the avian embryo. An experimental and ultrastructural study. Anat Embryol (Berl) 1983;166:87–101. doi: 10.1007/BF00317946. [DOI] [PubMed] [Google Scholar]
- Cohen S, Funkelstein L, Livet J, Rougon G, Henderson CE, Castellani V, Mann F. A semaphorin code defines subpopulations of spinal motor neurons during mouse development. Eur J Neurosci. 2005;21:1767–1776. doi: 10.1111/j.1460-9568.2005.04021.x. [DOI] [PubMed] [Google Scholar]
- Dennis G, Sherman BT, Hosack DA, Yang J, Gao W, Lane HC, Lempicki RA. DAVID: Database for annotation, visualization, and integrated discovery. Genome Biol. 2003:4. [PubMed] [Google Scholar]
- Dietrich S, Abou-Rebyeh F, Brohmann H, Bladt F, Sonnenberg-Riethmacher E, Yamaai T, Lumsden A, Brand-Saberi B, Birchmeier C. The role of SF/HGF and c-Met in the development of skeletal muscle. Development. 1999;126:1621–1629. doi: 10.1242/dev.126.8.1621. [DOI] [PubMed] [Google Scholar]
- Ebens A, Brose K, Leonardo ED, Hanson MG, Jr, Bladt F, Birchmeier C, Barres BA, Tessier-Lavigne M. Hepatocyte growth factor/scatter factor is an axonal chemoattractant and a neurotrophic factor for spinal motor neurons. Neuron. 1996;17:1157–1172. doi: 10.1016/s0896-6273(00)80247-0. [DOI] [PubMed] [Google Scholar]
- El-Karef A, Yoshida T, Gabazza EC, Nishioka T, Inada H, Sakakura T, Imanaka-Yoshida K. Deficiency of tenascin-C attenuates liver fibrosis in immune-mediated chronic hepatitis in mice. J Pathol. 2007;211:86–94. doi: 10.1002/path.2099. [DOI] [PubMed] [Google Scholar]
- Fleming CE, Saraiva MJ, Sousa MM. Transthyretin enhances nerve regeneration. J Neurochem. 2007;103:831–839. doi: 10.1111/j.1471-4159.2007.04828.x. [DOI] [PubMed] [Google Scholar]
- Gage PJ, Suh H, Camper SA. Dosage requirement of Pitx2 for development of multiple organs. Development. 1999;126:4643–4651. doi: 10.1242/dev.126.20.4643. [DOI] [PubMed] [Google Scholar]
- Hanasaki K, Yokota Y, Ishizaki J, Itoh T, Arita H. Resistance to endotoxic shock in phospholipase A2 receptor-deficient mice. J Biol Chem. 1997;272:32792–32797. doi: 10.1074/jbc.272.52.32792. [DOI] [PubMed] [Google Scholar]
- Hecht J, Seitz V, Urban M, Wagner F, Robinson PN, Stiege A, Dieterich C, Kornak U, Wilkening U, Brieske N, et al. Detection of novel skeletogenesis target genes by comprehensive analysis of a Runx2(−/−) mouse model. Gene Expr Patterns. 2007;7:102–112. doi: 10.1016/j.modgep.2006.05.014. [DOI] [PubMed] [Google Scholar]
- Hilton T, Gross MK, Kioussi C. Pitx2-dependent occupancy by histone deacetylases is associated with T-box gene regulation in mammalian abdominal tissue. J Biol Chem. 2010;285:11129–11142. doi: 10.1074/jbc.M109.087429. [DOI] [PMC free article] [PubMed] [Google Scholar]
- Huang DW, Sherman BT, Lempicki RA. Systematic and integrative analysis of large gene lists using DAVID bioinformatics resources. Nat Protoc. 2009;4:44–57. doi: 10.1038/nprot.2008.211. [DOI] [PubMed] [Google Scholar]
- Jaworski DM, Soloway P, Caterina J, Falls WA. Tissue inhibitor of metalloproteinase-2(TIMP-2)-deficient mice display motor deficits. J Neurobiol. 2006;66:82–94. doi: 10.1002/neu.20205. [DOI] [PMC free article] [PubMed] [Google Scholar]
- Jin L, Long L, Green MA, Spear BT. The alpha-fetoprotein enhancer region activates the albumin and alpha-fetoprotein promoters during liver development. Dev Biol. 2009;336:294–300. doi: 10.1016/j.ydbio.2009.09.026. [DOI] [PMC free article] [PubMed] [Google Scholar]
- Katz LA, Schultz RE, Semina EV, Torfs CP, Krahn KN, Murray JC. Mutations in PITX2 may contribute to cases of omphalocele and VATER-like syndromes. Am J Med Genet A. 2004;130:277–283. doi: 10.1002/ajmg.a.30329. [DOI] [PubMed] [Google Scholar]
- Kent WJ, Sugnet CW, Furey TS, Roskin KM, Pringle TH, Zahler AM, Haussler D. The human genome browser at UCSC. Genome Res. 2002;12:996–1006. doi: 10.1101/gr.229102. [DOI] [PMC free article] [PubMed] [Google Scholar]
- Kioussi C, Briata P, Baek SH, Rose DW, Hamblet NS, Herman T, Ohgi KA, Lin C, Gleiberman A, Wang J, et al. Identification of a Wnt/Dvl/beta-Catenin --> Pitx2 pathway mediating cell-type-specific proliferation during development. Cell. 2002;111:673–685. doi: 10.1016/s0092-8674(02)01084-x. [DOI] [PubMed] [Google Scholar]
- Kioussi C, Gross MK. How to build transcriptional network models of mammalian pattern formation. Plos One. 2008;3:e2179. doi: 10.1371/journal.pone.0002179. [DOI] [PMC free article] [PubMed] [Google Scholar]
- Kitamura K, Miura H, Miyagawa-Tomita S, Yanazawa M, Katoh-Fukui Y, Suzuki R, Ohuchi H, Suehiro A, Motegi Y, Nakahara Y, et al. Mouse Pitx2 deficiency leads to anomalies of the ventral body wall, heart, extra- and periocular mesoderm and right pulmonary isomerism. Development. 1999;126:5749–5758. doi: 10.1242/dev.126.24.5749. [DOI] [PubMed] [Google Scholar]
- Kleffens M, Groffen C, Neck JW, Vermeij-Keers C, Drop SL. mRNA and protein localization of the IGF system during mouse embryonic development in areas with apoptosis. Growth Horm IGF Res. 1999;9:195–204. doi: 10.1054/ghir.1999.0108. [DOI] [PubMed] [Google Scholar]
- Kwon GS, Hadjantonakis AK. Transthyretin mouse transgenes direct RFP expression or Cre-mediated recombination throughout the visceral endoderm. Genesis. 2009;47:447–455. doi: 10.1002/dvg.20522. [DOI] [PMC free article] [PubMed] [Google Scholar]
- Langsdorf A, Do AT, Kusche-Gullberg M, Emerson CP, Jr, Ai X. Sulfs are regulators of growth factor signaling for satellite cell differentiation and muscle regeneration. Dev Biol. 2007;311:464–477. doi: 10.1016/j.ydbio.2007.08.053. [DOI] [PubMed] [Google Scholar]
- LeClair EE, Mui SR, Huang A, Topczewska JM, Topczewski J. Craniofacial skeletal defects of adult zebrafish Glypican 4 (knypek) mutants. Dev Dyn. 2009;238:2550–2563. doi: 10.1002/dvdy.22086. [DOI] [PMC free article] [PubMed] [Google Scholar]
- Levy E, Haltia M, Fernandez-Madrid I, Koivunen O, Ghiso J, Prelli F, Frangione B. Mutation in gelsolin gene in Finnish hereditary amyloidosis. J Exp Med. 1990;172:1865–1867. doi: 10.1084/jem.172.6.1865. [DOI] [PMC free article] [PubMed] [Google Scholar]
- Lieberam I, Agalliu D, Nagasawa T, Ericson J, Jessell TM. A Cxcl12-CXCR4 chemokine signaling pathway defines the initial trajectory of mammalian motor axons. Neuron. 2005;47:667–679. doi: 10.1016/j.neuron.2005.08.011. [DOI] [PubMed] [Google Scholar]
- Lin CR, Kioussi C, O'Connell S, Briata P, Szeto D, Liu F, Izpisua-Belmonte JC, Rosenfeld MG. Pitx2 regulates lung asymmetry, cardiac positioning and pituitary and tooth morphogenesis. Nature. 1999;401:279–282. doi: 10.1038/45803. [DOI] [PubMed] [Google Scholar]
- Lin X, Perrimon N. Developmental roles of heparan sulfate proteoglycans in Drosophila. Glycoconj J. 2002;19:363–368. doi: 10.1023/A:1025329323438. [DOI] [PubMed] [Google Scholar]
- Longabaugh WJ, Davidson EH, Bolouri H. Computational representation of developmental genetic regulatory networks. Dev Biol. 2005;283:1–16. doi: 10.1016/j.ydbio.2005.04.023. [DOI] [PubMed] [Google Scholar]
- Lu MF, Pressman C, Dyer R, Johnson RL, Martin JF. Function of Rieger syndrome gene in left-right asymmetry and craniofacial development. Nature. 1999;401:276–278. doi: 10.1038/45797. [DOI] [PubMed] [Google Scholar]
- Maina F, Hilton MC, Ponzetto C, Davies AM, Klein R. Met receptor signaling is required for sensory nerve development and HGF promotes axonal growth and survival of sensory neurons. Genes Dev. 1997;11:3341–3350. doi: 10.1101/gad.11.24.3341. [DOI] [PMC free article] [PubMed] [Google Scholar]
- Makover A, Moriwaki H, Ramakrishnan R, Saraiva MJ, Blaner WS, Goodman DS. Plasma transthyretin. Tissue sites of degradation and turnover in the rat. J Biol Chem. 1988;63:8598–8603. [PubMed] [Google Scholar]
- Maltby S, Hughes MR, Zbytnuik L, Paulson RF, McNagny KM. Podocalyxin selectively marks erythroid-committed progenitors during anemic stress but is dispensable for efficient recovery. Exp Hematol. 2009;37:10–18. doi: 10.1016/j.exphem.2008.09.006. [DOI] [PubMed] [Google Scholar]
- Mejillano MR, Kojima S, Applewhite DA, Gertler FB, Svitkina TM, Borisy GG. Lamellipodial versus filopodial mode of the actin nanomachinery: pivotal role of the filament barbed end. Cell. 2004;118:363–373. doi: 10.1016/j.cell.2004.07.019. [DOI] [PubMed] [Google Scholar]
- Ogi H, Suzuki K, Ogino Y, Kamimura M, Miyado M, Ying X, Zhang Z, Shinohara M, Chen Y, Yamada G. Ventral abdominal wall dysmorphogenesis of Msx1/Msx2 double-mutant mice. Anat Rec A Discov Mol Cell Evol Biol. 2005;284:424–430. doi: 10.1002/ar.a.20180. [DOI] [PubMed] [Google Scholar]
- Ong K, Horsfall W, Conway EM, Schuh AC. Early embryonic expression of murine coagulation system components. Thromb Haemost. 2000;84:1023–1030. [PubMed] [Google Scholar]
- Oshima Y, Ouchi N, Sato K, Izumiya Y, Pimentel DR, Walsh K. Follistatin-like 1 is an Akt-regulated cardioprotective factor that is secreted by the heart. Circulation. 2008;117:3099–3108. doi: 10.1161/CIRCULATIONAHA.108.767673. [DOI] [PMC free article] [PubMed] [Google Scholar]
- Saraiva MJ. Transthyretin amyloidosis: a tale of weak interactions. FEBS Lett. 2001;498:201–203. doi: 10.1016/s0014-5793(01)02480-2. [DOI] [PubMed] [Google Scholar]
- Schmidt C, Bladt F, Goedecke S, Brinkmann V, Zschiesche W, Sharpe M, Gherardi E, Birchmeier C. Scatter factor/hepatocyte growth factor is essential for liver development. Nature. 1995;373:699–702. doi: 10.1038/373699a0. [DOI] [PubMed] [Google Scholar]
- Shannon P, Markiel A, Ozier O, Baliga NS, Wang JT, Ramage D, Amin N, Schwikowski B, Ideker T. Cytoscape: a software environment for integrated models of biomolecular interaction networks. Genome Res. 2003;13:2498–2504. doi: 10.1101/gr.1239303. [DOI] [PMC free article] [PubMed] [Google Scholar]
- Shih HP, Gross MK, Kioussi C. Cranial muscle defects of Pitx2 mutants result from specification defects in the first branchial arch. Proc Natl Acad Sci U S A. 2007;104:5907–5912. doi: 10.1073/pnas.0701122104. [DOI] [PMC free article] [PubMed] [Google Scholar]
- Silacci P, Mazzolai L, Gauci C, Stergiopulos N, Yin HL, Hayoz D. Gelsolin superfamily proteins: key regulators of cellular functions. Cell Mol Life Sci. 2004;61:2614–2623. doi: 10.1007/s00018-004-4225-6. [DOI] [PMC free article] [PubMed] [Google Scholar]
- Soriano JV, Pepper MS, Nakamura T, Orci L, Montesano R. Hepatocyte growth factor stimulates extensive development of branching duct-like structures by cloned mammary gland epithelial cells. J Cell Sci. 1995;108(Pt 2):413–430. doi: 10.1242/jcs.108.2.413. [DOI] [PubMed] [Google Scholar]
- Spencer JA, Hacker SL, Davis EC, Mecham RP, Knutsen RH, Li DY, Gerard RD, Richardson JA, Olson EN, Yanagisawa H. Altered vascular remodeling in fibulin-5-deficient mice reveals a role of fibulin-5 in smooth muscle cell proliferation and migration. Proc Natl Acad Sci U S A. 2005;102:2946–2951. doi: 10.1073/pnas.0500058102. [DOI] [PMC free article] [PubMed] [Google Scholar]
- Suzuki K, Economides A, Yanagita M, Graf D, Yamada G. New horizons at the caudal embryos: coordinated urogenital/reproductive organ formation by growth factor signaling. Curr Opin Genet Dev. 2009;19:491–496. doi: 10.1016/j.gde.2009.08.004. [DOI] [PMC free article] [PubMed] [Google Scholar]
- Tiger CF, Gullberg D. Abscence of laminin alpha1 chain in the skeletal muscle of dystrophic dy/dy mice. Muscle Nerve. 1997;20:1515–1524. doi: 10.1002/(sici)1097-4598(199712)20:12<1515::aid-mus6>3.0.co;2-b. [DOI] [PubMed] [Google Scholar]
- Timpl R, Rohde H, Robey PG, Rennard SI, Foidart JM, Martin GR. Laminin--a glycoprotein from basement membranes. J Biol Chem. 1979;254:9933–9937. [PubMed] [Google Scholar]
- Tusher VG, Tibshirani R, Chu G. Significance analysis of microarrays applied to the ionizing radiation response. Proc Natl Acad Sci U S A. 2001;98:5116–5121. doi: 10.1073/pnas.091062498. [DOI] [PMC free article] [PubMed] [Google Scholar]
- Uehara Y, Minowa O, Mori C, Shiota K, Kuno J, Noda T, Kitamura N. Placental defect and embryonic lethality in mice lacking hepatocyte growth factor/scatter factor. Nature. 1995;373:702–705. doi: 10.1038/373702a0. [DOI] [PubMed] [Google Scholar]
- Verani R, Cappuccio I, Spinsanti P, Gradini R, Caruso A, Magnotti MC, Motolese M, Nicoletti F, Melchiorri D. Expression of the Wnt inhibitor Dickkopf-1 is required for the induction of neural markers in mouse embryonic stem cells differentiating in response to retinoic acid. J Neurochem. 2007;100:242–250. doi: 10.1111/j.1471-4159.2006.04207.x. [DOI] [PubMed] [Google Scholar]
- Veugelers M, Cat BD, Muyldermans SY, Reekmans G, Delande N, Frints S, Legius E, Fryns JP, Schrander-Stumpel C, Weidle B, et al. Mutational analysis of the GPC3/GPC4 glypican gene cluster on Xq26 in patients with Simpson-Golabi-Behmel syndrome: identification of loss-of-function mutations in the GPC3 gene. Hum Mol Genet. 2000;9:1321–1328. doi: 10.1093/hmg/9.9.1321. [DOI] [PubMed] [Google Scholar]
- Wilkinson L, Gilbert T, Kinna G, Ruta LA, Pennisi D, Kett M, Little MH. Crim1KST264/KST264 mice implicate Crim1 in the regulation of vascular endothelial growth factor-A activity during glomerular vascular development. J Am Soc Nephrol. 2007;18:1697–1708. doi: 10.1681/ASN.2006091012. [DOI] [PubMed] [Google Scholar]
- Wilson DS, Sheng G, Jun S, Desplan C. Conservation and diversification in homeodomain-DNA interactions: a comparative genetic analysis. Proc Natl Acad Sci U S A. 1996;93:6886–6891. doi: 10.1073/pnas.93.14.6886. [DOI] [PMC free article] [PubMed] [Google Scholar]
- Yang Y, Liu J, Mao H, Hu YA, Yan Y, Zhao C. The expression pattern of Follistatin-like 1 in mouse central nervous system development. Gene Expr Patterns. 2009;9:532–540. doi: 10.1016/j.gep.2009.07.001. [DOI] [PubMed] [Google Scholar]
- Ybot-Gonzalez P, Copp AJ, Greene ND. Expression pattern of glypican-4 suggests multiple roles during mouse development. Dev Dyn. 2005;233:1013–1017. doi: 10.1002/dvdy.20383. [DOI] [PubMed] [Google Scholar]