

Abstract
Background
Previous studies have identified asthma phenotypes based on small numbers of clinical, physiologic or inflammatory characteristics. However, no studies have utilized a wide range of variables using machine learning approaches.
Objectives
To identify subphenotypes of asthma utilizing blood, bronchoscopic, exhaled nitric oxide and clinical data from the Severe Asthma Research Program using unsupervised clustering, and then characterize them using supervised learning approaches.
Methods
Unsupervised clustering approaches were applied to 112 clinical, physiologic and inflammatory variables from 378 subjects. Variable selection and supervised learning techniques were employed to select relevant and nonredundant variables, address their predictive values, as well as the predictive value of the full variable set.
Results
Ten variable clusters and six subject clusters were identified, which differed and overlapped with previous clusters. Traditionally defined severe asthmatics distributed through subject Clusters 3–6. Cluster 4 identified early onset allergic asthmatics with low lung function and eosinophilic inflammation. Later onset, mostly severe asthmatics with nasal polyps and eosinophilia characterized Cluster 5. Cluster 6 asthmatics manifested persistent inflammation in blood and bronchoalveolar lavage and exacerbations despite high systemic corticosteroid use and side effects. Age of asthma onset, quality of life, symptoms, medications and health care utilization were some of the 51 nonredundant variables distinguishing subject clusters. These 51 variables classified test cases with 88% accuracy, compared to 93% accuracy with all 112 variables.
Conclusion
The unsupervised machine learning approaches used here provide unique insights into disease, confirming other approaches while revealing novel additional phenotypes.
Keywords: asthma phenotyping, variable analysis, unsupervised approaches, supervised machine learning approaches
Introduction
The definition of asthma (appropriate symptoms in association with reversible airflow limitation) allows a heterogeneous group of patients to be included under this term1. Clinical and statistical efforts have assigned patient phenotypes, with recent emphasis on statistical. Seven clustering studies have been reported2–8, with two specifically including extremely well characterized adult asthmatics (SA).2, 3 The Leicester study utilized a k-means clustering approach3, limited to 16 variables, but including sputum eosinophils, to identify four severe and two mild-to-moderate asthma clusters. Moore et al. performed a hierarchical clustering of Severe Asthma Research Program (SARP) asthmatics, reducing 628 variables into 34 core variables to identify five clusters.2 Variables related to inflammatory markers were not included. Thus, additional approaches are needed incorporating greater numbers of variables and/or inflammatory markers.
Machine learning techniques have recently been applied to human diseases. Algorithms have assisted selecting features from thousands of genes to facilitate biomarker identification and accurate patient diagnosis. For example, a feature selection framework based on information-theory involves ranking features using a correlation measurement information gain (called INFOGAIN), and then selecting relevant, nonredundant features using a Markov blanket algorithm.9 This framework was applied to a leukemia microarray dataset to obtain subsets of nonredundant features from 7130 genes which distinguished acute lymphocytic from acute myeloid leukemia with high accuracy.10 When the top 3 informative and nonredundant genes were selected to predict leukemia types, 100% classification accuracy was achieved. Machine learning techniques, therefore, offer promising approaches to understand complex diseases.
While a clustering analysis was previously performed in SARP, blood/bronchosopic inflammatory characteristics, Immunoglobulin E (IgE) and exhaled nitric oxide (FENO) were not included as the majority had not undergone these procedures/tests. Additionally, normal controls (NC) were excluded as the majority of variables analyzed were clinically related to asthma. To incorporate inflammatory variables, this 2nd SARP analysis performed an unsupervised clustering of >100 variables, on 378 asthmatic and normal subjects who had undergone bronchoscopy. A feature selection framework selected 51 relevant, nonredundant variables. Predictive values of the full set of 112 variables and the selected 51 variables were assessed for their ability to distinguish subject clusters.
Methods
Patient population
Subjects were all part of SARP. Characterization of the subjects can be found in the Online Repository. Severe asthma was defined by 2000 ATS workshop criteria (see Online Repository).11 Other asthmatics were divided into 4 groups on the basis of FEV1% predicted and inhaled corticosteroid (CS) use as previously described.12 NCs from SARP were included as well. This clustering was limited to subjects with “lung” variables, including bronchoalveolar lavage (BAL) cell counts and FENO (See Online Repository).
Computational and statistical analysis
Data preprocessing: Variables with ≥ 5% missing data were excluded. Missing values in variables with < 5% missing data were added using a k-NNimpute algorithm. Cluster analysis: A k-means clustering method was applied to the preprocessed data to partition the subjects (including NCs). A Ward’s agglomerative hierarchical clustering method applied to the preprocessed data grouped clinical variables. Statistical tests: Data for continuous variables were log transformed to improve normality of distribution. Welch’s t-statistics13, which allow for data in different groups with unequal variances and popularly used in microarray analysis14, were used for log2-transformed data from continuous variables. Chi-square tests were used for data from categorical variables to find differences between subjects in the total SARP cohort and those in this cluster analysis. To find significant differences between subject clusters, analysis of variance (ANOVA) and pairwise t-tests were used for continuous variables with log2-transformed data, Kruskal-Wallis and pairwise Wilcoxon rank sum tests were used for categorical ordinal variables, and Chi-square tests and pairwise Fisher’s exact test were used for categorical binary variables (see Table E3 for the types of variables in our dataset). P-values were adjusted for multiple testing using a false discovery rate (FDR) procedure.15 P-values < 0.05 were considered significant. Data presented in the text and figures are on the original scale. Ranking variables using INFOGAIN: INFOGAIN16 measures how well a variable predicts subject cluster labels as determined by the k-means clustering. Higher INFOGAIN values identify which variables best predict subject cluster labels. Calculating INFOGAIN requires continuous variables to be discretized. After calculating their INFOGAINs, variables were ranked according to their values. Selection of relevant, nonredundant variables: A set of relevant variables was selected if their INFOGAIN values were above a threshold of 0.05; redundant variables were removed using a Markov-blanket algorithm.17 Classification of clustered subjects: Subjects whose cluster labels were assigned by k-means clustering were classified using a multi-class SVM algorithm. The 378 subjects were split into a training data (80% subjects) and a test data (20% subjects). Leave-one-out cross validation (LOOCV) was performed to estimate classification errors. Further details for the following methods can be found in the Online Repository: data preprocessing, cluster analysis, statistical tests, discretization and ranking variables using INFOGAIN, selection of relevant nonredundant variables, and classification of clustered subjects.
Results
Demographics (Table E1)
Only 378 subjects (of 1685 total) with BAL, blood and FENO data were analyzed. These subjects, including NCs, mild, moderate, and severe asthmatics (SA), did not generally differ from the total cohort (Table E1), but were older with slightly better lung function, likely due to limitations on research bronchoscopy in subjects <18 yrs old or with more severe obstruction.
Clustering results
378 subjects were clustered into 6 groups (Table 1). 112 variables were clustered into 10 categories by cluster analysis (Figure E1, Table E2).
Table 1.
Demographic data of the subjects in the subject clusters.
| Cluster 1 | Cluster 2 | Cluster 3 | Cluster 4 | Cluster 5 | Cluster 6 | P-value* (FDR) | |
|---|---|---|---|---|---|---|---|
|
| |||||||
| Age at Enrollment | 29 ± 11† | 31 ± 11 | 33 ± 10 | 39 ± 12 | 47 ± 10 | 43 ± 11 | <0.0001 |
|
| |||||||
| % Male/female | 41/59 | 43/57 | 16/84 | 25/75 | 60/40 | 25/75 | 0.002 |
|
| |||||||
| % Caucasians/AA/Other | 79/9/12 | 77/19/4 | 42/11/47 | 53/41/6 | 93/7/0 | 67/33/0 | <0.0001 |
|
| |||||||
| % Hispanic/Non-Hispanic/Unknown | 4/96/0 | 1/99/0 | 63/0/37 | 0/100/0 | 3/97/0 | 0/96/4 | <0.0001 |
|
| |||||||
| BMI (kg/m2) | 26 ± 7 | 27 ± 5 | 29 ± 9 | 31 ± 7 | 31 ± 6 | 30 ± 7 | <0.0001 |
|
| |||||||
| Prebronchodilator FEV1 % predicted | 100 ± 11 | 88 ± 15 | 93 ± 13 | 71 ± 14 | 65 ± 17 | 50 ± 21 | <0.0001 |
|
| |||||||
| Severity Levels (n)# | <0.0001 | ||||||
| Normals | 89 | ||||||
| Mild/No ICS | 2 | 49 | 2 | 4 | |||
| Mild + ICS | 47 | 6 | 8 | 2 | |||
| Moderate/no ICS | 13 | 6 | 1 | ||||
| Moderate + ICS | 17 | 1 | 18 | 1 | |||
| Severe | 9 | 10 | 43 | 26 | 24 | ||
| Total | 91 | 135 | 19 | 79 | 30 | 24 | |
FDR adjusted p-value from ANOVA or Chi-square tests between six subject clusters
Numerical data are presented as antilog of log2-transformed mean ± SD.
See methods for detailed description.
Ranking Variables
INFOGAIN was calculated for each variable (Table E3), demonstrating that the most discriminating variable was age of asthma onset.2, 3, 18, 19 Of the top 10 variables, 9 were symptom and medication related and one asthma history related (age of asthma onset). Using INFOGAIN of 0.2 (out of a possible 1.0) as a cutoff, 45 variables distinguished the subject clusters: 16 symptom, 10 medication, 10 asthma history/comorbidities, 7 allergy, 5 lung function, and 3 health care utilization (HCU) related.
Variable Clustering
Statistical tests showed 101 of 112 variables differed among subject clusters (Table E3), suggesting these variables represent characteristics distinguishing asthma from NCs as well as distinguishing asthma phenotypes. Hierarchical clustering partitioned the 112 variables into 10 clusters, then ordered by median INFOGAIN for each cluster (Table E2). The dendrogram of the variables from cluster analysis is shown (Figure E2).
Variable Cluster 1
(Figure 1)
Figure 1.
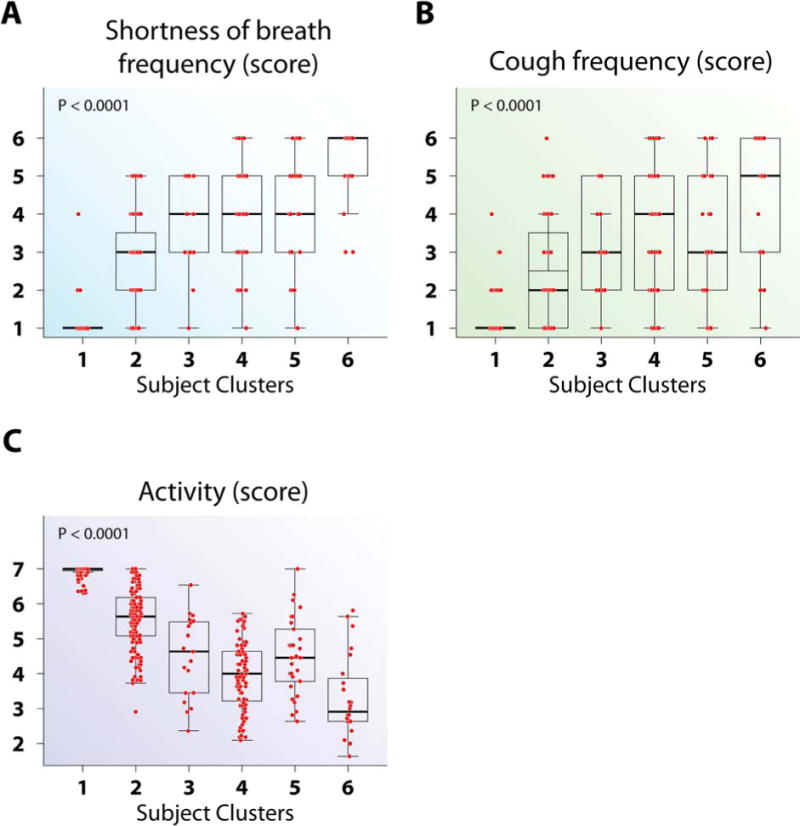
Asthma symptom and Quality of Life variables differed by subject clusters. (A–C) Cluster 6 had the highest shortness of breath frequency (A), the highest cough frequency (B), and the lowest AQLQ activity limitation score (C), among all clusters. The intergroup differences for all variables can be found in Table E3.
This cluster has the highest median INFOGAIN (0.68), indicating these variables best distinguish the subject clusters. This cluster contains symptom and AQLQ domain variables (Table E2), indicating AQLQ scores correlate highly with symptoms. Three AQLQ variables (Symptoms, Emotion, and Environment) are redundant for the Activity domain (Table E4). These variables distinguish NCs from asthma, as well as the various asthma clusters, contributing to their high INFOGAINs (Table E3).
Variable Cluster 2
(Figure 2)
Figure 2.
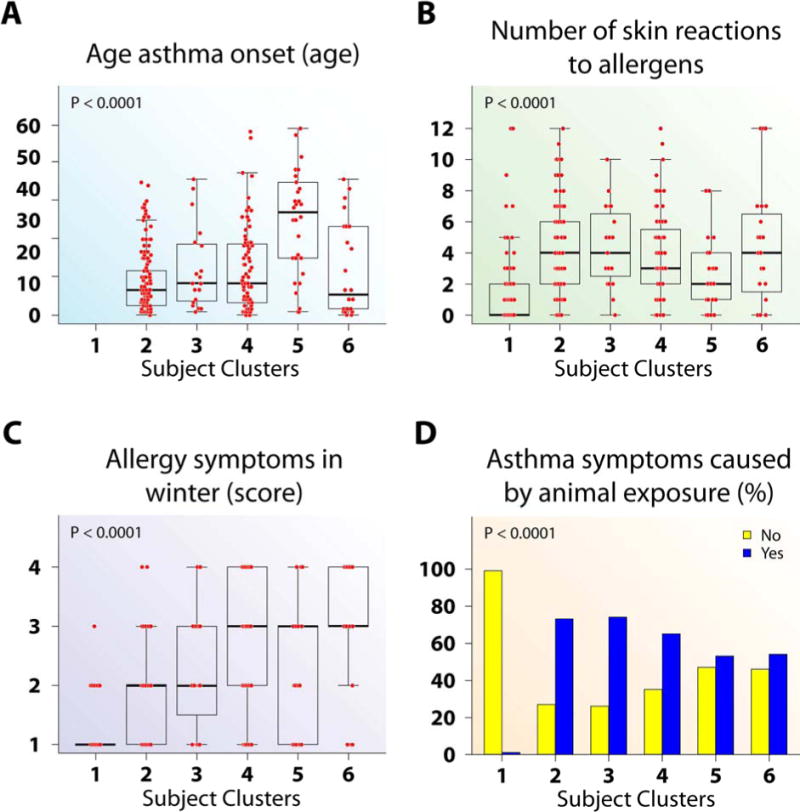
Age of asthma onset and allergy differed by subject clusters according to asthma disease status. (A–B) Cluster 5 had later onset (A) and lower numbers of allergen skin reactions (B) than all other clusters. (C) Cluster 2 had less allergy symptoms in winter than Clusters 4–6. (D) Clusters 2–6 have more asthma symptoms caused by animal exposure than Cluster 1.
Medication and atopy/allergy variables characterize this cluster. This cluster is anchored by the variable with the strongest predictive value, age of asthma onset (0.84). Eight variables, including triggers for asthma, asthma medication use, as well as atopy, only distinguish NCs (Subject Cluster 1) from asthmatic clusters. Despite having modest to high INFOGAINs (most > 0.19), many variables are redundant with age of asthma onset (Table E4), suggesting they have less impact on subject clusters when the latter is included.
Variable Cluster 3 (Figure E3)
Four lung function variables characterize this cluster with pre-bronchodilator FEV1% predicted having the highest INFOGAIN (0.48). Overall, these variables have a moderate INFOGAIN (0.29), supporting a moderate ability to separate asthma from NCs and asthma phenotypes.
Variable Cluster 4
Figure 3.
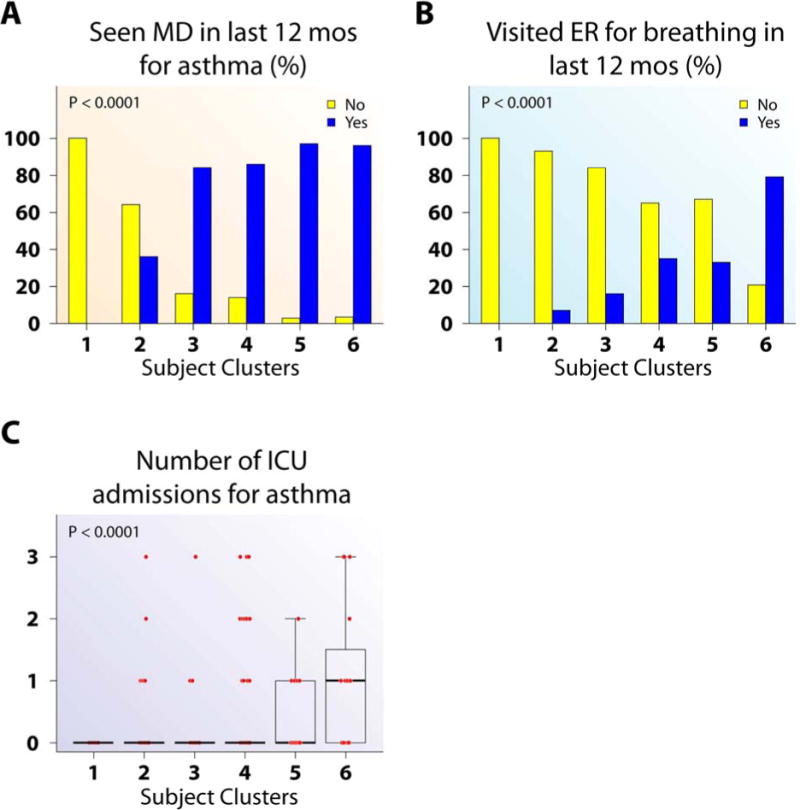
Health care utilization differed by subject clusters. (A) Subjects in Clusters 3–6 were more likely to have seen a doctor in last 12 months for asthma than Cluster 2. (B–C) Cluster 6 had a higher proportion of subjects visited ER for breathing in the last year (B) and number of ICU admissions for asthma (C) than all other clusters.
Figure 4.
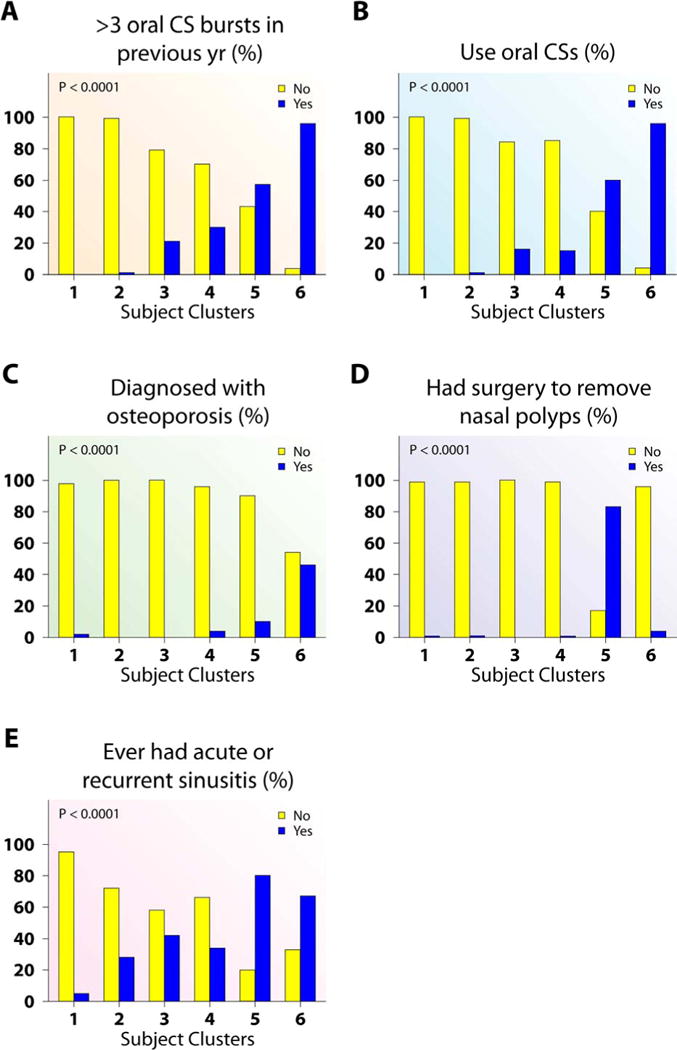
Corticosteroid use, treatment consequences and associated clinical characteristics differ across subject clusters. (A–C) Cluster 6 had the higher proportion of subjects with >3 oral CS bursts in previous year (A), on oral CS (B), and osteoporosis (C) than all other asthma clusters. (D–E) Cluster 5 had the highest proportion of subjects with nasal polyps removed (D) and had sinusitis (E).
This cluster contains medication variables, primarily related to CSs, and HCU variables. This cluster is characterized by frequent and severe HCU, as well as nasal polyps, nasal-sinus disease and history of reactions to aspirin and other non-steroidal pain medications. It is likely that these clinical characteristics necessitate greater need for systemic CS, explaining their close relationship in this cluster.20 Finally, osteoporosis also falls into this cluster, likely a consequence of high level CS use.
Variable Cluster 5
(Figure 5)
Figure 5.
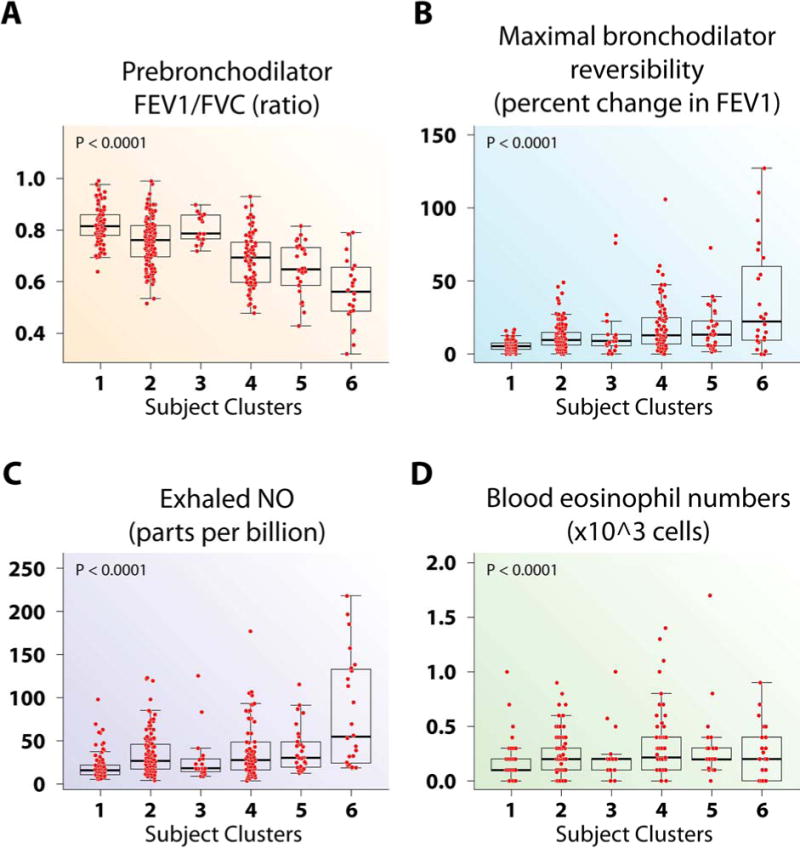
Airway responsiveness and Th2-inflammatory markers differ across the subject clusters. (A) Prebronchodilator FEV1/FVC was lower in Cluster 6 than all other clusters. (B) There were no differences in reversibility across the asthma clusters. (C) Cluster 6 had higher FENO compared to all other clusters. (D) Clusters 2, 4 and 5 had higher blood eosinophil numbers than Cluster 1.
This cluster contains 3 additional lung function variables and blood and lung Th2-inflammation related variables. Even though these variables correlated with lung volume variables in Cluster 3 (Figure E3), the 3 lung function variables in this cluster correlated more strongly with these inflammatory variables than with Cluster 3 lung function variables. FENO has the highest INFOGAIN (0.16) of the inflammatory variables.
Variable Cluster 6 (Figure E4)
This cluster contains non-eosinophilic blood inflammatory markers including total white blood cell counts (WBC) and neutrophil numbers/percentages in blood. The overall INFOGAIN is modest (0.12).
Variable Cluster 7
This cluster contains age, number of children, BMI, systolic and diastolic blood pressure, all of which could be related to age.
Variable Cluster 8
This cluster contains additional lung inflammatory variables. Interestingly, the INFOGAIN of these lung variables (overall 0.07) is less than the same variables in blood (0.12).
Variable Clusters 9–10
These clusters have the lowest median INFOGAINs among the clusters. The strongest factors in each cluster are height (Cluster 9, INFOGAIN of 0.11) and Non-Hispanic ethnicity (Cluster 10, INFOGAIN of 0.23), respectively. Environmental factors, immune and family history variables appear here, but with small impact.
Subject Clustering
Analysis of these 10 clusters of clinical, immune, inflammatory and physiologic variables produced six subject clusters. Intergroup statistical comparisons determined the variables which differed significantly across subject clusters (listed in the Figure legends and Table E3).
Subject Cluster 1 (n = 91)
All but 2 subjects were NCs with normal lung function and no symptoms, implying these 2 asthmatics were more similar to NCs than asthmatics. Cluster 1 differed from all other clusters in 38 of 112 variables, but did not differ from Cluster 2 in 7 additional variables, including Intensive Care Unit (ICU) admissions, hospitalizations, oral CS, nebulized β-agonist use and blood monocytes. Instances where Cluster 1 differs from the other Clusters beyond these specific differences are noted in text or figure legends.
Subject Cluster 2 (n = 135)
Cluster 2, the largest cluster, is primarily mild asthmatics, although 29% have predefined moderate to SA. Despite these different traditional severity levels, Cluster 2 subjects exhibit similar patterns across variables, with less asthma symptoms and better AQLQ scores than the remaining clusters (Figure 1). They have early onset disease, fewer winter allergy symptoms, but numerous allergen skin test reactions (Figure 2). They have slightly, but significantly lower lung function than “normal” Cluster 1, but better than Clusters 4–6, especially after bronchodilator (Figures E3 and 5). They are unlikely to have frequent HCU, high CS use, nasal polyps and CS-related side effects (Figures 3 and 4). Cluster 2 has higher blood and BAL eosinophils and neutrophils than Cluster 1 (Figures 5, E4 and E5).
Subject Cluster 3 (n = 19)
Cluster 3 is predominantly Hispanic women, 53% predefined as SA (Table 1, Figure E6A) with frequent symptoms, low AQLQ, a high degree of allergic sensitization, and are likely to have seen a doctor for asthma in the previous year (Figures 1–3). Despite this, they have near normal FEV1% predicted which reverses to normal after bronchodilator and little inflammation (Blood eosinophils and FENO did not differ from Cluster 1; BAL eosinophils were higher than Cluster 1, but lower than Cluster 5) (Figures E3, 5, and E5).
Subject Cluster 4 (n = 79)
Cluster 4 is also predominantly female (75%), 47% non Caucasian (Table 1), and 54% are predefined SA. They have a high BMI (Table 1), frequent asthma symptoms, an early age of asthma onset, and are likely to have seen a doctor for asthma in the previous year (Figures 1–3). Forty-nine percent report “either mother or father with asthma” (Figure E6B), suggesting these subjects are genetically predisposed to asthma. Their FEV1 is lower than Clusters 2 and 3, but also reverses to near normal (Figure E3). Cluster 4 subjects have higher FENO, blood and BAL eosinophils and neutrophils than Cluster 1, but do not differ from Clusters 2 and 3 (Figures 5, E4 and E5).
Subject Cluster 5 (n = 30)
Cluster 5 contains mostly SA, with 4 classified as mild or moderate (Table 1). This cluster is older (age 47 yrs), with later age of asthma onset, lower numbers of allergic skin reactions, but a strong history of nasal polyps, sinusitis and high dose CS use (Figures 2 and 4). This cluster has poor lung function, blood and BAL eosinophilia, and elevated total WBC and blood neutrophils (Figures E3, 5, E5 and E4). Activity limitation is less than the next Cluster (Cluster 6) (Figure 1).
Subject Cluster 6 (n = 24)
Cluster 6 consists of only SA with early-onset disease, the most symptoms, lowest lung function, frequent and high intensity HCU, and sinusitis (Figures 1–5, and E3). Despite high oral CS use (Figure 4), these subjects also have the highest FENO, high BAL eosinophils, as well as more osteoporosis and blood neutrophils (Figures 5, E5, 4, and E4). This combination suggests compliance with CS (blood neutrophila and osteoporosis) but poor lung-specific anti-inflammatory responses (persistent elevated FENO and BAL eosinophils).
Comparison of current subject clusters with previous SARP clusters
The previous SARP cluster analysis used 34 variables without including inflammatory variables to identify five asthma phenotypes among >700 total participants. Comparing these two studies (Table E5, Online Repository), Subject Cluster 2 in our analysis largely overlapped with the milder clusters (previous SARP Clusters 1 and 2). Cluster 3, primarily a mix of previous Clusters 1 and 2, identified a group of early onset atopic Hispanic women with high symptom burden despite normal lung function with little overlap with the predominantly female, late onset cluster identified in the earlier SARP clusters. Our Cluster 4 generally overlapped with the moderate to severe asthma Clusters 2 – 4, while our subject Cluster 6 overlapped with the most severe Clusters 4 and 5 in the previous study. Similar to our Cluster 3, our Cluster 5 showed little overlap with any cluster in the previous study. These results suggest general similarities across analyses, particularly in mild and very severe asthma, but distinctly define 2 additional clusters.
Variable predictive values
To investigate predictive values of variables, subject clusters were classified using all variables as well as the INFOGAIN top 10 variables (See Online Repository). Subjects were split into a training dataset containing 80% and a test dataset containing 20% of the subjects for multiple times. Using a multi-class SVM classifier with the full set of the variables, the prediction accuracy rate on the test data was on average 93% (± 2%), whereas the prediction accuracy rate dropped to 73% (± 5%) using the top 10 variables, supporting the importance variables such as lung function and inflammatory factors in distinguishing different clusters.
The impact of removing redundant variables was also addressed. A Markov blanket algorithm, combined with INFOGAIN, selected 51 relevant nonredundant variables (Table E4). Age of asthma onset, quality of life, symptoms, medication use, HCU, nasal polyps, allergy, lung function, and inflammatory factors are the major features distinguishing different clusters. The prediction rate on the test dataset was 88 ± 3%, performing less accurately than when including all variables and suggesting ‘redundant’ variables carry extra valuable information.
Discussion
In this study, unsupervised machine learning approaches generated 10 clusters of clinical, physiologic and immunoinflammatory variables, categorizing 6 subject clusters from 378 SARP asthmatic and NC participants with bronchoscopic inflammatory and FENO data. Using INFOGAIN as a nonlinear correlation measure and a Markov blanket algorithm, variables were ranked by their ability to separate subject clusters, identifying 51 nonredundant variables. Despite inclusion of inflammatory variables, variables for age at asthma onset, quality of life, symptoms, medication use and HCU were the top nonredundant features, likely because of their ability to differentiate NCs from asthmatics, but also to distinguish asthma clusters. Lung function variables were moderately discriminatory, as were allergic symptoms, nasal polyps, and inflammatory profiles, being less distinguishing overall but important for differentiating one or two subject clusters well. The inclusion of these variables likely contributed to identification of Clusters 3 and 5, which, in contrast to the previous SARP clusters, overlap with similar clusters in the Leicester cohort.3 Thus, this clustering approach brings novel insights to asthma phenotyping while helping confirm and integrate phenotypes of previous reports.
One obvious difference between this and previous analyses is inclusion of NCs, which promoted the most statistically unsupervised perspective possible, including “all comers” and not differentiating by clinically biased diagnosis. This analysis included blood, BAL and exhaled breath measures, which are not specific for asthma, overlapping substantially with NCs. Analyzing their distribution among clusters was not “biased” towards differences in asthma groups, allowing assessment of their clustering with clinical variables. Using this approach, 2 subjects classified as “asthma” clustered in “NC” Cluster 1, having more similarity to NCs than any asthmatic cluster, likely because of their normal lung function and minimal symptoms. Although both subjects had modest methacholine hyperresponsiveness, these data were not included due to substantial missing data, especially in SA. Although excluding NCs yielded almost identical asthmatic cluster results, including NCs allows comparisons of inflammatory patterns (and other variables) which contribute to overall relationships.
All 112 variables were required to achieve nearly perfect test set classification results (93% accuracy, as compared to 88% accuracy with the 51 nonredundant variables). Despite their small relative INFOGAINs, ‘redundant’ variables carry additional important information. Clinically, it would be impossible to utilize 112 variables to classify subjects. Thus, investigations are needed to identify smaller sets of variables which perform as well as the full set and ideally determine whether novel biomarkers might identify these clusters.
This is the 3rd cluster-approach analyzing adult SA and the 2nd on the adult SARP population. Overlapping with 250 previous SARP cluster analysis subjects, there was reasonable agreement in the mildest and most severe clusters. The current approach included more variables and immunoinflammatory characteristics. These differences likely contributed to identification of “new” Cluster 5 (older onset, mostly SA with nasal polyps), as well as rather distinct Cluster 3. Cluster 5 is recognizable in some form as aspirin exacerbated respiratory disease. However, sensitivity to “aspirin or other nonsteroidal anti-inflammatory drugs” appears less critical to this phenotype than the presence of nasal polyps and sinusitis in a late onset asthmatic. Although not identified in the previous SARP study, the Leicester clusters alluded to a similar subgroup, perhaps on the basis of inclusion of eosinophilic inflammation.3 Similarly, Cluster 3 identifies a mixed group (>50% categorized as SA) of primarily women with high symptom burden, early onset disease, relatively normal lung function and little inflammation. This group was also potentially identifiable in the Leicester clusters, but is distinct from the female predominant late onset Cluster 3 observed in the earlier SARP clinical clusters.
The presence of subject Cluster 6 supports the importance of greater numbers of variables, even those with low INFOGAINs. Our analysis suggests the nonredundant variables “use oral CSs” or “systemic CS for ≥50% of previous yr”, which have reasonably high INFOGAIN values (0.33 and 0.28), separate subject Cluster 6 from the other clusters, while blood neutrophils and osteoporosis, with low INFOGAIN values (0.12 and 0.1, respectively) are secondary. Interestingly, this hypothesis is consistent with the known impact of systemic CSs to increase blood neutrophils and cause osteoporosis. Notably, despite systemic CSs and their side effects, subject Cluster 6 also has the highest FENO, suggesting that the inflammation, morbidity and HCU are not caused by poor compliance/adherence.
Subject Cluster 4, characterized by early onset, clinically poorly-controlled allergic asthma (although only slightly >50% had predefined SA) with a prominent family history of asthma, differs markedly from Cluster 3 (also >50% predefined SA). Cluster 4 has lower lung function than Cluster 3. This cluster was identified in both the previous SARP and Leicester analyses.2, 3
This work was unique in that it used a suite of well-established machine learning techniques to analyze 112 variables. Both INFOGAIN and Markov-blanket algorithms are machine learning approaches for feature selection. While INFOGAIN allows quantification of how well each variable and cluster of variables distinguishes subject clusters, Markov blanket algorithms find redundant variables in feature selection problems which identify redundant variables for each nonredundant variable being largely consistent with clinical observations. Thus, machine learning-based analyses facilitated understanding of variable and subject clusters and enabled identification of the informative nonredundant distinguishing features for each subject cluster.
Our study is limited by small sample size and must be tested and retested in larger independent datasets. Further, the cross sectional nature does not allow us to address cluster stability over time.
In summary, we clustered 112 variables into 10 categories and 378 SARP subjects into 6 groups. This analysis confirms the presence of previously identified clusters: 1) generally early onset allergic asthma, of a range of severity (all previous clusters), 2) a very severe, systemic CS dependent, mixed inflammatory cluster (previous SARP analysis), 3) a late onset, eosinophilic cluster associated with nasal polyposis (Leicester clusters) and 4) a female cluster with symptom predominant early onset disease (Leicester clusters). Thus, these results extend and bridge the original SARP and Leicester Clusters. Whether this unsupervised approach to phenotyping will translate into enhanced understanding of pathobiologic differences and guide therapy awaits further study.
Supplementary Material
Key messages.
Unsupervised analysis revealed several clinically recognizable patient clusters: an early onset allergic asthma cluster, a very severe, systemic CS dependent cluster, a late onset nasal polyp cluster, and a cluster of women with symptom predominant early onset disease.
Our results confirm, integrate and expand on asthma phenotypes.
Acknowledgments
We thank George Tseng at the Department of Biostatistics at the University of Pittsburgh for critical reading of the manuscript.
Supported by National Institute of Health grants R01GM087694, RO1-HL69174, HL69116, HL69130, HL69149, HL69155, HL69167, HL69170, HL69174, HL69349, M01 RR018390, M01RR07122, M01 RR03186, and HL087665.
Abbreviations
- AA
African American
- ANOVA
Analysis of Variance
- AQLQ
Asthma Quality of Life Questionnaire
- ASW
Average silhouette width
- ATS
American Thoracic Society
- BAL
Bronchoalveolar lavage
- BMI
Body mass index
- CS
Corticosteroids
- FDR
False discovery rate
- FENO
Exhaled nitric oxide
- FEV1
Forced expiratory volume in one second
- HCU
Health care utilization
- ICS
Inhaled corticosteroids
- ICU
Intensive Care Unit
- IgE
Immunoglobulin E
- INFOGAIN
Information gain
- LOOCV
Leave-one-out cross validation
- NC
Normal controls
- PFT
Pulmonary function test
- SARP
Severe Asthma Research Program
- SA
Severe asthma
- SVM
Support vector machine
Footnotes
Publisher's Disclaimer: This is a PDF file of an unedited manuscript that has been accepted for publication. As a service to our customers we are providing this early version of the manuscript. The manuscript will undergo copyediting, typesetting, and review of the resulting proof before it is published in its final citable form. Please note that during the production process errors may be discovered which could affect the content, and all legal disclaimers that apply to the journal pertain.
References
- 1.Wenzel SE. Asthma phenotypes: the evolution from clinical to molecular approaches. Nat Med. 2012;18:716–25. doi: 10.1038/nm.2678. [DOI] [PubMed] [Google Scholar]
- 2.Moore WC, Meyers DA, Wenzel SE, Teague WG, Li H, Li X, et al. Identification of asthma phenotypes using cluster analysis in the Severe Asthma Research Program. Am J Respir Crit Care Med. 2010;181:315–23. doi: 10.1164/rccm.200906-0896OC. [DOI] [PMC free article] [PubMed] [Google Scholar]
- 3.Haldar P, Pavord ID, Shaw DE, Berry MA, Thomas M, Brightling CE, et al. Cluster analysis and clinical asthma phenotypes. Am J Respir Crit Care Med. 2008;178:218–24. doi: 10.1164/rccm.200711-1754OC. [DOI] [PMC free article] [PubMed] [Google Scholar]
- 4.Siroux V, Garcia-Aymerich J. The investigation of asthma phenotypes. Curr Opin Allergy Clin Immunol. 2011;11:393–9. doi: 10.1097/ACI.0b013e32834a955a. [DOI] [PubMed] [Google Scholar]
- 5.Fitzpatrick AM, Teague WG, Meyers DA, Peters SP, Li X, Li H, et al. Heterogeneity of severe asthma in childhood: confirmation by cluster analysis of children in the National Institutes of Health/National Heart, Lung, and Blood Institute Severe Asthma Research Program. J Allergy Clin Immunol. 2011;127:382–9. e1–13. doi: 10.1016/j.jaci.2010.11.015. [DOI] [PMC free article] [PubMed] [Google Scholar]
- 6.Just J, Gouvis-Echraghi R, Couderc R, Guillemot-Lambert N, Saint-Pierre P. Novel severe wheezy young children phenotypes: boys atopic multiple-trigger and girls nonatopic uncontrolled wheeze. J Allergy Clin Immunol. 2012;130:103–10. e8. doi: 10.1016/j.jaci.2012.02.041. [DOI] [PubMed] [Google Scholar]
- 7.Just J, Gouvis-Echraghi R, Rouve S, Wanin S, Moreau D, Annesi-Maesano I. Two novel, severe asthma phenotypes identified during childhood using a clustering approach. Eur Respir J. 2012;40:55–60. doi: 10.1183/09031936.00123411. [DOI] [PubMed] [Google Scholar]
- 8.Gouvis-Echraghi R, Saint-Pierre P, Besharaty AA, Bernard A, Just J. Exhaled nitric oxide measurement confirms 2 severe wheeze phenotypes in young children from the Trousseau Asthma Program. J Allergy Clin Immunol. 2012;130:1005–7. e1. doi: 10.1016/j.jaci.2012.07.007. [DOI] [PubMed] [Google Scholar]
- 9.Koller D, Sahami M. Toward optimal feature selection. Proceedings of the Thirteenth International Conference on Machine Learning. 1996:284–92. [Google Scholar]
- 10.Xing EP, Jordan MI, Karp RM. Feature selection for high-dimensional genomic microarray data. Proc of the Eighteenth International Conference on Machine Learning; 2001. [Google Scholar]
- 11.Proceedings of the ATS workshop on refractory asthma: current understanding, recommendations, and unanswered questions. American Thoracic Society. Am J Respir Crit Care Med. 2000;162:2341–51. doi: 10.1164/ajrccm.162.6.ats9-00. [DOI] [PubMed] [Google Scholar]
- 12.Moore WC, Bleecker ER, Curran-Everett D, Erzurum SC, Ameredes BT, Bacharier L, et al. Characterization of the severe asthma phenotype by the National Heart, Lung, and Blood Institute’s Severe Asthma Research Program. J Allergy Clin Immunol. 2007;119:405–13. doi: 10.1016/j.jaci.2006.11.639. [DOI] [PMC free article] [PubMed] [Google Scholar]
- 13.Welch BL. The generalization of “Student’s” problem when several different population variances are involved. Biometrika. 1947;34:28–35. doi: 10.1093/biomet/34.1-2.28. [DOI] [PubMed] [Google Scholar]
- 14.Dudoit S, Yang YH, Callow MJ, Speed TP. Statistical methods for identifying differentially expressed genes in replicated cDNA microarray experiments. Statistica Sinica. 2002;12:111–39. [Google Scholar]
- 15.Benjamini Y, Hochberg Y. Controlling the false discovery rate: A practical and powerful approach to multiple testing. J Roy Statist Soc Ser B. 1995;57:289–300. [Google Scholar]
- 16.Mitchell TM. Machine Learning: McGraw-Hill Science. 1997. [Google Scholar]
- 17.Yu L, Liu H. Efficient Feature Selection via Analysis of Relevance and Redundancy. Journal of Machine Learning Research. 2004;5:1205–24. [Google Scholar]
- 18.Miranda C, Busacker A, Balzar S, Trudeau J, Wenzel SE. Distinguishing severe asthma phenotypes: role of age at onset and eosinophilic inflammation. J Allergy Clin Immunol. 2004;113:101–8. doi: 10.1016/j.jaci.2003.10.041. [DOI] [PubMed] [Google Scholar]
- 19.Moffatt MF, Gut IG, Demenais F, Strachan DP, Bouzigon E, Heath S, et al. A large-scale, consortium-based genomewide association study of asthma. N Engl J Med. 2010;363:1211–21. doi: 10.1056/NEJMoa0906312. [DOI] [PMC free article] [PubMed] [Google Scholar]
- 20.Saffar AS, Ashdown H, Gounni AS. The molecular mechanisms of glucocorticoids-mediated neutrophil survival. Curr Drug Targets. 2011;12:556–62. doi: 10.2174/138945011794751555. [DOI] [PMC free article] [PubMed] [Google Scholar]
Associated Data
This section collects any data citations, data availability statements, or supplementary materials included in this article.