

Abstract
Objective
As a product of oxidative stress associated with tolerance loss in other disease states, we investigated the presence of malondialdehyde-acetaldehyde (MAA) adducts and circulating anti-MAA antibody in rheumatoid arthritis (RA).
Methods
Synovial tissues from RA and osteoarthritis patients were examined for the presence of MAA-modified and citrullinated proteins. Anti-MAA antibody isotypes were measured in RA cases (n = 1720) and healthy controls (n = 80) by ELISA. Antigen-specific anti-citrullinated protein antibody (ACPA) was measured in RA cases using a multiplex antigen array. Anti-MAA isotype concentrations were compared in a subset of cases (n = 80) and matched controls (n = 80). Associations of anti-MAA antibody isotypes with disease characteristics, including ACPA, were examined in all RA cases.
Results
MAA adducts were increased in RA synovial tissues relative to osteoarthritis and co-localized with citrullinated protein. Anti-MAA antibody isotypes were increased in RA cases vs. controls (p < 0.001). Among RA cases, anti-MAA antibody isotypes were associated with ACPA and RF positivity (p < 0.001) in addition to select measures of disease activity. Higher anti-MAA antibody concentrations were associated with a higher number of positive antigen-specific ACPA analytes in high titer (p < 0.001) and a higher ACPA score (p < 0.001) independent of other covariates.
Conclusion
MAA adduct formation is increased in RA and appears to result in robust antibody responses that are strongly associated with ACPA. These results support speculation that MAA formation may be a co-factor that drives tolerance loss resulting in the autoimmune responses characteristic of RA.
Keywords: rheumatoid arthritis, anti-citrullinated protein antibody (ACPA), malondialdehyde-acetaldehyde (MAA) adducts, tolerance loss, autoimmunity
Lipid peroxidation leading to the formation of protein adducts promotes pro-inflammatory responses that characterize a variety of chronic health conditions and related environmental exposures including cardiovascular disease, alcoholic liver disease, and cigarette smoking (1–4). Malondialdehyde (MDA) is one such ubiquitous product implicated in disease pathogenesis. When cells are exposed to reactive oxygen species, lipid peroxidation occurs, causing cell walls to rupture and membrane lipids to oxidize into MDA (5). MDA spontaneously breaks down and forms acetaldehyde (AA) (6). Importantly, both MDA and AA are highly reactive aldehydes, and together have been demonstrated to modify proteins to produce a MDA-AA protein adduct, termed malondialdehyde-acetaldehyde (MAA). In contrast to highly immunogenic MAA adducts that are characterized by a stable ring structure (7, 8), MDA and AA are relatively unstable and either rapidly dissociate or form other metabolic products (9, 10).
Although there have been no studies examining the role of MAA in rheumatoid arthritis (RA), several investigations have shown that levels of oxidative stress, including MDA, are increased in RA (11–14). Compared to healthy controls and patients with osteoarthritis, individuals with RA have higher levels of circulating MDA (15). Moreover, compared to patients with seronegative RA, both circulating and synovial levels of MDA are increased in seropositive disease (16).
While little is known about MAA adducts in RA, they are overexpressed in a variety of diseased tissues, act as immunodominant epitopes, and promote robust inflammatory responses (17). Previous studies have demonstrated that MAA modified proteins elicit isotype-specific antibody responses and induce the expression of pro-inflammatory cytokines including tumor necrosis factor (TNF)α, intracellular adhesion molecule-1 (ICAM-1) and vascular cell adhesion molecule (VCAM) (2, 18). Animal studies have demonstrated that immunization with MAA-modified bovine serum albumin in the absence of adjuvant induces robust antibody, T-helper cell, and cytotoxic T-cell responses to MAA epitopes – all furthering the belief that MAA has a causal relationship with immunologic responses (7, 19, 20). Additional studies have shown that MAA adducts are immunogenic even in the absence of adjuvant (7) and result in adaptive immune responses to the carrier protein itself, bypassing tolerance (21).
In this study, we examined whether MAA was present in RA synovium and thus potentially mediating the initiation and/or progression of related immune responses. Given the proposed role of MAA modification in tolerance loss, we examined whether anti-MAA antibody responses served as a marker of increased disease-specific autoantibody responses in RA.
Materials and Methods
Study subjects
To determine whether MAA is present in RA synovium, we examined synovial tissues from three anti-cyclic citrullinated peptide (CCP) antibody positive RA patients and three osteoarthritis patients obtained at the time of total joint arthroplasty (tissues obtained from the Robinson laboratory). Serologic analyses were performed using data and samples from the Veterans Affairs Rheumatoid Arthritis (VARA) registry (22). The registry has received institutional review board approval and all patients provided informed written consent prior to enrollment. This study was also approved by the VARA Scientific and Ethics Advisory Committee. All participants satisfied the 1987 American College of Rheumatology classification criteria for RA (23). To examine whether circulating concentrations of anti-MAA antibody were higher in the context of RA, we also performed assays on banked samples from a convenience cohort of 80 volunteer controls. Controls reported no systemic inflammatory diseases including RA and all but four reported good-to-excellent overall health status (24).
Chemicals, Proteins and Antibodies
Briefly, for these experiments aqueous human albumin (Alb) was purchased from Talecris Biotherapeutics, Inc., Research Triangle Park, NC. Acetaldehyde (AA) was obtained from Aldrich Chemical Co. (Milwaukee, WI). Malondialdehyde (MDA) was obtained as the sodium salt (MDA–Na) by treatment of tetramethoxypropane (Aldrich Chemical Co.) with NaOH, according to the method of Iwata and Kikugawa (25). Phytic acid (PA) and diethylenetriaminepentaacetic acid (DTPA) were obtained from Sigma Chemical Co. (St. Louis, MO). Anti-citrulline monoclonal antibody (F95) is a mouse IgM antibody that has been shown to react with all citrullinated proteins (26). The anti-MAA polyclonal antibody was developed in our laboratories, is a rabbit IgG and has been shown to react with the 1,4 dihydropyridine adduct formed when MDA and AA are present (27).
Preparation of Modified Proteins
In order to evaluate the specificity of antibody responses to citrullinated or MAA modified structures, aqueous human albumin (Alb) was modified as follows:
| Alb | = | No modification |
| Alb-Cit | = | Albumin Citrullinated |
| Alb-MAA | = | Albumin MAA modified |
| Alb-Cit-MAA | = | Albumin Citrullinated and then MAA modified |
Alb was citrullinated using rabbit skeletal muscle peptidlyarginine deiminase (PAD; Sigma) as previously described (28). Verification of citrullination resulting in the formation of Alb-Cit and Alb-Cit-MAA was determined by ELISA using an anti-citrulline monoclonal antibody (26). Alb was adjusted to 2 mg and modified by reacting with 2 mM MDA and 1.0 mM AA in 0.1 M phosphate buffer, pH 7.2, containing 2 mM DTPA and 2 mM PA, at 37°C for 3 days, followed by dialysis against three changes of 0.1 M sodium phosphate buffer for 24 h at 4°C (8). Alb-MAA and Alb-Cit-MAA were assayed for modification by the amount of fluorescent MAA adduct present (excitation 398 nm and emission 460 nm) using a Turner Biosystems (Sunnyvale, CA) LS-5B spectrofluorimeter.
Immunohistochemical Staining of Synovial Tissues
Synovial tissue was collected from three RA patients and three osteoarthritis patients as described above and placed in OCT. Frozen sections were prepared, blocked with normal goat serum and sections stained for the presence of; MAA modified proteins using the MAA-specific rabbit polyclonal antibody, citrullinated proteins using the Cit-specific mouse IgM mononclonal antibody, and leukocytes using a rat IgG2b anti-CD45 monoclonal antibody (AbD Serotec, Raleigh, NC). The specific reactivity of the anti-MAA and anti-Cit antibodies in binding MAA-modified or citrullinated protein, respectively, has been well documented (26, 27). These antibodies were chosen to ensure that the labeled second antibodies specifically reacted with the primary antibodies. Briefly, all antibodies were diluted 1:100 and incubated with the sections overnight at 4°C. Sections were washed and incubated with the following secondary antibodies from Jackson ImmunoResearch (Avondale, PA) all diluted 1:1000; Rhodamine (TRITC) Affini-Pure Goat anti-mouse IgM (Fc5μ-specific) to detect the anti-citrulline antibody, Dylight 405-conjugated Affinipure Goat anti-Rabbit IgG (Fc-specific) to detect the anti-MAA antibody and Dylight 649-conjugated AffiniPure mouse anti-Rat IgG (Fc-specific) to detect anti-CD45 antibody. After 45 minutes at room temperature the slides were washed, mounted and imaged using a Zeiss 510 Meta Confocal Laser Scanning Microscope. All images were analyzed using ZEN 2012 software (Zeiss). Image quantification was done using Image J software (National Institutes of Health) and represented as mean (± standard deviation [S.D.]) pixel density.
Characteristics of patients with RA
VARA includes standardized clinical data measured during routine care. Enrollment variables include RA classification criteria, comorbidity, cigarette smoking status (never, former, or current), sociodemographics (education, race/ethnicity, age, sex), body mass index (BMI), date of RA diagnosis, and medication use including prednisone, methotrexate, and anti-TNF-α therapy. Anti-citrullinated protein antibodies (ACPA) were measured on banked baseline serum using a second-generation anti-CCP antibody ELISA (Diastat, Axis-Shield Diagnostics, Dundee, Scotland; positivity ≥ 5 U/ml). Rheumatoid factor (RF; positivity ≥ 15 IU/ml) and high sensitivity C-reactive protein (hsCRP, mg/l) were determined by nephelometry (Siemens Healthcare Diagnostics, Munich, Germany). Additional measures collected at enrollment included tender and swollen joint counts (range 0 to 28), and erythrocyte sedimentation rate (ESR; mm/h). A 4-variable Disease Activity Score based on 28 joints (DAS28) was calculated.
Circulating Antibodies to MAA
Serum samples from all patients were screened for the presence of the immunoglobulin (Ig)-M, IgG, and IgA isotypes of anti-MAA antibodies as previously described (17). Briefly, aqueous human albumin (Alb) was modified with malondialdehyde and acetaldehyde (2:1) (27). ELISA plates were coated with 2 μg/well of MAA-Alb or Alb. Additional wells were coated with known concentrations of human IgM, IgG or IgA isotype standards from which relative antibody concentrations were extrapolated (Sigma). Plates were incubated overnight at 4°C, washed, blocked with 2% bovine serum albumin, and incubated with patient serum at a 1:1000 dilution. Following incubation at 37°C for 1 hour, a secondary HRP goat anti-human antibody specific for IgM (Fc5μ fragment specific), IgG (Fcγ specific) or IgA (α chain specific) (Jackson ImmunoResearch, West Grove, PA) was added. Plates were developed using TMB substrate, absorbance determined at 450 nm using an MRXII microplate reader (Dyantech, Chantilly, VA). Data are presented as arbitrary units (AU) of the specific isotype detected in the assay as this reflects the amount of antibody present in a sample relative to a standard curve.
Determination of Cross-Reactivity by ELISA
Cross-reactivity between the anti-MAA and ACPA assays was assessed. For these experiments, 96-well Immulon IV (Nunc, Fisher Scientific, St. Louis, MO) microtiter plates were coated with 2 μg/well Alb, Alb-Cit, Alb-MAA, or Alb-Cit-MAA in bicarbonate buffer (pH 9.6) as previously described (7). Rabbit anti-MAA antibody was diluted 1:1000, and the mouse anti-Cit was diluted 1:1000 to give a reactivity on their matching antigen of 1.5 optical density (O.D.). This reactivity represents the dilution that results in ½ max binding in our ELISAs. Similar dilutions of 5 patient samples from each of the following three groups were also prepared; anti-MAA(+)/anti-Cit(-), anti-MAA(-)/anti-Cit(+), or anti-MAA(+)/anti-Cit(+). In a separate incubation plate these samples were incubated at 4°C overnight with two-fold dilutions of PBS, Alb-Cit or Alb-MAA (starting at 500 μg/well). These samples were then transferred to the coated plates that had been washed 3 times with PBST, and incubated at 37°C for 45 minutes. Plates were washed in PBST and a secondary antibody (HRP-goat anti-rabbit IgG for anti-MAA, HRP-rabbit anti-mouse IgM [Fc5μ-specific] for anti-Cit) or HRP-goat anti-human IgG was added (1:2000) and incubated at 37°C for 45 min. The plates were washed and TMB substrate was added. Color changes were monitored by an MRX II microplate reader (Dynatech) at 450 nm. Mean % activity of five samples are shown with or without inhibition, following subtraction from the non-specific activity to unmodified Alb. Percent activity was calculated by dividing the O.D. in the presence of the inhibitor by the O.D. in the absence of the inhibitor and multiplying by 100.
Additional experiments were undertaken to evaluate whether anti-MAA and/or anti-Cit antibodies reacted with the standard test for CCP. Rabbit anti-MAA and mouse anti-Cit antibody were tested in the human Diastat anti-CCP antibody kit from Axis-Shield Diagnostics Ltd. (Dundee, UK). For these studies the kit was run according to the manufacturer’s directions with the following changes. Rabbit anti-MAA and mouse anti-Cit antibody was diluted 1:1000 and substituted for human serum. Plates were washed in PBST and a secondary antibody (HRP-goat anti-rabbit IgG for anti-MAA, HRP-rabbit anti-mouse IgM [Fc5μ-specific] for anti-Cit) was added (1:2000) to the appropriate wells and incubated at 37°C for 45 min. Plates were developed and color change measured on the MRX II microplate reader. To maintain consistency in the kit the human standard was used to determine the relative concentration of the anti-CCP antibodies (21, 29).
Antigen Specific ACPA
Patient serum samples were evaluated for 19 specific ACPA in addition to native (unmodified) fibrinogen using a bead-based multiplex antigen array on the BioPlex platform as previously reported (30, 31). This array measures disease-specific autoantibody reactivity to multiple citrullinated autoantigens. To assess whether immune responses to MAA are associated with the magnitude of epitope spreading, we examined the number of ACPA positive analytes with a positive threshold defined as two S.D. above the mean value for all RA patients. We then calculated an ACPA score, defined as the sum of normalized fluorescent values divided by the number of analytes examined (19 ACPA).
Statistical Analysis
Descriptive statistics are shown as means ± S.D. or a frequency and corresponding percentage. Given skewed distributions, anti-MAA antibody isotypes were log-transformed. To account for confounding of sociodemographics and health behaviors in comparisons of anti-MAA antibody isotypes, cases were matched to available controls at a ratio of 1 to 1 based on age (± 5 years), gender, race, and smoking status. There were two controls for which a suitable case-match was not available, limiting the comparison to 80 cases and 80 controls. A two-sample t-test was used to compare log-transformed anti-MAA isotype concentrations by case/control status. Spearman correlation coefficients were calculated to examine associations of the different isotype values in RA cases. The associations of anti-MAA isotype concentrations with RA patient characteristics were then examined using unadjusted ordinary least squares regression. To further examine whether the relationship of anti-MAA isotype concentrations with RF and anti-CCP antibody positivity were independent of other covariates, we also performed multivariate ordinary least squares regression including all factors that were significant (p < 0.05) at the univariate level. Given the high expected concordance between RF and anti-CCP status, models including RF excluded anti-CCP and models including anti-CCP excluded RF. Given skewed distributions, joint counts were dichotomized for regression models into 0 tender/swollen joints and ≥ 1 tender/swollen joints with comparisons examining the impact of having a joint count > 0. Continuous joint counts are reported for descriptive purposes. Associations of anti-MAA antibody with clinical measures in these analyses are presented as beta coefficients with corresponding p-values. The beta coefficient represents the mean log change in anti-MAA antibody associated with a unit change in a given clinical variable.
Significance analysis of microarrays (SAM) (31, 32) was used to analyze multiplex ACPA among anti-CCP antibody positive RA patients to identify differences in ACPA profiles associated with anti-MAA isotype concentrations, categorized into tertiles. We then compared the number of ACPA positive analytes in addition to ACPA scores based on quintiles of anti-MAA antibody using one-way analysis of variance (ANOVA) before proceeding to multivariable analyses (ANCOVA). Covariates in these models included sociodemographic and health-related factors in addition to RA disease duration. SAM output was sorted based on false discovery rates (FDRs) in order to identify antigens with the greatest differences in autoantibody reactivity. Hierarchical clustering software Cluster® 3.0 was used to arrange SAM results according to similarities among autoantibody specificities with SAM scores displayed as a heatmap using Java Treeview® (Version 1.1.3). Additional analyses were completed using STATA v12 (StataCorp, College Station, TX) and SAS v9.3 (SAS Institute, Cary, NC).
Results
Joint tissues from three RA and three osteoarthritis patients were stained for the presence of MAA-modified and citrullinated proteins. As shown in the joint tissue of a RA patient MAA-modified proteins are indicated by the presence of blue staining (Figure 1A). Citrullinated proteins (Figure 1B) are indicated by the presence of green staining and CD45 (Figure 1C) is indicated with red staining. When these images were merged (Figure 1D) there was independent localization and co-localization of all three proteins, demonstrated by purple staining. When osteoarthritis joint tissue was stained for MAA, citrullinated proteins, and CD45 (Figure 1E–G) there was negligible staining. Merged images (Figure 1H) demonstrated no evidence of co-localization of MAA and citrullinated proteins in osteoarthritis. Similar staining results were observed in synovial tissues from two additional RA cases and two additional patients with osteoarthritis (Supplemental Figure 1). Mean staining intensity for MAA (16.2 ± 4.8 in RA vs. 0.7 ± 0.2 in OA), citrullinated proteins (9.6 ± 4.0 vs. 1.2 ± 1.0), and CD45 (10.4 ± 1.7 vs. 1.0 ± 0.3) were consistently higher in RA (n = 3) compared to OA (n = 3) synovial tissues.
Figure 1.
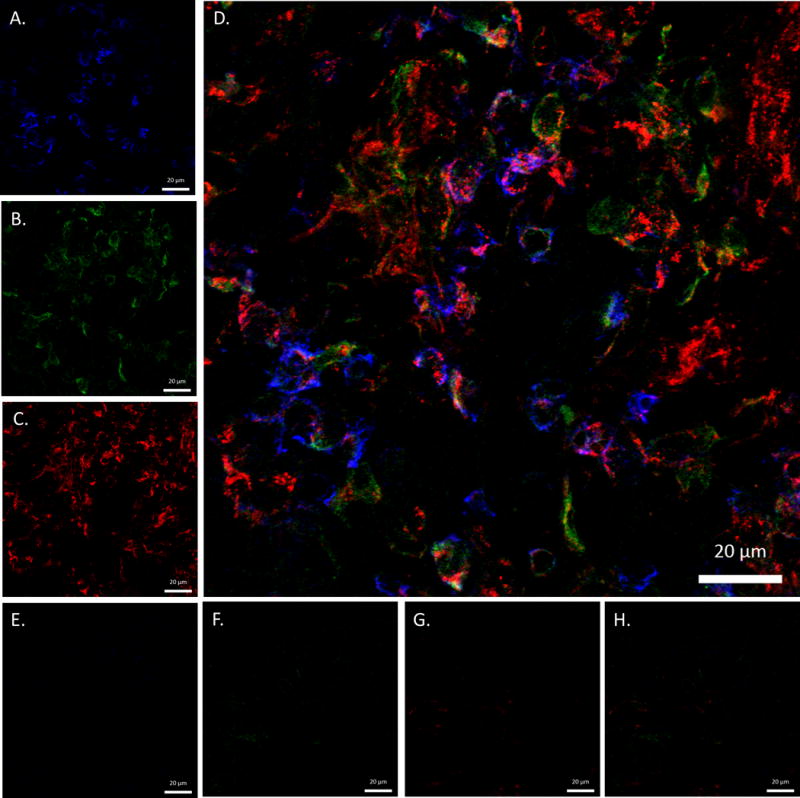
Confocal colocalization images of MAA and citrullinated proteins in rheumatoid arthritis (RA) and osteoarthritis (OA) joint tissues. Frozen joint sections from 3 RA and 3 OA patients were stained for the presence of MAA, citrullinated proteins, and CD45 using IgG polyclonal rabbit anti-MAA antibody, IgM monoclonal mouse anti-citrulline antibody, and IgG2b anti-rat CD45: (A) RA sample stained for MAA proteins (B) RA sample stained for citrullinated protein (C) RA sample stained for CD45 (D) merged RA image of MAA proteins, citrullinated proteins and CD45 (E) OA sample stained for MAA proteins (F) OA sample stained for citrullinated protein (G) OA sample stained for CD45 (H) merged OA image of MAA proteins, citrullinated proteins and CD45. Images are at 63x power and created using a Zeiss 510 Meta Confocal Laser Scanning Microscope and anayized using ZEN 2012 software. Images from 1 RA and 1 OA patient shown; images from additional 2 RA patients and 2 OA patients shown in Supplemental Figure 1.
To evaluate ACPA and anti-MAA antibody specificity, cross-reactivity between the anti-MAA and ACPA assays was evaluated. As demonstrated in Table 1, there was no evidence of cross-reactivity between antibodies to MAA and antibodies to citrullinated protein. In summary, these data convincingly demonstrate that MAA and citrullinated epitopes represent distinct antibody targets.
Table 1.
Reactivity and specificity of anti-citrullinated peptide (anti-Cit), anti-malondialdehyde acetylaldehyde (anti-MAA) antibodies, and RA serum to select antigen (Ag)*.
| Monoclonal Anti-Cit | Polyclonal Anti-MAA | Human SerumAnti-MAA (+) and Anti-Cit (−) | Human SerumAnti-MAA (−) and Anti-Cit (+) | Human SerumAnti-MAA (+) and Ant-Cit (+) | |||||||||||
|---|---|---|---|---|---|---|---|---|---|---|---|---|---|---|---|
| Inhibitor | Inhibitor | Inhibitor | Inhibitor | Inhibitor | |||||||||||
| Ag | None | Alb-Cit | Alb -MAA | None | Alb -Cit | Alb-MAA | None | Alb-Cit | Alb -MAA | None | Alb-Cit | Alb -MAA | None | Alb-Cit | Alb -MAA |
| Alb-Cit | 100 | 0.8 | 99 | NA | NA | NA | NA | NA | NA | 100 | 1.1 | 99 | 100 | 0.8 | 100 |
| Alb-MAA | NA | NA | NA | 100 | 100 | 1.8 | 100 | 99 | 1.5 | NA | NA | NA | 100 | 99 | 1.0 |
| Alb-Cit-MAA | 100 | 1.2 | 99 | 100 | 99 | 1.4 | 100 | 100 | 1.1 | 100 | 0.9 | 1.0 | 100 | 49 | 48 |
For inhibition assays, the monoclonal anti-Citrulline antibody, polyclonal anti-MAA antibody, and five patient serum samples from each of three groups (anti-MAA+/anti-Cit−, anti-MAA-/anti-Cit+ and anti-MAA+/anti-Cit+) were assayed for reactivity to citrullinated human serum albumin (Alb-Cit) and Alb-MAA. Mean % activity of five samples are shown with or without inhibition, following subtraction from the non-specific activity to unmodified Alb. Percent activity was calculated by dividing the O.D. in the presence of the inhibitor by the O.D. in its absence and multiplying by 100. NA = No or negligible activity of the antibody/serum on the indicated antigen at an O.D. < 0.053, which was determined to be 2 S.D. above the mean of negative controls. Bolded numbers are significantly lower (p < 0.05) following incubation with the indicated inhibitor. The monoclonal anti-Cit antibody, but not the polyclonal anti-MAA antibody, was reactive to the commercial CCP antigen (Diastat). Anti-Cit positive RA patients were all anti-CCP antibody positive and all anti-Cit negative patients were anti-CCP antibody negative.
Subsequent serological analyses included 1,720 RA cases and 80 volunteer controls. RA cases included predominantly older men (mean age 63 years, 91% men) with a majority reporting Caucasian race (78%) (Table 2). On average, RA cases had long-standing disease, were predominantly seropositive (78% positive for anti-CCP antibody) and had moderate disease activity as reflected in a mean DAS28 of 3.9 ± 1.6. There were moderate and statistically significant correlations between individual anti-MAA isotypes among RA cases (r 0.48 to 0.58, p < 0.001).
Table 2.
RA patient characteristics (independent variables) at the time of enrollment and unadjusted associations with anti-MAA antibody isotype concentrations (dependent variables)*
| RA Cases N = 1,720 |
Log (IgA) | Log (IgM) | Log (IgG) | |
|---|---|---|---|---|
|
| ||||
| Sociodemographics | Mean (±SD) | Beta coefficient (p-value) | ||
| Age | 63.4 (11.3) | −0.001 (0.637) | −0.006 (0.147) | −0.002 (0.395) |
| Male | 90.9 | 0.267 (0.048) | 0.014 (0.928) | 0.039 (0.713) |
| Race | ||||
| Caucasian | 77.5 | Ref. | Ref. | Ref. |
| African American | 16.3 | 0.280 (0.001) | 0.056 (0.662) | 0.198 (0.040) |
| Other | 6.2 | 0.375 (0.015) | 0.164 (0.418) | 0.405 (0.001) |
| Health-related factors | ||||
| Body mass index, kg/m2 | 28.2 (5.6) | 0.011 (0.118) | −0.005 (0.561) | 0.001 (0.890) |
| Smoking status | ||||
| Never | 20.2 | Ref. | Ref. | Ref. |
| Former | 53.4 | 0.115 (0.171) | 0.023 (0.835) | 0.021 (0.814) |
| Current | 26.4 | 0.175 (0.078) | 0.322 (0.011) | 0.067 (0.497) |
| Hypertension | 57.1 | 0.133 (0.054) | 0.069 (0.467) | 0.108 (0.120) |
| Diabetes mellitus | 20.7 | 0.157 (0.052) | −0.161 (0.172) | −0.009 (0.921) |
| Hyperlipidemia | 43.2 | 0.066 (0.329) | 0.072 (0.447) | 0.167 (0.013) |
| Cardiovascular disease | 21.6 | 0.012 (0.878) | −0.032 (0.793) | 0.182 (0.012) |
| RA-related measures | ||||
| Disease duration | 12.4 (11.5) | 0.005 (0.059) | 0.009 (0.009) | −0.001 (0.745) |
| Nodules | 29.7 | 0.205 (0.003) | 0.409 (<0.001) | 0.251 (0.001) |
| RF positive | 79.8 | 0.351 (<0.001) | 0.614 (<0.001) | 0.335 (<0.001) |
| Anti-CCP antibody positive | 77.9 | 0.417 (<0.001) | 0.408 (<0.001) | 0.399 (<0.001) |
| Swollen joint count | 5.1 (6.1) | 0.108 (0.148) | −0.040 (0.694) | 0.086 (0.249) |
| Tender joint count | 5.8 (7.1) | 0.034 (0.642) | −0.057 (0.566) | −0.036 (0.611) |
| DAS-28 | 3.9 (1.6) | 0.068 (0.001) | 0.051 (0.066) | 0.006 (0.771) |
| ESR, mm/hr | 27.5 (23.6) | 0.206 (<0.001) | 0.146 (0.001) | 0.171 (<0.001) |
| C-reactive protein positive | 68.5 | 0.104 (<0.001) | 0.040 (0.262) | 0.067 (0.015) |
| Prednisone use | 41.8 | 0.019 (0.783) | 0.184 (0.053) | 0.045 (0.516) |
| Methotrexate use | 51.6 | 0.023 (0.733) | 0.089 (0.345) | 0.012 (0.866) |
| Biologic use | 22.9 | 0.154 (0.055) | 0.293 (0.010) | 0.076 (0.297) |
Joint counts modeled as dichotomous indicator of joint count > 0; ESR and anti-MAA antibody concentrations log transformed for analyses; significant comparisons bolded
We compared anti-MAA antibody isotype concentrations among 80 randomly selected cases and 80 controls matched for age, gender, race, and smoking status. As expected there were no RA-control differences for age (mean 51 years), gender (78% women), race (90% Caucasian), or smoking (41% ever smokers). As shown in Figure 2, anti-MAA antibody isotypes (IgA, IgM, and IgG) were universally higher among RA cases compared to controls (p < 0.001 for all comparisons), regardless of whether patients were positive or negative for anti-CCP antibody. Defining isotype positivity as concentrations ≥ 2.5 S.D. above the mean in controls, we examined the frequency of anti-MAA antibody isotype positivity in all RA cases available (n = 1,720). The prevalence of anti-MAA positivity for each isotype was consistently higher among anti-CCP positive compared to anti-CCP antibody negative RA patients (76% vs. 63% for IgA, p < 0.001; 93% vs. 88% for IgG, p = 0.003; 41% vs. 29% for IgM, p < 0.001). Positivity for all three anti-MAA antibody isotypes was observed in 38% of anti-CCP positive and 26% of anti-CCP negative cases and 0% in controls.
Figure 2.
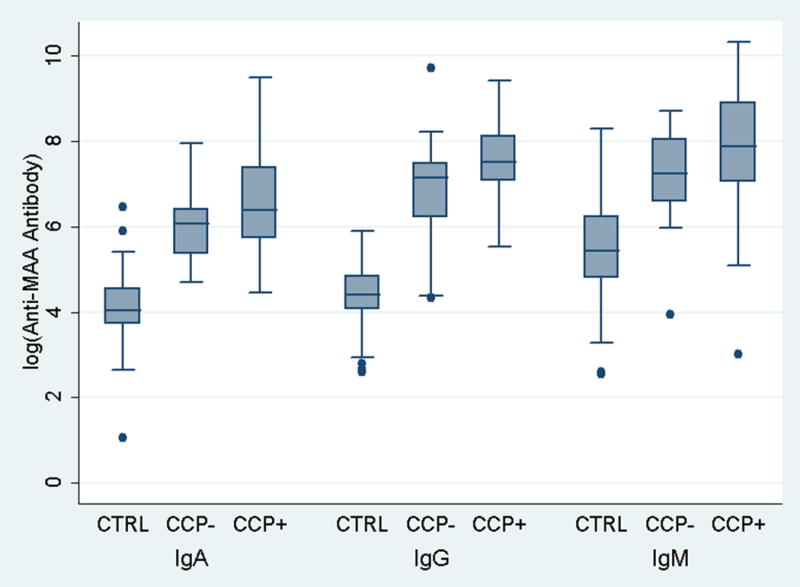
Box plots demonstrating RA case-control differences in anti-MAA antibody isotype concentrations; controls (CTRL; n = 80) matched to cases (n = 80), shown separately based on anti-CCP antibody status (CCP− and CCP+); RA-control matching based on age (mean of 51 years in both groups), gender (78% women), race (90% Caucasian), and smoking status (41% ever smokers)
Cross sectional associations of anti-MAA antibody isotype concentrations with RA patient factors are summarized in Table 2. Of note, both the IgA and IgG anti-MAA isotypes were found in higher concentration among non-Caucasians than Caucasians while only the IgA isotype was found in higher levels among men. Compared to never smokers, current smoking was associated with higher serum concentrations of the IgM anti-MAA isotype but not IgA or IgG. Both the IgA and IgM anti-MAA isotypes were increased with every added year of RA disease duration. In contrast, both hyperlipidemia and cardiovascular disease were associated with higher circulating levels of only the IgG anti-MAA isotype. In regards to measures of disease activity and severity, all three isotypes were significantly associated with the presence of subcutaneous nodules, autoantibody positivity (both RF and anti-CCP) and ESR. To further examine whether the associations of RF and anti-CCP antibody status with anti-MAA antibody concentrations were independent of other factors, we examined these associations using multivariate regression analysis. Following multivariate adjustment, RF positivity remained significantly associated with all three anti-MAA antibody isotypes (p ≤ 0.006). In separate multivariable models, anti-CCP antibody remained significantly associated with both IgA (p = 0.004) and IgG (p = 0.001) anti-MAA isotypes although its association with IgM (p = 0.11) was attenuated and no longer significant (data not shown).
Given significant associations of the anti-MAA antibody isotypes with anti-CCP positivity at baseline and previous data showing associations with tolerance loss (7, 21), we examined the associations of these isotypes with the expression of antigen-specific ACPA, the number of ACPA analytes positive, and total ACPA score. Multiple ACPA recognizing several distinct citrullinated antigens were over-expressed among subjects with higher anti-MAA antibody concentrations, findings that were consistent across isotypes as demonstrated in a heatmap shown in Figure 3. Of the 19 antigen-specific ACPA examined (including anti-CCP), 13 demonstrated increased expression relative to higher concentration of one or more anti-MAA antibody isotypes. The number of ACPA analytes positive (p < 0.001) and the total ACPA score (p < 0.001) were significantly higher among anti-CCP antibody positive patients with higher circulating anti-MAA antibody IgG isotype (Figure 4). Similar results were observed with both the IgA and IgM anti-MAA isotypes (Supplemental Figure 2). The association of all three anti-MAA antibody isotypes with the number of ACPA analytes positive and total ACPA score remained significant following multivariable adjustment (data not shown).
Figure 3.
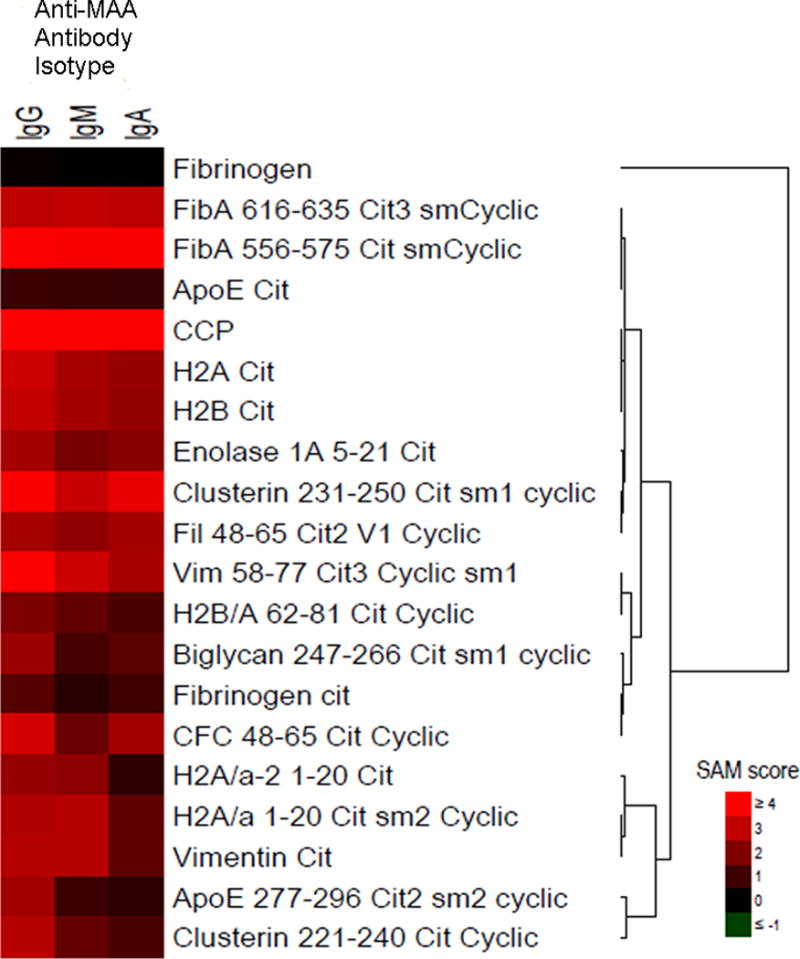
Heatmap demonstrating relative expression of 19 antigen-specific ACPA and antibody to unmodified fibrinogen among anti-CCP positive RA patients; results reflect Statistical Analysis of Microarray (SAM) scores among those with highest relative to lowest tertile of anti-MAA antibody isotype (IgG, IgM, IgA); no increased expression observed for any isotype referent to unmodified fibrinogen, fibrinogen-cit, H2A/a-2 1–20 cit, H2B/A 62–81 cit cyclic, ApoE cit, biglycan 247–266 cot sm1 cyclic, or ApoE 277–296 cit2 sm2 cyclic; remaining ACPA significantly increased for ≥ 1 anti-MAA antibody isotype. Heatmap represents mean antigen-specific ACPA expression from all 1,720 RA cases that were analyzed separately for each anti-MAA antibody isotype.
Figure 4.
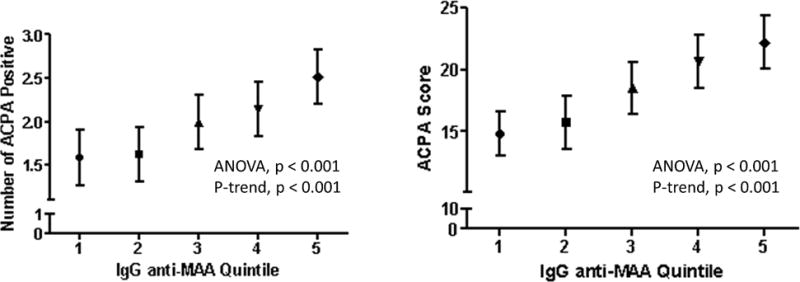
Number of ACPA analytes positive (left) and total ACPA score (right) based on the quintile of circulating IgG anti-MAA antibody; positive threshold defined as two standard deviations (S.D.) above the mean value for RA patients; ACPA score defined as the sum of normalized fluorescent values divided by the number of analytes examined; points shown reflect means and bars reflect S.D.
Discussion
In this study, we found that MAA adducts are present to a greater extent in RA synovium relative to synovial tissue from patients with osteoarthritis. MAA adducts independently localize and, more importantly, colocalize with citrullinated proteins in the inflamed synovial tissues in RA but not in osteoarthritis. For the first time, we have demonstrated that anti-MAA antibody isotype responses are strongly correlated with ACPA in patients with RA. Taken together, these data suggest that MAA modifications to RA-related neo-antigens could play an important role in tolerance loss and the subsequent generation of immune responses in RA.
Similar to post-translational deimidation (citrullination) (33), MAA modification of antigen is in itself not specific to RA. MAA adduct formation has now been demonstrated in numerous inflammatory disease states including cardiovascular disease, alcoholic liver disease, and smoking related lung injury (1, 2, 4, 34). In addition to being overexpressed in the diseased synovium of RA, MAA has been preliminarily demonstrated in atherosclerotic plaque and antibody isotype responses to MAA correlate with the progression of cardiovascular disease in non-RA populations (35). Whether MAA adducts and increased formation of anti-MAA antibody could in part explain the excess burden of cardiovascular disease in RA is unknown. Speculation in this regard is supported by the higher concentrations of IgG antibody to MAA observed among RA patients with known cardiovascular disease as well as higher IgM anti-MAA antibody concentrations observed among current smokers, a potent risk factor for heart disease. Cigarette smoke contains AA, a key substrate in MAA formation (1). Beyond the scope of this study and available data, the question of whether MAA and immune responses to MAA predict future RA-related cardiovascular events warrants further investigation.
Several questions remain regarding the putative role of MAA in RA pathogenesis. The specific proteins or peptides targeted for MAA modification in RA are at this point in time unknown. MAA adducts are formed predominantly on epsilon amino lysine groups and also on select N-terminal amino groups (8), both ubiquitous in human tissues. In alcoholic liver disease, MAA adduct formation stimulates the release of fibronectin and collagen (36), also expressed in articular tissues. Whether MAA adduction specifically targets these peptides or the same peptides undergoing citrullination in RA, or whether these peptides might explain the co-localization of MAA and citrulline in RA synovium observed in this study is unknown and will require further investigation. While not trivial, targeted experiments examining the impact of MAA modification on the immunogenicity of citrullinated autoantigens, such as citrullinated forms of vimentin, fibrinogen, or enolase, will be of interest. Given the association of anti-MAA antibody with increased expression of numerous antigen-specific ACPA, our results suggest that multiple proteins may be involved. In addition to enhancing immunogenicity, exposure to MAA adducts has also been shown to be cytotoxic (37, 38). It is unknown, however, whether immune responses to MAA are directly pathogenic or simply serve as a surrogate marker for its expression.
In addition to observed associations with ACPA, anti-MAA antibody isotypes were detected in 29% to 88% of anti-CCP antibody negative patients. These results are intriguing and suggest that anti-MAA antibody could serve as an informative biomarker in seronegative RA. However, these observations must be interpreted with caution given the ubiquitous nature of MAA-adduct formation in the context of inflammation and resulting oxidative stress. The potential use of anti-MAA antibody as either a diagnostic or prognostic biomarker in seronegative RA will require additional studies with the inclusion of diseased controls and long-term follow-up.
Although it would be ideal to directly measure circulating MAA adducts, prior reports have demonstrated that serum levels of MAA-modified proteins are not readily detectable, most likely related to high concentrations of circulating anti-MAA antibody in addition to the rapid removal by the reticuloendothelial system (39). There are additional limitations to this effort. RA synovium and serum samples available for this work came from patients with longstanding disease, precluding our ability to examine the possible role of MAA modification and anti-MAA antibody responses earlier in the disease process. Given the very limited number of synovial tissue samples examined, additional studies using a larger number of samples, including those from anti-CCP negative patients and patients with earlier disease, would be of interest.
These data add to a growing literature (1, 2, 4, 34) detailing a paradigm of MAA-adduction and immune sensitization that can be either functional (i.e. facilitating clearance) or dysfunctional with MAA-induced dysfunction arising from impaired protein function, early cell death, or as in the possible case of RA, the promotion of tolerance loss and autoimmunity. When injected into animals, MAA-adducted self-proteins trigger robust immune responses even in the absence of adjuvant with antibody development targeting not only the MAA-adduct, but also the carrier protein and the protein carrier conjugate (7, 21). Animal studies have demonstrated that the substrates of MAA adduction and MAA-adducts are cleared by cells expressing various scavenger receptors (40). Impaired expression or function of these receptors has been implicated in other disease states, leading to MAA-adduct accumulation, recruitment and activation of other immune cells, and the increased expression of pro-inflammatory cytokines and endothelial adhesion molecules (40). Whether these same pathways are also operative in the link between MAA formation and RA remains to be seen.
In summary, we have shown that MAA-adduct formation is increased in RA joint tissues and, importantly, these adducts co-localize with citrullinated antigen. In turn, MAA antibody responses are associated with ACPA expression independent of multiple covariates examined. In light of these results, future investigations are warranted to identify the role that MAA-adduct formation might play in RA pathogenesis and the promotion of tolerance loss leading to disease-specific autoantibody formation.
Supplementary Material
Supplemental Figure 1: Confocal colocalization images of MAA and citrullinated proteins in rheumatoid arthritis (RA) and osteoarthritis (OA) joint tissues. Frozen joint sections from 2 additional RA and 2 OA patients (not shown in Figure 1) were stained for the presence of MAA, citrullinated proteins, and CD45 using IgG polyclonal rabbit anti-MAA antibody, IgM monoclonal mouse anti-citrulline antibody, and IgG2b anti-rat CD45 : (A) RA 2 sample stained for MAA proteins (B) RA 2 sample stained for citrullinated protein (C) RA 2 sample stained for CD45 (D) merged RA 2 image of MAA proteins, citrullinated proteins and CD45 (E) RA 3 sample stained for MAA proteins (F) RA 3 sample stained for citrullinated protein (G) RA 3 sample stained for CD45 (H) merged RA 3 image of MAA proteins, citrullinated proteins and CD45 (I) merged OA 2 sample image of MAA proteins, citrullinated proteins and CD45 (J) merged OA 3 sample image of MAA proteins, citrullinated proteins and CD45. (K) RA Isotype control Rb IgG, Ms IgM, and Rat IgG2b with secondary antibodies (L) OA secondary only control. Images are at 63× power and created using a Zeiss 510 Meta Confocal Laser Scanning Microscope and anayized using ZEN 2012 software.
Supplemental Figure 2: Number of ACPA analytes positive (left column) and total ACPA score (right column) based on the quintile of circulating IgA (top) and IgM (bottom) anti-MAA antibody; positive threshold defined as two standard deviations (S.D.) above the mean value for RA patients; ACPA score defined as the sum of normalized fluorescent values divided by the number of analytes examined; points shown reflect means and bars reflect S.D.
Acknowledgments
We thank Janice A. Taylor and James R. Talaska of the Confocal Laser Scanning Microscope Core Facility at the University of Nebraska Medical Center for providing assistance with confocal microscopy and the Nebraska Research Initiative and the Eppley Cancer Center for their support of the Core Facility.
Funding: Funding for this work was provided by the Department of Medicine & Nebraska Arthritis Outcomes Research Center at the University of Nebraska Medical Center. Dr. Mikuls’ work is supported by a VA Merit Award and the Umbach Professorship in Arthritis.
References
- 1.Freeman TL, Haver A, Duryee MJ, Tuma DJ, Klassen LW, Hamel FG, et al. Aldehydes in cigarette smoke react with the lipid peroxidation product malonaldehyde to form fluorescent protein adducts on lysines. Chem Res Toxicol. 2005;18(5):817–24. doi: 10.1021/tx0500676. [DOI] [PubMed] [Google Scholar]
- 2.Hill GE, Miller JA, Baxter BT, Klassen LW, Duryee MJ, Tuma DJ, et al. Association of malondialdehyde-acetaldehyde (MAA) adducted proteins with atherosclerotic-induced vascular inflammatory injury. Atherosclerosis. 1998;141(1):107–16. doi: 10.1016/s0021-9150(98)00153-1. [DOI] [PubMed] [Google Scholar]
- 3.Thiele GM, Klassen LW, Tuma DJ. Formation and immunological properties of aldehyde-derived protein adducts following alcohol consumption. Methods Mol Biol. 2008;447:235–57. doi: 10.1007/978-1-59745-242-7_17. [DOI] [PubMed] [Google Scholar]
- 4.Rolla R, Vay D, Mottaran E, Parodi M, Traverso N, Arico S, et al. Detection of circulating antibodies against malondialdehyde-acetaldehyde adducts in patients with alcohol-induced liver disease. Hepatology. 2000;31(4):878–84. doi: 10.1053/he.2000.5373. [DOI] [PubMed] [Google Scholar]
- 5.Holvoet P, Perez G, Zhao Z, Brouwers E, Bernar H, Collen D. Malondialdehyde-modified low density lipoproteins in patients with atherosclerotic disease. J Clin Invest. 1995;95(6):2611–9. doi: 10.1172/JCI117963. [DOI] [PMC free article] [PubMed] [Google Scholar]
- 6.Uchida K. Lipofuscin-like fluorophores originated from malondialdehyde. Free radical research. 2006;40(12):1335–8. doi: 10.1080/10715760600902302. [DOI] [PubMed] [Google Scholar]
- 7.Thiele GM, Tuma DJ, Willis MS, Miller JA, McDonald TL, Sorrell MF, et al. Soluble proteins modified with acetaldehyde and malondialdehyde are immunogenic in the absence of adjuvant. Alcoholism, clinical and experimental research. 1998;22(8):1731–9. [PubMed] [Google Scholar]
- 8.Tuma DJ, Kearley ML, Thiele GM, Worrall S, Haver A, Klassen LW, et al. Elucidation of reaction scheme describing malondialdehyde-acetaldehyde-protein adduct formation. Chem Res Toxicol. 2001;14(7):822–32. doi: 10.1021/tx000222a. [DOI] [PubMed] [Google Scholar]
- 9.Ishii T, Ito S, Kumazawa S, Sakurai T, Yamaguchi S, Mori T, et al. Site-specific modification of positively-charged surfaces on human serum albumin by malondialdehyde. Biochemical and biophysical research communications. 2008;371(1):28–32. doi: 10.1016/j.bbrc.2008.03.140. [DOI] [PubMed] [Google Scholar]
- 10.Tuma DJ, Hoffman T, Sorrell MF. The chemistry of acetaldehyde-protein adducts. Alcohol Alcohol Suppl. 1991;1:271–6. [PubMed] [Google Scholar]
- 11.Desai PB, Manjunath S, Kadi S, Chetana K, Vanishree J. Oxidative stress and enzymatic antioxidant status in rheumatoid arthritis: a case control study. Eur Rev Med Pharmacol Sci. 2010;14(11):959–67. [PubMed] [Google Scholar]
- 12.Ozkan Y, Yardym-Akaydyn S, Sepici A, Keskin E, Sepici V, Simsek B. Oxidative status in rheumatoid arthritis. Clin Rheumatol. 2007;26(1):64–8. doi: 10.1007/s10067-006-0244-z. [DOI] [PubMed] [Google Scholar]
- 13.Shah D, Wanchu A, Bhatnagar A. Interaction between oxidative stress and chemokines: possible pathogenic role in systemic lupus erythematosus and rheumatoid arthritis. Immunobiology. 2011;216(9):1010–7. doi: 10.1016/j.imbio.2011.04.001. [DOI] [PubMed] [Google Scholar]
- 14.Vasanthi P, Nalini G, Rajasekhar G. Status of oxidative stress in rheumatoid arthritis. Int J Rheum Dis. 2009;12(1):29–33. doi: 10.1111/j.1756-185X.2009.01375.x. [DOI] [PubMed] [Google Scholar]
- 15.Mishra R, Singh A, Chandra V, Negi MP, Tripathy BC, Prakash J, et al. A comparative analysis of serological parameters and oxidative stress in osteoarthritis and rheumatoid arthritis. Rheumatol Int. 2012;32(8):2377–82. doi: 10.1007/s00296-011-1964-1. [DOI] [PubMed] [Google Scholar]
- 16.Ediz L, Hiz O, Ozkol H, Gulcu E, Toprak M, Ceylan MF. Relationship between anti-CCP antibodies and oxidant and anti-oxidant activity in patients with rheumatoid arthritis. Int J Med Sci. 2011;8(2):139–47. doi: 10.7150/ijms.8.139. [DOI] [PMC free article] [PubMed] [Google Scholar]
- 17.Duryee MJ, Klassen LW, Schaffert CS, Tuma DJ, Hunter CD, Garvin RP, et al. Malondialdehyde-acetaldehyde adduct is the dominant epitope after MDA modification of proteins in atherosclerosis. Free radical biology & medicine. 2010;49(10):1480–6. doi: 10.1016/j.freeradbiomed.2010.08.001. [DOI] [PMC free article] [PubMed] [Google Scholar]
- 18.Duryee MJ, Klassen LW, Freeman TL, Willis MS, Tuma DJ, Thiele GM. Lipopolysaccharide is a cofactor for malondialdehyde-acetaldehyde adduct-mediated cytokine/chemokine release by rat sinusoidal liver endothelial and Kupffer cells. Alcohol Clin Exp Res. 2004;28(12):1931–8. doi: 10.1097/01.alc.0000148115.90045.c5. [DOI] [PubMed] [Google Scholar]
- 19.Willis MS, Klassen LW, Tuma DJ, Sorrell MF, Thiele GM. Adduction of soluble proteins with malondialdehyde-acetaldehyde (MAA) induces antibody production and enhances T-cell proliferation. Alcohol Clin Exp Res. 2002;26(1):94–106. [PubMed] [Google Scholar]
- 20.Willis MS, Thiele GM, Tuma DJ, Klassen LW. T cell proliferative responses to malondialdehyde-acetaldehyde haptenated protein are scavenger receptor mediated. Int Immunopharmacol. 2003;3(10–11):1381–99. doi: 10.1016/S1567-5769(03)00136-X. [DOI] [PubMed] [Google Scholar]
- 21.Thiele GM, Duryee MJ, Willis MS, Tuma DJ, Radio SJ, Hunter CD, et al. Autoimmune hepatitis induced by syngeneic liver cytosolic proteins biotransformed by alcohol metabolites. Alcohol Clin Exp Res. 2010;34(12):2126–36. doi: 10.1111/j.1530-0277.2010.01309.x. [DOI] [PMC free article] [PubMed] [Google Scholar]
- 22.Mikuls TR, Fay BT, Michaud K, Sayles H, Thiele GM, Caplan L, et al. Associations of disease activity and treatments with mortality in men with rheumatoid arthritis: results from the VARA Registry. Rheumatology (Oxford) 2011;50:101–9. doi: 10.1093/rheumatology/keq232. [DOI] [PMC free article] [PubMed] [Google Scholar]
- 23.Arnett F, Edworthy S, Bloch D, McShane D, Fries J, Cooper N, et al. The American Rheumatism Association 1987 revised criteria for the classification of rheumatoid arthritis. Arthritis Rheum. 1988;31:315–24. doi: 10.1002/art.1780310302. [DOI] [PubMed] [Google Scholar]
- 24.Mikuls TR, Payne JB, Reinhardt RA, Thiele GM, Maziarz E, Cannella AC, et al. Antibody responses to Porphyromonas gingivalis (P. gingivalis) in subjects with rheumatoid arthritis and periodontitis. Int Immunopharmacol. 2009;9(1):38–42. doi: 10.1016/j.intimp.2008.09.008. [DOI] [PMC free article] [PubMed] [Google Scholar]
- 25.Kikugawa K, Kato T, Iwata A. Determination of malonaldehyde in oxidized lipids by the Hantzsch fluorometric method. Analytical biochemistry. 1988;174(2):512–21. doi: 10.1016/0003-2697(88)90051-6. [DOI] [PubMed] [Google Scholar]
- 26.Nicholas AP, Whitaker JN. Preparation of a monoclonal antibody to citrullinated epitopes: its characterization and some applications to immunohistochemistry in human brain. Glia. 2002;37(4):328–36. [PubMed] [Google Scholar]
- 27.Tuma DJ, Thiele GM, Xu D, Klassen LW, Sorrell MF. Acetaldehyde and malondialdehyde react together to generate distinct protein adducts in the liver during long-term ethanol administration. Hepatology. 1996;23(4):872–80. doi: 10.1002/hep.510230431. [DOI] [PubMed] [Google Scholar]
- 28.Lundberg K, Nijenhuis S, Vossenaar ER, Palmblad K, van Venrooij WJ, Klareskog L, et al. Citrullinated proteins have increased immunogenicity and arthritogenicity and their presence in arthritic joints correlates with disease severity. Arthritis Res Ther. 2005;7(3):R458–67. doi: 10.1186/ar1697. [DOI] [PMC free article] [PubMed] [Google Scholar]
- 29.Kuhn KA, Kulik L, Tomooka B, Braschler KJ, Arend WP, Robinson WH, et al. Antibodies against citrullinated proteins enhance tissue injury in experimental autoimmune arthritis. J Clin Invest. 2006;116(4):961–73. doi: 10.1172/JCI25422. [DOI] [PMC free article] [PubMed] [Google Scholar]
- 30.Hueber W, Tomooka BH, Zhao X, Kidd BA, Drijfhout JW, Fries JF, et al. Proteomic analysis of secreted proteins in early rheumatoid arthritis: anti-citrulline autoreactivity is associated with up regulation of proinflammatory cytokines. Ann Rheum Dis. 2007;66(6):712–9. doi: 10.1136/ard.2006.054924. [DOI] [PMC free article] [PubMed] [Google Scholar]
- 31.Wagner CA, Sokolove J, Lahey LJ, Bengtsson C, Saevarsdottir S, Alfredsson L, et al. Identification of anticitrullinated protein antibody reactivities in a subset of anti-CCP-negative rheumatoid arthritis: association with cigarette smoking and HLA-DRB1 ‘shared epitope’ alleles. Ann Rheum Dis. 2014 doi: 10.1136/annrheumdis-2013-203915. [DOI] [PMC free article] [PubMed] [Google Scholar]
- 32.Tusher VG, Tibshirani R, Chu G. Significance analysis of microarrays applied to the ionizing radiation response. Proc Natl Acad Sci U S A. 2001;98(9):5116–21. doi: 10.1073/pnas.091062498. [DOI] [PMC free article] [PubMed] [Google Scholar]
- 33.Baka Z, Gyorgy B, Geher P, Buzas EI, Falus A, Nagy G. Citrullination under physiological and pathological conditions. Joint Bone Spine. 2012;79(5):431–6. doi: 10.1016/j.jbspin.2012.01.008. [DOI] [PubMed] [Google Scholar]
- 34.McCaskill ML, Kharbanda KK, Tuma DJ, Reynolds JD, DeVasure JM, Sisson JH, et al. Hybrid malondialdehyde and acetaldehyde protein adducts form in the lungs of mice exposed to alcohol and cigarette smoke. Alcohol Clin Exp Res. 2011;35(6):1106–13. doi: 10.1111/j.1530-0277.2011.01443.x. [DOI] [PMC free article] [PubMed] [Google Scholar]
- 35.Anderson DR, Duryee MJ, Hunter CD, Garvin RP, Shurmur SW, Klassen LW, et al. Differentiating Normal Coronary Arteries, Stable Atheromatous Lesions and Unstable Atheromatous Lesions: MAA-Protein Adducts and Anti-MAA Antibodies Isotypes in Patients with Atherosclerotic Disease and Acute Myocardial Infarction. Arteriosclerosis, Thrombosis, and Vascular Biology Annual Conference; Chicago, IL. 2012. [Google Scholar]
- 36.Thiele GM, Duryee MJ, Freeman TL, Sorrell MF, Willis MS, Tuma DJ, et al. Rat Sinusoidal Liver Endothelial Cells (SECs) Produce Pro-Fibrotic Factors in Response to Adducts Formed from the Metabolites of Ethanol. Biochem Pharmacol. 2005;79:1593–600. doi: 10.1016/j.bcp.2005.08.014. [DOI] [PubMed] [Google Scholar]
- 37.Willis MS, Klassen LW, Carlson DL, Brouse CF, Thiele GM. Malondialdehyde-acetaldehyde haptenated protein binds macrophage scavenger receptor(s) and induces lysosomal damage. International immunopharmacology. 2004;4(7):885–99. doi: 10.1016/j.intimp.2004.04.004. [DOI] [PubMed] [Google Scholar]
- 38.Willis MS, Klassen LW, Tuma DJ, Sorrell MF, Thiele GM. In vitro exposure to malondialdehyde-acetaldehyde adducted protein inhibits cell proliferation and viability. Alcohol Clin Exp Res. 2002;26(2):158–64. [PubMed] [Google Scholar]
- 39.Duryee MJ, Klassen LW, Freeman TL, Willis MS, Tuma DJ, Thiele GM. Chronic ethanol consumption impairs receptor-mediated endocytosis of MAA-modified albumin by liver endothelial cells. Biochem Pharmacol. 2003;66(6):1045–54. doi: 10.1016/s0006-2952(03)00416-7. [DOI] [PubMed] [Google Scholar]
- 40.Duryee MJ, Klassen LW, Thiele GM. Immunological response in alcoholic liver disease. World J Gastroenterol. 2007;13:4938–46. doi: 10.3748/wjg.v13.i37.4938. [DOI] [PMC free article] [PubMed] [Google Scholar]
Associated Data
This section collects any data citations, data availability statements, or supplementary materials included in this article.
Supplementary Materials
Supplemental Figure 1: Confocal colocalization images of MAA and citrullinated proteins in rheumatoid arthritis (RA) and osteoarthritis (OA) joint tissues. Frozen joint sections from 2 additional RA and 2 OA patients (not shown in Figure 1) were stained for the presence of MAA, citrullinated proteins, and CD45 using IgG polyclonal rabbit anti-MAA antibody, IgM monoclonal mouse anti-citrulline antibody, and IgG2b anti-rat CD45 : (A) RA 2 sample stained for MAA proteins (B) RA 2 sample stained for citrullinated protein (C) RA 2 sample stained for CD45 (D) merged RA 2 image of MAA proteins, citrullinated proteins and CD45 (E) RA 3 sample stained for MAA proteins (F) RA 3 sample stained for citrullinated protein (G) RA 3 sample stained for CD45 (H) merged RA 3 image of MAA proteins, citrullinated proteins and CD45 (I) merged OA 2 sample image of MAA proteins, citrullinated proteins and CD45 (J) merged OA 3 sample image of MAA proteins, citrullinated proteins and CD45. (K) RA Isotype control Rb IgG, Ms IgM, and Rat IgG2b with secondary antibodies (L) OA secondary only control. Images are at 63× power and created using a Zeiss 510 Meta Confocal Laser Scanning Microscope and anayized using ZEN 2012 software.
Supplemental Figure 2: Number of ACPA analytes positive (left column) and total ACPA score (right column) based on the quintile of circulating IgA (top) and IgM (bottom) anti-MAA antibody; positive threshold defined as two standard deviations (S.D.) above the mean value for RA patients; ACPA score defined as the sum of normalized fluorescent values divided by the number of analytes examined; points shown reflect means and bars reflect S.D.