


Abstract
CTG•CAG repeat expansions cause at least twelve inherited neurological diseases. Expansions require the presence, not the absence, of the mismatch repair protein MutSβ (Msh2-Msh3 heterodimer). To evaluate properties of MutSβ that drive expansions, previous studies have tested under-expression, ATPase function or polymorphic variants of Msh2 and Msh3, but in disparate experimental systems. Additionally, some variants destabilize MutSβ, potentially masking the effects of biochemical alterations of the variations. Here, human Msh3 was mutated to selectively inactivate MutSβ. Msh3−/− cells are severely defective for CTG•CAG repeat expansions but show full activity on contractions. Msh3−/− cells provide a single, isogenic system to add back Msh3 and test key biochemical features of MutSβ on expansions. Msh3 overexpression led to high expansion activity and elevated levels of MutSβ complex, indicating that MutSβ abundance drives expansions. An ATPase-defective Msh3 expressed at normal levels was as defective in expansions as Msh3−/− cells, indicating that Msh3 ATPase function is critical for expansions. Expression of two Msh3 polymorphic variants at normal levels showed no detectable change in expansions, suggesting these polymorphisms primarily affect Msh3 protein stability, not activity. In summary, CTG•CAG expansions are limited by the abundance of MutSβ and rely heavily on Msh3 ATPase function.
INTRODUCTION
CTG•CAG repeat expansions are the underlying genetic cause for at least 12 inherited neurological disorders, including Huntington's disease (HD), myotonic dystrophy type 1 (DM1) and most of the spinocerebellar ataxias (1–4). Expansions can arise during inheritance in all these diseases, and some also display somatic expansions in affected tissue. Expansions determine whether disease will ensue, at what age and the speed of disease progression. Thus there is substantial interest in understanding the mechanisms of CTG•CAG repeat expansion to generate new insights into these diseases and to identify possible therapeutic avenues (2–4).
The high frequency of CTG•CAG repeat expansions in both disease and in model systems suggests an active mutagenic process that is driven by the presence, not the absence, of specific proteins. Candidate gene approaches, first in mice and subsequently in other systems, identified the DNA mismatch repair protein MutSβ as a key driver of expansions. MutSβ is a heterodimeric complex of Msh2 and Msh3 subunits (5,6). Mouse knockouts of either Msh2 or Msh3 block nearly all inherited and somatic expansions in HD and DM1 animals (7–12). In contrast, there are modest to no detectable effects on expansions in knockouts of Msh6, which encodes the MutSα-specific Msh6 subunit (9,12–14). The largest Msh6−/− effect was restricted to maternal transmission in DM1 mice where the frequency of expansions was reduced somewhat (13). The dependence of expansions on Msh2 and Msh3 also extends to a mouse model of Fragile X associated disorders, where expansions of the CGG•CCG repeat are driven primarily by MutSβ (15–17). Studies in human cells and yeast indicate a similar requirement for MutSβ. In human cells, RNA interference against Msh3 or Msh2 but not Msh6 substantially reduced expansion frequencies (18–20). Yeast msh3 mutants but not msh6 mutants showed a substantial reduction in expansion frequency (21) and yeast Msh3 has been shown to drive dynamic (ongoing) expansions (22). It is noteworthy that, collectively, these studies utilized starting CTG•CAG tracts ranging from 22 to 800 repeats. Thus MutSβ is the relevant eukaryotic MutS complex for CTG•CAG repeat expansions, and it can drive expansions that originate from a very wide range of repeat sizes.
The key role of MutSβ in driving expansions engenders significant interest in how the biochemical features of this protein complex cause expansions. The abundance of Msh3 is one relevant feature, judging by Msh3+/− mice (13) or RNAi knockdowns of Msh3 in human cells (18,20) where reduced Msh3 levels correlated with lower expansion frequencies. It has been assumed in these studies, but not directly tested, that reduced levels of Msh3 decrease the abundance of MutSβ. Furthermore, to our knowledge there have been no reports of the effect of Msh3 overexpression on triplet repeat expansions. Overexpression of human Msh3 has been directly shown to lead to high levels of MutSβ, with significant outcomes on DNA mismatch repair efficiency and genetic mutability (23).
A second important feature of MutSβ is its ATPase activity. Both Msh2 and Msh3 subunits bind and hydrolyze ATP (12,24–26). The ATPase activity of MutSβ is important in a misrepair model, which envisions a mismatch repair reaction at triplet repeats where DNA resynthesis goes awry to add too many repeats (27). The misrepair model predicts a requirement for ATP hydrolysis by the Msh3 subunit (26). In an attempt to address this prediction, a study by Tome and colleagues (28) examined expansions in DM1 mice with an Msh2 G674A mutation, which impairs its ATPase function. These mice showed large reductions in both inherited and somatic CTG repeat expansions. However, the Msh2-G674A protein was expressed at reduced levels, which might explain the loss of expansions as due to lower levels of MutSβ. Furthermore, the purified human MutSβ containing Msh2G674A was subsequently reported to bind ATP poorly (26), providing another possible reason for low expansion levels unrelated to ATP hydrolysis per se. Thus it remains unclear if ATP hydrolysis by Msh3 is required for driving expansions.
Polymorphisms in the Msh3 gene have also been reported as being important effectors of CTG•CAG repeat expansions. Different mouse backgrounds harboring an identical expanded HD transgene showed dramatically different proclivities towards somatic expansions (29). This phenotype was mapped to Msh3, and seven polymorphisms were described. The major effect of these polymorphisms appeared to be on Msh3 protein stability (29) although biochemical deficiencies could not be ruled out. Similarly, a human Msh3 polymorphism identified in regression studies was associated with levels of somatic instability in the blood of DM1 patients (30). This human polymorphism, T1045A, alters an amino acid close to the ATPase site of Msh3. Thus it is possible, but untested, that T1045A may alter the ATPase activity of human Msh3 and therefore affect repeat expansions (30).
The work summarized above provides information about how MutSβ abundance, Msh3 ATPase function and Msh3 polymorphisms affect CTG•CAG repeat expansions. However, the disparate experimental systems and the complication of altered Msh3 abundance in some variants have precluded more definite conclusions. The aim of the current study was to gain additional insights into the mechanism of how MutSβ promotes CTG•CAG repeat expansions in human cells. We describe the development of a novel experimental platform to more thoroughly investigate the roles of MutSβ abundance, Msh3 ATPase function and Msh3 polymorphisms.
MATERIALS AND METHODS
Shuttle vector assays and analysis of expansion or contraction frequencies
The SVG-A shuttle vector assay was previously described (18,31–33). This selective genetic assay allows examination of expansions or contractions of trinucleotide repeats that occur in human SVG-A cells during cell culture (Supplementary Figure S1). SVG-A cells are immortalized astrocytes (34,35) that support expansions in culture (18,33,36). For analysis of expansions, a shuttle vector with a CAN1 reporter was used (Supplementary Figure S1B). Similarly, contractions were assayed using the shuttle vector with URA3 as the reporter gene (Supplementary Figure S1C). Briefly, on day 0 cells were seeded at 4.0 × 10⁵ cells per 60 mm2 tissue culture dish (Sarstedt) in complete media (DMEM, 10% FBS, pen/strep, SIGMA). Forty-eight hours after seeding, cells were transfected with 7 μg of the shuttle vector in a liposome-mediated transfection using Lipofectamine 2000® as transfection agent (Invitrogen-Thermo Fisher Scientific). On day 4, cells were harvested and samples were taken for expansion/contraction assay and for Immunoblot analysis. For expansion/contraction analysis, the plasmid DNA was extracted by Hirt's alkaline lysis (37) and concentrated using Amicon Ultra 50K centrifugal filter units (Millipore). Following ethanol precipitation, purified plasmid DNA was digested by DpnI (New England Biolabs) to remove any unreplicated plasmid. DNA was then transformed into Saccharomyces cerevisiae for measurement of canavanine resistance (100 μg/ml) to assess expansions or measurement of Ura+ phenotype to measure contractions. In both cases, the number of total transformants was measured by restoration of a His+ phenotype to the cells due to the presence of HIS3 gene as a selectable marker on the shuttle vector. Expansions and contractions were confirmed by PCR as described previously (31–33). Expansion frequencies were calculated as (number His+ CanR colonies /number His+ colonies) × (fraction of events confirmed by PCR). Contraction frequencies were calculated similarly except using Ura+ instead of CanR.
Creation of Msh3−/− cell line
A homozygous Msh3−/− SVG-A cell line was created using CRISPR/Cas9. Guide RNA primers were designed to target exon 2 of Msh3 gene using the CRISPR design program available at crispr.mit.edu and synthesised by Eurofins Genomics (M3g5F-5′ TTTCTTGGCTTTATATATCTTGTGGAAAGGACGAAACACCGCAGGCCCATCATTTTCCAA-3′), (M3g5R-5′ GACTAGCCTTATTTTAACTTGCTATTTCTAGCTCTAAAACTTGGAAAATGATGGGCCTGC-3′). SVG-A cells were seeded at a density of 4.0 × 10⁵ in a 60 mm2 dish (Sarstedt) and transfected with a combination of the gRNA plasmid (Addgene), CRISPR hCas9 WT plasmid (Addgene) and a pMSCV puro resistance plasmid (Clontech Laboratories) using Lipofectamine 2000®. Forty-eight hours after transfection, the cells were re-suspended in puromycin-supplemented media (700 ng/ml) and transferred to a 10 cm2 tissue culture dish, ∼200 cells per dish. Selection for puromycin resistance was applied for 14 days and formation of single cell colonies was observed. Subsequently, selection pressure was removed and colonies were grown in complete media and subsequently screened for Msh3 protein expression by immunoblotting for Msh3 as described below. Disruption to the Msh3 gene sequence was confirmed by TA PCR and Sanger sequencing (Source Bioscience).
Creation of Msh3 derivative cell lines
To create Msh3 variant cell lines, an Msh3 expression plasmid was created using Image clone cDNA (Source Bioscience, MGC: 164408, IMAGE: 40146467) ligated into a pcDNA 3.1 neo expression plasmid vector (Thermo Fisher Scientific). ATPase mutants and polymorphic variants of Msh3 were created by site-directed mutagenesis (Q5® site directed mutagenesis kit, New England Biolabs). Primers were designed using the NEBasechanger application (New England Biolabs) and are listed in Supplementary Table S1. SVG Msh3 −/− cells were seeded at a density of 4.0 × 10⁵ in a 60 mm2 dish and co-transfected with the WT or variant Msh3 expression plasmid and a pMSCVhygro resistance plasmid (Clontech Laboratories). Forty-eight hours following transfection, cells were resuspended in hygromycin supplemented media (400 ng/ml) and diluted to 200 cells/10 cm2 dish to allow formation of colonies. Protein expression was measured in individual clones by immunoblot analysis.
Immunoblot analysis
To assess protein expression of Msh2, Msh3 and Msh6, SVG-A cells were harvested by washing in ice-cold 1× PBS (137 mM NaCl, 2.7 mM KCl, 10 mM phosphate pH 7.4) and re-suspended in 1× RIPA buffer (0.1% SDS, 0.1% Triton X-100, 0.1% sodium deoxylcholate, 5 mM EDTA, 100 mM PMSF and mammalian protease inhibitors (Fisher Scientific #12841640) at 1× concentration). Following incubation on ice for 30 min, cell pellets were disrupted in a waterbath sonicator for 4 cycles of 15 s and then centrifuged at 16 200 × g @ 4°C. Supernatants containing protein samples were retained. Protein concentrations were measured using DC-assay (Bio-Rad Laboratories). Samples containing 50–100 μg of total protein were mixed with 4× laemmli buffer (containing 20 mM DTT) at 95°C for 5 min. Following SDS-PAGE on 10% gels, proteins were transferred to a nitrocellulose membrane and blocked for 1 h at room temperature in 5% milk/PBS + 0.1% Tween. Following blocking, membranes were incubated overnight at 4°C with Msh3 primary antibody (BD Biosciences, 611390, mouse, 1/1000 dilution, targets an epitope between amino acids 136–349; or Abcam 154251, rabbit, 1/1,000 dilution, targets an epitope between residues 916–1137), Msh2 primary antibody (Calbiochem, NA26, mouse, 1/1000 dilution) or Msh6 primary antibody (BD Biosciences, 610919, Mouse, 1/1000 dilution). Incubation with Actin primary antibody (Sigma, A2066, Rabbit, 1/1000) and subsequent detection was performed simultaneously as a loading control. Following overnight incubation with primary antibodies, membranes were washed and incubated with infrared-labelled secondary antibodies from Li-Cor Biosciences, IRDye® 800CW goat anti-mouse IgG (P/N 925-32210) or IRDye® 800CW goat anti-rabbit IgG (P/N 925-3211). Immunoreactive bands were visualised and quantified using Odyssey Infrared Imaging systems and software (Li-Cor Biosciences).
Co-immunoprecipitation
SVG-A cells or derivatives were grown to near-confluence in tissue culture flasks of 175 cm2 surface area. All subsequent steps were performed at 0–4° unless otherwise noted. Cell culture media was removed and the cells were washed with PBS. Cells were scraped off into fresh PBS and collected by centrifugation at 425 × g for 5 min. Cell pellets were washed once in fresh PBS, centrifuged again and the cell pellet was drained. Whole cell lysates were prepared by adding 0.5 ml IP buffer (25 mM HEPES–KOH pH 7.5, 125 mM NaCl, 5 mM MgCl2, 0.1 mM EDTA, 0.05% Triton X-100 and mammalian protease inhibitors (Fisher Scientific #12841640) at 1× concentration). Following 30 min incubation on ice with occasional gentle pipetting, lysates were clarified by centrifugation at 15 000 × g for 20 min. Protein concentrations were determined by DC assay (Bio-Rad Laboratories). Cell lysate containing 2 mg protein was added to protein A-sepharose beads (originally 30 μl slurry; New England Biolabs #S1425S) in IP buffer to which 3 μg of anti-Msh3 antibody ab69619 (Abcam) had previously been bound. After overnight mixing of the 0.5 ml mixture, the beads were removed magnetically, and then washed three times in IP buffer. Bound proteins were eluted in 1× Laemmli SDS sample buffer at 95°C for 5 min. Protein mixtures were separated on 8% SDS-PAGE followed by immunoblotting for Msh3, Msh2 and actin as described earlier. Msh3 and Msh2 protein abundance in the immunoprecipitated samples was normalized to the value for Msh3 and Msh2 abundance from the Msh3+/+ samples.
Expression and purification of MutSβ
Human MSH3 gene encoding a glutamate to alanine substitution at amino acid residue 976 (Msh3E976A) was cloned into pFastBac-HT b using the Gibson assembly kit (New England BioLab). Wild type MutSβ (Msh2-Msh3) or MutSβ-EA (Msh2-Msh3E976A) were expressed in insect cells co-infected with baculoviruses carrying Msh2 and Msh3 or Msh2 and Msh3E976A, respectively. Both wild type and mutant MutSβ proteins were purified to near homogeneity as previously described (38). Protein concentrations were determined by Bio-Rad Protein Assay kit (Bio-Rad Laboratories, Hercules, CA, USA).
ATPase assays
ATPase activity of MutSβ proteins was assayed in 20 μL reactions containing 25 mM HEPES•KOH (pH 7.6), 4 mM MgCl2, 0.1 μCi [γ-32P]ATP, and 50 nM MutSβ or MutSβE976A in the presence or absence of 5 nM 50-mer oligonucleotide duplex containing a two-nucleotide insertion/deletion heterology. After incubation at 37°C for 20 min, the individual reactions were terminated and fractionated through a 20% denaturing polyacrylamide gel. 32P-containing species were detected by autoradiography and quantified using ImageJ.
Statistical analysis
All P-values for repeat instability and immunoprecipitation experiments were determined by one-tailed Student's t-test. Unpaired t-test was used to measure P values for ATPase assays. P- and n-values for each data set are specified in Supplementary Table S2 and, where statistical significance was reached, in the relevant figure legend.
RESULTS
Msh3−/− cells are selectively deficient for MutSβ and defective for CTG•CAG repeat expansions but not contractions
We sought to create a human cell knockout of Msh3 to selectively eliminate MutSβ. SVG-A astrocytic cells were chosen because they are one of the few tissue culture models that supports TNR expansions in culture (18,33,36). Furthermore, siRNA knockdown of Msh2 or Msh3 reduce expansion frequencies in these cells, indicating that MutSβ is important for expansions (18). In vivo, astrocytes, like neurons, show expansions in HD patients (39). Exon 2 of the Msh3 gene was targeted by CRISPR/Cas9 (Figure 1A). Potential knockouts were screened by immunoblot for loss of Msh3 protein expression. A candidate clone was further analysed by DNA sequencing. This clone showed a nine-base pair deletion in Msh3 that eliminates the codons for amino acids 116–118. More extensive immunoblotting with an antibody raised against amino acids 136–349 of Msh3 revealed loss of protein expression (Figure 1B and C), consistent with creation of an Msh3−/− cell line. Quantification indicated a residual level of Msh3 protein at 2% wild type levels (Figure 1C). The loss of Msh3 expression was confirmed by immunoblot using a second anti-Msh3 antibody raised against amino acids 916–1137 (Supplementary Figure S2). Expression of Msh2 and Msh6 proteins appeared somewhat elevated in Msh3−/− cells, although the change was not statistically significant compared to wild type cells (Figure 1C). Similar to previous reports in cancer cell lines (40,41), cell growth is not detectably affected by loss of Msh3 (Figure 1D). This Msh3−/− cell line was chosen for further characterization.
Figure 1.

Loss of Msh3 causes a defect in CTG repeat expansions but not contractions. (A) Schematic showing predicted CRISPR/Cas9 cut site in exon 2 of human Msh3 gene. Sequencing results show in-frame nine base pair deletion with corresponding loss of codons for amino acids 116–118. (B) Representative immunoblot with an antibody against Msh3 residues 136–349, showing loss of Msh3 expression in Msh3−/−cells in comparison to Msh3+/+ wild type cell line. Expression of Msh2 and Msh6 was retained. (C) Quantitative analysis of Msh protein expression in Msh3+/+ and Msh3−/−cell line, normalised to actin and relative to Msh3+/+. n = 9 for Msh3 levels; n = 7 for Msh3+/+Msh2 and Msh6 protein levels; and n = 6 for Msh3−/−Msh2 and Msh6 protein levels. *P = 2.23 × 10⁻²⁰. (D) Growth curve analysis of Msh3+/+and Msh3−/−cell lines, n = 3. (E) Expansion frequencies of Msh3+/+and Msh3−/− cell lines, n = 3 for Msh3+/+and n = 4 for Msh3−/−, *P = 0.0019. (F) Contraction frequencies of Msh3+/+and Msh3−/− cell lines, n = 3. For panels C-F, error bars denote ±SEM.
(CTG•CAG)22 expansion frequency of the Msh3−/− cells was measured in parallel to the starting wild type Msh3+/+ cells (Supplementary Figure S1B). Msh3−/− cells were defective for expansions, losing approximately three-quarters of activity (Figure 1E). This loss in expansion activity is consistent with results from mouse knockouts of Msh3, human cell knockdowns and yeast mutants (9,12,13,18–21). The size range of expansions, from +4 to +10 repeats, was similar in both the Msh3−/− cells and the wild type cell control, consistent with the idea that loss of Msh3 blocks expansions approximately equally across this size range. Expansions were not completely eliminated in the Msh3−/−cell line (Figure 1E). As discussed later, other proteins may be responsible for a minor fraction of triplet repeat expansions in human cells.
The role of MutSβ in TNR contractions is less clear. Some mouse knockouts of Msh3 show a CTG•CAG repeat contraction bias in Msh3−/− animals (13) whereas other lines do not (9,12,14). Biochemical studies in human cell extracts led to the conclusion that CTG•CAG repeat contractions were enhanced in the absence of MutSβ (42). We therefore examined the Msh3−/− SVG-A cells for contractions (Supplementary Figure S1C). The results showed no significant change in contraction frequency between Msh3−/− cells and wild type (Figure 1F).
In summary, this approach led to a human Msh3−/− cell line that is selectively deficient in MutSβ, while the Msh2 and Msh6 components of MutSα are left intact. The Msh3−/− cells are defective in CTG•CAG repeat expansions but not contractions.
Overexpression of Msh3 causes an increase in expansion frequency and drives increased MutSβ formation
The Msh3−/− cells provide a cellular platform for adding back Msh3 expressed from plasmids and selection of stable integrants. This allows expression of wild type or variant Msh3 at controllable levels as a way to measure the biochemical activity of MutSβ on expansion activity. In this way, direct comparisons can be made between situations where MutSβ is altered.
Msh3 abundance in mice is limiting for expansion activity, based on partial loss of expansions in Msh3+/− animals where Msh3 abundance is reduced (13). To see if Msh3 overexpression drives elevated levels of expansions, Msh3−/− cells were transfected with a cDNA clone encoding wild type Msh3. Stable integrants that express higher than normal levels of the protein were identified by immunoblot. The Msh31.7X cell line restored Msh3 expression to 1.7 times wild type expression (Figure 2A and B). Msh2 and Msh6 protein expression were somewhat elevated compared to wild type but only the Msh6 abundance was statistically significantly altered (Figure 2B). It is unclear why the abundance of Msh2 and Msh6 was elevated in these cells. There was no detectable difference in cell growth rate upon over-expression of Msh3 (Supplementary Figure S3). When assayed for expansions, the overexpressing cells showed a significant increase in expansions compared to the Msh3−/− background (Figure 2C). This indicates rescue of the expansion phenotype in the Msh31.7X cells. Msh3 overexpression also led to an increased expansion frequency compared to wild type cells, although this difference was not statistically significant. The results are consistent with a direct relationship between Msh3 abundance and CTG•CAG expansion frequency (Figure 2C). The range of expansion sizes was similar between wild type and overexpressing cells (+4 to +10 repeats, Msh3+/+; +4 to +12 repeats Msh31.7X), as was the weighted average expansion size (+6.8 repeats, Msh3+/+; +7.2 repeats Msh31.7X). In contrast to the effects on expansion frequencies, there was no significant difference detected in contraction frequency in Msh31.7X cells compared to wild type controls (Figure 2D).
Figure 2.

Msh3 overexpression cell line shows increased expansion frequency and increased MutSβ formation with no effect on contraction frequency. (A) Representative immunoblot showing Msh3 protein expression in Msh3 add-back cell line (Msh31.7X) in comparison to Msh3+/+and Msh3−/− cell lines. (B) Quantitative analysis of Msh3 protein expression normalised to actin and relative to Msh3+/+cell line. Msh3 add-back cell line has an average Msh3 expression level of 1.7 times wild type expression. n = 9 for Msh3 protein expression in all cell lines, n = 7 for Msh2 and Msh6 protein levels in Msh3+/+ cell lines, n = 6 for Msh2 and Msh6 protein levels in Msh3−/− cell line and n = 5 for Msh2 and Msh6 protein levels in Msh31.7xcell line. *P = 2.23 × 10⁻²⁰ and **P = 1.87 × 10⁻⁶, both compared to Msh3 level in Msh3+/+cells. ***P = 0.032 compared to Msh6 level in Msh3+/+cells. (C) Expansion frequencies for Msh3−/−, Msh3+/+ and Msh31.7Xcell lines. n = 4 for Msh3−/−and n = 3 for Msh3+/+and Msh31.7X. *P = 0.029 compared to wild type. (D) Contraction frequencies of Msh3−/−, Msh3+/+and Msh31.7Xcell lines, n = 3. (E) Representative immunoblot for co-immunoprecipitation of Msh3 and Msh2 and investigation of MutSβ formation in Msh3−/−, Msh3+/+ and Msh32.9X cell lines. (F) Quantitative analysis of immunoprecipitated Msh3 and Msh2 protein abundance, n = 4 for all samples. *P = 5.44 × 10⁻¹³ for Msh3 and P = 4.30 × 10⁻¹¹ for Msh2 compared to wild type; and **P = 1.66 × 10⁻⁴ for Msh3 and P = 4.96 × 10⁻³ for Msh2 compared to wild type. For panels B, C, D and F error bars denote ±SEM.
To evaluate whether the abundance of MutSβ complex parallels Msh3 levels, co-immunoprecipitation (co-IP) was performed using antibodies against Msh3, followed by immunoblot analysis of Msh3 and Msh2 (Figure 2E). Control experiments showed that this protocol was efficient, capturing 84 ± 11% of all Msh3 (Supplementary Figure 4). To test MutSβ abundance, an Msh32.9X cell line expressing Msh3 at 2.9× wild type levels was utilized for greater sensitivity. The input samples show the expected gradation of Msh3 abundance, whereas Msh2 levels were approximately equal (Figure 2E). In the co-IP samples, however, the levels of Msh3 and Msh2 both increase, consistent with a higher abundance of MutSβ complex (Figure 2E). Quantitative analysis (n = 4) showed that increased expression of Msh3 at 2.9× wild type levels resulted in more MutSβ complex formation at 2.8× normal levels (Figure 2F). We conclude that add-back cells overexpressing Msh3 form higher levels of MutSβ complex and exhibit enhanced frequency of CTG•CAG repeat expansions. Like the Msh31.7X cell line, the contraction frequency with the Msh32.9Xcells (0.021; P = 0.29, n = 3) was not significantly different from Msh3+/+ control cells (0.026).
Data from the co-IP in Msh3+/+ cells allowed an estimation of the normal abundance of MutSβ compared to MutSα. By quantifying the Msh3 and Msh2 levels in the input and flow-through fractions of the co-IP protocol, the proportion of Msh2 protein present in MutSβ can be estimated (Supplementary Figure S4A). One example of primary data gave a value of 27% of all Msh2 protein captured as MutSβ (Supplementary Figure S4B). Overall results (n = 4) showed that 26 ± 6% of total Msh2 was complexed in MutSβ in SVG-A cells, giving an estimation of the ratio of 26% MutSβ to 74% MutSα (Supplementary Figure S4C). These values are in reasonable agreement with the report by Drummond et al. (23) that ∼15% of total Msh2 in HL-60 cells is complexed with Msh3 as MutSβ, with the remaining 85% complexed with Msh6 to form MutSα.
Msh3 ATP hydrolysis activity is required for CTG•CAG repeat expansions
Both Msh2 and Msh3 subunits of MutSβ bind and hydrolyse ATP (12,24–26). To investigate the requirement for Msh3 ATPase function in expansions, the codon for glutamate 976 was mutated to alanine (E976A) in the cDNA plasmid encoding Msh3 (Figure 3A). This creates an Msh3 Walker B mutant that is predicted to bind ATP but be defective for hydrolysis. This prediction is based in part on biochemical analysis of purified yeast MutSα protein bearing the equivalent E768A alteration in Msh2; this protein was shown to be proficient for binding ATP but defective in its hydrolysis (43–45). The human Msh3E976A plasmid was transfected into Msh3−/− cells and stable integrants were screened by immunoblot to identify clones that expressed Msh3 at near wild-type levels. A clone was chosen with Msh3E976A protein levels indistinguishable (101%; n = 4) from wild type (Figure 3B). This clone allows measurement of the requirement for Msh3 ATPase function in expansions at normal levels of the protein. There was no significant cell growth difference observed when compared with Msh3+/+ cell line (Supplementary Figure S5A). Analysis of MutSβ complex formation in Msh3E976A cells, measured by co-IP and subsequent immunoblot analysis, reveals that there is MutSβ complex formation in the Msh3E976A cell line (Figure 3C) but at ∼50–70% the level compared to Msh3+/+ (Supplementary Figure S5B). Thus, the E976A variant appears partially defective in forming or maintaining a stable MutSβ complex. In contrast to the partial defect in MutSβ stability, the Msh3E976A cell line showed a strong deficiency in expansions (Figure 3D). The extent of this expansion defect by Msh3E976A cells was comparable in magnitude to that seen in the Msh3−/− line (Figure 1E). This finding suggests that ATP hydrolysis by Msh3 is required for CTG•CAG repeat expansions in this system. In contrast to expansions, there was no statistically significant difference (P = 0.06) in contraction frequencies between Msh3E976A cells and wild type controls (Figure 3E). To test whether Msh3E976A protein is defective in ATPase function, both wild type MutSβ and the mutant complex containing Msh3E976A were purified and assayed for ATPase function. Representative assay results showed that wild type MutSβ was active as an ATPase and that this activity could be moderately stimulated in the presence of a two-nucleotide insertion/deletion mispair (Figure 3F). In contrast, MutSβ-Msh3E976A showed only partial ATPase activity with little stimulation by mismatched DNA. Cumulative results from three independent assays confirmed that MutSβ-Msh3E976A ATPase activity is significantly reduced compared to wild type protein under these assay conditions (Figure 3G).
Figure 3.

Msh3E976A ATPase Walker B mutant shows a decreased expansion frequency compared to Msh3+/+ wild type. (A) Schematic showing Walker B motif consensus sequence and the E976A mutation, ‘h’ denotes any hydrophobic amino acid. (B) Representative immunoblot showing Msh protein expression in Msh3+/+ and Msh3E976Acell lines. Msh3E976A cells show Msh3 expression at near wild type levels. (C) Representative immunoblot of co-immunoprecipitation of Msh3 and Msh2 and MutSβ formation in Msh3+/+and Msh3E976A cell lines. (D) Expansion frequencies for Msh3E976A cell line in comparison to Msh3+/+, n = 3, *P = 0.037. (E) Contraction frequencies of Msh3E976Aand Msh3+/+ cell lines, n = 5 for Msh3+/+and n = 4 for Msh3E976A. (F) Representative ATPase analysis of MutSβ and MutSβ-Msh3E976A (MutSβ EA) in the absence or presence of mismatched DNA containing a two-nucleotide insertion/deletion mispair. Pi, [32P]phosphate. (G) Average ATP hydrolysis activity, n = 3. *P = 0.028 compared to wild type MutSβ assayed without DNA (unshaded bars); **P = 0.001 compared to wild type MutSβ assayed with DNA (shaded bars). For panels D, E and G, error bars denote ±SEM.
Normal levels of expansions in two naturally-occurring polymorphic variants of Msh3
Studies of TNR expansions in different strains of mice showed variable expansion frequencies due to natural polymorphisms in Msh3 (29). One polymorphism, mouse Msh3T321I, falls in a highly conserved region and the isoleucine variant was proposed to destabilize the protein, thus causing lower expansion frequencies due to reduced abundance of Msh3 (29). To distinguish protein abundance from potential biochemical alterations due to this polymorphism, we created the equivalent change to human Msh3, T363I (Figure 4A). Similarly we tested another Msh3 variant, T1045A, where the threonine variant is associated with higher levels of somatic instability in DM1 patients (30). Our clone of human Msh3 encodes threonine at position 1045, therefore we created the T1045A variant (Figure 4A) and looked for a decrease in expansions.
Figure 4.
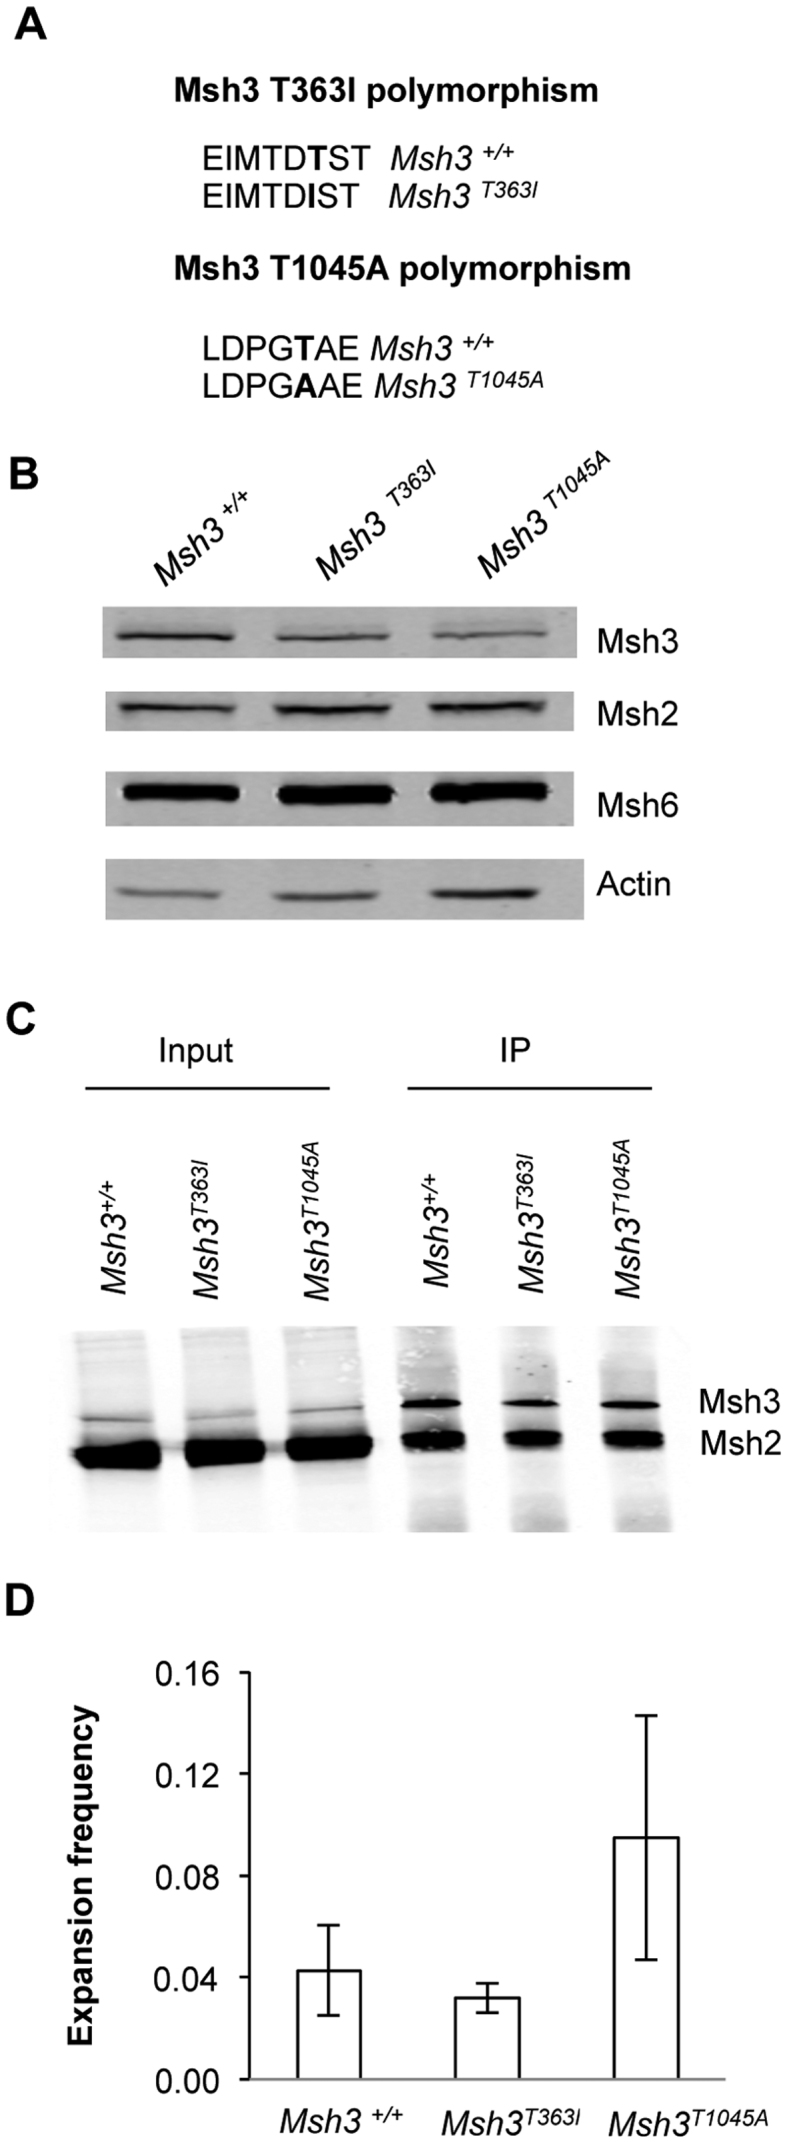
Msh3 polymorphic cell lines show no significant difference in expansion frequency in comparison to Msh3+/+ cell line. (A) Schematic showing polymorphic changes to Msh3 sequence. (B) Representative immunoblot showing Msh protein expression in Msh3T363Iand Msh3T1045Acell lines at comparable expression levels to Msh3+/+wild type cells. (C) Representative immunoblot of co-immunoprecipitated Msh3 and Msh2 showing MutSβ complex formation in Msh3T363Iand Msh3T1045A cell lines alongside Msh3+/+cells. (D) Expansion frequencies for polymorphic Msh3 cell lines assayed in parallel to Msh3+/+. Error bars denote ±SEM, n = 3.
Cell lines were identified that express either Msh3T363I or Msh3T1045A in the Msh3−/− cell background at levels as close as possible to wild type levels of protein (Figure 4B). Msh3 abundance was estimated by immunoblot at 75% (T363I) and 71% (T1045A) compared to wild type (Supplementary Figure S6A). MutSβ complex formation was observed in both cell lines (Figure 4C). Quantification showed that MutSβ abundance was reduced in Msh3 T363I cells to ∼60–90% of wild type control (Supplementary Figure S6B), in line with the expression levels of the variant Msh3 proteins. There was no apparent difference in cell growth of the Msh3T363I or Msh3T1045A cell lines in comparison to the Msh3+/+cell line (Supplementary Figure S6C). When assayed for expansions, there was no statistically significant difference observed in expansion frequency between the polymorphic cell lines and Msh3+/+cell line (Figure 4D). We note that the prediction for the Msh3T1045A cells was for fewer expansions. These results are consistent with a previous conclusion (29) that the major effect of the mouse T321I polymorphism (T363I in human) is on Msh3 abundance.
DISCUSSION
This study addressed several previously untested aspects of MutSβ that are relevant to its ability to promote CTG•CAG repeat expansions in human cells. The approach was to create a novel cell platform that is selectively deficient in MutSβ by using CRISPR/Cas9 to knock out Msh3. The resulting Msh3−/− cells were largely defective in driving expansions. This Msh3−/− cell line allowed add back of plasmids expressing Msh3 to test key biochemical features of MutSβ in a single, isogenic system that directly measures CTG•CAG repeat expansions as the key functional outcome. Moreover, the steady state levels of Msh3 could be controlled to separate the effects of MutSβ abundance from potential biochemical changes in the variant forms of Msh3 that were tested. We show for the first time that MutSβ overabundance due to overexpression of Msh3 tends to drive expansions to high levels, indicating that expansions are normally limited in these cells by the levels of MutSβ. Our results also show that the expansion-promoting properties of MutSβ require the ability of Msh3 to hydrolyze ATP. The add back of two naturally occurring polymorphic variants of Msh3 gave results consistent with the idea that the major effect of these variations is on MutSβ abundance. The mechanistic implications of these findings are discussed below.
The Msh3−/− cells are ∼98% deficient in Msh3 based on DNA sequencing and immunoblotting with two different anti-Msh3 antibodies. We presume the residual signal is due to low levels of mutant Msh3, although it is difficult to rule out the possibility of a non-specific signal. The cells grow at normal rates and the components of MutSα are still expressed (Figure 1), thus the cells are selectively deficient in MutSβ. Expansion assays of the Msh3−/− cells, in parallel to the wild type Msh3+/+ cell line, showed a ∼75% reduction in expansion activity upon loss of Msh3 expression. Thus a large majority of CTG•CAG repeat expansions are dependent on MutSβ, similar to numerous findings in mouse knockout studies of Msh3 (9,12–14), siRNA knockdowns in human cells (18–20) and msh3 mutants in yeast (21). The residual ∼25% of expansions seen in Msh3−/− cells might be attributable to other pathways of expansion. For example, residual germline expansions in Msh3−/− Fragile X mice were attributed to the activity of MutSα (16,17). Nevertheless there is a striking reduction in expansions in Msh3−/− cells that are selectively deficient for MutSβ.
Another key question centers on MutSβ abundance and its role in promoting expansions in human cells. A study using Msh3+/− heterozygous mice showed that reduced Msh3 abundance was associated with a decrease in expansions (13), suggesting that expansions are limited by the level of Msh3 protein, and by inference, MutSβ. A separate question is whether the normal abundance of MutSβ limits expansions. To address this, we created cell lines that overexpress Msh3 (Figure 2). There was a clear increase in expansion activity for the Msh31.7X cells over the Msh3−/− line, indicating rescue of the expansion defect by add back of wild type Msh3. Expansions in Msh31.7X cells were also elevated over wild type, although not to a statistically significant degree. Expansion activity in the series Msh3−/−, wild type and Msh31.7X cells is consistent with a dose-dependent relationship between Msh3 abundance and expansion frequency above wild type levels (Figure 2C). Another overexpressing cell line, Msh32.9x, showed high levels of MutSβ complex formation, thus proving the assumption that higher levels of Msh3 increase the abundance of MutSβ. The direct correlation between Msh3 overexpression and enhanced abundance of MutSβ is consistent with a previous report (23). Overall, these findings support the conclusion that increased Msh3 abundance, leading to increased levels of MutSβ complex, directly affects the likelihood of CTG•CAG expansions in human cells.
To address another key but untested feature of expansion mechanism, we investigated the ability of Msh3 to hydrolyze ATP. This experiment tested the misrepair model of expansions (27), which predicts that Msh3 must both bind and hydrolyze ATP (26). A previous study in mice investigated Msh2 ATPase function using the Msh2G674A mutant and found that animals harboring this mutant were defective for expansions. However, the mutant Msh2 was expressed at lower levels than wild type, indicating that the expansion defect might be due to MutSβ abundance (28). Moreover, biochemical studies using purified MutSβ containing the mutant Msh2 protein showed a decreased ability to bind ATP (26). Thus, it has not been possible to distinguish clearly between protein abundance issues, nor between ATP hydrolyis versus binding, on expansions. We created a mutation in the Walker B motif, Msh3E976A, to help address this conundrum (Figure 3). The glutamate in the Walker B motif is required for efficient hydrolysis; upon mutation of this glutamate, hydrolysis of ATP is ablated but binding is unaffected (46). Biochemical studies of purified yeast MutSα proved that mutant Msh2 protein carrying the Walker B E768A alteration caused defects in hydrolysis but not binding of ATP (43–45). Our Msh3E976A cell line expresses Msh3E976A at 100% of wild type levels, thus avoiding the issue of Msh3 protein abundance. Msh3E976A forms MutSβ complex although at 50–70% wild type level. This suggests a partial defect in MutSβ complex formation and/or maintenance in Msh3E976Acells, perhaps due to increased dissociation of Msh3E976A from Msh2. In contrast to the partial defect in MutSβ formation, the Msh3E976A cells showed a much more severe loss in expansion activity, down to a level that is comparable to the Msh3−/− cells. ATPase assays on purified proteins showed the E976A alteration significantly reduced hydrolysis activity compared to wild type control protein. We interpret this to mean that ATP hydrolysis by Msh3 is required for the majority of CTG•CAG repeat expansions in human cells, consistent with the misrepair model for TNR expansions (26,27). The misrepair model is also consistent with the requirement for the MutL homologs Pms2, Mlh1 and Mlh3 in driving expansions, as evidenced by the reduced frequency of somatic expansions in knockout mice (27,47).
The cell system described here also allowed further investigation of the recent discovery of naturally occuring Msh3 polymorphic variants that impact expansion activity (Figure 4). We tested two polymorphic variants: human Msh3T363I to mimic mouse Msh3T321I, which was suggested to contribute to protein stability (29); and Msh3T1045A, where the alanine variant is predicted to reduce expansion frequencies. Both cell lines, Msh3T363I and Msh3T1045A, have slightly lower Msh3 protein expression and MutSβ complex formation as wild type Msh3+/+cells. However, there was no detectable difference in expansion frequencies compared to wild type controls, suggesting that the variable expansion frequencies observed in studies of mouse and human Msh3 polymorphisms were more likely due to decreased Msh3 abundance rather than a biochemical defect. It is noted that our human Msh3 expression clone carries a mixture of polymorphisms, with some amino acids correlating with high expansion frequencies in mouse and other positions that correlate with low frequencies of expansion. Thus it is possible that changing just one polymorphic site, T363I, may not be sufficient to reveal a strong expansion phenotype. Regarding the human variant, T1045A, inspection of the MutSβ crystal structure shows that position 1045 is in an unstructured stretch of 17 amino acids that is poorly conserved between MutS homologs (25). We infer that T1045A likely does not affect ATP hydrolysis based on the observation that Msh3T1045A cells retain normal levels of expansions, in contrast to the loss of expansions in cells containing the Walker B motif mutation Msh3E976A.
In contrast to effects on CTG•CAG repeat expansions, assays of contractions showed no significant difference in contraction frequencies between Msh3−/− cells, wild type cells, Msh3 overexpressing cells or Msh3E976A cells. This result concurs with most (9,12,14) but not all (13) previous reports of Msh3 knockout mice where no major changes to inherited or somatic contractions were found. We also note that contractions in human cells are also independent of Mlh1 expression (31). In our hands, loss of either the MutS homolog Msh3 or the MutL homolog Mlh1 did not affect contractions. We acknowledge the limited range of contractions that can be scored by this assay, from -6 to -33 repeats (Supplementary Figure S1C). Contractions smaller than –6 repeats or greater than –33 repeats would not be revealed. It is also noted that our shuttle vector assay is driven by SV40 large T antigen, not the normal CDC45-MCM-GINS helicase, raising the possibility that mismatch repair proteins may not interact identically with the replication complex on the shuttle vector. Alternatively, it is conceivable that the shuttle vector assay primarily reports events during the first replication cycle of the SV40-based plasmid, when its immature chromatin structure (48) could mask the activity of MutSβ on contractions.
Supplementary Material
ACKNOWLEDGEMENTS
The authors thank Eleanor Glancy for assistance with CRISPR/Cas9, Lucy Kirkham-McCarthy for assistance with site-directed mutagenesis and Corrado Santocanale for helpful comments on the manuscript.
SUPPLEMENTARY DATA
Supplementary Data are available at NAR Online.
FUNDING
Science Foundation Ireland [10/IN.1/B2973 to R.S.L]; Irish Research Council Government of Ireland Postgraduate award [GOIPG/2013/638]; Beckman fund scholarship, National University of Ireland Galway and the Thomas Crawford Hayes fund, National University of Ireland Galway [all to N.K]; National Institutes of Health [R01GM112702 to G.-M.L., T32ES02766 to K.C.]. Funding for open access charge: Irish Research Council.
Conflict of interest statement. None declared.
REFERENCES
- 1. Orr H.T., Zoghbi H.Y.. Trinucleotide repeat disorders. Annu. Rev. Neurosci. 2007; 30:575–621. [DOI] [PubMed] [Google Scholar]
- 2. Lopez Castel A., Cleary J.D., Pearson C.E.. Repeat instability as the basis for human diseases and as a potential target for therapy. Nat. Rev. Mol. Cell. Biol. 2010; 11:165–170. [DOI] [PubMed] [Google Scholar]
- 3. McMurray C.T. Mechanisms of trinucleotide repeat instability during human development. Nat. Rev. Genet. 2010; 11:786–799. [DOI] [PMC free article] [PubMed] [Google Scholar]
- 4. Zhao X.-N., Usdin K.. The repeat expansion diseases: the dark side of DNA repair. DNA Repair. 2015; 32:96–105. [DOI] [PMC free article] [PubMed] [Google Scholar]
- 5. Palombo F., Iaccarino I., Nakajima E., Ikejima M., Shimada T., Jiricny J.. hMutSbeta, a heterodimer of hMSH2 and hMSH3, binds to insertion/deletion loops in DNA. Curr. Biol. 1996; 6:1181–1184. [DOI] [PubMed] [Google Scholar]
- 6. Acharya S., Wilson T., Gradia S., Kane M.F., Gerrette S., Marsischky G.T., Kolodner R., Fishel R.. hMSH2 forms specific mispair-binding complexes with hMSH3 and hMSH6. Proc. Natl. Acad. Sci. U.S.A. 1996; 93:13629–13634. [DOI] [PMC free article] [PubMed] [Google Scholar]
- 7. Manley K., Shirley T.L., Flaherty L., Messer A.. Msh2 deficiency prevents in vivo somatic instability of the CAG repeat in Huntington disease transgenic mice. Nat. Genet. 1999; 23:471–473. [DOI] [PubMed] [Google Scholar]
- 8. Kovtun I.V., McMurray C.T.. Trinucleotide expansion in haploid germ cells by gap repair. Nat. Genet. 2001; 27:407–411. [DOI] [PubMed] [Google Scholar]
- 9. van den Broek W.J.A.A., Nelen M.R., Wansink D.G., Coerwinkel M.M., te Riele H., Groenen P.J.T.A., Wieringa B.. Somatic expansion behaviour of the (CTG)n repeat in myotonic dystrophy knock-in mice is differentially affected by Msh3 and Msh6 mismatch-repair proteins. Hum. Mol. Genet. 2002; 11:191–198. [DOI] [PubMed] [Google Scholar]
- 10. Savouret C., Brisson E., Essers J., Kanaar R., Pastink A., te Riele H., Junien C., Gourdon G.. CTG repeat instability and size variation timing in DNA repair-deficient mice. EMBO J. 2003; 22:2264–2273. [DOI] [PMC free article] [PubMed] [Google Scholar]
- 11. Wheeler V.C., Lebel L.-A., Vrbanac V., Teed A., te Riele H., MacDonald M.E.. Mismatch repair gene Msh2 modifies the timing of early disease in HdhQ111 striatum. Hum. Mol. Genet. 2003; 12:273–281. [DOI] [PubMed] [Google Scholar]
- 12. Owen B.A.L., Yang Z., Lai M., Gajek M., Badger J.D. II, Hayes J.J., Edelman W., Kucherlapati R., Wilson T.M., McMurray C.T.. (CAG)n-hairpin DNA binds to Msh2-Msh3 and changes properties of mismatch recognition. Nat. Struct. Mol. Biol. 2005; 12:663–670. [DOI] [PubMed] [Google Scholar]
- 13. Foiry L., Dong L., Savouret C., Hubert L., te Riele H., Junien C., Gourdon G.. Msh3 is a limiting factor in the formation of intergenerational CTG expansions in DM1 transgenic mice. Hum. Genet. 2006; 119:520–526. [DOI] [PubMed] [Google Scholar]
- 14. Dragileva E., Hendricks A., Teed A., Gillis T., Lopez E.T., Friedberg E.C., Kucherlapati R., Edelmann W., Lunetta K.L., MacDonald M.E. et al. Intergenerational and striatal CAG repeat instability in Huntington's disease knock-in mice involve different DNA repair genes. Neurobiol. Dis. 2009; 33:37–47. [DOI] [PMC free article] [PubMed] [Google Scholar]
- 15. Lokanga R.A., Zhao X.N., Usdin K.. The mismatch repair protein MSH2 is rate limiting for repeat expansion in a fragile X premutation mouse model. Hum. Mutat. 2014; 35:129–136. [DOI] [PMC free article] [PubMed] [Google Scholar]
- 16. Zhao X.-N., Kumari D., Gupta S., Wu D., Evanitsky M., Yang W., Usdin K.. MutSβ generates both expansions and contractions in a mouse model of the Fragile X-associated disorders. Hum. Mol. Genet. 2015; 24:7087–7096. [DOI] [PMC free article] [PubMed] [Google Scholar]
- 17. Zhao X.N., Lokanga R., Allette K., Gazy I., Wu D., Usdin K.. A MutSβ-Dependent Contribution of MutSα to Repeat Expansions in Fragile X Premutation Mice?. PLoS genetics. 2016; 12:e1006190. [DOI] [PMC free article] [PubMed] [Google Scholar]
- 18. Gannon A.-M.M., Frizzell A., Healy E., Lahue R.S.. MutSβ and histone deacetylase complexes promote expansions of trinucleotide repeats in human cells. Nucleic Acids Res. 2012; 40:10324–10333. [DOI] [PMC free article] [PubMed] [Google Scholar]
- 19. Du J., Campau E., Soragni E., Jespersen C., Gottesfeld J.M.. Length-dependent CTG·CAG triplet-repeat expansion in myotonic dystrophy patient-derived induced pluripotent stem cells. Hum. Mol. Genet. 2013; 22:5276–5287. [DOI] [PMC free article] [PubMed] [Google Scholar]
- 20. Nakatani R., Nakamori M., Fujimura H., Mochizuki H., Takahashi M.P.. Large expansion of CTG•CAG repeats is exacerbated by MutSβ in human cells. Sci. Rep. 2015; 5, doi:10.1038/srep11020. [DOI] [PMC free article] [PubMed] [Google Scholar]
- 21. Kantartzis A., Williams G.M., Balakrishnan L., Roberts R.L., Surtees J.A., Bambara R.A.. Msh2-Msh3 interferes with Okazaki fragment processing to promote trinucleotide repeat expansions. Cell Rep. 2012; 2:216–222. [DOI] [PMC free article] [PubMed] [Google Scholar]
- 22. Williams G.M., Surtees J.A.. MSH3 promotes dynamic behavior of trinucleotide repeat tracts in vivo. Genetics. 2015; 200:737–754. [DOI] [PMC free article] [PubMed] [Google Scholar]
- 23. Drummond J.T., Genschel J., Wolf E., Modrich E.. DHFR/MSH3 amplification in methotrexate-resistant cells alters the hMutSalpha/hMutSbeta ratio and reduces the efficiency of base-base mismatch repair. Proc. Natl. Acad. Sci. U.S.A. 1997; 94:10144–10149. [DOI] [PMC free article] [PubMed] [Google Scholar]
- 24. Tian L., Gu L., Li G.-M.. Distinct nucleotide binding/hydrolysis properties and molar ratio of MutSalpha and MutSbeta determine their differential mismatch binding activities. J. Biol. Chem. 2009; 284:11557–11562. [DOI] [PMC free article] [PubMed] [Google Scholar]
- 25. Gupta S., Gellert M., Yang W.. Mechanism of mismatch recognition revealed by human MutSβ bound to unpaired DNA loops. Nat. Struct. Mol. Biol. 2011; 19:72–78. [DOI] [PMC free article] [PubMed] [Google Scholar]
- 26. Lang W.H., Coats J.E., Majka J., Hura G.L., Lin Y., Rasnik I., McMurray C.T.. Conformational trapping of mismatch recognition complex MSH2/MSH3 on repair-resistant DNA loops. Proc. Natl. Acad. Sci. U.S.A. 2011; 108:E837–E844. [DOI] [PMC free article] [PubMed] [Google Scholar]
- 27. Gomes-Pereira M., Fortune M.T., Ingram L., McAbney J.P., Monckton D.G.. Pms2 is a genetic enhancer of trinucleotide CAG•CTG repeat somatic mosaicism: implications for the mechanism of triplet repeat expansion. Hum. Mol. Genet. 2004; 13:1815–1825. [DOI] [PubMed] [Google Scholar]
- 28. Tome S., Holt I., Edelmann W., Morris G.E., Munnich A., Pearson C.E., Gourdon G.. MSH2 ATPase domain mutation affects CTG•CAG repeat instability in transgenic mice. PLoS Genet. 2009; 5:e1000482. [DOI] [PMC free article] [PubMed] [Google Scholar]
- 29. Tome S., Manley K., Simard J.P., Clark G.W., Slean M.M., Swami M., Shelbourne P.F., Tillier E.R.M., Monckton D.G., Messer A. et al. MSH3 polymorphisms and protein levels affect CAG repeat instability in Huntington's disease mice. PLoS Genet. 2013; 9:e1003280. [DOI] [PMC free article] [PubMed] [Google Scholar]
- 30. Morales F., Vasquez M., Santamaria C., Cuenca P., Corrales E., Monckton D.G.. A polymorphism in the MSH3 mismatch repair gene is associated with the levels of somatic instability of the expanded CTG repeat in the blood DNA of myotonic dystrophy type 1 patients. DNA Repair. 2016; 40:57–66. [DOI] [PubMed] [Google Scholar]
- 31. Pelletier R., Farrell B.T., Miret J.J., Lahue R.S.. Mechanistic features of CAG•CTG repeat contractions in cultured cells revealed by a novel genetic assay. Nucleic Acids Res. 2005; 33:5667–5676. [DOI] [PMC free article] [PubMed] [Google Scholar]
- 32. Farrell B.T., Lahue R.S.. CAG•CTG repeat instability in cultured human astrocytes. Nucleic Acids Res. 2006; 34:4495–4505. [DOI] [PMC free article] [PubMed] [Google Scholar]
- 33. Debacker K., Frizzell A., Gleeson O., Kirkham-McCarthy L., Mertz T., Lahue R.S.. Histone deacetylase complexes promote trinucleotide repeat expansions. PLoS Biol. 2012; 10:e1001257. [DOI] [PMC free article] [PubMed] [Google Scholar]
- 34. Major E.O., Miller A.E., Mourrain P., Traub R.G., de Widt E., Sever J.. Establishment of a line of human fetal glial cells that supports JC virus multiplication. Proc. Natl. Acad. Sci. U.S.A. 1985; 82:1257–1261. [DOI] [PMC free article] [PubMed] [Google Scholar]
- 35. Gee G.V., Manley K., Atwood W.J.. Derivation of a JC virus-resistant human glial cell line: implications for the identification of host cell factors that determine viral tropism. Virology. 2003; 314:101–109. [DOI] [PubMed] [Google Scholar]
- 36. Claassen D.A., Lahue R.S.. Expansions of CAG•CTG repeats in immortalized human astrocytes. Hum. Mol. Genet. 2007; 16:3088–3096. [DOI] [PubMed] [Google Scholar]
- 37. Hirt B. Selective extraction of polyoma DNA from infected mouse cell cultures. J. Mol. Biol. 1967; 26:365–369. [DOI] [PubMed] [Google Scholar]
- 38. Zhang Y., Yuan F., Presnell S.R., Tian K., Gao Y., Tomkinson A.E., Gu L., Li G.-M.. Reconstitution of 5′-directed human mismatch repair in a purified system. Cell. 2005; 122:693–705. [DOI] [PubMed] [Google Scholar]
- 39. Shelbourne P.F., Keller-McGandy C., Bi W.L., Yoon S.R., Dubeau L., Veitch N.J., Vonsattel J.P., Wexler N.S., Group U.-V.C.R., Arnheim N. et al. Triplet repeat mutation length gains correlate with cell-type specific vulnerability in Huntington disease brain. Hum. Mol. Genet. 2007; 16:1133–1142. [DOI] [PubMed] [Google Scholar]
- 40. Hinz J.M., Meuth M.. MSH3 deficiency is not sufficient for a mutator phenotype in Chinese hamster ovary cells. Carcinogenesis. 1999; 20:215–220. [DOI] [PubMed] [Google Scholar]
- 41. Takahashi M., Koi M., Balaguer F., Boland C.R., Goel A.. MSH3 mediates sensitization of colorectal cancer cells to cisplatin, oxaliplatin, and a poly(ADP-ribose) polymerase inhibitor. J. Biol. Chem. 2011; 286:12157–12165. [DOI] [PMC free article] [PubMed] [Google Scholar]
- 42. Slean M.M., Panigrahi G.B., Castel A.L., Pearson A.B., Tomkinson A.E., Pearson C.E.. Absence of MutSβ leads to the formation of slipped-DNA for CTG/CAG contractions at primate replication forks. DNA Repair. 2016; 42:107–118. [DOI] [PMC free article] [PubMed] [Google Scholar]
- 43. Studamire B., Quach T., Alani E.. Saccharomyces cerevisiae Msh2p and Msh6p ATPase activities are both required during mismatch repair. Mol. Cell. Biol. 1998; 18:7590–7601. [DOI] [PMC free article] [PubMed] [Google Scholar]
- 44. Drotschmann K., Yang W., Kunkel T.A.. Evidence for sequential action of two ATPase active sites in yeast Msh2-Msh6. DNA Repair. 2002; 1:743–753. [DOI] [PubMed] [Google Scholar]
- 45. Antony E., Khubchandani S., Chen S., Hingorani M.M.. Contribution of Msh2 and Msh6 subunits to the asymmetric ATPase and DNA mismatch binding activities of Saccharomyces cerevisiae Msh2-Msh6 mismatch repair protein. DNA Repair. 2006; 5:153–162. [DOI] [PMC free article] [PubMed] [Google Scholar]
- 46. Hanson P.I., Whiteheart S.W.. AAA+ proteins: have engine, will work. Nat. Rev. Mol. Cell. Biol. 2005; 6:519–529. [DOI] [PubMed] [Google Scholar]
- 47. Pinto R.M., Dragileva E., Kirby A., Lloret A., Lopez E.T., St Claire J., Panigrahi G.B., Hou C., Holloway K., Gillis T. et al. Mismatch repair genes Mlh1 and Mlh3 modify CAG instability in Huntington's disease mice: genome-wide and candidate approaches. PLoS Genet. 2013; 9:e1003930. [DOI] [PMC free article] [PubMed] [Google Scholar]
- 48. Chandok G.S., Kapoor K.K., Brick R.M., Sidorova J.M., Krasnilikova M.M.. A distinct first replication cycle of DNA introduced in mammalian cells. Nucleic Acids Res. 2011; 39:2103–2115. [DOI] [PMC free article] [PubMed] [Google Scholar]
Associated Data
This section collects any data citations, data availability statements, or supplementary materials included in this article.