

Abstract
Within many species, some individuals are consistently more aggressive than others. We examine whether there are differences in brain gene expression between aggressive versus nonaggressive behavioural types of individuals within a natural population of male three-spined sticklebacks (Gasterosteus aculeatus). We compared gene expression profiles of aggressive male sticklebacks to nonaggressive males in four regions of the brain (brainstem, cerebellum, diencephalon and telencephalon). Relatively few genes were differentially expressed between behavioural types in telencephalon, cerebellum and diencephalon, but hundreds of genes were differentially expressed in brainstem, a brain area involved in detecting threats. Six genes that were differentially expressed in response to a territorial intrusion in a previous study were also differentially expressed between behavioural types in this study, implying primarily non-shared but some shared molecular mechanisms. Our findings offer new insights into the molecular causes and correlates of behavioural plasticity and individual variation in behaviour.
Keywords: animal personality, behavioural syndromes, sociogenomics
1. Introduction
Within many species, some individuals are consistently more aggressive than others, and it has been proposed aggressiveness is a fundamental axis of behavioural variation (Reale et al., 2007). For example, some individuals vigorously attack an intruding conspecific, while other individuals retreat. Successful territory defence via aggression can be a key determinant of fitness, but aggression can also be costly in terms of time, energy and the risk of injury (Huntingford et al., 1987). Studies in diverse organisms from fruit flies (Dierick & Greenspan, 2006; Wang et al., 2008; Edwards et al., 2009; Shorter et al., 2015) to mice (Sluyter et al., 1995) and rats (Heyne et al., 2014) and chickens (Buitenhuis & Kjaer, 2008) have shown that there is a heritable component to aggressiveness, and have suggested that aggressiveness is influenced by thousands of loci. Aggressiveness is also influenced by the early environment (Arnold & Taborsky, 2010), including the environment provided by parents (Curno et al., 2009; Bentz et al., 2013).
One tactic for understanding the molecular mechanisms contributing to heritable and environmental causes of aggressiveness is to measure the dynamic side of the genome (Bell & Robinson, 2011) by measuring gene expression on a genome-wide scale. Indeed, there is now a decent literature measuring genome-wide gene expression associated with aggressiveness in a wide range of taxa (Table 1). A common result of such studies is that there are hundreds to thousands of genes that are differentially regulated as a function of aggression, many of which have novel functions, i.e., they have not previously been identified as ‘candidate genes for aggression’ (Edwards et al., 2006). Another generality is that the identity and type of genes associated with aggressiveness are highly tissue-specific, depending on whether expression is measured in whole body, brain, head or brain area. Some studies seeking to identify molecular mechanisms related to aggression have measured gene expression in response to a stimulus that elicits aggressive behaviour, e.g., a territorial intruder. The molecular responses to a territorial challenge likely involves waves of transcription associated with various types of behavioural plasticity (detecting an intruder, assessing the intruder, responding to the intruder, maintaining a response to the intruder, recovering from the intrusion, and preparing to modify future behaviour after the intrusion (Aubin-Horth & Renn, 2009)). Therefore the particular gene expression profile at a specific point in time is probably just a snapshot of very a dynamic process. Gene lists produced by such experiments can be difficult to interpret without additional controls to tease apart gene expression associated with movement, responding to novelty, responding to a conspecific, responding to a same-sex conspecific, etc.
Table 1.
Studies measuring gene expression associated with aggression on a genome-wide scale.
| Reference | Species | Tissue | BT or response | Comparison |
|---|---|---|---|---|
| Alaux et al. (2009) | Honey bee | Brain | Both | Highly aggressive vs more docile subspecies; response to alarm pheromone |
| Aubin-Horth et al. (2005) | Atlantic salmon | Brain | BT | Sneaker males vs immature males vs females |
| Chandrasekaran et al. (2015) | Honey bee | Brain | Both | Highly aggressive vs more docile subspecies, older more aggressive adults vs younger, response to alarm pheromone |
| Dierick & Greenspan (2006) | Drosophila | Head | BT | Lines selected for high vs low aggressiveness |
| Edwards et al. (2006) | Drosophila | Whole body | BT | Lines selected for high vs low aggressiveness |
| Edwards et al. (2009) | Drosophila | Whole body | BT | 40 wild derived inbred lines differing in aggressiveness |
| Feldker et al. (2003) | Rat | Hippocampus | BT | Lines selected for high vs low aggressiveness |
| Fraser et al. (2014) | Sailfin mollies | Whole brain | BT and response | Small vs intermediate males in different social contexts |
| Kanarik et al. (2011) | Rat | Dorsal raphe, hippocampus, frontal cortex | BT | Individuals that did or did not show stress in response to repeated social defeat |
| Kroes et al. (2006) | Rat | Neocortex | Response | Winners vs losers |
| Kukekova et al. (2011) | Red fox | Frontal cortex | BT | Lines selected for tameness |
| Muhie et al. (2015) | Mouse | Hippocampus, amygdala, medial frontal cortex, ventral striatum, septal region, corpus striatum | Response | Repeatedly defeated vs control over time, and after variable number of defeats |
| Mukai et al. (2009) | Song sparrow | Hypothalamus | Response | Response to intruder in breeding vs nonbreeding season |
| Oliveira et al. (2016) | Zebrafish | Brain | Response | Response to an intruder (winner vs loser), mirror vs control |
| Renn et al. (2008) | Cichlid (burtoni) | Brain | BT | Dominants vs subordinates vs females |
| Rittschof et al. (2014) | Honey bee, stickleback, mouse | Diencephalon (stickleback), brain (honeybee), ventral hypothalamus (mouse) | Response | Response to an intruder vs control |
| Sanogo et al. (2012) | Three-spined sticklebacks | Telencephalon, cerebellum, brainstem, diencephalon | Response | Response to an intruder vs control |
| Schunter et al. (2014) | Black-faced blenny | Brain | BT | Territorial males vs sneaker males vs females |
| Sneddon et al. (2011) | Rainbow trout | Brain | Both | Dominant vs subdominant, submissive; subdominant becoming dominant |
| Stiver et al. (2015) | Ocellated wrasse | Brain | BT | Nesting males vs satellite males vs females |
| Schumer et al. (2011) | Cichlids | Brain | BT | Two species that differ in aggressiveness vs females |
| Wang et al. (2008) | Drosophila | Head | Response | Socially isolated vs group housed |
Studies are categorized according to whether they compare gene expression in response to an aggressive interaction (response) or between behavioural types that differ in aggressiveness (BT).
Other studies interested in the molecular causes and correlates of aggressiveness have compared gene expression between individuals that differ in aggressiveness in a ‘resting’ state, e.g., between genetic lines selected for aggressiveness, or between alternative phenotypes that differ in aggressiveness. Differences in resting gene expression between behavioural types are likely to reflect processes that are involved in maintaining rather than generating a particular neurogenomic state (Zayed & Robinson, 2012; Cardoso et al., 2015). For example, genes that are differentially expressed between alternative phenotypes that differ in aggressiveness (e.g., sneakers vs territory holders) likely reflect processes involved in maintaining the molecular machinery associated with morphological and life history differences between the phenotypes, such as reproductive maturation (Aubin-Horth et al., 2005).
There is disagreement in the literature about whether and why we might expect to observe commonalities between gene expression associated with plasticity, i.e., the response to an intruder, and with gene expression associated with differences between individuals. On the one hand, we might expect there to be little overlap between them. Differences in gene expression following an aggressive interaction, for example, might be more likely to reflect the molecular consequences of aggression, while differences in gene expression between different behavioural types in a resting state is more likely to reflect the causes of aggressiveness. Cardoso et al. (2015) suggested that the particular types of genes associated with transitions between states (plasticity) versus traits (individual differences) are likely to be different. For example, transitions between states are more likely to involve activation of pre-existing proteins such as phosphorylation or intracellular signalling pathways, immediate early gene expression and transcription of miRNA genes, while epigenetic processes are more likely to be involved in maintaining differences among individuals. On the other hand, we might expect to observe commonalities because theory of the evolution of plasticity predicts that both variation and plasticity are mediated by the same mechanisms (West-Eberhard, 2003; Fraser et al., 2014), and indeed some studies have looked for and detected commonalities at the molecular level between plasticity and variation in aggressiveness, e.g. (Wang et al., 2008; Alaux et al., 2009; Chandrasekaran et al., 2015).
In this study, we compare differences in brain gene expression between aggressive and nonaggressive male three-spined sticklebacks, a species famous for their territorial aggression (Tinbergen, 1972; Wootton, 1984). During the breeding season, male sticklebacks defend nesting territories, attract females to spawn and vigorously defend their nest and its contents from rival males and predators. Previous studies have shown that there is a heritable component to aggressiveness in this species (Bakker, 1986), and that a territorial intrusion elicits the differential expression of thousands of genes in different parts of the brain (Sanogo et al., 2012), some of which are deeply conserved (Rittschof et al., 2014). Interestingly, the expression of differentially expressed genes in response to an intruder was correlated at the individual level with levels of aggressiveness, suggesting that differences in gene expression reflect, in part, individual differences in behaviour (Sanogo et al., 2012). These results are consistent with previous studies that found associations between individual differences in aggression and candidate gene expression (Aubin-Horth et al., 2012) and neurotransmitters such as serotonin (Bell et al., 2007) in sticklebacks. Here, we look for further molecular causes of this variation in aggressiveness by measuring natural variation in ‘resting’ brain gene expression on a genome-wide scale in males of known behavioural type. We compare differences in resting brain gene expression between aggressive and nonaggressive individuals with changes in gene expression that are provoked by a territorial intrusion.
2. Methods
2.1. Overview
The behavioural response of wild-caught male sticklebacks to a territorial intruder was recorded on four occasions. Consistently aggressive and consistently nonaggressive males were selected for brain gene expression profiling using microarrays. Gene expression was compared between aggressive and nonaggressive males in four brain areas.
2.2. Collecting and housing sticklebacks
Juvenile fish (mixed sex) were collected from Navarro River in Summer 2011. Sticklebacks were captured via dip net, seines and minnow traps and shipped to the lab overnight in insulated boxes; mortality was minimal during transport and acclimation to the lab (<5%). Fish were maintained in groups in 83-l tanks (107 × 33 × 24 cm) under a naturally-changing photoperiod controlled by a timer and temperature (between 16 and 18°C). The water was filtered through particulate, UV, biological and charcoal filters in a partially recirculating system that maintains optimal water quality. The fish were fed ad libitum once/day with a mixture of bloodworms, brine shrimp and mysis shrimp. Fish were maintained in lab until the following summer, when males (N = 60) were placed individually in 9-l tanks (34 × 22 × 19.5 cm) and provided with nest building material (filamentous algae and sand). We induced breeding conditions by changing the photoperiod to 16:8 h light/dark and increased the temperature to 18°C. All of the males in this experiment had prior mating and breeding experience as part of a separate study.
2.3. Behavioural phenotyping
The goal of this experiment was to compare brain gene expression between aggressive and nonaggressive behavioural types of individuals. Aggressiveness in sticklebacks is continuously-distributed, therefore to identify the extremes at the end of the distribution we repeatedly measured the aggressive behaviour in response to a territorial intrusion in a sample of N = 60 individuals, and then selected N = 12 individuals that were consistently aggressive or consistently nonaggressive. Non-selected males were used for other experiments in the lab. Males’ aggressive behaviour was tested repeatedly and recorded in different environments in order to identify behavioural types while controlling for short-term differences in state or the immediate environment. Males were killed via decapitation for gene expression profiling three days after their last confrontation by an intruder and were kept visually isolated in order to prevent social interactions among neighbours. We found no evidence for sensitization, i.e., a systematic increase in aggression with repeated testing (Figures 1 and 2). We interpret differences in brain gene expression between behavioural types as variation in a resting state, i.e., not in response to an aggression-eliciting stimulus.
Figure 1.
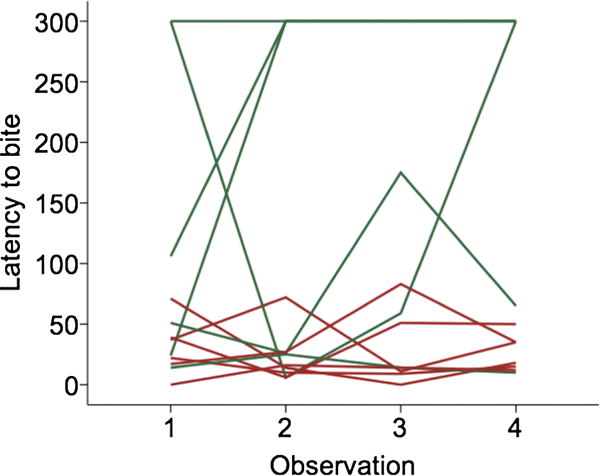
Differences in aggressive behaviour (latency to bite the intruder) between aggressive (red) and nonaggressive (green) individuals. Each line represents the behaviour of a different individual across the four observation periods. This figure is published in colour in the online edition of this journal, which can be accessed via http://booksandjournals.brillonline.com/content/journals/1568539x.
Figure 2.
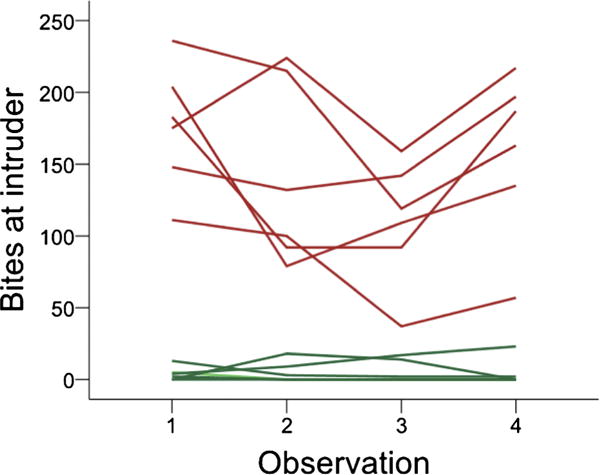
Differences in aggressive behaviour (number of bites at the intruder) between aggressive (red) and nonaggressive (green) individuals. Each line represents the behaviour of a different individual across the four observation periods. This figure is published in colour in the online edition of this journal, which can be accessed via http://booksandjournals.brillonline.com/content/journals/1568539x.
After a male completed his nest and exhibited territorial behaviour (Wootton, 1984) he was presented with an intruder confined to a flask (as in (Rittschof et al., 2014)). After the focal male oriented to the intruder, we recorded the latency to bite (latency to bite) and the number of times that the focal male bit at the intruder (number of bites), which we interpret as aggressiveness. The flask was removed after 5 min. If the male did not bite within 5 min, he was assigned the maximum latency (300 s). Two days later, the aggressive behaviour of each male was recorded again following the same procedure. Based on these data, we selected males that exhibited either extremely high or low aggressiveness for further behavioural phenotyping (N = 24). The extreme males were then transferred individually to new tanks (26 l, 36 × 33 × 24 cm) and provided with nesting material. The rationale behind moving males to new tanks was to identify males that were consistently aggressive and nonaggressive regardless of their immediate environment. One week after transfer to the new tanks, when all of the males started to exhibit territorial behaviour, the aggressive behaviour of the extreme males was recorded for a third time following the methods described above. Males were measured again two days later for the fourth and final time. The N = 12 most extreme males were selected for microarray gene expression profiling and were sacrificed by decapitation three days later at 10:00 am. Decapitation was used in order to kill the fish and dissect brain regions as quickly as possible and to maintain RNA integrity. Decapitation was performed as quickly as possible (within 1 min) and was followed by a second method of euthanasia (brain removal). Four brain regions (telencephalon, diencephalon, cerebellum and brain stem) were macroscopically dissected from the head on dry ice. These experiments were approved by the Animal Care and Use Committee of University of Illinois (protocol No. 09204).
2.4. Microarray oligo design
The microarray probes were designed using the Agilent eArray 4.6 software (Agilent Technologies, Palo Alto, CA, USA) as in Sanogo et al. (2012). Briefly, we used all 27 623 known stickleback transcripts from Ensembl Stickleback Assembly Broad S1, database version 52.1 (http://www.ensembl.org/Gasterosteus_aculeatus/index.html) and included 5000 stickleback genescan predictions chosen based on their differential expression in another study (Sanogo et al., 2011). Unique probes per transcript were designed using the base composition methodology and the 3′ bias option. The oligonucleotides were printed on an Agilent 4 × 44K platform.
2.5. Microarray sample labelling and hybridization
Total RNA from each sample was reverse transcribed into complementary DNA (cDNA) using T7-promoter primer and MMLV reverse transcriptase. The cDNA was subsequently transcribed into complementary RNA (cRNA), during which it was fluorescently labelled by incorporation of cyanine (Cy)-3-CTP (Cy3) or cyanine (Cy)-5-CTP (Cy5). Samples representing individual brain regions were labelled using either Cy3 or Cy5 dyes and competitively hybridized to the arrays (for the hybridization scheme, see Table A5 in the online edition of this journal, which can be accessed via http://booksandjournals.brillonline.com/content/journals/1568539x). The microarray slides were scanned on an Axon 4000B scanner (Molecular Devices Corporation, Sunnyvale, CA, USA) and expression feature were extracted using GenePix Pro 6.0 software (Molecular Devices). The microarray data were deposited in GEO under accession number GSE78861.
2.6. Statistical data analysis and functional enrichment
We used separate channel analysis in limma to analyse the microarray dataset (Smyth, 2005; Smyth & Altman, 2013). We used loess normalization to correct gene expression intensities with a background correction offset of 50. For the between array normalization, we used the Aquantile normalization. A linear model was fit to the data that took into consideration the effect of behavioural type, dye, fish, and brain region. We focus on pairwise contrasts between behavioural types within each brain region. For false discovery rate (fdr) correction we used ‘global’ method in limma, which considers all the contrasts of a single vector of unrelated t-statistics and corrects the p-value accordingly. A major advantage of this approach is consistent FDR correction across all the contrasts. We consider results that are significant at the FDR < 0.1 level in order to improve our power to detect functional pathways that might not appear in functional enrichments with strict FDR cut-offs like <0.05 or <0.01. For functional enrichment we used classic algorithm with a Fisher exact test in TopGO (Alexa & Rahnenfuhrer, 2010) and used all the available transcripts in our array as the universe. A p-value cut off of <0.05 was used to select for significantly enriched functional terms. Finally, REVIGO (Supek et al., 2011) was used to summarize and visualize significantly enriched gene ontology categories.
3. Results
Extreme males selected for brain gene expression profiling were consistently different from each other with respect to aggressive behaviour. Aggressive males began biting the intruder faster than nonaggressive males (mean ± SE 28 ± 5.33 versus 174 ± 44 s, p = 0.026, Mann–Whitney U, Figure 1). Aggressive males also bit the intruder more often (mean ± SE 146 ± 17.2 versus 5 ± 2.1 bites, p = 0.004, Mann–Whitney U, Figure 2).
Relatively few genes were differentially expressed between aggressive and nonaggressive behavioural types in the cerebellum, telencephalon and diencephalon, with comparable numbers of up- and down-regulated genes, and little overlap between brain regions (Figure 3, Table 2).
Figure 3.
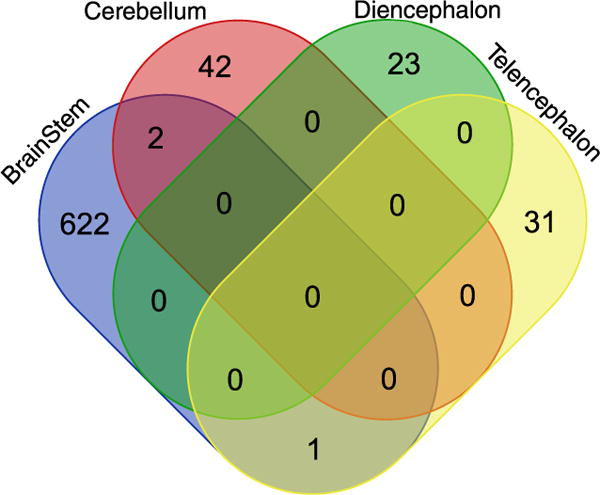
Venn diagram showing numbers of differentially expressed transcripts between aggressive and nonaggressive individuals within each brain region, and the overlap between them. BS: brainstem; C: cerebellum; D: diencephalon; T: telencephalon. This figure is published in colour in the online edition of this journal, which can be accessed via http://booksandjournals.brillonline.com/content/journals/1568539x.
Table 2.
Number of differentially expressed transcripts between aggressive and nonaggressive individuals within each brain region at FDR < 0.1.
| Higher in nonaggressive | Higher in aggressive | |
|---|---|---|
| BS | 353 | 272 |
| C | 20 | 24 |
| T | 16 | 16 |
| D | 14 | 9 |
In contrast, there were hundreds of differentially expressed genes between aggressive and nonaggressive individuals in brainstem. A complete list of the differentially expressed genes between aggressive and nonaggressive individuals in each region can be found in Tables A1–A4 in the online edition of this journal, which can be accessed via http://booksandjournals.brillonline.com/content/journals/1568539x.
Many genes that have been implicated with aggressiveness in other species were differentially expressed between aggressive and nonaggressive sticklebacks, suggesting conserved molecular responses. For example, ependymin, which was expressed at a higher level in nonaggressive individuals relative to aggressive individuals in brainstem, was differentially expressed between dominant and subordinate rainbow trout (Sneddon et al., 2011), zebrafish (Sneddon et al., 2011) and Atlantic salmon (Aubin-Horth et al., 2005). Consistent with other studies (Feldker et al., 2003; Renn et al., 2008), ionotropic glutamate receptors were differentially expressed between aggressive and nonaggressive sticklebacks. Vasoactive intestinal peptide (VIP) is another important candidate gene related to aggressiveness and mating behaviour (Goodson & Adkins-Regan, 1999; Mukai et al., 2009; Goodson et al., 2012). The vasoactive intestinal peptide receptor 1b was differentially expressed between aggressive and nonaggressive sticklebacks in both brainstem and cerebellum, although interestingly in opposite directions in the two brain regions. Arginine vasopressin and its receptors are other important molecules involved in social behaviour in vertebrates (Filby et al., 2010; Santangelo & Bass, 2010; Oldfield & Hofmann, 2011; Godwin & Thompson, 2012; Huffman et al., 2015; Lema et al., 2015; Oldfield et al., 2015; Yokoi et al., 2015), including sticklebacks (Kleszczynska et al., 2012). The arginine vasotocin receptor 2a was downregulated in aggressive individuals in brainstem, although several studies have pointed to the importance of the V1a receptor in fishes, e.g. (Oldfield et al., 2015). Other differentially expressed candidate genes related to aggressiveness from other studies include bdnf (Muhie et al., 2015; Oliveira et al., 2016), cnot3b (Schunter et al., 2014), chga (Renn et al., 2008), dmrt3a (Edwards et al., 2006), igf2a (Aubin-Horth et al., 2005; Kroes et al., 2006), syt14b (Feldker et al., 2003; Aubin-Horth et al., 2005), TLN2 (Muhie et al., 2015), and wnt8a (Rittschof et al., 2014).
Functional enrichment of the differentially expressed genes in brainstem is in Figure 4.
Figure 4.
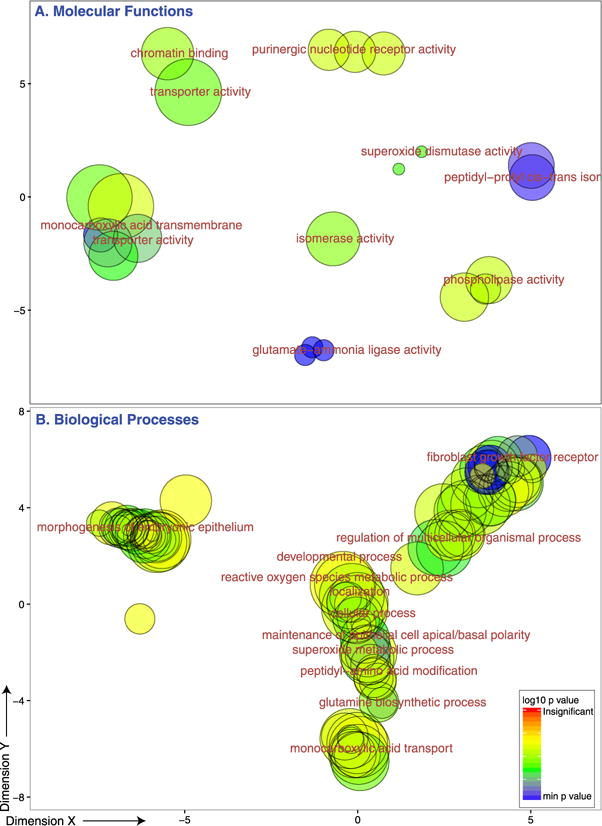
GO results. Molecular functions and biological processes enriched in the set of genes that were differentially expressed between aggressive and nonaggressive individuals in brainstem. The bubble scatter plots show GO clusters with representatives noted. Similarity within clusters represents functional similarity computed among two GO terms using ‘simRel’ scores (Supek et al., 2011). The X and Y axes were calculated by applying multidimensional scaling to a matrix of the GO terms’ similarities. Color represents −log(p-value), whereas size corresponds to GO size (frequency) in the GOA database. This figure is published in colour in the online edition of this journal, which can be accessed via http://booksandjournals.brillonline.com/content/journals/1568539x.
Functional enrichment analysis points to the importance of G-protein coupled receptors (v1pr1b, avpr2a), wnt signaling and transcription factors (dmrt3a, ‘regulation of transcription’) in differentiating between aggressive and nonaggressive individuals. GO analysis also confirms the importance of glutamatergic transmission (gria1a, GRIK3, ‘glutamate-ammonia ligase activity’, ‘glutamine biosynthetic process’, ‘monocarboxylic acid transport’, ‘ionotropic glutamate receptor activity’) and suggests that there are developmental (wnt, bdnf, fkbp5 ‘chordate embryonic development’), brain structural (TLN2, bdnf ‘cytoskeleton’, actin binding’, ‘dopaminergic neuron differentiation’) and epigenetic differences (‘chromatin binding’) between aggressive and nonaggressive individuals.
In a previous study we measured brain gene expression 30 min after male sticklebacks were confronted by a territorial intruder (Sanogo et al., 2012). There are five genes that were both differentially expressed in response to a territorial intrusion in Sanogo et al., 2012 and between aggressive and nonaggressive individuals in this study (fkbp5, dbnla, dkk3b, casq2 and unk ENSGACT00000000074). fkbp5 is particularly interesting because it was downregulated in both experiments and has been linked to depression and PTSD (Zannas & Binder, 2014). Dkk3b is another potentially interesting shared gene involved in wnt signalling and development (Untergasser et al., 2011).
4. Discussion
In this study, we show that natural variation in aggressiveness is associated with differences in brain gene expression within a natural population of sticklebacks. Previous studies examining differences in gene expression between behavioural types have compared selected lines or discrete alternative phenotypes (Table 1). Here we show evidence for gene expression differences associated with variation in aggressiveness that is maintained within a natural population. Indeed, all but two of the males in this study (one nonaggressive, one aggressive) successfully reproduced before this experiment, which suggests that even though we selected extreme individuals for gene expression profiling, this extreme variation is adaptive. Many of the genes that were differentially expressed between aggressive and nonaggressive individuals are familiar and have been linked to aggressiveness in other studies. The causes of differences between aggressive and nonaggressive behavioural types are not known, and may include genetic variation (e.g., Bakker, 1986; Anholt & Mackay, 2012), epigenetic modifications (e.g., Provencal et al., 2015) or developmental plasticity (e.g., Edenbrow & Croft, 2013).
The strongest differences in gene expression between nonaggressive and aggressive individuals was observed in brainstem. At first glance, this result is surprising because the brainstem is not a brain region typically associated with aggression; conventional wisdom is that the hypothalamus (Lin et al., 2011) and forebrain (Giancola, 1995) are important for aggression. Indeed, most differential gene expression in response to a territorial intrusion in sticklebacks was observed in diencephalon, which includes the hypothalamus (Sanogo et al., 2012). One possible explanation for this finding is that the brainstem is relatively homogenous compared to the other brain areas sampled. However, the literature on anxiety and fear suggest that the brain-stem, together with the amygdala, is involved in an adaptive neural alarm system for rapidly alerting to potential threats (Liddell et al., 2005). For example, noradrenergic neurons within the locus coereleus in the brainstem have been associated with anxiety, fear and aggression (Redmond & Huang, 1979; Takahashi et al., 2012). It has been suggested that activation of the brainstem functions as an alternative pathway for sensory information about fear to reach the amygdala (Liddell et al., 2005). This suggests that differences in resting gene expression in the brainstem between aggressive and nonaggressive individual sticklebacks could reflect differences in arousal, or in the ability to detect and anticipate threats (Harris, 1996; Misslin, 2003; Miczek et al., 2007; Takahashi et al., 2012).
It has been proposed that the neurogenomic mechanisms that lead to differences in behavioural states are different from those that maintain differences between behavioural states (Cardoso et al., 2015). Consistent with this hypothesis, some of the types of genes that differed in expression between aggressive and nonaggressive sticklebacks include those that could be involved in maintaining differences between individuals (e.g., genes associated with epigenetic modifications or neurodevelopment) rather than plasticity. If different molecular mechanisms contribute to plasticity and variation, then we are unlikely to observe commonalities between studies measuring gene expression associated with plastic shifts, e.g., responding to a territorial intruder, versus individual differences. Indeed, we observed relatively little overlap between the lists of genes associated with different behavioural types and with the response to a territorial intrusion in sticklebacks (Sanogo et al., 2012). Although there were relatively few shared genes between plasticity and variation in aggressiveness in sticklebacks, one of the genes that is common (fkbp5) has been well-studied for its role in PTSD and depression in humans (Binder et al., 2008; Klengel et al., 2013; Zannas & Binder, 2014), suggesting that it could be a key general player. Indeed, perhaps it’s not the number of genes that are shared between plasticity and variation, but their function that is of greater interest. It will be fascinating for future studies seeking to understand the molecular mechanisms contributing to plasticity and variation in behaviour to compare the transcriptomic response to a territorial intrusion (plasticity) between individuals that differ in aggressiveness (variation).
Supplementary Material
Figure A1. Boxplots showing the distribution of latency to bite across the four observations.
Figure A2. Boxplots showing the distribution of number of bites at the intruder across the four observations.
Table A1. Lists of transcripts that were differentially expressed in brain stem; raw p-values are shown. ‘1’ indicates higher in nonaggressive individuals, ‘−1’ indicates higher in aggressive individuals.
Table A2. Lists of transcripts that were differentially expressed in cerebellum; raw p-values are shown. ‘1’ indicates higher in nonaggressive individuals, ‘−1’ indicates higher in aggressive individuals.
Table A3. Lists of transcripts that were differentially expressed in diencephalon; raw p-values are shown. ‘1’ indicates higher in nonaggressive individuals, ‘−1’ indicates higher in aggressive individuals.
Table A4. Lists of transcripts that were differentially expressed in telencephalon; raw p-values are shown. ‘1’ indicates higher in nonaggressive individuals, ‘−1’ indicates higher in aggressive individuals.
Table A5. Hybridization scheme. Shown is the dye, individual, behavioural type, brain region, array and slide for each sample.
Acknowledgments
We thank Molly Kent for help with brain dissection. This study was supported by a grant from the National Institutes of Health (No. R01 GM082937).
Footnotes
Appendix A
Note: Tables A1–A5 are part of the online edition of this journal, which can be accessed via http://booksandjournals.brillonline.com/content/journals/1568539x.
References
- Alaux C, Sinha S, Hasadsri L, Hunt GJ, Guzman-Novoa E, DeGrandi-Hoffman G, Uribe-Rubio JL, Southey BR, Rodriguez-Zas S, Robinson GE. Honey bee aggression supports a link between gene regulation and behavioral evolution. Proc Natl Acad Sci USA. 2009;106:15400–15405. doi: 10.1073/pnas.0907043106. [DOI] [PMC free article] [PubMed] [Google Scholar]
- Alexa A, Rahnenfuhrer J. topGO: topGO: enrichment analysis for gene ontology. R Foundation for Statistical Computing; Vienna: 2010. (R package version 2.22.0). [Google Scholar]
- Anholt RR, Mackay TF. Genetics of aggression. Annu Rev Genet. 2012;46:145–164. doi: 10.1146/annurev-genet-110711-155514. [DOI] [PubMed] [Google Scholar]
- Arnold C, Taborsky B. Social experience in early ontogeny has lasting effects on social skills in cooperatively breeding cichlids. Anim Behav. 2010;79:621–630. [Google Scholar]
- Aubin-Horth N, Deschenes M, Cloutier S. Natural variation in the molecular stress network correlates with a behavioural syndrome. Horm Behav. 2012;61:140–146. doi: 10.1016/j.yhbeh.2011.11.008. [DOI] [PubMed] [Google Scholar]
- Aubin-Horth N, Landry CR, Letcher BH, Hofmann HA. Alternative life histories shape brain gene expression profiles in males of the same population. Proc Roy Soc Lond B: Biol Sci. 2005;272:1655–1662. doi: 10.1098/rspb.2005.3125. [DOI] [PMC free article] [PubMed] [Google Scholar]
- Aubin-Horth N, Renn SC. Genomic reaction norms: using integrative biology to understand molecular mechanisms of phenotypic plasticity. Mol Ecol. 2009;18:3763–3780. doi: 10.1111/j.1365-294X.2009.04313.x. [DOI] [PubMed] [Google Scholar]
- Bakker TCM. Aggressiveness in sticklebacks (Gasterosteus aculeatus L.): a behaviour-genetic study. Behaviour. 1986;98:1–144. [Google Scholar]
- Bell AM, Backstrom T, Huntingford FA, Pottinger TG, Winberg S. Variable neuroendocrine responses to ecologically-relevant challenges in sticklebacks. Physiol Behav. 2007;91:15–25. doi: 10.1016/j.physbeh.2007.01.012. [DOI] [PubMed] [Google Scholar]
- Bell AM, Robinson GE. Behavior and the dynamic genome. Science. 2011;332:1161–1162. doi: 10.1126/science.1203295. [DOI] [PMC free article] [PubMed] [Google Scholar]
- Bentz AB, Navara KJ, Siefferman L. Phenotypic plasticity in response to breeding density in tree swallows: an adaptive maternal effect? Horm Behav. 2013;64:729–736. doi: 10.1016/j.yhbeh.2013.08.009. [DOI] [PubMed] [Google Scholar]
- Binder EB, Bradley RG, Liu W, Epstein MP, Deveau TC, Mercer KB, Tang Y, Gillespie CF, Heim CM, Nemeroff CB, Schwartz AC, Cubells JF, Ressler KJ. Association of FKBP5 polymorphisms and childhood abuse with risk of posttraumatic stress disorder symptoms in adults. J Am Med Ass. 2008;299:1291–1305. doi: 10.1001/jama.299.11.1291. [DOI] [PMC free article] [PubMed] [Google Scholar]
- Buitenhuis AJ, Kjaer JB. Long term selection for reduced or increased pecking behaviour in laying hens. World Poultry Sci J. 2008;64:477–487. [Google Scholar]
- Cardoso SD, Teles MC, Oliveira RF. Neurogenomic mechanisms of social plasticity. J Exp Biol. 2015;218:140–149. doi: 10.1242/jeb.106997. [DOI] [PubMed] [Google Scholar]
- Chandrasekaran S, Rittschof CC, Djukovic D, Gu H, Raftery D, Price ND, Robinson GE. Aggression is associated with aerobic glycolysis in the honey bee brain. Genes Brain Behav. 2015;14:158–166. doi: 10.1111/gbb.12201. [DOI] [PMC free article] [PubMed] [Google Scholar]
- Curno O, Behnke JM, McElligott AG, Reader T, Barnard C. Mothers produce less aggressive sons with altered immunity when there is a threat of disease during pregnancy. Proc Roy Soc Lond B: Biol Sci. 2009;276:1047–1054. doi: 10.1098/rspb.2008.1612. [DOI] [PMC free article] [PubMed] [Google Scholar]
- Dierick HA, Greenspan RJ. Molecular analysis of flies selected for aggressive behavior. Nature Genet. 2006;38:1023–1031. doi: 10.1038/ng1864. [DOI] [PubMed] [Google Scholar]
- Edenbrow M, Croft DP. Environmental and genetic effects shape the development of personality traits in the mangrove killifish Kryptolebias marmoratus. Oikos. 2013;122:667–681. [Google Scholar]
- Edwards AC, Ayroles JF, Stone EA, Carbone MA, Lyman RF, Mackay TF. A transcriptional network associated with natural variation in Drosophila aggressive behavior. Genome Biol. 2009;10:R76. doi: 10.1186/gb-2009-10-7-r76. [DOI] [PMC free article] [PubMed] [Google Scholar]
- Edwards AC, Rollmann SM, Morgan TJ, Mackay TF. Quantitative genomics of aggressive behavior in Drosophila melanogaster. PLoS Genet. 2006;2:e154. doi: 10.1371/journal.pgen.0020154. [DOI] [PMC free article] [PubMed] [Google Scholar]
- Feldker DE, Datson NA, Veenema AH, Proutski V, Lathouwers D, De Kloet ER, Vreugdenhil E. GeneChip analysis of hippocampal gene expression profiles of short- and long-attack-latency mice: technical and biological implications. J Neurosci Res. 2003;74:701–716. doi: 10.1002/jnr.10800. [DOI] [PubMed] [Google Scholar]
- Filby AL, Paull GC, Hickmore TF, Tyler CR. Unravelling the neurophysiological basis of aggression in a fish model. BMC Genom. 2010;11:498. doi: 10.1186/1471-2164-11-498. [DOI] [PMC free article] [PubMed] [Google Scholar]
- Fraser BA, Janowitz I, Thairu M, Travis J, Hughes KA. Phenotypic and genomic plasticity of alternative male reproductive tactics in sailfin mollies. Proc Roy Soc Lond B: Biol Sci. 2014;281:20132310. doi: 10.1098/rspb.2013.2310. [DOI] [PMC free article] [PubMed] [Google Scholar]
- Giancola PR. Evidence for dorsolateral and orbital prefrontal cortical involvement in the expression of aggressive behavior. Aggr Behav. 1995;21:431–450. [Google Scholar]
- Godwin J, Thompson R. Nonapeptides and social behavior in fishes. Horm Behav. 2012;61:230–238. doi: 10.1016/j.yhbeh.2011.12.016. [DOI] [PubMed] [Google Scholar]
- Goodson JL, Adkins-Regan E. Effect of intraseptal vasotocin and vasoactive intestinal polypeptide infusions on courtship song and aggression in the male zebra finch (Taeniopygia guttata) J Neuroendocrinol. 1999;11:19–25. doi: 10.1046/j.1365-2826.1999.00284.x. [DOI] [PubMed] [Google Scholar]
- Goodson JL, Kelly AM, Kingsbury MA, Thompson RR. An aggression-specific cell type in the anterior hypothalamus of finches. Proc Natl Acad Sci USA. 2012;109:13847–13852. doi: 10.1073/pnas.1207995109. [DOI] [PMC free article] [PubMed] [Google Scholar]
- Harris JA. Descending antinociceptive mechanisms in the brainstem: their role in the animal’s defensive system. J Physiol. 1996;90:15–25. doi: 10.1016/0928-4257(96)87165-8. [DOI] [PubMed] [Google Scholar]
- Heyne HO, Lautenschlager S, Nelson R, Besnier F, Rotival M, Cagan A, Kozhemyakina R, Plyusnina IZ, Trut L, Carlborg O, Petretto E, Kruglyak L, Paabo S, Schoneberg T, Albert FW. Genetic influences on brain gene expression in rats selected for tameness and aggression. Genetics. 2014;198:1277–1290. doi: 10.1534/genetics.114.168948. [DOI] [PMC free article] [PubMed] [Google Scholar]
- Huffman LS, Hinz FI, Wojcik S, Aubin-Horth N, Hofmann HA. Arginine vasotocin regulates social ascent in the African cichlid fish, Astatotilapia burtoni. Gen Comp Endocrinol. 2015;212:106–213. doi: 10.1016/j.ygcen.2014.03.004. [DOI] [PubMed] [Google Scholar]
- Huntingford FA, Turner AK, Downie LM. Animal conflict. Chapman & Hall/CRC; Boca Raton, FL: 1987. [Google Scholar]
- Kanarik M, Alttoa A, Matrov D, Koiv K, Sharp T, Panksepp J, Harro J. Brain responses to chronic social defeat stress: effects on regional oxidative metabolism as a function of a hedonic trait, and gene expression in susceptible and resilient rats. Eur Neuropsychopharmacol. 2011;21:92–107. doi: 10.1016/j.euroneuro.2010.06.015. [DOI] [PubMed] [Google Scholar]
- Klengel T, Mehta D, Anacker C, Rex-Haffner M, Pruessner JC, Pariante CM, Pace TWW, Mercer KB, Mayberg HS, Bradley B, Nemeroff CB, Holsboer F, Heim CM, Ressler KJ, Rein T, Binder EB. Allele-specific FKBP5 DNA demethylation mediates gene-childhood trauma interactions. Nature Neurosci. 2013;16:33–41. doi: 10.1038/nn.3275. [DOI] [PMC free article] [PubMed] [Google Scholar]
- Kleszczynska A, Sokolowska E, Kulczykowska E. Variation in brain arginine vasotocin (AVT) and isotocin (IT) levels with reproductive stage and social status in males of three-spined stickleback (Gasterosteus aculeatus) Gen Comp Endocrinol. 2012;175:290–296. doi: 10.1016/j.ygcen.2011.11.022. [DOI] [PubMed] [Google Scholar]
- Kroes RA, Panksepp J, Burgdorf J, Otto NJ, Moskal JR. Modeling depression: social dominance-submission gene expression patterns in rat neocortex. Neuroscience. 2006;137:37–49. doi: 10.1016/j.neuroscience.2005.08.076. [DOI] [PubMed] [Google Scholar]
- Kukekova AV, Johnson JL, Teiling C, Li L, Oskina IN, Kharlamova AV, Gulevich RG, Padte R, Dubreuil MM, Vladimirova AV, Shepeleva DV, Shikhevich SG, Sun Q, Ponnala L, Temnykh SV, Trut LN, Acland GM. Sequence comparison of prefrontal cortical brain transcriptome from a tame and an aggressive silver fox (Vulpes vulpes) BMC Genom. 2011;12:482. doi: 10.1186/1471-2164-12-482. [DOI] [PMC free article] [PubMed] [Google Scholar]
- Lema SC, Sanders KE, Walti KA. Arginine vasotocin, isotocin and nonapeptide receptor gene expression link to social status and aggression in sex-dependent patterns. J Neuroendocrinol. 2015;27:142–157. doi: 10.1111/jne.12239. [DOI] [PubMed] [Google Scholar]
- Liddell BJ, Brown KJ, Kemp AH, Barton MJ, Das P, Peduto A, Gordon E, Williams LM. A direct brainstem-amygdala-cortical ‘alarm’ system for subliminal signals of fear. NeuroImage. 2005;24:235–243. doi: 10.1016/j.neuroimage.2004.08.016. [DOI] [PubMed] [Google Scholar]
- Lin D, Boyle MP, Dollar P, Lee H, Lein ES, Perona P, Anderson DJ. Functional identification of an aggression locus in the mouse hypothalamus. Nature. 2011;470:221–226. doi: 10.1038/nature09736. [DOI] [PMC free article] [PubMed] [Google Scholar]
- Miczek KA, de Almeida RM, Kravitz EA, Rissman EF, de Boer SF, Raine A. Neurobiology of escalated aggression and violence. J Neurosci. 2007;27:11803–11806. doi: 10.1523/JNEUROSCI.3500-07.2007. [DOI] [PMC free article] [PubMed] [Google Scholar]
- Misslin R. The defense system of fear: behavior and neurocircuitry. Clin Neurophysiol. 2003;33:55–66. doi: 10.1016/s0987-7053(03)00009-1. [DOI] [PubMed] [Google Scholar]
- Muhie S, Gautam A, Meyerhoff J, Chakraborty N, Hammamieh R, Jett M. Brain transcriptome profiles in mouse model simulating features of post-traumatic stress disorder. Mol Brain. 2015;8:14. doi: 10.1186/s13041-015-0104-3. [DOI] [PMC free article] [PubMed] [Google Scholar]
- Mukai M, Replogle K, Drnevich J, Wang G, Wacker D, Band M, Clayton DF, Wingfield JC. Seasonal differences of gene expression profiles in song sparrow (Melospiza melodia) hypothalamus in relation to territorial aggression. PLoS ONE. 2009;4:e8182. doi: 10.1371/journal.pone.0008182. [DOI] [PMC free article] [PubMed] [Google Scholar]
- Oldfield RG, Harris RM, Hofmann HA. Integrating resource defence theory with a neural nonapeptide pathway to explain territory-based mating systems. Front Zool. 2015;12:S16. doi: 10.1186/1742-9994-12-S1-S16. [DOI] [PMC free article] [PubMed] [Google Scholar]
- Oldfield RG, Hofmann HA. Neuropeptide regulation of social behavior in a monogamous cichlid fish. Physiol Behav. 2011;102:296–303. doi: 10.1016/j.physbeh.2010.11.022. [DOI] [PubMed] [Google Scholar]
- Oliveira RF, Simões JM, Teles MC, Oliveira CR, Becker JD, Lopes JS. Assessment of fight outcome is needed to activate socially driven transcriptional changes in the zebrafish brain. Proc Natl Acad Sci USA. 2016;113:E654–E661. doi: 10.1073/pnas.1514292113. [DOI] [PMC free article] [PubMed] [Google Scholar]
- Provencal N, Booij L, Tremblay RE. The developmental origins of chronic physical aggression: biological pathways triggered by early life adversity. J Exp Biol. 2015;218:123–133. doi: 10.1242/jeb.111401. [DOI] [PubMed] [Google Scholar]
- Reale D, Reader SM, Sol D, McDougall PT, Dingemanse NJ. Integrating animal temperament within ecology and evolution. Biol Rev. 2007;82:291–318. doi: 10.1111/j.1469-185X.2007.00010.x. [DOI] [PubMed] [Google Scholar]
- Redmond DE, Jr, Huang YH. Current concepts. II. New evidence for a locus coeruleus-norepinephrine connection with anxiety. Life Sci. 1979;25:2149–2162. doi: 10.1016/0024-3205(79)90087-0. [DOI] [PubMed] [Google Scholar]
- Renn SC, Aubin-Horth N, Hofmann HA. Fish and chips: functional genomics of social plasticity in an African cichlid fish. J Exp Biol. 2008;211:3041–3056. doi: 10.1242/jeb.018242. [DOI] [PMC free article] [PubMed] [Google Scholar]
- Rittschof CC, Bukhari SA, Sloofman LG, Troy JM, Caetano-Anolle D, Cash-Ahmed A, Kent M, Lu XC, Sanogo YO, Weisner PA, Zhang HM, Bell AM, Ma J, Sinha S, Robinson GE, Stubbs L. Neuromolecular responses to social challenge: common mechanisms across mouse, stickleback fish, and honey bee. Proc Natl Acad Sci USA. 2014;111:17929–17934. doi: 10.1073/pnas.1420369111. [DOI] [PMC free article] [PubMed] [Google Scholar]
- Sanogo YO, Band M, Blatti C, Sinha S, Bell AM. Transcriptional regulation of brain gene expression in response to a territorial intrusion. Proc Roy Soc Lond B: Biol Sci. 2012;279:4929–4938. doi: 10.1098/rspb.2012.2087. [DOI] [PMC free article] [PubMed] [Google Scholar]
- Sanogo YO, Hankison S, Band M, Obregon A, Bell AM. Brain transcriptomic response of threespine sticklebacks to cues of a predator. Brain Behav Evol. 2011;77:270–285. doi: 10.1159/000328221. [DOI] [PMC free article] [PubMed] [Google Scholar]
- Santangelo N, Bass AH. Individual behavioral and neuronal phenotypes for arginine vasotocin mediated courtship and aggression in a territorial teleost. Brain Behav Evol. 2010;75:282–291. doi: 10.1159/000316867. [DOI] [PubMed] [Google Scholar]
- Schumer M, Krishnakant K, Renn SC. Comparative gene expression profiles for highly similar aggressive phenotypes in male and female cichlid fishes (Julidochromis) J Exp Biol. 2011;214:3269–3278. doi: 10.1242/jeb.055467. [DOI] [PMC free article] [PubMed] [Google Scholar]
- Schunter C, Vollmer SV, Macpherson E, Pascual M. Transcriptome analyses and differential gene expression in a non-model fish species with alternative mating tactics. BMC Genet. 2014;15:167. doi: 10.1186/1471-2164-15-167. [DOI] [PMC free article] [PubMed] [Google Scholar]
- Shorter J, Couch C, Huang W, Carbone MA, Peiffer J, Anholt RRH, Mackay TFC. Genetic architecture of natural variation in Drosophila melanogaster aggressive behavior. Proc Natl Acad Sci USA. 2015;112:E3555–E3563. doi: 10.1073/pnas.1510104112. [DOI] [PMC free article] [PubMed] [Google Scholar]
- Sluyter F, Bult A, Lynch CB, Van Oortmerssen GA, Koolhaas JM. A comparison between house mouse lines selected for attack latency or nest-building: evidence for a genetic basis of alternative behavioral strategies. Behav Genet. 1995;25:247–252. doi: 10.1007/BF02197183. [DOI] [PubMed] [Google Scholar]
- Smyth GK. Bioinformatics and computational biology solutions using R and bioconductor. Springer; New York, NY: 2005. Limma: linear models for microarray data; pp. 397–420. [Google Scholar]
- Smyth GK, Altman NS. Separate-channel analysis of two-channel microarrays: recovering inter-spot information. BMC Bioinformat. 2013;14:165. doi: 10.1186/1471-2105-14-165. [DOI] [PMC free article] [PubMed] [Google Scholar]
- Sneddon L, Schmidt R, Fang Y, Cossins A. Molecular correlates of social dominance: a novel role for ependymin in aggression. PLoS ONE. 2011;6:e18181. doi: 10.1371/journal.pone.0018181. [DOI] [PMC free article] [PubMed] [Google Scholar]
- Stiver KA, Harris RM, Townsend JP, Hofmann HA, Alonzo SH. Neural gene expression profiles and androgen levels underlie alternative reproductive tactics in the ocellated wrasse, Symphodus ocellatus. Ethology. 2015;121:152–167. [Google Scholar]
- Supek F, Bošnjak M, Škunca N, Šmuc T. REVIGO summarizes and visualizes long lists of gene ontology terms. PLoS One. 2011;6:e21800. doi: 10.1371/journal.pone.0021800. [DOI] [PMC free article] [PubMed] [Google Scholar]
- Takahashi A, Quadros IM, de Almeida RM, Miczek KA. Behavioral and pharmacogenetics of aggressive behavior. Curr Top Behav Neurosci. 2012;12:73–138. doi: 10.1007/7854_2011_191. [DOI] [PMC free article] [PubMed] [Google Scholar]
- Tinbergen N. The animal in its world explorations of an ethologist. Harvard University Press; Cambridge, MA: 1972. [Google Scholar]
- Untergasser G, Martowicz A, Hermann M, Tochterle S, Meyer D. Distinct expression patterns of Dickkopf genes during late embryonic development of Danio rerio. Gene Expr Patterns. 2011;11:491–500. doi: 10.1016/j.gep.2011.08.005. [DOI] [PubMed] [Google Scholar]
- Wang LM, Dankert H, Perona P, Anderson DJ. A common genetic target for environmental and heritable influences on aggressiveness in Drosophila. Proc Natl Acad Sci USA. 2008;105:5657–5663. doi: 10.1073/pnas.0801327105. [DOI] [PMC free article] [PubMed] [Google Scholar]
- West-Eberhard MJ. Developmental plasticity and evolution. Oxford University Press; Oxford; 2003. [Google Scholar]
- Wootton RJ. A functional biology of sticklebacks. University of California Press; Berkeley, CA: 1984. [Google Scholar]
- Yokoi S, Okuyama T, Kamei Y, Naruse K, Taniguchi Y, Ansai S, Kinoshita M, Young LJ, Takemori N, Kubo T, Takeuchi H. An essential role of the arginine vasotocin system in mate-guarding behaviors in triadic relationships of medaka fish (Oryzias latipes) PLoS Genet. 2015;11:e1005009. doi: 10.1371/journal.pgen.1005009. [DOI] [PMC free article] [PubMed] [Google Scholar]
- Zannas AS, Binder EB. Gene-environment interactions at the FKBP5 locus: sensitive periods, mechanisms and pleiotropism. Genes Brain Behav. 2014;13:25–37. doi: 10.1111/gbb.12104. [DOI] [PubMed] [Google Scholar]
- Zayed A, Robinson GE. Understanding the relationship between brain gene expression and social behavior: lessons from the honey bee. Annu Rev Genet. 2012;46:591–615. doi: 10.1146/annurev-genet-110711-155517. [DOI] [PubMed] [Google Scholar]
Associated Data
This section collects any data citations, data availability statements, or supplementary materials included in this article.
Supplementary Materials
Figure A1. Boxplots showing the distribution of latency to bite across the four observations.
Figure A2. Boxplots showing the distribution of number of bites at the intruder across the four observations.
Table A1. Lists of transcripts that were differentially expressed in brain stem; raw p-values are shown. ‘1’ indicates higher in nonaggressive individuals, ‘−1’ indicates higher in aggressive individuals.
Table A2. Lists of transcripts that were differentially expressed in cerebellum; raw p-values are shown. ‘1’ indicates higher in nonaggressive individuals, ‘−1’ indicates higher in aggressive individuals.
Table A3. Lists of transcripts that were differentially expressed in diencephalon; raw p-values are shown. ‘1’ indicates higher in nonaggressive individuals, ‘−1’ indicates higher in aggressive individuals.
Table A4. Lists of transcripts that were differentially expressed in telencephalon; raw p-values are shown. ‘1’ indicates higher in nonaggressive individuals, ‘−1’ indicates higher in aggressive individuals.
Table A5. Hybridization scheme. Shown is the dye, individual, behavioural type, brain region, array and slide for each sample.