

Summary
Infection is restrained by the concerted activation of tissue-resident and circulating immune cells. Whether tissue-resident lymphocytes confer early antiviral immunity at local sites of primary infection prior to the initiation of circulating responses is not well understood. Furthermore, the kinetics of initial antiviral responses at sites of infection remain unclear. Here, we show that tissue-resident type 1 innate lymphoid cells (ILC1) serve an essential early role in host immunity through rapid production of interferon (IFN)-γ following viral infection. Ablation of Zfp683-dependent liver ILC1 lead to increased viral load in the presence of intact adaptive and innate immune cells critical for mouse cytomegalovirus (MCMV) clearance. Swift production of IL-12 by tissue-resident XCR1+ conventional dendritic cells (cDC1) promoted ILC1 production of IFN-γ in a STAT4-dependent manner to limit early viral burden. Thus, ILC1 contribute an essential role in viral immunosurveillance at sites of initial infection in response to local cDC1-derived proinflammatory cytokines.
eTOC
Innate lymphoid cells have a non- redundant role as initial responders to viral infections
Introduction
A major role of the host immune system is to recognize a diverse array of “foreign” pathogens and direct effective responses to suppress pathogen replication and distribution. To achieve this, protective immunity involves the coordinated response of both innate and adaptive immune systems. The innate immune system recognizes pathogens through germline-encoded pattern recognition receptors that interact with conserved motifs shared among many pathogens, whereas the adaptive immune system generates antigen receptor diversity by somatic recombination to provide an immense pool of unique lymphocytes with a higher degree of molecular specificity to a diverse range of pathogens (Goldrath and Bevan, 1999; Iwasaki and Medzhitov, 2004). Although the generation of adaptive lymphocyte clones in higher vertebrates confers the host with enhanced discrimination of pathogens and protective immunological memory, the tradeoff between exceptionally high molecular specificity is the tremendously low precursor frequency of individual adaptive lymphocyte clones (Goldrath and Bevan, 1999; Jenkins et al., 2010). Because of their relative rarity in relation to other immune cells, a given pathogen-specific adaptive lymphocyte (such as a naïve CD8+ T cell) cannot be present at potential sites of infection at all times to encounter antigen. Instead, this naïve T cell will constantly recirculate through the blood and lymph until it recognizes its cognate antigen on antigen-presenting cells that migrate from the initial site of infection to draining lymph nodes (von Andrian and Mackay, 2000). Antigen encounter then leads to clonal proliferation of T cells and effector responses that are then recruited back to the initial site of infection to suppress pathogen replication and spread (von Andrian and Mackay, 2000). Although circulating effector T cells can contribute to host protection at tissue sites through generation of antigen-specific responses, the relative speed of the adaptive immune response is slow (requiring about a week for maximum effector T cell numbers) compared to the rate of replication for certain pathogens, and by itself, would result in defective host protection (Brown et al., 2001; Goldrath and Bevan, 1999).
In recent years, it is becoming evident that a complete immune response requires an evolutionary division of labor between tissue-resident and circulating responses. Innate immune cells, such as macrophages and dendritic cells (DCs), generally reside in peripheral tissues and can recognize pathogens through the expression of toll-like receptors (TLRs) to produce a wide-variety of effector molecules that can directly or indirectly limit early pathogen replication at the site of infection (Iwasaki and Medzhitov, 2004). However, the recently described diversity and relative abundance of tissue-resident lymphocytes in peripheral organs suggests that early myeloid responses alone cannot efficiently restrain pathogen replication in infected tissues before initiation of antigen-specific T cell responses (Fan and Rudensky, 2016). Indeed, tissue-resident lymphocytes, such as innate lymphoid cells (ILCs) and “unconventional” T cells (invariant natural killer T cells (iNKT), γδ T cells, and mucosal associated invariant T cells (MAIT)) have been shown to have critical roles during pathogen challenge (Artis and Spits, 2015; Godfrey et al., 2015; Serafini et al., 2015). Unconventional T cells generally express a limited T cell receptor (TCR) repertoire and can be activated by microbial products in the context of nonclassical MHC molecules to rapidly respond within hours to days in infected tissues (Fan and Rudensky, 2016; Godfrey et al., 2015). In contrast, tissue-resident ILCs do not express rearranged antigen receptors, but instead express germline encoded activating receptors to sense host myeloid and parenchymal cell signals produced following local injury, inflammation, or pathogen infection to rapidly produce proinflammatory and regulatory cytokines (Artis and Spits, 2015; Serafini et al., 2015).
Although tissue-resident unconventional T cell responses have been observed to precede circulating responses during primary microbial infection in an antigen-specific manner (Godfrey et al., 2015), whether this process similarly occurs during viral infection is unclear. Because viruses use host machinery to assemble infectious particles, virally encoded nucleic acid motifs are recognized by certain TLRs expressed by tissue-resident myeloid cells (Iwasaki and Medzhitov, 2004). Following primary viral infection, virus-specific effector T cells can give rise to tissue-resident memory T cells (TRM) that rapidly and robustly respond to secondary viral infection (Schenkel and Masopust, 2014). During mouse cytomegalovirus (MCMV) infection, circulating NK cells and unconventional T cells can produce the antiviral cytokine interferon (IFN)-γ in an antigen-independent “innate” manner in response to proinflammatory cytokines produced by tissue-resident myeloid cells (Ninomiya et al., 2000; Sun et al., 2012; Wesley et al., 2008). However, whether tissue-resident lymphocytes confer immediate host protection at initial sites of viral infection prior to the initiation of circulating responses in naïve hosts is not known. Furthermore, the overall cellular composition and kinetics of the primary antiviral response at the initial site of viral infection in naïve hosts remain to be elucidated.
In this study, we show that whereas adaptive immunity is not required for early viral control in naïve hosts, ILC responses are critical. Specifically, tissue-resident ILC1 rapidly produce IFN-γ at sites of primary viral infection before other known innate and adaptive lymphocytes. Genetic ablation of liver ILC1 lead to increased MCMV load, even in the presence of intact NK cell responses. Crosstalk between tissue-resident XCR1+ dendritic cells and ILC1 via IL-12 was critical to limit early viral burden at primary sites of infection. ILC1 displayed greater sensitivity to IL-12 than any other IFN-γ producing lymphocyte, explained by greater Il12rb1 and Ifng transcripts at steady state. Thus, our study reveals a physiologic role for tissue-resident ILC1 in viral immunosurveillance at initial sites of infection where they represent the naïve host’s first line of defense.
Results
Innate lymphocytes are required to suppress early viral replication at initial sites of infection
Previous studies have shown that MCMV infection leads to activation of splenic and liver IFN-γ producing innate and adaptive lymphocytes as early as 36 hours post-infection (PI) (Lanier, 2008; Nguyen et al., 2002; Ninomiya et al., 2000; Wesley et al., 2008). However, whether resident lymphocyte responses restrain viral replication at the initial site of infection before viral dissemination in naïve hosts, or activation of circulating lymphocytes is unknown. To determine whether lymphocytes can confer early host viral protection in the peritoneal cavity (PC), the site of injection, we infected immune sufficient WT, adaptive lymphocyte deficient Rag2−/−, or adaptive lymphocyte and ILC deficient Rag2−/− x Il2rg−/− mice with MCMV by intraperitoneal (i.p.) injection, and analyzed viral titers in the PC at 36 hours PI. Although early control of MCMV replication was not dependent on adaptive lymphocytes, viral titers were increased significantly in Rag2−/− x Il2rg−/− mice compared to both Rag2−/− and WT mice (Fig. 1A), suggesting that ILCs mediate early host antiviral defense in the PC of naïve mice.
Figure 1. Group 1 ILCs and IFN-γ confer early viral control at local sites of infection.

(A–B) (A) WT, Rag2−/−, Rag2−/− x IL2rg−/− mice and (B) Rag2−/− mice treated with PBS, α-NK1.1 or α-IFN-γ, were infected with MCMV intraperitoneally (i.p.). Viral titers were measured in the peritoneal cavity (PC) at 36 hrs post-infection (PI). (C–D) (C) WT, Rag2−/−, Rag2−/−xIL2rg−/− mice and (D) Rag2−/− mice treated with PBS, α-NK1.1 or α-IFN-γ, were infected with MCMV hydrodynamically (h.d.). Viral titers were measured in the liver at 36 hrs PI. (E–F) (E) WT, Rag2−/−, Rag2−/− x IL2rg−/− mice and (F) Rag2−/− mice treated with PBS or α -NK1.1 were infected with SeV intranasally (i.n.). Viral load was measured in the lung at 48 hrs post-infection (PI) by RTqPCR. Data are representative of 2 independent experiments of 4–6 mice per group. Samples were compared using an unpaired, two-tailed Student’s t test, and data are presented as the mean ± SEM (*p<0.05, **p<0.01).
NK cells are known to confer host resistance to MCMV through production of IFN-γ and killing of virally infected cells (Lanier, 2008); therefore we treated Rag2−/− mice with either α-NK1.1 or α-IFN-γ antibodies prior to infection. Analysis of PC viral titers at 36 hours PI revealed that both NK1.1-depleted and IFN-γ-neutralized groups had heightened levels of viral replication in a similar manner to total lymphocyte deficient mice (Fig. 1B), suggesting that IFN-γ and NK1.1+ cells in the PC are required for early host antiviral resistance, similar to previous results found in the spleen and liver at 48 hours PI (Loh et al., 2005).
Because the relative percentage and composition of tissue-resident lymphocytes is unique to each organ (Fan and Rudensky, 2016), and a major site of viral dissemination and replication of both MCMV and human cytomegalovirus (HCMV) is the host liver (Paya et al., 1989; Salazar-Mather et al., 1998), we tested whether ILCs could also confer early host protection when MCMV was delivered directly to this organ using a hydrodynamic (h.d.) injection model. Similar to results obtained with i.p. infection, h.d. MCMV infection showed increased viral titers in Rag2−/− x Il2rg−/− mice compared to both Rag2−/− and WT mice (Fig. 1C). Protection was dependent on both NK1.1+ cells and IFN-γ (Fig. 1D), suggesting that early NK1.1+ ILC-mediated control of MCMV can occur at an initial site of viral replication in an IFN-γ dependent manner that is not limited to discrete tissue microenvironments. Because initial viral entry predominantly occurs at mucosal surfaces (i.e. lung, skin, mouth) (Iwasaki and Medzhitov, 2015), we also tested whether lung-resident ILC1s could confer host protection following intranasal (i.n.) administration of the mouse respiratory virus, Sendai virus (SeV). Consistent with MCMV infection, higher SeV titers were detected in Rag2−/− x Il2rg−/− mice compared to both Rag2−/− and WT mice (Fig. 1E), and α-NK1.1 treated Rag2−/− mice displayed heightened viral burden similar to total lymphocyte-deficient mice (Fig. 1F). Together, these results suggest that NK1.1+ ILCs confer early viral host protection at initial sites of infection in both barrier and non-barrier tissues.
The peritoneal cavity consists of phenotypically and functionally heterogeneous group 1 ILCs
Recently it has been appreciated that NK1.1+ ILCs consist of a diverse family of group 1 ILCs including mature NK cells, immature NK cells, and tissue-resident ILC1 (O’Sullivan et al., 2015). However, the phenotypic and functional heterogeneity of group 1 ILCs in the PC remained unknown. Gating on lin−Tbet+NK1.1+NKp46+ cells, we found that the PC consisted of two main subsets of CD49b+Eomes+ and CD49b−Eomes− cells, similar to NK cells and tissue-resident ILC1 described in the liver (Fig. 2A) (O’Sullivan et al., 2015). PC CD49b+Eomes+ cells were dependent on the transcription factors T-bet and Eomes for their development in a cell-intrinsic manner (Fig. S1A,B), and were derived from the circulation in parabiotic mice (Fig. 2B,C), consistent with a mature NK cell phenotype in other organs (Fig. S1A,B). Conversely, PC CD49b−Eomes− cells required T-bet, but not Eomes for their development (Fig. S1A,B) and remained tissue resident in parabiotic mice (Fig. 2B,C), consistent with an ILC1 phenotype observed in other peripheral organs (Fig. S1A,B). Unexpectedly, PC and splenic CD49b−Eomes− cells did not require Nfil3 for their development (Fig. S1C), suggesting these cells may use a different developmental pathway than reported for other ILCs (Geiger et al., 2014).
Figure 2. PC and liver-resident ILC1 are distinct from circulating NK cells.

(A) Representative plots are gated on total Group 1 ILCs (Lin−NKp46+NK1.1+Tbet+) and show Eomes and CD49b expression in the PC and liver of WT mice. (Lin=CD3ε+TCRβ+CD19+F4/80+). (B–C) Parabiotic mice were generated by surgically connecting CD45.1+ and CD45.2+ mice for 30 and 130 days. (B) Representative plots show host and donor derived NK cells (CD49b+Eomes+) and ILC1 (CD49b−Eomes−) and (C) percentage of donor derived populations in the PC. (NKT = CD45+CD19−F4/80−TCRβ+CD3ε+NK1.1+). (D–E) RNA-sequencing reveals gene expression signature of the indicated cell populations sorted purified from Eomes-GFP mice. (D) Differential gene expression across all samples for all genes with FDR-adjusted p-value less than 10−5 (713 total). (E) Gene expression signature of all samples indicated by a manually curated representative subset from part D. Heat map shows data pooled from biological replicates (see methods). (F) Histograms show CD200r1 and CD61 expression on resting splenic NK cells and ILC1 from indicated tissues (upper panels), and on resting NK cells, ILC1, ILC2 and ILC3 from the small intestine lamina propria of WT mice (bottom panels). (G) Representative plot shows CD200r1 and CD49b expression on Lin−NKp46+NK1.1+Tbet+ cells in the liver of WT mice. Data are representative of 2 to 3 independent experiments with (A, F–G) n=5 mice, (B–C), n= 3–4 parabiotic pairs and (D–E) n= 40–50 mice per group.
Using Eomes-GFP reporter mice, we then compared the gene expression profile of PC CD49b−Eomes− cells with ILC1 and NK cells across multiple organs. Unbiased analysis revealed that genes more highly expressed in ILC1 than in NK cells across tissues examined also had much higher expression in PC CD49b−Eomes− cells than in PC CD49b+Eomes+ NK cells, and conversely, genes more highly expressed in NK cells than in ILC1 also had much higher expression in PC CD49b+Eomes+ NK cells (Fig. S2A). These results are supportive of PC CD49b−Eomes− cells being ILC1. Using all available samples, we identified a 713-gene ILC1 vs. NK signature across tissues, consisting of 407 genes more highly expressed in ILC1 and 306 genes more highly expressed in NK cells (Fig. 2D and Fig. S2B). This signature gene set aligned well with, and substantially extended the previously identified ILC and NK signature genes (Fig. S2C) (Robinette et al., 2015). The signature set contained transcription factors, cell-adhesion molecules, cell surface receptors, and effector molecules (Fig. 2E and Fig S2B). The transcription factor Zfp683 (a Blimp1 homologue also known as Hobit), which has been implicated in controlling TRM and liver ILC1 tissue-residency and survival (Mackay et al., 2016), was highly enriched in all ILC1 and not expressed by NK cells (Fig. 2E). In contrast, whereas all ILC1 shared enriched transcripts for Il7r, Itga1 (CD49a), and Cxcr6 compared to low expression by NK cells, these and other markers associated with tissue-resident lymphocytes, such as CD69 and CD103, were not homogenously expressed on all peripheral ILC1 (Fig. 2E and S2D), making them unsuitable as lineage-defining markers. In contrast, we found that ILC1 were enriched for transcripts of the inhibitory receptor CD200r1 and the cell surface integrin CD61 (Itgb3) (Fig. 2E), which were expressed on the cell surface of all peripheral ILC1 analyzed, and on ILC2 and ILC3 in the small intestine and adipose tissue (Fig. 2F,G), albeit at different levels. Because we observed little to no expression of CD61 and CD200r1 on peripheral NK cells (Fig S3 and data not shown), our results suggest that these markers will be more useful than previously described markers to discriminate NK cells from all other ILCs.
Tissue-resident ILC1 are distinct from circulating NK cells during MCMV-induced inflammation
During homeostasis, parabiotic mouse and lineage-tracing experiments have been used to show that liver and adipose NK cells and ILC1 are stable phenotypic and functional lineages (Daussy et al., 2014; O’Sullivan et al., 2016; Peng et al., 2013; Sojka et al., 2014). However, whether differences between NK cells and ILC1 are lost during viral-induced inflammation is unknown. To test whether ILC1 could differentiate into NK cells (and vice versa), we sorted CD49b−Eomes− PC and liver ILC1 and control splenic CD49b+Eomes+ NK cells to high purity from Eomes-GFP mice, adoptively transferred them into congenically distinct WT hosts, and infected with MCMV (Fig. 3A and S3A). A week later, we observed that CD49b−Eomes− ILC1 from both tissues maintained a stable phenotype (Fig. 3B) and remained CD49b−CD11b−CD49a+Eomes−CD200r1+ in recipient mice (Fig. 3C). Furthermore, ILC1 did not acquire the NK cell-specific activating receptor Ly49H (Fig. 3C), suggesting that ILC1 are not an immature form of NK cells at homeostasis that differentiate following acute inflammation, but rather a distinct and stable lineage. Adoptively transferred splenic CD49b+Eomes+ NK cells increased expression of markers associated with an ILC1 phenotype, such as CD69 as early as 36 hours PI (Fig. S3B), and CD49a and CD61 one week following infection (Fig. S3C). However, NK cells did not express CD200r1 (Fig. S3B,C) and did not lose expression of NK cell lineage-defining molecules such as Eomes, Ly49H, or CD49b at these time points following infection (Fig. S3C). These results suggest that although NK cells can increase CD49a, CD69, and CD61 expression in a cell-autonomous fashion following viral infection, they do not phenotypically convert to ILC1.
Figure 3. ILC1s represent a stable lineage during viral infection.

(A) Schematic of experiment. Briefly, 1×10⁴ PC ILC1 and 3.5×10⁴ liver ILC1 (CD45.2+Lin−NK1.1+Eomes−CD49b−) were sorted from Eomes-GFP mice and adoptively transferred into separate CD45.1+ WT mice, i.p. or i.v., respectively. Mice were subsequently infected with MCMV and analyzed at 7 days PI. (B) Plots show ILC1 from the PC and livers of uninfected Eomes-GFP mice (left plots) and following transfer and MCMV infection (day 7 PI, right plots). (C) Histograms show indicated cell surface markers on liver ILC1 and NK cells from uninfected Eomes-GFP mice, and adoptively transferred liver ILC1 at 7 days PI. (D) Schematic of experiment. 4×10⁴ liver ILC1 (Lin−NK1.1+CD49a+CD49b−CD200r1+CD11b− Ly49h−) were sorted from CD45.2+ mice, adoptively transferred i.v. into CD45.1+ WT mice, and subsequently infected with MCMV. (E) Representative plots show CD49b and intracellular Eomes staining of adoptively transferred ILC1 recovered in the liver at 7 days PI. (F–G) Parabiotic mice were generated and both parabionts infected with MCMV i.p. Organs were analyzed at day 7 PI for chimerism of indicated lymphocyte populations. (F) Representative plots and (G) percentage of donor derived NK cells and ILC1 shown for indicated organs. Data are representative of 3 independent experiments with (A–E) n=3–4 mice and (F–G) n=3–4 parabiotic pairs per group.
To further confirm that endogenous ILC1 are a stable lineage during inflammation, we sorted purified CD200r1+Ly49H−CD49b−CD11b− liver ILC1 and adoptively transferred these cells into congenically distinct hosts and infected with MCMV (Fig. 3D). One week later, liver ILC1 remained CD49b−Eomes− by intracellular staining (Fig. 3E). An important functional characteristic of ILCs is their maintenance of tissue-residency during acute inflammation (Gasteiger et al., 2015). Indeed, PC and liver ILC1 remained strongly tissue-resident at homeostasis and following MCMV infection of parabiotic mice (Fig. 3F,G). In contrast, NK cells were derived from the circulation in peripheral tissues (Fig. 3F,G), suggesting that even activated NK cells do not become tissue-resident following MCMV infection. Collectively, these results strongly suggest that the PC and the liver contain phenotypically and functionally distinct lineages of ILC1 and NK cells during viral-induced inflammation.
ILC1 are the main early source of IFN-γ at initial sites of infection
Because total group 1 ILCs and IFN-γ were required to restrain viral replication in primary infected tissues (Fig. 1), and Ly49H-dependent NK cell responses are responsible for systemic host protection to MCMV in C57BL/6 mice (Brown et al., 2001), we analyzed whether NK cells or ILC1 produced more IFN-γ early following viral infection in barrier and non-barrier tissues. Notably, we found that only ILC1 in the PC, liver, and lung produced robust amounts of IFN-γ in vivo early after infection with several viruses, including MCMV (i.p., h.d. and i.n), SeV (i.n.) and PR8 influenza virus (i.n.), compared to all other known IFN-γ-producing lymphocytes (Fig. 4A–C, S4A–E, and data not shown). This early IFN-γ response was restricted to the primary site of infection, before the initiation of any other IFN-γ response in other target organs (Fig. 4A–C). ILC1 produced more IFN-γ compared to NK cells in the PC, liver, and lung following tissue-specific infection (Fig. 4C–F and data not shown), suggesting that tissue-resident ILC1 are the first and main producers of IFN-γ in virally infected tissues prior to the initiation of circulating NK cell responses.
Figure 4. ILC1 rapidly produce IFN-γ early during host anti-viral responses at initial sites of infection in naïve hosts.

WT mice were infected with MCMV either i.p. or h.d. or SEV i.n., and peripheral tissues were harvested and analyzed for intracellular IFN-γ staining. (A–B) Quantification of intracellular IFN-γ staining of indicated group 1 ILC populations at various time points following either MCMV (i.p. or h.d.). (C) Quantification of intracellular IFN-γ staining of indicated group 1 ILC populations at various time points following SeV (i.n.) infection in i.v. unlabeled fraction of indicated organ. (D) Flow plots show intracellular IFN-γ staining of NK cells and ILC1 in PC at 24 hrs PI (MCMV, i.p.). (E–F) Quantification of intracellular IFN-γ staining by percentage and MFI of NK cells and ILC1 in (E) PC (MCMV, i.p.) or (F) liver (MCMV, h.d.) at 24 hrs PI. Data are representative of 3–4 independent experiments with n=5–7 mice per group. Samples were compared using an unpaired, two-tailed Student’s t test, and data are presented as the mean ± SEM (*p<0.05, **p<0.01,***p<0.001).
Liver ILC1 are required for limiting early viral replication, and enhancing host survival
To test whether ILC1 responses were required for restricting viral replication and promoting host tissue protection following MCMV infection, we utilized Zfp683−/−(Hobit-deficient) mice that are severely reduced in liver ILC1 (Mackay et al., 2016), but not circulating NK cells or other peripheral ILC1 (Fig. 5A and S5A–C), and Nkp46Cre/+ x Eomesfl/fl (called NK-Eomes−/− hereafter) mice that selectively lack circulating NK cells (Gordon et al., 2012), but not tissue-resident ILC1 (Fig. 5A and S5B). Hydrodynamic infection of these mice resulted in increased viral loads in the liver of Hobit-deficient mice similar to total group 1 ILC-deficient (α-NK1.1 treated) mice (Fig. 5B). In contrast, NK-Eomes−/− mice showed low viral burden similar to WT controls (Fig. 5B), suggesting that Hobit-dependent liver ILC1, but not Eomes-dependent NK cells, are required for early control of MCMV infection. Higher viral loads in Hobit-deficient mice were likely due to lack of liver ILC1, as we observed similar recruitment (Fig. S5D) and IFN-γ production from Hobit-deficient liver NK cells (Fig. S5E,F) in Zfp683−/−:WT mixed bone marrow chimeric mice. Next, we tested whether liver ILC1 were critical for limiting systemic viral dissemination to contribute to host survival. Hydrodynamic infection of Hobit-deficient mice resulted in increased MCMV titers in the blood, and led to rapid lethality similar to total group 1 ILC-depleted mice, and distinct from WT controls which survived the infection (Fig. 5C,D). These results suggest that Hobit-dependent ILC1 rapidly restrict virus replication and dissemination to ensure host survival.
Figure 5. Production of IFN-γ by ILC1 confers early host anti-viral protection at initial sites of infection.

(A–D) (A) Schematic of experiment. WT, NK-Eomes−/−, Zfp683−/− (Hobit-deficient), and WT mice treated with α-NK1.1 were infected with MCMV by h.d. injection. Viral titers of each indicated cohort are shown for (B) the liver at 36 hrs PI and (C) the peripheral blood at day 2 and 4 PI. (D) Kaplan-Meier survival curves of each indicated cohort. (E) Schematic of experiment. 4×10⁴ liver ILC1 from either WT or Ifng−/− were adoptively transferred i.v. into separate Rag2−/− x IL2rg−/− recipients and subsequently infected with MCMV by h.d. injection. (F) Viral titers of each indicated cohort are shown for liver at 36 hrs PI. Data are representative of 3–4 independent experiments with n=5–7 mice per group. Samples were compared using an unpaired, two-tailed Student’s t test, and data are presented as the mean ± SEM (*p<0.05, **p<0.01, ***p<0.001, ****p<0.0001).
To determine whether liver ILC1-derived IFN-γ was sufficient to limit early viral replication in the absence of other lymphocytes, we transferred WT or Ifng−/− liver ILC1 into Rag2−/− x Il2rg−/− mice and challenged with MCMV (Fig. 5E). Adoptively transferred WT ILC1, but not Ifng−/− ILC1, were able to suppress virus in recipients similar to ILC1-sufficient Rag2−/− mice (Fig. 5F), suggesting that liver ILC1-derived IFN-γ is sufficient to control early MCMV replication at the initial site of infection. PC ILC1 are also likely required for host antiviral protection in the absence of Nfil3-dependent NK cells, because depletion of total NK1.1+ cells in Nfil3−/− mice (Fig. S6A) lead to higher viral titers in the PC and greater viral dissemination (Fig. S6B).
Tissue-resident cDC1 produce local IL-12 early after infection to drive optimal IFN-γ production by ILC1
IFN-γ responses are preceded by local proinflammatory cytokine responses mediated by myeloid lineage cells at sites of infection through TLR-dependent mechanisms during MCMV infection (Biron and Tarrio, 2015). Early host protective cytokine production consists of discrete waves of IFN-α, IFN-β, and the proinflammatory IL-12 and IL-18, among other cytokines (Biron and Tarrio, 2015). Therefore, we investigated which proinflammatory cytokine signals are required for tissue-resident ILC1 production of IFN-γ during infection. Both liver NK cells and ILC1 did not require type I interferon signaling for optimal IFN-γ production; however, these populations had an absolute requirement for IL-12 signaling, as Il12rb2−/− or Stat4−/− NK cells and ILC1 showed more than 95% reduction in IFN-γ production compared to WT controls (Fig. 6A). Furthermore, ILC1 were distinct from NK cells in that they did not require IL-18 signaling for optimal production of IFN-γ (Fig. 6A).
Figure 6. Tissue-resident cDC1 rapidly produce IL-12 during viral infection to drive optimal IFN-γ production by ILC1.

(A) Mixed bone marrow chimeras (mBMC) harboring WT (CD45.1+) and selected proinflammatory cytokine receptors- or STAT molecule-deficient (CD45.2+) bone marrow were infected at 8 weeks following reconstitution with MCMV (i.p. injection). Intracellular IFN-γ production was assessed at 36 hrs PI in the PC, and data is represented as the relative ratio of IFN-γ production of KO to WT cells within each infected chimeric mouse. (B–D) Il-12p40-YFP reporter mice were infected with MCMV by h.d. injection and peripheral tissues were harvested and analyzed for YFP+ cells at various time points PI (cDC1 = CD45+Lin−CD64−MHCIIhiCD11chiCD11b−XCR1+, cDC2 = CD45+Lin−CD64−MHCIIhiCD11chiXCR1−CD11b+, pDC = CD45+Lin−CD64+MHCII+CD11c+CD11b−XCR1−B220+, Macrophage = CD45+Lin−CD64+MHCII+CD11b+). (B) Flow plots and (C) graphs show percentages of YFP+ cells in different liver populations at 12, 24, and 36 hours PI. (D) Quantification of YFP+ cDC1 in peripheral tissues at 12, 24, and 36 hours PI. (E) Parabiotic mice were generated and both parabionts were infected with MCMV i.p. Percentage of donor derived spleen NK cells and cDC1 in indicated organs at 36 hours PI. (F–H) WT, cDC-Irf8−/−, Il12rb2−/−, and Stat4−/− mice were infected with MCMV by h.d. injection and analyzed at 36 hours PI. Graphs show (F) percentage and (G) MFI of IFN-γ-expressing liver ILC1, and (H) viral titers in the liver within each group. Data are representative of 2 independent experiments with (A–E) n=3–4 and (F–G) n=5–7 mice per group. Samples were compared using an unpaired, two-tailed Student’s t test, and data are presented as the mean ± SEM (*p<0.05, **p<0.01, ***p<0.001,).
Because macrophages, conventional dendritic cells (cDC), and plasmacytoid dendritic cells (pDC) have all been described to produce IL-12 in vivo during pathogen challenge (Alexandre et al., 2014; Trinchieri, 2003), we utilized Il-12p40-YFP reporter mice to determine the major cellular source of local IL-12 in virally infected tissues. Unbiased analysis of total YFP+ cells revealed that the majority of IL-12 producing cells at 12 hours PI in the PC and liver, or at 36 hours PI in the lung, respectively, were CD64−CD11chiMHCIIhiCD11b−XCR1+ cells (Fig. S7A and data not shown). This phenotype is consistent with a ‘cDC1’ population that has been shown to be important in viral cross-presentation and induction of oral tolerance in the gut (Durai and Murphy, 2016; Esterhazy et al., 2016). Furthermore, we did not observe YFP+ macrophages, pDCs, or CD11b+XCR1− cDC2s (Fig. 6B,C, S7B–E, and data not shown), suggesting that cDC1s are the major early producers of IL-12 in virally infected tissues. This early IL-12 response was restricted to initial sites of infection, and preceded known systemic production of IL-12 at 36 hours PI following MCMV infection (Fig. 6D and S7D). IL-12 is likely produced by cDC1 in a local and tissue-resident manner, as this subset of dendritic cells remained strongly host-derived following viral infection (Fig. 6E and S7F).
Previous studies have shown that the cDC lineage can be marked by expression of the transcription factor Zbtb46, and cDC1 require IRF8 in a cell-intrinsic manner for their development (Durai and Murphy, 2016; Esterhazy et al., 2016; Satpathy et al., 2012). Therefore, we used Zbtb46Cre/+ x Irf8fl/fl mice (called cDC-Irf8−/− hereafter) to specifically ablate this subset in vivo (Fig. S7G,H). Systemic deletion of the cDC1 lineage lead to decreased IFN-γ production in liver ILC1 compared to littermate controls (Zbtb46+/+ x Irf8fl/fl called cDC-WT, Fig. 6F,G). Although the observed reduction of liver ILC1-produced IFN-γ in cDC-Irf8−/− mice was not as pronounced in Il12rb2−/− or Stat4−/− mice (Fig. 6F,G), we observed similar increases in viral titers (Fig. 6H), suggesting that the diminished IFN-γ secretion by ILC1 in cDC-Irf8−/− mice was not sufficient to efficiently limit early viral replication. Thus, these results suggest that local IL-12 produced by tissue-resident cDC1 contributes to optimal IFN-γ production by ILC1 to confer early host protection at infected tissue sites.
ILC1 are poised for greatest IFN-γ production in response to proinflammatory cytokines
Although NK cells and other unconventional adaptive lymphocytes can produce IFN-γ in an antigen independent-manner during MCMV infection (Ninomiya et al., 2000; Sun et al., 2012; Wesley et al., 2008), the responsiveness, kinetics, and effector function of all of these cells relative to each other are unknown. During ex vivo stimulation with IL-12, or IL-12 and IL-18, we observed that ILC1 produced the most IFN-γ, with fewer NK, NKT, and other adaptive lymphocytes cells producing IFN-γ that was more dependent on IL-18 (Fig. 7A). These results suggest that liver ILC1 as a population are the most responsive to proinflammatory cytokines in their ability to produce IFN-γ.
Figure 7. ILC1 are the most responsive to IL-12 amongst IFN-γ producing lymphocytes.

(A) Graph shows percentage of IFN-γ+ cells within indicated liver populations following stimulation with either media alone, IL-12, or IL-12 plus IL-18. (CD8+ T = TCRb+CD3+CD8a+ MR-1−, CD4+ T = TCRb+CD3+CD4+ MR-1−, γδ T = CD3+TCRγ/δ+, MAIT = CD3+MR-1+) (B) ATAC-seq peaks and (C) quantification of peaks, mapping to Il12rb1 promoter (1.5 kb upstream and downstream of the transcriptional start site) in resting ILC1, NK cells, and CD8+ T cells. Il12rb1 exons are shown as black boxes with black arrows denoting the origin and directionally of transcription. (D) RNA-seq reads mapping to Il12rb1 in the indicated populations. (E) ATAC-seq peaks and (F) quantification of peaks, mapping to Ifng promoter (2.5 kb upstream and downstream of the transcriptional start site) in resting ILC1, NK cells, and CD8+ T cells. (G) Histogram shows percentage of YFP+ cells within liver NK cells, ILC1, and CD8+ T cells from Ifng-YFP reporter (GREAT) mice. (H) Schematic of experiment. 3×10⁴ liver ILC1 and 6×10⁴ liver NK cells were adoptively transferred into Rag2−/−xIL2rg−/− recipients and at 7 days post-transfer (when equal numbers of ILC1 and NK cell can be recovered in the liver), recipient mice were challenged with MCMV by h.d. injection. (I) Graph shows the viral titers within the liver of each group at 36 hours PI. ATAC-seq data represents 1 experiment of 15 pooled mice per population, and the rest of the data is representative of 2–3 experiments of 4–6 mice per group. Samples were compared using an unpaired, two-tailed Student’s t test, and data are presented as the mean ± SEM (*p<0.05, ***p<0.001)
In support of this hypothesis, we performed transposase-accessible chromatin (ATAC) sequencing and analyzed the Il12rb1 promoter in resting ILC1, NK, and CD8+ T cells. We found that ILC1 showed greatest chromatin accessibility at the Il12rb1 promoter (Fig. 7B,C), and highest amount of Il12rb1 transcripts as measured by RNA sequencing (Fig. 7D), in support of ILC1 possessing a heightened ability to sense IL-12 in their environment. Additionally, ILC1 showed greatest Ifng promoter accessibility (Fig. 7E,F), and highest Ifng transcripts in IFN-γ-YFP mice (Fig. 7G). Altogether, these results suggest that ILC1 may be epigenetically or transcriptionally poised to produce more IFN-γ than NK or CD8+ T cells. Consistent with these findings, we found that adoptive transfer of liver ILC1 into Rag2−/− x Il2rg−/− mice can limit early viral replication to a greater extent than an equal number of NK cells (Fig. 7H,I and data not shown). Together, these results place tissue-resident ILC1 on the top of a functional spectrum of rapid IFN-γ-producing lymphocytes during local infection.
Discussion
ILCs have been proposed to be the “first responders” of the lymphocyte lineage based on their tissue-residency and ability to rapidly respond to local environmental signals in an antigen-independent manner (Artis and Spits, 2015; Serafini et al., 2015). Here, we demonstrate a critical early role for ILC1, but not other innate or adaptive lymphocytes, in limiting viral replication via rapid production of IFN-γ at the initial site of infection. NK cells and unconventional T cell subsets did not produce IFN-γ until afterwards, suggesting that these previously considered “early” antiviral lymphocyte responses occur later than tissue-resident ILC1 responses. Although our study has focused on early tissue-resident lymphocyte responses in naïve mice, virus-specific effector T cells can give rise to tissue-resident memory T cells (TRM) following primary infection that rapidly and robustly control secondary pathogen challenge in an antigen-dependent manner by inducing potent host antiviral immunity (Ariotti et al., 2014; Schenkel et al., 2014). However, using a model of heterologous secondary infection, we observed that early lung ILC1 IFN-γ responses still preceded influenza-primed CD8+ TRM responses following challenge with Sendai virus several weeks later (O.E.W., J.C.S, and T.E.O unpublished observations), suggesting that ILC1 responses may still confer early host viral protection even in the presence of bystander CD8+ TRM responses.
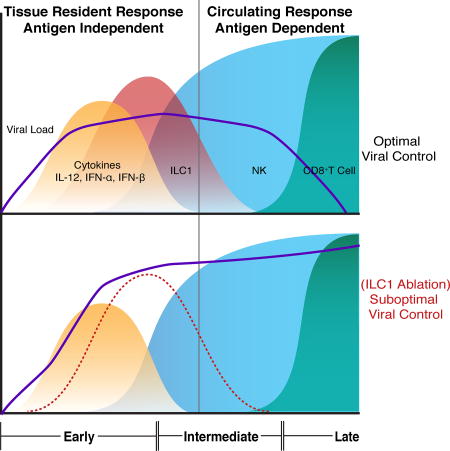
During MCMV infection, some virus will eventually disseminate from primary infected tissues, and thus additional innate and adaptive lymphocytes such as NK cells, CD8+ T cells, CD4+ T cells, and γδ T cells have been shown to participate in limiting viral replication at later stages of infection and in secondary organ sites (Klenerman and Oxenius, 2016; Lanier, 2008; Ninomiya et al., 2000). Among these responses, NK cells are critical in limiting viral replication within the first week, and precede the contribution of antigen-specific T and B cell responses which are critical at later times post-infection (Brown et al., 2001; Klenerman and Oxenius, 2016; Lanier, 2008). Similarly, our results highlight the complementary but essential functions of both innate and adaptive lymphocytes to combat MCMV, which has co-evolved with the mammalian host to evade immune surveillance at multiple stages. These results indicate that although certain ILC responses may be inconsequential in the presence of adaptive immunity (Rankin et al., 2016; Vely et al., 2016), there are conditions when ILC1 are critical for optimal host control of viral infection. Therefore, we propose a model in which tissue resident cDCs and ILC1 serve the earliest role in local MCMV control during an early phase (0–36 hours), which is followed by a critical intermediate phase consisting of circulating antiviral NK cell responses (36 hours-7 days) and finally a late phase consisting of antigen-specific T and B cell responses (7–30 days) to cooperatively limit systemic viral burden. This essential and diverse response of tissue-resident and circulating type 1 lymphocytes may represent an evolutionary adaptation required for specialization of a layered immune response during specific pathogen encounters.
In agreement with our proposed role for ILC1 in host defense, recent studies have suggested that intestinal ILC1 represent the major IFN-γ producing innate lymphocyte population in response to pathogenic microbes, and are required for host protection during infection of mice with Toxoplasma gondii, Salmonella enterica, or following acute oral infection of the opportunistic pathogen Clostridium difficile (Abt et al., 2015; Klose et al., 2014; Klose et al., 2013). However, these studies used T-bet-deficient mice, which have reduced numbers of mature ILC1 and mature NK cells (Deng et al., 2015; O’Sullivan et al., 2016; Townsend et al., 2004), to conclude that intestinal ILC1 are required for host microbial protection. T-bet has also been shown to be required for NK cell IFN-γ production and migration, and the development of NKp46+ ILC3s (Jenne et al., 2009; Rankin et al., 2013; Townsend et al., 2004). Therefore, the results from these studies were not able to definitively distinguish between the contribution of IFN-γ production by NK cells, ILC1, and ILC3 to the reported protective phenotypes. Using Hobit-deficient mice, we believe our results now provide a more precise assessment of the contribution of tissue-resident ILC1 to host immunity, as these mice lack liver ILC1 but not other ILCs (Mackay et al., 2016). Although a recent study reported that Hobit-deficient mice display reduced frequencies of liver NKT cells that are functionally defective in granzyme B production following MCMV infection (van Gisbergen et al., 2012), we did not observe lower numbers of liver NKT cells in Hobit-deficient mice. Furthermore, since NKT cells are not required for early control of MCMV in the liver or spleen (van Dommelen et al., 2003), the defects in survival and control of virus observed in Hobit-deficient mice are unlikely attributable to this population. In addition, we found that Hobit was not required for NK cell production of IFN-γ or cDC1 production of IL-12 following MCMV infection. Hobit is not required for the generation of effector T cells (Mackay et al., 2016), and is not expressed at appreciable levels in other myeloid-lineage cells (Immunological Genome Project), suggesting that the diminished early antiviral protection we observed in the liver of Hobit-deficient mice was due to loss of liver ILC1. Although future work will further elucidate the role of ILC1 in intestinal antimicrobial defense (using models of specific ILC1 deletion or ILC1-specific ablation of IFN-γ), our study clearly delineates a role for ILC1 in limiting viral replication at sites of initial infection.
Unbiased whole-genome epigenetic and transcriptomic signatures collectively suggested that mature mouse and human ILCs contain distinct regulomes (i.e. epigenetic landscapes controlled by chromatin modifications that regulate gene expression) that allow for their functional and phenotypic distinction during homeostasis on a population and single cell level (Gury-BenAri et al., 2016; Koues et al., 2016; Shih et al., 2016). Recently, studies have suggested that NK cells represent only one member of a heterogeneous group of type 1 innate lymphoid cells (Artis and Spits, 2015; Serafini et al., 2015). However, a key challenge is selecting definitive criteria to discriminate NK cells from other group 1 ILCs at steady state and during immune responses. Eomes, CD49a, CD49b, and TRAIL are differentially expressed by each group 1 ILC within different peripheral organs during homeostasis (Cortez et al., 2014; Daussy et al., 2014; Gordon et al., 2012; Klose et al., 2014; O’Sullivan et al., 2016; Sojka et al., 2014), but it is unclear whether these characteristics can be modulated by the activation state of the cells during inflammation, injury, or infection. From our RNA-seq analysis, we identified the markers CD61 and CD200r1 as highly expressed on peripheral tissue-resident ILCs, but either barely or not expressed by circulating NK cells. Furthermore, the combined expression of CD200r1, Eomes, and CD49b can differentiate ILC1 from NK cells during homeostasis and viral-induced inflammation. It should be noted that specific markers previously associated with the ILC1 lineage, such as CD49a and CD69, can be expressed by activated NK cells, and are not uniformly expressed by all peripheral ILC1. These results provide strong evidence that these previous markers should not be used to identify ILC1, whereas CD61 and CD200r1 will be more useful in future studies.
Given the diversity and rapid effector function of tissue-resident lymphocytes (Fan and Rudensky, 2016), there is a growing need to more precisely understand the biology of tissue-resident cells in health and disease. Here, we present an ILC1 signature distinct from circulating NK cells and show that ILC1 maintain lineage stability during viral-induced inflammation. Our findings reveal that tissue-resident ILC1 function to limit early viral replication at primary sites of infection through rapid production of IFN-γ in response to local production of IL-12 by cDC1. Thus, ILC1 contribute to host immunity as tissue-resident “sentinels” in viral immunosurveillance at sites of primary viral entry.
STAR Methods
Contact for Reagent and Resource Sharing
Further information and requests for resources and reagents should be directed to and will be fulfilled by the Lead Contact, Timothy O’Sullivan (tosullivan@mednet.ucla.edu)
Experimental Model and Subject Details
Mice
Mice were bred at Memorial Sloan Kettering Cancer Center in accordance with the guidelines of the institutional Animal Care and Use Committee (IACUC). The following mouse strains were used this study: C57BL/6 (CD45.2), B6.SJL (CD45.1), Rag2−/−, Rag2−/−xIl2rg−/−, EomesGFP transgenic (Daussy et al., 2014), Tbx21−/−, Nkp46Cre x Eomesfl/fl, Nfil3−/−, Klra8−/− (Ly49H-deficient), Zfp683−/−, Ifng−/−, Il12rb2−/−, Stat4−/−, Il18ra1−/−, Ifnar−/−, Stat1−/−, Il12p40-YFP, Zbtb46Cre x Irf8fl/fl, and Ifng-YFP (GREAT mice). Experiments were conducted using age- and gender-matched mice in accordance with approved institutional protocols.
Viruses
MCMV (Smith or K181 strain) was serially passaged through BALB/c hosts three times, and then salivary gland viral stocks were prepared with a dounce homogenizer for dissociating the salivary glands of infected mice 3 weeks after infection. Sendai virus (Cantell strain) and Influenza virus (PR8 Strain) were grown in 10 day embryonated chicken eggs (SPAFAS; Charles River Laboratories). Eggs allantoic fluid was snap frozen in ethanol-dry ice bath and stored at −80°C.
Method Details
Mouse Techniques
Generation of mixed bone marrow chimeric mice was performed as previously described (Sun et al., 2009). Parabiosis surgery was performed as previously described (Franklin et al., 2014; Gasteiger et al., 2015). Briefly, 6–8 week old female congenic CD45.2 and CD45.1 mice were surgically connected in parabiosis. After lateral skin incisions were made from the elbow to knee in each mouse, forelimbs and hind limbs were tied together using nylon suture, and the skin incisions were closed using stainless steel wound clips. After surgery, mice were maintained on a diet supplemented with trimethoprim/sulfamethoxazole for prophylaxis against infection. Intravascular labeling of lymphocytes of experimental mice was performed by injecting (i.v.) 2.5 µg of fluorophore-conjugated CD45 (30-F11) and euthanized 3 minutes later.
In vivo Virus Infection
Experimental mice in studies were infected with MCMV by i.p. injection of 7.5 × 10³ plaque-forming units (PFU) in 0.5 mL or by hydrodynamic injection (h.d.) of 4 × 10⁴ PFU in 2.0 mL or 1×10⁶ PFU in 0.05 mL by intranasal injection (i.n.) of MCMV. For survival experimental studies, mice were injected with 5×10^3 PFU in 2.0 mL by h.d. injection. Hydrodynamic injection was performed as previously described (Liu et al., 1999) to deliver virus directly to the liver. Experimental mice in studies were infected with SeV (Cantell Strain) by i.n. injection of 1×10⁴ PFU or with Influenza (PR8-Strain) by i.n. injection of 5×10² PFU in 0.04 mL. In some experiments mice were injected twice i.p. with either 200µg of α-NK1.1 (PK136), 200 µg of α-IFN-γ (H22), or 200 µg of α-Ly49H (3D10) 3 days and 1 day before infection.
Virus quantification
MCMV viral titers were determined as previously described (Kamimura and Lanier, 2014). DNA was isolated from peripheral blood, PC, or Liver; using a genomic purification kit (QIAGEN). Following isolation, DNA concentration was measured using Nanodrop for each sample, and 3 µL was added into mastermix containing iQ Sybr Green (Bio-Rad) and primers specific to MCMV IE-1 DNA (F: TCGCCCATCGTTTCGAGA, R: TCTCGTAGGTCCACTGACCGA). Copy number was determined by comparing Cq values to a standard curve of known dilutions of an MCMV plasmid and normalized relative to total DNA content. Liver and PC viral titers were normalized to weight of organ and volume of peritoneal gavage respectively.
SeV viral particles were determined by qRT-PCR as previously described (Hermesh et al., 2010). Lungs were harvested after infection and homogenized in 2 ml TRIzol reagent (Thermo Fisher). RNA was isolated from TRIzol according to the manufacturer’s protocol. cDNA was synthesized using Superscript Reverse Transcriptase (Thermo Fisher) and quantitative PCR was performed using SYBR-Green (Bio-Rad) on a CFX Connect instrument (Bio-Rad). SeV RNA was detected using primers designed to SEV P (F: CCAAGAGAGCGTGGAATCAT R: GGGTCAAACCTGGTAGCCTT)). SeV P RNA levels were normalized to β-actin (F: AGGTGACAGCATTGCTTCTG R: GCTGCCTCAACACCTCAAC) using the 2-ΔΔCT method.
Isolation of lymphocytes
Spleens were dissociated using glass slides and filtered through a 100-µm strainer. To isolate lamina propria lymphocytes (LPL), small intestines were removed and flushed, and Peyer’s patches were excised. The intestines were then opened up lengthwise and sliced transversely into 0.5 cm-long pieces, which were incubated in 1 mM dithiothreitol and 1 mM EDTA for 15 minutes to remove intraepithelial lymphocytes (IEL). After IEL were removed, the pieces of intestine were incubated in digest solution (1 mg/mL collagenase and 1 U/mL DNase I in RPMI supplemented with 5% fetal calf serum, 1% L-glutamine, 1% penicillin-streptomycin, and 10 mM HEPES) for 30 minutes, passed through a 100-µm strainer, and purified using 40% Percoll. To isolate lymphocytes from liver, the tissues were physically dissociated using a glass tissue homogenizer and purified using a discontinuous gradient of 40% over 60% Percoll. To isolate the stromal vascular fraction (SVF) of adipose tissue, visceral adipose tissue was physically dissociated using scissors and incubated for 40 minutes in digest solution (2mg/ml type II collagenase in RPMI supplemented with 5% fetal calf serum, 1% L-glutamine, 1% penicillin-streptomycin, and 10 mM HEPES). Resulting dissociated tissue was passed through 100-µm strainers, centrifuged, and adipocytes were removed from the supernatant. To isolate cells from the peritoneal cavity, 4 mL of PBS with 3% fetal calf serum was injected into the peritoneal cavity and wash (containing cells) extracted using a 27g needle and filtered through a 40-µm strainer. To isolate cells from the lung and the salivary gland, the tissue was physically dissociated using scissors and incubated for 30 minutes in digest solution (1mg/ml type D collagenase in RPMI supplemented with 5% fetal calf serum, 1% L-glutamine, 1% penicillin-streptomycin, and 10 mM HEPES). Resulting dissociated tissue was passed through 100-µm strainers, centrifuged, and lymphocytes were removed from the supernatant. Salivary gland lymphocytes were further purified using 40% Percoll. Red blood cells in spleen, adipose, liver, lung, salivary gland, and PC were lysed using ACK lysis buffer.
Flow cytometry and cell sorting
Cell surface staining of single-cell suspensions from various organs was performed using fluorophore-conjugated antibodies (BD Biosciences, eBioscience, BioLegend, Tonbo, R&D Systems) Flow cytometry antibodies used in analysis of purified lymphocytes can be found below. Intracellular staining was performed by fixing and permeabilizing with the eBioscience Foxp3/Transcription Factor Staining Set for staining intranuclear proteins. Intracellular staining for IFN-γ was performed using the Cytofix/Cytoperm kit (BD Biosciences) after 4 hr incubation of single cell suspension of lymphocytes in RPMI containing 10% fetal bovine serum with Brefeldin A (10 µg/mL, Sigma).
Flow cytometry and cell sorting were performed on the LSR II and Aria II cytometers (BD Biosciences), respectively. Data were analyzed with FlowJo software (Tree Star). Il12p40-YFP fluorescence was quantified in peripheral tissues by normalizing to steady state fluorescence of YFP+ cells in uninfected control mice. Cell surface staining was performed using the following fluorophore-conjugated antibodies -NK1.1 (PK136), CD11b (M1/70), CD19 (ID3), CD49b/DX5 (DX5), KLRG1 (2F1), NKp46 (29A1.4), CD45.1 (A20), CD45 (30-F11), CD45.2 (104), CD8a (53–6.7), CD4 (GK1.5), TCRβ (H57-597), Eomes (Dan11mag), CD3e (17A2), TCRγδ (GL3), Ly6G (1A8), CD90.2 (30- H12), T-bet (4B10), Ly49H (3D10), CD200r1 (OX-110), CD49a (Ha31/8), CD61(2C9.G2), CD69(H1.2F3), CD103(2E7) F4/80 (BM8.1), CD11c (N418), IFN-γ (XMG1.2), MR-1 (NIH Tetramer Core), MHCII (M5/114.14.2), B220 (RA3-6B2), CD64 (X54-5/7.1), XCR1 (ZET).
Adoptive transfer experiments
NK cells and ILC1 were purified from liver, PC, or spleen from either CD45.2+ Eomes-GFP or CD45.2+ WT mice, by flow cytometric cell sorting to high purity and transferred into CD45.1+ WT or Ly49H-deficient recipients and were infected with MCMV 1 day post adoptive transfer. In other experiments, NK cells and ILC1 were purified from liver of WT or Ifng−/− by flow cytometric cell sorting to high purity and transferred into Rag2−/−xIl2rg−/− recipients and infected with MCMV 7 days following adoptive transfer.
Ex vivo stimulation of lymphocytes
Approximately 3 × 10⁵ liver lymphocytes were stimulated for 5 hr in RPMI containing 10% fetal bovine serum with recombinant mouse IL-12 (20 ng/ml; R&D Systems) plus IL-18 (10 ng/ml; R&D Systems). Cells were cultured in media alone as a negative control.
RNA sequencing
For RNA sequencing, RNA was isolated from sorted cell populations from Eomes-GFP using TRIzol (Invitrogen) followed by SMARTer amplification and Illumina next-generation sequencing.
ATAC Sequencing
For ATAC sequencing, ATAC-seq libraries were prepared as previously described (Buenrostro et al., 2013). FACS-sorted cell populations (1×10⁴ cells) were lysed and accessible chromatin was transposed using Nextera Tn5 transposase. Transposed DNA fragments were isolated using Qiagen MinElute kit and amplified 5–10 cycles using Nextera PCR primers. ATAC-seq libraries were submitted for paired-end sequencing on Illumina Hiseq.
Quantification and Statistical Analysis
RNA Sequencing Analysis
FastQC (https://www.bioinformatics.babraham.ac.uk/projects/fastqc/) was used to assess sequencing quality. Reads were first mapped to the mouse genome using HiSat2 (Kim et al., 2015) (version 2.0.5). The genomic index along with the list of splice sites and exons were created by HiSat2 using the genome assembly GRCm38.p5 from ENSEMBL together with the comprehensive gene annotation for GRCm38.p5, Release M13, from GENCODE (Mudge and Harrow, 2015). Gene level counts were computed using Rsubread (Liao et al., 2013) (options isPairedEnd = TRUE, requireBothEndsMapped = TRUE, minOverlap = 80, countChimericFragments = FALSE), and technical replicates were merged into single samples by summing the counts from each replicate. For the NK versus ILC analysis, genes were filtered out from further analysis if the mean read count across all samples containing both NK and ILC cells was less than 50. This resulted in 13,514 expressed genes that went into further analysis. DESeq2 (Love et al., 2014) was used to perform differential expression analysis on this set of genes. In order to find a common NK vs. ILC1 signature across tissues while correcting for batch-specific effects across three batches of RNA-seq data, function DESeq() with default parameters was used to fit a full generalized linear model (~batch_B + batch_H + batch_J + organ + cell_type) (see Supplementary Table S1). Each batch variable is a binary variable, where merged samples were assigned 1 in each column corresponding to the batch of each technical replicate; tissue (organ) factor is to model a tissue-specific variation in read counts for each gene. This approach allowed us to estimate a single value of RNA-seq log2(NK / ILC1) for each gene, along with a corresponding p-value. Supplementary Table S2 reports for each gene its average unnormalized “baseMean” read count across samples, log2(NK / ILC1) and the corresponding FDR-adjusted p-value of significance, as well as RPKM value for expression in each sample. Differentially expressed genes were used for further analysis and visualization (Figure 2 and Figure S2). 713 genes for Figure 2D were selected from the differential expression analysis if their FDR-adjusted p-value was less than 10−5; 228 genes were selected for Figure S2B if their FDR-adjusted p-value was less than 10−12. Gene expression heatmaps in Figure 2 and Figure S2 were generated with pheatmap (Kolde, R. pheatmap: https://cran.r-project.org/package=pheatmap) using values log10(RPKM + 1) that were Z-score normalized for each gene across all samples. Unsupervised hierarchical clustering was performed using hclust with Euclidean distance (method = “complete”) as implemented in pheatmap (Kolde). A subset of genes from a number of categories was manually selected for Figure 2E from the 713-gene signature set, averaging RPKM across biological replicates for each cell type. The estimated RNA-seq log2(NK / ILC1) values from this analysis were plotted for the core innate lymphoid cell class 1 (ILC1) and conventional natural killer cell (cNK) signature genes defined by Robinette et al. (Robinette et al., 2015) (as obtained from their Supplementary Table 6) (Figure S2C). In order to compare the gene expression in PC CD49b− Eomes− cells with other cells in an unbiased manner (Fig. S2A), and to determine if PC CD49b−Eomes− cells were closely associated with ILC1, we excluded PC CD49b− Eomes− samples and repeated all the analysis as described above, resulting in 847 genes detected as differentially expressed (FDR-adjusted p < 10−5), including 405 genes with significantly higher expression in NK than in ILC1 (NK-specific) and 442 genes with significantly higher expression in ILC1 than in NK (ILC1-specific). We then estimated the RNA-seq log2(PC CD49b+Eomes+ / CD49b−Eomes−) values for all genes, using only the PC CD49b+Eomes+ and CD49b−Eomes− samples. These values tended to be significantly larger for NK-specific genes than for all genes (p < 2e-16, Kolmogorov-Smirnov test) and tended to be significantly lower for ILC1-specific genes than for all genes (p < 2e-16), see Fig. S2A. This suggested that PC CD49b−Eomes− samples had expression signature of ILC1 and further justified our labeling of them as ILC1 in the above analysis. All analysis starting from count table generation was conducted in the R statistical environment (Team, 2016) (version 3.2.4).
ATAC analysis
Paired-end reads were mapped to Mus musculus genome (mm10 assembly) using Bowtie2 (v 2.2.9) keeping only concordantly aligned paired mates. Tags per million were calculated as the total number of read counts overlapping 50-bin windows across either a 3kb or a 5kb window, centered around the transcriptional start site, divided by the total number of sequencing reads and multiplied by one million.
Statistical analyses
For graphs, data are shown as mean ± SEM, and unless otherwise indicated, statistical differences were evaluated using a two-tailed unpaired Student’s t test, assuming equal sample variance. Statistical differences in survival were determined by Gehan-Breslow-Wilcoxon Test analysis. p < 0.05 was considered significant. Graphs were produced and statistical analyses were performed using GraphPad Prism.
Data availability
The datasets generated and analyzed during the current study will promptly be uploaded to a publicly available data repository.
Supplementary Material
(A–C) Mixed bone marrow chimeric (mBMC) mice harboring WT (CD45.1+) and selected transcription factor deficient (CD45.2+) bone marrow were analyzed 8 weeks post reconstitution for ILC populations. Data is shown as relative chimerism of the KO (CD45.2+) to WT (CD45.1+) ratio of lymphocyte populations normalized to the ratio of control WT (CD45.1+) and WT (CD45.2+) reconstituted mBMC. Quantification of relative chimerism of (A) WT and Tbx21−/− mice, (B) WT and NK-Eomes−/− mice, and (C) WT and Nfil3−/− mice, in indicated peripheral organs. Data are representative of 2 independent experiments with n=3–5 mice per group. Samples were compared using an unpaired, two-tailed Student’s t test, and data are presented as the mean ± SEM (*p<0.05, **p<0.01, ***p<0.001, ****p<0.0001).
(A) CDF plot for comparison of RNA-seq log2(PC CD49b+Eomes+ / PC CD49b Eomes) for all expressed genes with ILC1-specific and NK-specific genes identified from all other ILC1 and NK samples across tissues. Shown are the number of genes in each group, p-value from the Kolomogorov-Smirnov test (see Methods). (B) RNA-sequencing reveals gene expression signature of the indicated cell populations sorted purified from Eomes-GFP mice. Differentially expressed genes with FDR-adjusted p-value less than 10−12 (228 total). (C) RNA-seq log2(NK / ILC1) for previously identified NK & ILC signature genes (see Methods). (D) Representative histograms show indicated surface markers on resting NK and ILC1 in indicated tissue of WT mice. Data are representative of 2 – 3 independent experiments with (A–C) n=40–50 mice, (D), n= 5 mice per group.
(A) Schematic of experiment. Briefly splenic NK cells (CD45.2+Lin−NK1.1+Eomes+CD49b+Ly49h+CD49a−CD200r1−) were sort purified from Eomes-GFP mice and adoptively transferred i.v. into Ly49H–deficient CD45.1+ recipients. Mice were then infected with MCMV i.p. (B) Representative histograms show indicated surface markers on NK and ILC1 harvested at indicated time points PI. (C) Representative histograms of indicated surface markers on uninfected splenic mNK (grey) and Liver ILC1 (black) and adoptively transferred splenic NK cells (red) recovered in the spleen seven days PI. Data are representative of 2 independent experiments with n=3–5 mice per group.
(A–B) Quantification of intracellular IFN-γ staining of indicated group 1 ILC populations at various time points following either Influenza (i.n.) or MCMV (i.n.) in i.v. unlabeled fraction of indicated organ. (C–D) Flow plots show intracellular IFN-γ staining of indicated lymphocyte population from WT mice in PC (i.p. infection) or liver (h.d. infection) at 24 hrs PI with MCMV. (E) Flow plots show intracellular IFN-γ staining of indicated lymphocyte population from WT mice in i.v. unlabeled fraction of the lung at 36 hours PI with SeV (i.n.) Data are representative of 2–3 independent experiments with n=4–6 mice per group. Samples were compared using an unpaired, two-tailed Student’s t test, and data are presented as the mean ± SEM (*p<0.05, ***p<0.001).
(A) mBMC harboring WT (CD45.1+) and Hobit-deficient (Zfp683−/−) (CD45.2+) bone marrow were analyzed 8 weeks post reconstitution for ILC populations. Data is shown as relative chimerism of the KO (CD45.2+) to WT (CD45.1+) ratio of lymphocyte populations normalized to the ratio of control WT (CD45.1+) and WT (CD45.2+) reconstituted mBMC. (B) Percent ILC1 and NK cells of total NK1.1+ cells in the PC, liver, and spleen of WT, Zfp683−/−, and NK-Eomes−/− mice. (C) The total cell number of indicated population WT and Zfp683−/− mice (D–F) WT/Zfp683−/− mBMC were infected with MCMV i.p. and analyzed in the liver at 36 hrs PI. (D) Relative chimerism of Zfp683−/− NK cells in the liver during infection. (E–D) Quantification of intracellular IFN-γ staining of NK cells by percentage and MFI. Data are representative of 2 independent experiments with n=3–5 mice per group. Samples were compared using an unpaired, two-tailed Student’s t test, and data are presented as the mean ± SEM (*p<0.05, **p<0.01).
(A–B) (A) Schematic of experiment. Briefly, Nfil3−/− mice were treated with either PBS+α-Ly49H or α-NK1.1+α-Ly49H and then infected with MCMV i.p. (B) Viral titers of each indicated cohort are shown for PC, Blood, and Spleen at 24 hrs PI. Data are representative of 2 independent experiments with n=3–5 mice per group. Samples were compared using an unpaired, two tailed Student’s t test, and data are presented as the mean ± SEM (*p<0.05)
(A–E) Il-12p40-YFP mice were infected with MCMV by either i.p. or h.d. injection and peripheral tissues were harvest and analyzed for YFP+ cells at various time points PI. (A) Representative plots of non-biased analysis of YFP+ cells in PC (i.p. infection, upper panel) and liver (h.d. infection lower panel,) at 12 hrs PI (B–C) (B) Flow plots and (C) graphs show percentages of YFP+ cells in different PC populations at 12, 24, and 36 hours PI (i.p.). (D) Quantification of YFP+ cDC1 in peripheral tissues at 12, 24, and 36 hrs PI (i.p.). (E) Quantification of YFP+ in the lung 36 hrs PI with SeV or Influenza (i.n). (F) The total cell number of cDC1 in the PC at 12, 24, and 36 hrs PI (i.p.). (G–H) Peripheral tissue of cDC-WT and cDC-Irf8−/− mice were harvested and analyzed for total cell count in indicated populations. Data are representative of 2 independent experiments with n=3–5 mice per group. Samples were compared using an unpaired, two-tailed Student’s t test, and data are presented as the mean ± SEM (*p<0.05).
Highlights.
ILC1 represent the major early source of IFN-γ in virally infected tissues
ILC1-derived IFN-γ limits early MCMV replication in primary infected tissues
Crosstalk between cDC1 and ILC1 populations mediate initial local control of virus
ILC1 display enhanced responsiveness to IL-12 compared to other lymphocytes
Acknowledgments
We thank members of the Sun lab for helpful comments and discussions. We thank E. Pamer, V. Lazarevic, K.P. van Gisbergen, M. Li, and D. Mucida for mice. We thank L. Lanier, B. Moltedo, X. Fan, and A. Chaudhry for helpful discussions. T.E.O. was supported by the American Cancer Society. N.M.A. was supported by the NIH Medical Scientist Training Program grant T32GM07739 to the Weill Cornell/Rockefeller/Sloan-Kettering Tri-Institutional MD-PhD Program. M.A.D-E. and I.S.S. were supported by an NHMRC Fellowship (1119298 to M.A.D-E.) and NHMRC grants (1125357, 1071822). J.C.S. was supported by the Ludwig Center for Cancer Immunotherapy, the Burroughs Wellcome Fund, the American Cancer Society, and grants from the NIH (AI100874, AI130043, and P30CA008748).
Footnotes
Publisher's Disclaimer: This is a PDF file of an unedited manuscript that has been accepted for publication. As a service to our customers we are providing this early version of the manuscript. The manuscript will undergo copyediting, typesetting, and review of the resulting proof before it is published in its final citable form. Please note that during the production process errors may be discovered which could affect the content, and all legal disclaimers that apply to the journal pertain.
Author Contributions
O.E.W, J.C.S, M.A,D-E, and T.E.O. designed the study; O.E.W, N.M.A., I.S.S., and T.E.O performed the experiments; C.L., Y.P., C.K., and C.S.L. performed RNA-seq and ATAC-seq bioinformatics analysis; T.E.O., O.E.W. and J.C.S. wrote the manuscript.
The authors declare no financial conflicts of interest.
References
- Abt MC, Lewis BB, Caballero S, Xiong H, Carter RA, Susac B, Ling L, Leiner I, Pamer EG. Innate Immune Defenses Mediated by Two ILC Subsets Are Critical for Protection against Acute Clostridium difficile Infection. Cell host & microbe. 2015;18:27–37. doi: 10.1016/j.chom.2015.06.011. [DOI] [PMC free article] [PubMed] [Google Scholar]
- Alexandre YO, Cocita CD, Ghilas S, Dalod M. Deciphering the role of DC subsets in MCMV infection to better understand immune protection against viral infections. Frontiers in microbiology. 2014;5:378. doi: 10.3389/fmicb.2014.00378. [DOI] [PMC free article] [PubMed] [Google Scholar]
- Ariotti S, Hogenbirk MA, Dijkgraaf FE, Visser LL, Hoekstra ME, Song JY, Jacobs H, Haanen JB, Schumacher TN. T cell memory. Skin-resident memory CD8(+) T cells trigger a state of tissue-wide pathogen alert. Science. 2014;346:101–105. doi: 10.1126/science.1254803. [DOI] [PubMed] [Google Scholar]
- Artis D, Spits H. The biology of innate lymphoid cells. Nature. 2015;517:293–301. doi: 10.1038/nature14189. [DOI] [PubMed] [Google Scholar]
- Biron CA, Tarrio ML. Immunoregulatory cytokine networks: 60 years of learning from murine cytomegalovirus. Medical microbiology and immunology. 2015;204:345–354. doi: 10.1007/s00430-015-0412-3. [DOI] [PMC free article] [PubMed] [Google Scholar]
- Brown MG, Dokun AO, Heusel JW, Smith HR, Beckman DL, Blattenberger EA, Dubbelde CE, Stone LR, Scalzo AA, Yokoyama WM. Vital involvement of a natural killer cell activation receptor in resistance to viral infection. Science. 2001;292:934–937. doi: 10.1126/science.1060042. [DOI] [PubMed] [Google Scholar]
- Buenrostro JD, Giresi PG, Zaba LC, Chang HY, Greenleaf WJ. Transposition of native chromatin for fast and sensitive epigenomic profiling of open chromatin, DNA-binding proteins and nucleosome position. Nat Methods. 2013;10:1213–1218. doi: 10.1038/nmeth.2688. [DOI] [PMC free article] [PubMed] [Google Scholar]
- Cortez VS, Fuchs A, Cella M, Gilfillan S, Colonna M. Cutting edge: Salivary gland NK cells develop independently of Nfil3 in steady-state. Journal of immunology. 2014;192:4487–4491. doi: 10.4049/jimmunol.1303469. [DOI] [PubMed] [Google Scholar]
- Daussy C, Faure F, Mayol K, Viel S, Gasteiger G, Charrier E, Bienvenu J, Henry T, Debien E, Hasan UA, et al. T-bet and Eomes instruct the development of two distinct natural killer cell lineages in the liver and in the bone marrow. The Journal of experimental medicine. 2014;211:563–577. doi: 10.1084/jem.20131560. [DOI] [PMC free article] [PubMed] [Google Scholar]
- Deng Y, Kerdiles Y, Chu J, Yuan S, Wang Y, Chen X, Mao H, Zhang L, Zhang J, Hughes T, et al. Transcription factor Foxo1 is a negative regulator of natural killer cell maturation and function. Immunity. 2015;42:457–470. doi: 10.1016/j.immuni.2015.02.006. [DOI] [PMC free article] [PubMed] [Google Scholar]
- Durai V, Murphy KM. Functions of Murine Dendritic Cells. Immunity. 2016;45:719–736. doi: 10.1016/j.immuni.2016.10.010. [DOI] [PMC free article] [PubMed] [Google Scholar]
- Esterhazy D, Loschko J, London M, Jove V, Oliveira TY, Mucida D. Classical dendritic cells are required for dietary antigen-mediated induction of peripheral T(reg) cells and tolerance. Nature immunology. 2016;17:545–555. doi: 10.1038/ni.3408. [DOI] [PMC free article] [PubMed] [Google Scholar]
- Fan X, Rudensky AY. Hallmarks of Tissue-Resident Lymphocytes. Cell. 2016;164:1198–1211. doi: 10.1016/j.cell.2016.02.048. [DOI] [PMC free article] [PubMed] [Google Scholar]
- Franklin RA, Liao W, Sarkar A, Kim MV, Bivona MR, Liu K, Pamer EG, Li MO. The cellular and molecular origin of tumor-associated macrophages. Science. 2014;344:921–925. doi: 10.1126/science.1252510. [DOI] [PMC free article] [PubMed] [Google Scholar]
- Gasteiger G, Fan X, Dikiy S, Lee SY, Rudensky AY. Tissue residency of innate lymphoid cells in lymphoid and nonlymphoid organs. Science. 2015;350:981–985. doi: 10.1126/science.aac9593. [DOI] [PMC free article] [PubMed] [Google Scholar]
- Geiger TL, Abt MC, Gasteiger G, Firth MA, O’Connor MH, Geary CD, O’Sullivan TE, van den Brink MR, Pamer EG, Hanash AM, et al. Nfil3 is crucial for development of innate lymphoid cells and host protection against intestinal pathogens. The Journal of experimental medicine. 2014;211:1723–1731. doi: 10.1084/jem.20140212. [DOI] [PMC free article] [PubMed] [Google Scholar]
- Godfrey DI, Uldrich AP, McCluskey J, Rossjohn J, Moody DB. The burgeoning family of unconventional T cells. Nature immunology. 2015;16:1114–1123. doi: 10.1038/ni.3298. [DOI] [PubMed] [Google Scholar]
- Goldrath AW, Bevan MJ. Selecting and maintaining a diverse T-cell repertoire. Nature. 1999;402:255–262. doi: 10.1038/46218. [DOI] [PubMed] [Google Scholar]
- Gordon SM, Chaix J, Rupp LJ, Wu J, Madera S, Sun JC, Lindsten T, Reiner SL. The transcription factors T-bet and Eomes control key checkpoints of natural killer cell maturation. Immunity. 2012;36:55–67. doi: 10.1016/j.immuni.2011.11.016. [DOI] [PMC free article] [PubMed] [Google Scholar]
- Gury-BenAri M, Thaiss CA, Serafini N, Winter DR, Giladi A, Lara-Astiaso D, Levy M, Salame TM, Weiner A, David E, et al. The Spectrum and Regulatory Landscape of Intestinal Innate Lymphoid Cells Are Shaped by the Microbiome. Cell. 2016;166:1231–1246. e1213. doi: 10.1016/j.cell.2016.07.043. [DOI] [PubMed] [Google Scholar]
- Hermesh T, Moltedo B, Moran TM, Lopez CB. Antiviral instruction of bone marrow leukocytes during respiratory viral infections. Cell Host Microbe. 2010;7:343–353. doi: 10.1016/j.chom.2010.04.006. [DOI] [PMC free article] [PubMed] [Google Scholar]
- Iwasaki A, Medzhitov R. Toll-like receptor control of the adaptive immune responses. Nature immunology. 2004;5:987–995. doi: 10.1038/ni1112. [DOI] [PubMed] [Google Scholar]
- Iwasaki A, Medzhitov R. Control of adaptive immunity by the innate immune system. Nat Immunol. 2015;16:343–353. doi: 10.1038/ni.3123. [DOI] [PMC free article] [PubMed] [Google Scholar]
- Jenkins MK, Chu HH, McLachlan JB, Moon JJ. On the composition of the preimmune repertoire of T cells specific for Peptide-major histocompatibility complex ligands. Annual review of immunology. 2010;28:275–294. doi: 10.1146/annurev-immunol-030409-101253. [DOI] [PubMed] [Google Scholar]
- Jenne CN, Enders A, Rivera R, Watson SR, Bankovich AJ, Pereira JP, Xu Y, Roots CM, Beilke JN, Banerjee A, et al. T-bet-dependent S1P5 expression in NK cells promotes egress from lymph nodes and bone marrow. The Journal of experimental medicine. 2009;206:2469–2481. doi: 10.1084/jem.20090525. [DOI] [PMC free article] [PubMed] [Google Scholar]
- Kamimura Y, Lanier LL. Rapid and sequential quantitation of salivary gland-associated mouse cytomegalovirus in oral lavage. Journal of virological methods. 2014;205:53–56. doi: 10.1016/j.jviromet.2014.03.029. [DOI] [PMC free article] [PubMed] [Google Scholar]
- Kim D, Langmead B, Salzberg SL. HISAT: a fast spliced aligner with low memory requirements. Nat Methods. 2015;12:357–360. doi: 10.1038/nmeth.3317. [DOI] [PMC free article] [PubMed] [Google Scholar]
- Klenerman P, Oxenius A. T cell responses to cytomegalovirus. Nature reviews Immunology. 2016;16:367–377. doi: 10.1038/nri.2016.38. [DOI] [PubMed] [Google Scholar]
- Klose CS, Flach M, Mohle L, Rogell L, Hoyler T, Ebert K, Fabiunke C, Pfeifer D, Sexl V, Fonseca-Pereira D, et al. Differentiation of type 1 ILCs from a common progenitor to all helper-like innate lymphoid cell lineages. Cell. 2014;157:340–356. doi: 10.1016/j.cell.2014.03.030. [DOI] [PubMed] [Google Scholar]
- Klose CS, Kiss EA, Schwierzeck V, Ebert K, Hoyler T, d’Hargues Y, Goppert N, Croxford AL, Waisman A, Tanriver Y, et al. A T-bet gradient controls the fate and function of CCR6-RORgammat+ innate lymphoid cells. Nature. 2013;494:261–265. doi: 10.1038/nature11813. [DOI] [PubMed] [Google Scholar]
- Koues OI, Collins PL, Cella M, Robinette ML, Porter SI, Pyfrom SC, Payton JE, Colonna M, Oltz EM. Distinct Gene Regulatory Pathways for Human Innate versus Adaptive Lymphoid Cells. Cell. 2016;165:1134–1146. doi: 10.1016/j.cell.2016.04.014. [DOI] [PMC free article] [PubMed] [Google Scholar]
- Lanier LL. Evolutionary struggles between NK cells and viruses. Nature reviews Immunology. 2008;8:259–268. doi: 10.1038/nri2276. [DOI] [PMC free article] [PubMed] [Google Scholar]
- Liao Y, Smyth GK, Shi W. The Subread aligner: fast, accurate and scalable read mapping by seed-and-vote. Nucleic acids research. 2013;41:e108. doi: 10.1093/nar/gkt214. [DOI] [PMC free article] [PubMed] [Google Scholar]
- Liu F, Song Y, Liu D. Hydrodynamics-based transfection in animals by systemic administration of plasmid DNA. Gene therapy. 1999;6:1258–1266. doi: 10.1038/sj.gt.3300947. [DOI] [PubMed] [Google Scholar]
- Loh J, Chu DT, O’Guin AK, Yokoyama WM, Virgin HWt. Natural killer cells utilize both perforin and gamma interferon to regulate murine cytomegalovirus infection in the spleen and liver. Journal of virology. 2005;79:661–667. doi: 10.1128/JVI.79.1.661-667.2005. [DOI] [PMC free article] [PubMed] [Google Scholar]
- Love MI, Huber W, Anders S. Moderated estimation of fold change and dispersion for RNA-seq data with DESeq2. Genome biology. 2014;15:550. doi: 10.1186/s13059-014-0550-8. [DOI] [PMC free article] [PubMed] [Google Scholar]
- Mackay LK, Minnich M, Kragten NA, Liao Y, Nota B, Seillet C, Zaid A, Man K, Preston S, Freestone D, et al. Hobit and Blimp1 instruct a universal transcriptional program of tissue residency in lymphocytes. Science. 2016;352:459–463. doi: 10.1126/science.aad2035. [DOI] [PubMed] [Google Scholar]
- Mudge JM, Harrow J. Creating reference gene annotation for the mouse C57BL6/J genome assembly. Mamm Genome. 2015;26:366–378. doi: 10.1007/s00335-015-9583-x. [DOI] [PMC free article] [PubMed] [Google Scholar]
- Nguyen KB, Salazar-Mather TP, Dalod MY, Van Deusen JB, Wei XQ, Liew FY, Caligiuri MA, Durbin JE, Biron CA. Coordinated and distinct roles for IFN-alpha beta, IL-12, and IL-15 regulation of NK cell responses to viral infection. Journal of immunology. 2002;169:4279–4287. doi: 10.4049/jimmunol.169.8.4279. [DOI] [PubMed] [Google Scholar]
- Ninomiya T, Takimoto H, Matsuzaki G, Hamano S, Yoshida H, Yoshikai Y, Kimura G, Nomoto K. Vgamma1+ gammadelta T cells play protective roles at an early phase of murine cytomegalovirus infection through production of interferon-gamma. Immunology. 2000;99:187–194. doi: 10.1046/j.1365-2567.2000.00938.x. [DOI] [PMC free article] [PubMed] [Google Scholar]
- O’Sullivan TE, Rapp M, Fan X, Weizman OE, Bhardwaj P, Adams NM, Walzer T, Dannenberg AJ, Sun JC. Adipose-Resident Group 1 Innate Lymphoid Cells Promote Obesity-Associated Insulin Resistance. Immunity. 2016;45:428–441. doi: 10.1016/j.immuni.2016.06.016. [DOI] [PMC free article] [PubMed] [Google Scholar]
- O’Sullivan TE, Sun JC, Lanier LL. Natural Killer Cell Memory. Immunity. 2015;43:634–645. doi: 10.1016/j.immuni.2015.09.013. [DOI] [PMC free article] [PubMed] [Google Scholar]
- Paya CV, Hermans PE, Wiesner RH, Ludwig J, Smith TF, Rakela J, Krom RA. Cytomegalovirus hepatitis in liver transplantation: prospective analysis of 93 consecutive orthotopic liver transplantations. The Journal of infectious diseases. 1989;160:752–758. doi: 10.1093/infdis/160.5.752. [DOI] [PubMed] [Google Scholar]
- Peng H, Jiang X, Chen Y, Sojka DK, Wei H, Gao X, Sun R, Yokoyama WM, Tian Z. Liver-resident NK cells confer adaptive immunity in skin-contact inflammation. The Journal of clinical investigation. 2013;123:1444–1456. doi: 10.1172/JCI66381. [DOI] [PMC free article] [PubMed] [Google Scholar]
- Rankin LC, Groom JR, Chopin M, Herold MJ, Walker JA, Mielke LA, McKenzie AN, Carotta S, Nutt SL, Belz GT. The transcription factor T-bet is essential for the development of NKp46+ innate lymphocytes via the Notch pathway. Nature immunology. 2013;14:389–395. doi: 10.1038/ni.2545. [DOI] [PMC free article] [PubMed] [Google Scholar]
- Robinette ML, Fuchs A, Cortez VS, Lee JS, Wang Y, Durum SK, Gilfillan S, Colonna M Immunological Genome, C. Transcriptional programs define molecular characteristics of innate lymphoid cell classes and subsets. Nature immunology. 2015;16:306–317. doi: 10.1038/ni.3094. [DOI] [PMC free article] [PubMed] [Google Scholar]
- Salazar-Mather TP, Orange JS, Biron CA. Early murine cytomegalovirus (MCMV) infection induces liver natural killer (NK) cell inflammation and protection through macrophage inflammatory protein 1alpha (MIP-1alpha)-dependent pathways. The Journal of experimental medicine. 1998;187:1–14. doi: 10.1084/jem.187.1.1. [DOI] [PMC free article] [PubMed] [Google Scholar]
- Satpathy AT, Kc W, Albring JC, Edelson BT, Kretzer NM, Bhattacharya D, Murphy TL, Murphy KM. Zbtb46 expression distinguishes classical dendritic cells and their committed progenitors from other immune lineages. The Journal of experimental medicine. 2012;209:1135–1152. doi: 10.1084/jem.20120030. [DOI] [PMC free article] [PubMed] [Google Scholar]
- Schenkel JM, Fraser KA, Beura LK, Pauken KE, Vezys V, Masopust D. T cell memory. Resident memory CD8 T cells trigger protective innate and adaptive immune responses. Science. 2014;346:98–101. doi: 10.1126/science.1254536. [DOI] [PMC free article] [PubMed] [Google Scholar]
- Schenkel JM, Masopust D. Tissue-resident memory T cells. Immunity. 2014;41:886–897. doi: 10.1016/j.immuni.2014.12.007. [DOI] [PMC free article] [PubMed] [Google Scholar]
- Serafini N, Vosshenrich CA, Di Santo JP. Transcriptional regulation of innate lymphoid cell fate. Nature reviews Immunology. 2015;15:415–428. doi: 10.1038/nri3855. [DOI] [PubMed] [Google Scholar]
- Shih HY, Sciume G, Mikami Y, Guo L, Sun HW, Brooks SR, Urban JF, Jr, Davis FP, Kanno Y, O’Shea JJ. Developmental Acquisition of Regulomes Underlies Innate Lymphoid Cell Functionality. Cell. 2016;165:1120–1133. doi: 10.1016/j.cell.2016.04.029. [DOI] [PMC free article] [PubMed] [Google Scholar]
- Sojka DK, Plougastel-Douglas B, Yang L, Pak-Wittel MA, Artyomov MN, Ivanova Y, Zhong C, Chase JM, Rothman PB, Yu J, et al. Tissue-resident natural killer (NK) cells are cell lineages distinct from thymic and conventional splenic NK cells. Elife. 2014;3:e01659. doi: 10.7554/eLife.01659. [DOI] [PMC free article] [PubMed] [Google Scholar]
- Sun JC, Beilke JN, Lanier LL. Adaptive immune features of natural killer cells. Nature. 2009;457:557–561. doi: 10.1038/nature07665. [DOI] [PMC free article] [PubMed] [Google Scholar]
- Sun JC, Madera S, Bezman NA, Beilke JN, Kaplan MH, Lanier LL. Proinflammatory cytokine signaling required for the generation of natural killer cell memory. The Journal of experimental medicine. 2012;209:947–954. doi: 10.1084/jem.20111760. [DOI] [PMC free article] [PubMed] [Google Scholar]
- Townsend MJ, Weinmann AS, Matsuda JL, Salomon R, Farnham PJ, Biron CA, Gapin L, Glimcher LH. T-bet regulates the terminal maturation and homeostasis of NK and Valpha14i NKT cells. Immunity. 2004;20:477–494. doi: 10.1016/s1074-7613(04)00076-7. [DOI] [PubMed] [Google Scholar]
- Trinchieri G. Interleukin-12 and the regulation of innate resistance and adaptive immunity. Nature reviews Immunology. 2003;3:133–146. doi: 10.1038/nri1001. [DOI] [PubMed] [Google Scholar]
- van Dommelen SL, Tabarias HA, Smyth MJ, Degli-Esposti MA. Activation of natural killer (NK) T cells during murine cytomegalovirus infection enhances the antiviral response mediated by NK cells. J Virol. 2003;77:1877–1884. doi: 10.1128/JVI.77.3.1877-1884.2003. [DOI] [PMC free article] [PubMed] [Google Scholar]
- van Gisbergen KP, Kragten NA, Hertoghs KM, Wensveen FM, Jonjic S, Hamann J, Nolte MA, van Lier RA. Mouse Hobit is a homolog of the transcriptional repressor Blimp-1 that regulates NKT cell effector differentiation. Nat Immunol. 2012;13:864–871. doi: 10.1038/ni.2393. [DOI] [PubMed] [Google Scholar]
- von Andrian UH, Mackay CR. T-cell function and migration. Two sides of the same coin. The New England journal of medicine. 2000;343:1020–1034. doi: 10.1056/NEJM200010053431407. [DOI] [PubMed] [Google Scholar]
- Wesley JD, Tessmer MS, Chaukos D, Brossay L. NK cell-like behavior of Valpha14i NK T cells during MCMV infection. PLoS pathogens. 2008;4:e1000106. doi: 10.1371/journal.ppat.1000106. [DOI] [PMC free article] [PubMed] [Google Scholar]
Associated Data
This section collects any data citations, data availability statements, or supplementary materials included in this article.
Supplementary Materials
(A–C) Mixed bone marrow chimeric (mBMC) mice harboring WT (CD45.1+) and selected transcription factor deficient (CD45.2+) bone marrow were analyzed 8 weeks post reconstitution for ILC populations. Data is shown as relative chimerism of the KO (CD45.2+) to WT (CD45.1+) ratio of lymphocyte populations normalized to the ratio of control WT (CD45.1+) and WT (CD45.2+) reconstituted mBMC. Quantification of relative chimerism of (A) WT and Tbx21−/− mice, (B) WT and NK-Eomes−/− mice, and (C) WT and Nfil3−/− mice, in indicated peripheral organs. Data are representative of 2 independent experiments with n=3–5 mice per group. Samples were compared using an unpaired, two-tailed Student’s t test, and data are presented as the mean ± SEM (*p<0.05, **p<0.01, ***p<0.001, ****p<0.0001).
(A) CDF plot for comparison of RNA-seq log2(PC CD49b+Eomes+ / PC CD49b Eomes) for all expressed genes with ILC1-specific and NK-specific genes identified from all other ILC1 and NK samples across tissues. Shown are the number of genes in each group, p-value from the Kolomogorov-Smirnov test (see Methods). (B) RNA-sequencing reveals gene expression signature of the indicated cell populations sorted purified from Eomes-GFP mice. Differentially expressed genes with FDR-adjusted p-value less than 10−12 (228 total). (C) RNA-seq log2(NK / ILC1) for previously identified NK & ILC signature genes (see Methods). (D) Representative histograms show indicated surface markers on resting NK and ILC1 in indicated tissue of WT mice. Data are representative of 2 – 3 independent experiments with (A–C) n=40–50 mice, (D), n= 5 mice per group.
(A) Schematic of experiment. Briefly splenic NK cells (CD45.2+Lin−NK1.1+Eomes+CD49b+Ly49h+CD49a−CD200r1−) were sort purified from Eomes-GFP mice and adoptively transferred i.v. into Ly49H–deficient CD45.1+ recipients. Mice were then infected with MCMV i.p. (B) Representative histograms show indicated surface markers on NK and ILC1 harvested at indicated time points PI. (C) Representative histograms of indicated surface markers on uninfected splenic mNK (grey) and Liver ILC1 (black) and adoptively transferred splenic NK cells (red) recovered in the spleen seven days PI. Data are representative of 2 independent experiments with n=3–5 mice per group.
(A–B) Quantification of intracellular IFN-γ staining of indicated group 1 ILC populations at various time points following either Influenza (i.n.) or MCMV (i.n.) in i.v. unlabeled fraction of indicated organ. (C–D) Flow plots show intracellular IFN-γ staining of indicated lymphocyte population from WT mice in PC (i.p. infection) or liver (h.d. infection) at 24 hrs PI with MCMV. (E) Flow plots show intracellular IFN-γ staining of indicated lymphocyte population from WT mice in i.v. unlabeled fraction of the lung at 36 hours PI with SeV (i.n.) Data are representative of 2–3 independent experiments with n=4–6 mice per group. Samples were compared using an unpaired, two-tailed Student’s t test, and data are presented as the mean ± SEM (*p<0.05, ***p<0.001).
(A) mBMC harboring WT (CD45.1+) and Hobit-deficient (Zfp683−/−) (CD45.2+) bone marrow were analyzed 8 weeks post reconstitution for ILC populations. Data is shown as relative chimerism of the KO (CD45.2+) to WT (CD45.1+) ratio of lymphocyte populations normalized to the ratio of control WT (CD45.1+) and WT (CD45.2+) reconstituted mBMC. (B) Percent ILC1 and NK cells of total NK1.1+ cells in the PC, liver, and spleen of WT, Zfp683−/−, and NK-Eomes−/− mice. (C) The total cell number of indicated population WT and Zfp683−/− mice (D–F) WT/Zfp683−/− mBMC were infected with MCMV i.p. and analyzed in the liver at 36 hrs PI. (D) Relative chimerism of Zfp683−/− NK cells in the liver during infection. (E–D) Quantification of intracellular IFN-γ staining of NK cells by percentage and MFI. Data are representative of 2 independent experiments with n=3–5 mice per group. Samples were compared using an unpaired, two-tailed Student’s t test, and data are presented as the mean ± SEM (*p<0.05, **p<0.01).
(A–B) (A) Schematic of experiment. Briefly, Nfil3−/− mice were treated with either PBS+α-Ly49H or α-NK1.1+α-Ly49H and then infected with MCMV i.p. (B) Viral titers of each indicated cohort are shown for PC, Blood, and Spleen at 24 hrs PI. Data are representative of 2 independent experiments with n=3–5 mice per group. Samples were compared using an unpaired, two tailed Student’s t test, and data are presented as the mean ± SEM (*p<0.05)
(A–E) Il-12p40-YFP mice were infected with MCMV by either i.p. or h.d. injection and peripheral tissues were harvest and analyzed for YFP+ cells at various time points PI. (A) Representative plots of non-biased analysis of YFP+ cells in PC (i.p. infection, upper panel) and liver (h.d. infection lower panel,) at 12 hrs PI (B–C) (B) Flow plots and (C) graphs show percentages of YFP+ cells in different PC populations at 12, 24, and 36 hours PI (i.p.). (D) Quantification of YFP+ cDC1 in peripheral tissues at 12, 24, and 36 hrs PI (i.p.). (E) Quantification of YFP+ in the lung 36 hrs PI with SeV or Influenza (i.n). (F) The total cell number of cDC1 in the PC at 12, 24, and 36 hrs PI (i.p.). (G–H) Peripheral tissue of cDC-WT and cDC-Irf8−/− mice were harvested and analyzed for total cell count in indicated populations. Data are representative of 2 independent experiments with n=3–5 mice per group. Samples were compared using an unpaired, two-tailed Student’s t test, and data are presented as the mean ± SEM (*p<0.05).
Data Availability Statement
The datasets generated and analyzed during the current study will promptly be uploaded to a publicly available data repository.