

Abstract
Objective
This study aims to assess the efficacy and safety of Gelesis100, a novel, nonsystemic, superabsorbent hydrogel to treat overweight or obesity.
Methods
The Gelesis Loss Of Weight (GLOW) study was a 24‐week, multicenter, randomized, double‐blind, placebo‐controlled study in patients with BMI ≥ 27 and ≤ 40 kg/m2 and fasting plasma glucose ≥ 90 and ≤ 145 mg/dL. The co‐primary end points were placebo‐adjusted weight loss (superiority and 3% margin super‐superiority) and at least 35% of patients in the Gelesis100 group achieving ≥ 5% weight loss.
Results
Gelesis100 treatment caused greater weight loss over placebo (6.4% vs. 4.4%, P = 0.0007), achieving 2.1% superiority but not 3% super‐superiority. Importantly, 59% of Gelesis100‐treated patients achieved weight loss of ≥ 5%, and 27% achieved ≥ 10% versus 42% and 15% in the placebo group, respectively. Gelesis100‐treated patients had twice the odds of achieving ≥ 5% and ≥ 10% weight loss versus placebo (adjusted OR: 2.0, P = 0.0008; OR: 2.1, P = 0.0107, respectively), with 5% responders having a mean weight loss of 10.2%. Patients with prediabetes or drug‐naive type 2 diabetes had six times the odds of achieving ≥ 10% weight loss. Gelesis100 treatment had no apparent increased safety risks.
Conclusions
Gelesis100 is a promising new nonsystemic therapy for overweight and obesity with a highly desirable safety and tolerability profile.
Introduction
Obesity increases the risk for several life‐threatening diseases 1, 2, 3, 4, 5. Importantly, the increased risk of death is not limited to severe or Class II (BMI 35 to 40 kg/m2) and Class III (BMI > 40 kg/m2) obesity but begins in patients who have a BMI of 25 kg/m2 6, 7 and continues in Class I obesity (BMI 30 to 35 kg/m2) 8. In fact, 40% of BMI‐related deaths and 37% of disability‐adjusted life years in 2015 occurred in patients with overweight 4, and Class I obesity was associated with reduced life expectancy by 2 to 4 years 8.
Only 2% of patients with overweight or obesity receive antiobesity drug therapy despite the overwhelming evidence of the growing burden of excess weight 7, 9. In contrast, more than 80% of patients with type 2 diabetes (T2D) are prescribed antidiabetes pharmacotherapy 10. Considering that obesity is a major cause of T2D, these realities are paradoxical. Multiple studies documented that therapeutic inertia is high in the management of weight, particularly in patients with lower BMI 11. The highest rates of weight management interventions by primary care physicians occur for patients in the Class III obesity category and the lowest for patients in the overweight category; rates also correlated with the presence of comorbidities 12, 13. A 2016 obesity survey among health care professionals reported that 60% of antiobesity pharmacotherapy is disproportionally prescribed for patients in Class II or Class III obesity 11. Health care providers addressing weight management issues are challenged by numerous barriers, but the concerns about tolerability and safety of currently available interventions likely contribute to this resistance to treat obesity 14.
There is thus an urgent need for therapies that increase patients’ odds for achieving clinically meaningful weight loss with little or no additional safety risk compared with lifestyle interventions. Such therapies could allow clinicians to intervene earlier in the overweight and obesity continuum and prevent progression or delay associated comorbidities while helping to overcoming the current therapeutic inertia.
Gelesis100 is a nonsystemic, superabsorbent hydrogel developed for the treatment of overweight or obesity. It is made from two naturally derived building blocks, modified cellulose cross‐linked with citric acid, that create a three‐dimensional matrix. Orally administered in capsules with water before a meal, Gelesis100 particles rapidly absorb water in the stomach and homogeneously mix with ingested foods. When hydrated, the recommended dose of Gelesis100 occupies about one‐fourth of the average stomach volume. Rather than forming one large mass, it creates thousands of small individual gel pieces with the elasticity (firmness) of solid ingested foods (e.g., vegetables) without caloric value 15. Gelesis100 maintains its three‐dimensional structure and mechanical properties during transit through the small intestine. Once it arrives in the large intestine, the hydrogel is partially broken down by enzymes and loses its three‐dimensional structure along with most of its absorption capacity. The released water is reabsorbed, and the remaining cellulosic material is expelled in the feces. Gelesis100 is considered a medical device because it achieves its primary intended purpose through mechanical modes of action 16 consistent with mechanobiology constructs 17. Gelesis100 received a Nonsignificant Risk designation by the Food and Drug Administration.
Herein, we report results from the Gelesis Loss Of Weight (GLOW) pivotal study that assessed the safety and efficacy of Gelesis100 in patients with overweight or obesity, with and without T2D. Results of GLOW’s 24‐week extension (GLOW‐EX) study are also presented.
Methods
Study design and treatment
GLOW was a multicenter, randomized, double‐blind, placebo‐controlled, pivotal study assessing the safety and efficacy of Gelesis100 administered for 24 weeks on body weight in adults with overweight or obesity, with or without T2D. The 24‐week open‐label extension study (GLOW‐EX) was offered to the last 52 patients who completed treatment (placebo or Gelesis100) and lost ≥ 3% of their body weight from baseline. GLOW and GLOW‐EX were conducted in accordance with the Good Clinical Practice guidelines as defined by the International Conference on Harmonisation, the Declaration of Helsinki, the International Organization for Standardization 14155:2011 (Clinical Investigation of Medical Devices for Human Subjects), and all applicable federal and local medical device guidelines and regulations. Institutional review boards, independent ethics committees, and European Competent Authorities approved the study protocol and informed consent documents. A study design schematic of GLOW and GLOW‐EX can be found in Supporting Information Figure S1.
For 168 days, patients self‐administered three capsules containing either 2.25 g of Gelesis100 or placebo with 500 mL of water 20 to 30 minutes before lunch and dinner. Patients were prescribed a hypocaloric diet of 300 kcal/d below their calculated energy requirement (with 45% to 50% of daily calorie intake from carbohydrates, ≤ 30% from fat, and 20% to 25% from protein). Patients were instructed to perform daily moderate‐intensity exercise (e.g., 30 minutes of walking/day) and maintain their smoking habits during the study.
Patients
Eligible patients were men and nonpregnant, nonlactating women aged 22 to 65 years with BMI ≥ 27 and ≤ 40 and fasting plasma glucose (FPG) ≥ 90 and ≤ 145 mg/dL at screening (visit 1). Patients with BMI < 30 were required to have at least one of the following comorbidities: dyslipidemia (defined as serum low‐density lipoprotein cholesterol [LDL‐C] ≥ 130 and < 190 mg/dL and/or triglycerides [TG] ≥ 150 and < 500 mg/dL), hypertension (supine systolic blood pressure [SBP] ≥ 140 and < 160 mmHg and/or supine diastolic blood pressure [DBP] ≥ 90 and < 95 mmHg), or drug‐naive or metformin‐treated T2D.
Patients were excluded from the study if they were of childbearing potential and not using contraception; had type 1 diabetes; or had a history of eating disorders (except for mild binge eating disorder), significant gastrointestinal disorders, and gastric bypass or other gastrointestinal surgery. Patients with hemoglobin A1c > 8.5% (> 69 mmol/mol), who had a weight change > 3 kg within 3 months of screening, or who required medications administered with meals were also excluded. Depression was not an exclusion criterion unless it required a drug causing weight change.
Efficacy assessments
GLOW study
The co‐primary efficacy end points were the percent change in body weight from baseline (visit 2) to day 171 (visit 13) and the percent of patients who lost ≥ 5% body weight from baseline to day 171. Secondary efficacy end points included percent change in body weight in patients with impaired FPG (IFG) at baseline, change in plasma glucose status in IFG, percent change in plasma glucose in IFG and T2D, change in BMI, and change in hemoglobin A1c in T2D from baseline to day 171. Selected tertiary efficacy end points included the percent of patients who lost ≥ 10% body weight and percent change from baseline to day 171 in estimated excess body weight, serum insulin, homeostasis model assessment‐insulin resistance (HOMA‐IR), LDL‐C, HDL‐C, TG, waist circumference, and supine and standing SBP and DBP. Baseline measurements were assessed on day 0. Treatment began on day 1 and ended on day 169. There were approximately 2 days between the end of treatment and study end point assessments (day 171) to allow the remaining Gelesis100 to be eliminated from the gastrointestinal tract.
GLOW‐EX study
The GLOW‐EX study evaluated the durability of the efficacy of Gelesis100 over a 48‐week exposure and assessed the incremental weight loss benefit by adding Gelesis100 after patients’ successful weight loss with lifestyle modification (placebo) over the initial 24 weeks. The co‐primary efficacy end points included the percent change in body weight from GLOW baseline (day 0) to day 339 and from GLOW‐EX baseline (day 171) to day 339 as well as the percent of patients who lost ≥ 5% body weight from GLOW baseline to day 339 and from GLOW‐EX baseline to day 339.
Safety assessments
The safety and tolerability of Gelesis100 were assessed by recording all adverse events (AEs) and serious AEs (SAEs) and monitoring results from physical examinations, vital sign measurements, and fasting clinical laboratory tests, which included hematology, blood chemistry, and vitamin levels. For the GLOW study, all AEs and SAEs reported after randomization and up to 28 days after the last treatment administration (day 197) were recorded. For the GLOW‐EX study, all AEs and SAEs reported up to 28 days after the last treatment administration (day 365) were recorded.
Statistical analysis
Sample size was calculated using PASS power analysis software (NCSS, LLC, Kaysville, Utah). A total of 430 patients were randomized 1:1 to have 172 completers per treatment group based on 20% dropout rate. This sample size was expected to provide 85% statistical power to detect a difference of ≥ 3% weight loss and 90% statistical power to establish that the difference between the two treatment groups was greater than 0 (superiority with a standard deviation [SD] of 5.0% and a type I error of 0.05 in a two‐sided test). The co‐primary end points were placebo‐adjusted percent weight loss super‐superiority with a margin of 3% and at least 35% of patients on Gelesis100 achieving at least 5% weight loss. A prespecified analysis of simple superiority was also performed. Stratification factors using characteristics obtained at the screening visit were used to balance treatment group assignments. The stratification was based on groups of countries, sex, BMI, and screening FPG at the time of randomization.
In the pilot clinical study First Loss Of Weight (FLOW), elevated FPG and particularly prediabetes status at baseline were associated with greater weight loss in patients treated with Gelesis100 18. To evaluate this hypothesis further, GLOW included screening FPG as a stratification factor.
Continuous variables are presented as mean (SD) unless otherwise specified. Statistical software SAS version 9.3 or later (SAS Institute, Inc., Cary, North Carolina) was used for statistical analysis. The primary efficacy analysis was performed using the intention‐to‐treat (ITT) population consisting of all randomized patients, with missing data imputed using a robust multiple imputation analysis (SAS PROC MI, SAS Institute). For the two treatment groups, analysis of covariance (ANCOVA) was performed to compare the percent change in body weight from baseline to day 171 (two‐sided α = 0.05). The logit model was used to determine the percent body weight responders. Secondary and tertiary end points were analyzed using a closed test procedure with ANCOVA. All P values are from logistic regression models adjusted for baseline weight and stratification factors. HOMA‐IR was calculated by multiplying fasting serum insulin (mU/L) by FPG (mmol/L) and dividing by 22.5.
Additional analyses included weight loss‐related end points among FPG subgroups (based on two consecutive FPG measurements per American Diabetes Association guidelines) 19 who had no missing data (completers). An area under the curve (AUC) of the receiver operating characteristic (ROC) was completed as a post hoc analysis to model the predictive power of early weight loss for responder status with the optimal point determined by the Youden index. The AUC ROC analysis optimized the balance between positive predictive value or percent of patients with early weight loss response who had ≥ 5% weight loss after 24 weeks and negative predictive value or the percent of patients with early weight loss response who had < 5% weight loss after 24 weeks. The cutoff for positive predictive value and negative predictive value was set at 80%.
The safety population was defined as any patient receiving at least one dose of investigational product after randomization. Safety data are reported as number of patients experiencing an event, using a 95% confidence interval (CI) for AE comparison across treatment groups. The 95% CI was calculated using the Clopper‐Pearson method.
GLOW‐EX effectiveness end points were assessed by comparing the 95% CI from baseline of GLOW to day 171, and from baseline of GLOW to day 339, with the overlapping 95% CI representing maintenance of the effect. Percent change in body weight from baseline of GLOW or GLOW‐EX to day 339 and P values were determined using paired t tests (two‐sided α = 0.05) for both treatment groups.
Results
Patient disposition and baseline demographics
Of the 904 patients screened for eligibility, 436 were randomized (223 patients allocated to the Gelesis100 group and 213 patients allocated to the placebo group), and 324 completed the treatment phase of the GLOW study (172 in the Gelesis100 group and 152 in the placebo group) (Figure 1). A total of 112 patients were withdrawn from the study (51 [23%] in the Gelesis100 group and 61 [29%] in the placebo group. The most common reason for withdrawal by patient was for lifestyle or personal choice (Figure 1).
Figure 1.
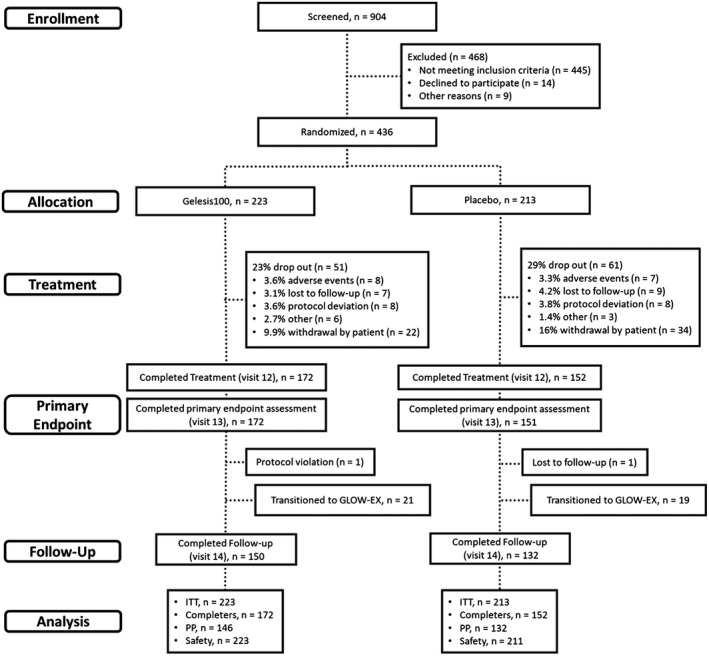
Patient disposition. GLOW, Gelesis Loss Of Weight; EX, extension; ITT, intention‐to‐treat; PP, per‐protocol.
Demographics and baseline characteristics were overall similar between groups (Table 1). Patients were mostly middle‐aged, white, and equally distributed across the treatment groups by sex. A total of 284 patients (70% of the Gelesis100 group and 61% of the placebo group) had either overweight or Class I obesity. Baseline weight and waist circumference were significantly lower in the Gelesis100 group versus placebo (P = 0.0348 and P = 0.0249, respectively). The primary end point analyses account for this difference, as baseline BMI and weight were covariates in the ANCOVA models. At baseline, most patients had high normal FPG ≥ 90 mg/dL (136/223 patients [61%] in the Gelesis100 group and 122/213 patients [57%] in the placebo group).
Table 1.
Baseline demographics and disease characteristics (ITT population)
| Parametera | Gelesis100 (n = 223) | Placebo (n = 213) | P value |
|---|---|---|---|
| Age (y) | 48.2 (9.9) | 47.8 (10.9) | 0.734 |
| Sex, n (%) | |||
| Female | 125 (56.1) | 120 (56.3) | 1.0000 |
| Male | 98 (43.9) | 93 (43.7) | |
| Race, n (%) | 0.7345 | ||
| White | 189 (84.8) | 180 (84.5) | |
| Black/African American | 26 (11.7) | 24 (11.3) | |
| Other | 8 (3.5) | 9 (4.2) | |
| Ethnicity, n (%) | 0.3217 | ||
| Hispanic or Latino | 11 (4.9) | 16 (7.5) | |
| Weight, kg b | 97.6 (14.4) | 100.6 (15.3) | 0.0348 |
| BMI, kg/m2 | 33.5 (3.2) | 34.1 (3.2) | 0.0784 |
| Waist circumference, cm b | 108.3 (10.7) | 110.7 (11.0) | 0.0249 |
| Weight categories, n (%) | 0.1457 | ||
| Overweight | 26 (11.7) | 21 (9.9) | |
| Obesity Class I | 129 (57.8) | 108 (50.7) | |
| Obesity Class II | 68 (30.5) | 84 (39.4) | |
| Comorbidities, n (%) | 0.7557 | ||
| Dyslipidemia c | 154 (69.1) | 154 (72.3) | 0.4406 |
| Hypertension d | 67 (30.0) | 60 (28.2) | 0.4638 |
| Prediabetes e | 66 (29.6) | 66 (31.0) | 0.6748 |
| T2D | 21 (9.4) | 25 (11.7) | 0.3405 |
| FPG, mg/dL | |||
| Normoglycemia | 91.7 (5.7) | 91.8 (5.6) | 0.8986 |
| Prediabetes | 107.7 (5.7) | 108.4 (6.5) | 0.5414 |
| Drug‐naive T2D | 133.7 (42.2) | 138.2 (8.8) | 0.4800 |
| Treated T2D (metformin) | 116.2 (19.9) | 117.4 (20.3) | 0.8690 |
| Insulin, mU/L | |||
| Normoglycemia | 9.4 (4.9) | 10.1 (5.4) | 0.2904 |
| Prediabetes | 13.7 (7.3) | 12.6 (7.9) | 0.4110 |
| Drug‐naive T2D | 42.2 (58.0) | 26.2 (15.7) | 0.5047 |
| Treated T2D (metformin) | 17.2 (21.7) | 13.3 (9.1) | 0.5408 |
| HOMA‐IR | |||
| Normoglycemia | 2.1 (1.1) | 2.3 (1.2) | 0.3493 |
| Prediabetes | 3.7 (2.0) | 3.4 (2.1) | 0.3999 |
| Drug‐naive T2D | 15.5 (23.8) | 8.8 (5.0) | 0.4891 |
| Treated T2D (metformin) | 5.6 (8.6) | 4.1 (3.4) | 0.5426 |
| Current smokers, n (%) | 23 (10.3) | 24 (11.3) | 0.7599 |
| Postmenopausal, n (%) | 57/125 (45.6) | 51/120 (42.5) | 0.6996 |
| Untreated | 55 (96.5) | 50 (98.0) | 1.0000 |
| Treated (estrogen) | 2 (3.5) | 1 (2.0) |
Data presented as mean (SD) unless otherwise specified.
Weight and waist circumference parameters significantly different between groups at baseline (P = 0.0348 and 0.0249, respectively).
Dyslipidemia defined as serum low‐density lipoprotein cholesterol ≥ 130 and <190 mg/dL and/or triglycerides ≥ 150 and <500 mg/dL.
Hypertension defined as systolic blood pressure ≥ 140 mmHg or diastolic blood pressure ≥ 90 mmHg.
Prediabetes was defined based on 1 FPG measurement at visit 2.
FPG, fasting plasma glucose; HOMA‐IR, homeostasis model assessment‐insulin resistance; T2D, type 2 diabetes; ITT, intention‐to‐treat.
GLOW results
Efficacy
In the ITT population, there was a greater percent change in body weight from baseline to day 171 in the Gelesis100 group (mean −6.4% [SD 5.8%]) versus placebo (mean −4.4% [SD 5.5%]) (Figure 2A), with a placebo‐adjusted least squares mean difference of −2.1% (P = 0.0007) (Table 2). The study demonstrated superiority over placebo but not super‐superiority with 3% margin.
Figure 2.
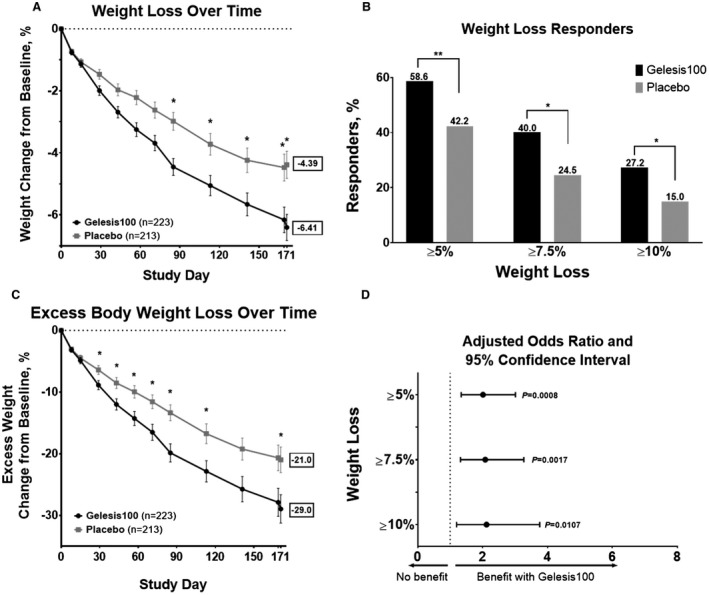
Weight loss with Gelesis100 versus placebo treatment during the GLOW study among patients in the ITT population. (A) Percent change in body weight from baseline (day 0) to day 171 (after 2 days of washout) by treatment group. Error bars represent standard error of the mean (SEM). (B) Percent responders with ≥ 5% (P = 0.0008), ≥ 7.5% (P = 0.0017), or ≥ 10% (P = 0.0107) weight loss in all patients. (C) Percent change in excess body weight from baseline (day 0) to day 171 (after 2 days of washout) by treatment group. Error bars represent SEM. (D) Adjusted odds ratio (95% confidence interval) for achieving ≥ 5% (2.0 [1.3‐3.0]), ≥ 7.5% (2.1 [1.3‐3.3]), and ≥ 10% (2.1 [1.2‐3.8]) weight loss. *P < 0.05; **P < 0.001. All P values are from logistic regression models adjusted for baseline weight and stratification factors. GLOW, Gelesis Loss Of Weight; ITT, intention‐to‐treat.
Table 2.
Change from baseline for weight‐related and comorbidity parameters.
| Mean change (SD) a | |||||
|---|---|---|---|---|---|
| Parameter b | Gelesis100 (n = 223) | Placebo (n = 213) | LS mean difference (SD) | 95% CI | P value |
| Weight‐related | |||||
| Weight, % | –6.4 (5.8) | –4.4 (5.5) | –2.1 (0.6) | (–3.2, –0.9) | 0.0007 |
| Body mass index, kg/m b | –2.1 (1.9) | –1.5 (1.9) | –0.6 (0.2) | (–1.0, –0.2) | 0.0039 |
| Excess body weight, % | –29.0 (30.1) | –21.0 (25.7) | –6.4 (2.9) | (–12.2, –0.6) | 0.0295 |
| Waist circumference, cm | –6.7 (5.6) | –5.0 (5.9) | –1.9 (0.6) | (–3.1, –0.6) | 0.0038 |
| Mean change (95% CI) e | |||||
| Parameter b | Gelesis100 ( n = 223) | Placebo (n = 213) | Difference (SD) | 95% CI | P value |
| Comorbidity | |||||
| Dyslipidemia c | |||||
| LDL‐C, % | n = 83 | n = 84 | 0.0347 | ||
| –11.2 (–14.5, –7.8) | –5.9 (–8.8, –3.0) | –4.7 (2.2) | (–9.0, –0.3) | ||
| TG, % | n = 58 | n = 53 | 0.2694 | ||
| –18.0 (–30.0, –5.9) | –8.0 (–23.3, 7.4) | –11.0 (9.9) | (–30.7, 8.7) | ||
| Hypertension d | |||||
| n = 38 | n = 34 | (–5.7, 3.6) | 0.6528 | ||
| SBP, mmHg | –9.3 (–12.4, –6.2) | –9.2 (–12.8, –5.6) | –1.0 (2.3) | ||
| DBP, mmHg | –7.5 (–9.6, –5.4) | –4.7 (–7.2, –2.2) | –1.3 (1.4) | (–4.1, 1.4) | 0.3452 |
| Conversion to normotensive, % f | OR | ||||
| 68.4 | 44.1 | 2.9 | (1.0, 7.9) | 0.0434 | |
Data presented as mean change (SD) unless otherwise specified.
Parameters are percent change unless otherwise specified.
Dyslipidemia defined as LDL‐C >130 mg/dL or TG >150 mg/dL at baseline (LDL‐C/TG baseline values = 161/227 mg/dL for Gelesis100 and 159/222 mg/dL for placebo).
Hypertension is defined as SBP >140 mmHg or DBP >90 mmHg at baseline (SBP/DBP baseline values = 143.5/88.5 mmHg and 145.0/85.9 mmHg for Gelesis100 and placebo, respectively).
Completer data presented as mean (95% CI).
OR and 95% CI from logistic regression model adjusted for stratification factors and baseline SBP and DBP.
LS, least squares; LDL‐C, low‐density lipoprotein cholesterol; TG, triglycerides; SBP, systolic blood pressure; DBP, diastolic blood pressure; OR, odds ratio.
Notably, significantly more patients treated with Gelesis100 achieved ≥ 5% weight loss (co‐primary end point) versus placebo (59% vs. 42%) (Figure 2B), and 27% of patients treated with Gelesis100 achieved ≥ 10% weight loss versus 15% of patients treated with placebo. Patients treated with Gelesis100 had twice the odds of achieving ≥ 5% weight loss versus placebo (adjusted odds ratio [OR]: 2.0; P = 0.0008). For these responders, the mean weight loss was 10.2% ± 4.1%. Similarly, Gelesis100‐treated patients had twice the odds of achieving ≥ 7.5% (OR: 2.1; P = 0.0017) and ≥ 10% (OR: 2.1; P = 0.0107) weight loss (Figure 2D). Patients treated with Gelesis100 sustained markedly greater weight loss over time without plateauing (Figure 2A).
Of the secondary end points, only reduction in BMI reached statistical significance versus placebo (P = 0.0039). In addition to the percent of patients achieving ≥ 10% weight loss, the other tertiary end points that were statistically different were excess body weight (Figure 2C; P = 0.0295) and waist circumference (P = 0.0038) (Table 2).
Predictors of response
In a previous clinical study (FLOW), an association was observed between elevated FPG and greater treatment effect, particularly among patients with FPG ≥ 100 mg/dL at baseline18. In the GLOW study, there were 32 patients in the Gelesis100 group and 36 patients in the placebo group with prediabetes (FPG ≥ 100 mg/dL and < 126 mg/dL) or drug‐naive T2D (FPG ≥ 126 mg/dL), based on two consecutive FPG measurements at visit 1 and visit 2. The mean (SD) percent change in body weight from baseline to day 171 was −8.1% (6.5%) and −5.6% (4.9%) for the Gelesis100 and placebo treatment groups, respectively (adjusted mean standard error [SE] difference of −2.5% [1.4]; P = 0.0820).
More patients with prediabetes or drug‐naive T2D (53%) achieved ≥ 7.5%, and almost half (44%) achieved ≥ 10% weight loss versus 25% and 14% of patients in the placebo group, respectively (Figure 3C). The odds of achieving ≥ 7.5% or ≥ 10% weight loss were 3.4 and 6.1 times higher in the Gelesis100 group versus the placebo group (P = 0.0272 and 0.0071, respectively) (Figure 3D).
Figure 3.
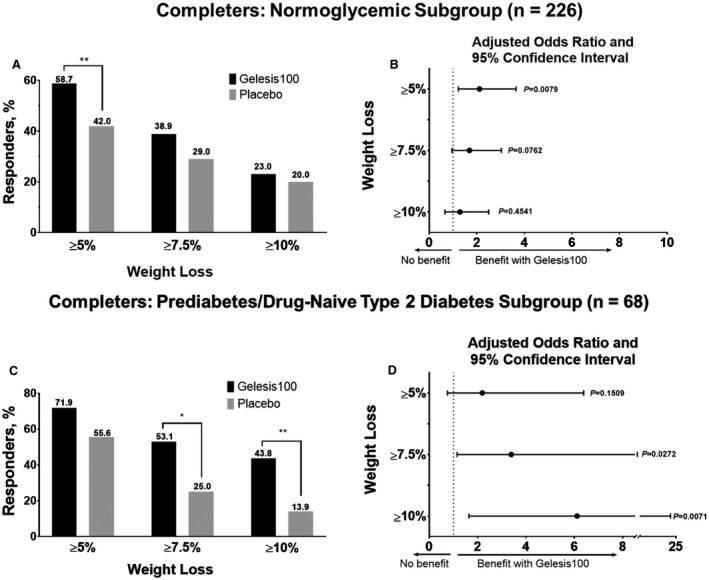
Weight loss with Gelesis100 versus placebo treatment during the GLOW study among completers. (A) Percent responders with ≥ 5% (Gelesis100, n = 74; placebo, n = 42; P = 0.0079), ≥ 7.5% (Gelesis100, n = 49; placebo, n = 49; P = 0.0726), and ≥ 10% (Gelesis100, n = 29; placebo, n = 20; P = 0.4541) weight loss in normoglycemic completers (n = 226). (B) Adjusted odds ratio (95% confidence interval) of ≥ 5% (2.1 [1.2‐3.7]), ≥ 7.5% (1.7 [1.0‐3.0]), and ≥ 10% (1.3 [0.7‐2.5]) weight loss achieved by normoglycemic completers between treatment groups. (C) Percent responders with ≥ 5% (Gelesis100, n = 23; placebo, n = 20; P = 0.1509), ≥ 7.5% (Gelesis100, n = 17; placebo, n = 9; P = 0.0272), and ≥ 10% (Gelesis100, n = 14; placebo, n = 5; P = 0.0071) weight loss in completers with prediabetes or drug‐naive T2D (n = 68). (D) Adjusted odds ratio (95% confidence interval) of ≥ 5% (2.2 [0.8‐6.4]), ≥ 7.5% (3.4 [1.2‐10.0]), and ≥ 10% (6.1 [1.6‐22.8]) weight loss achieved by completers with prediabetes or drug‐naive T2D between treatment groups. T2D, type 2 diabetes. *P < 0.05; **P < 0.01. All P values are from logistic regression models adjusted for baseline weight and stratification factors. GLOW, Gelesis Loss Of Weight.
AUC ROC analysis showed that early response to Gelesis100 treatment (≥ 3% weight loss from baseline at week 8) successfully predicted clinically meaningful weight loss (≥ 5%) at 24 weeks. More than 85% of patients who went on to achieve ≥ 5% weight loss at 6 months had lost ≥ 3% of body weight at 8 weeks. Notably, early responders achieved mean weight loss of 9.9% versus 2.1% in nonearly responders at week 24 (Table 3). The placebo group did not reach the required threshold for sensitivity and specificity until near the end of treatment (Table 3).
Table 3.
AUC ROC analysis for 5% responders in Gelesis100 and placebo groups.
| Percent change in weight from baseline | Optimal threshold | Sensitivity | Specificity | AUC | SE a | Lower 95% CIb | Upper 95% CI b |
|---|---|---|---|---|---|---|---|
| Gelesis100 | |||||||
| Visit 3, week 1 | −0.9106 | 0.5657 | 0.7324 | 0.6795 | 0.0423 | 0.5966 | 0.7625 |
| Visit 4, week 2 | −1.3793 | 0.6000 | 0.7917 | 0.7727 | 0.0352 | 0.7037 | 0.8417 |
| Visit 5, week 4 | −2.2876 | 0.7400 | 0.8310 | 0.8515 | 0.0285 | 0.7956 | 0.9075 |
| Visit 6, week 6 | −2.8678 | 0.7600 | 0.8310 | 0.8811 | 0.0247 | 0.8326 | 0.9296 |
| Visit 7, week 8 | −3.0272 | 0.8485 | 0.8732 | 0.9105 | 0.0216 | 0.8683 | 0.9528 |
| Visit 8, week 10 | −3.1504 | 0.8485 | 0.8592 | 0.9175 | 0.0206 | 0.8772 | 0.9578 |
| Visit 9, week 12 | −3.4913 | 0.9000 | 0.8333 | 0.9242 | 0.0195 | 0.8859 | 0.9624 |
| Visit 10, week 16 | −4.2219 | 0.9100 | 0.8889 | 0.9590 | 0.0128 | 0.9339 | 0.9840 |
| Visit 11, week 20 | −4.1945 | 0.9600 | 0.8889 | 0.9818 | 0.0070 | 0.9681 | 0.9955 |
| Visit 12, week 24 | −5.1163 | 0.9500 | 1.0000 | 0.9965 | 0.0021 | 0.9924 | 1.0000 |
| Placebo | |||||||
| Visit 3, week 1 | −1.4541 | 0.4531 | 0.8636 | 0.6779 | 0.0443 | 0.5911 | 0.7647 |
| Visit 4, week 2 | −2.1179 | 0.5238 | 0.8636 | 0.7335 | 0.0416 | 0.6519 | 0.8151 |
| Visit 5, week 4 | −1.7578 | 0.7813 | 0.7614 | 0.8215 | 0.0348 | 0.7534 | 0.8897 |
| Visit 6, week 6 | −3.2967 | 0.6563 | 0.8864 | 0.8267 | 0.0348 | 0.7586 | 0.8948 |
| Visit 7, week 8 | −2.1951 | 0.8438 | 0.7614 | 0.8823 | 0.0269 | 0.8295 | 0.9350 |
| Visit 8, week 10 | −4.0948 | 0.6825 | 0.9318 | 0.8864 | 0.0257 | 0.8359 | 0.9368 |
| Visit 9, week 12 | −4.0000 | 0.7813 | 0.8864 | 0.9119 | 0.0219 | 0.8690 | 0.9549 |
| Visit 10, week 16 | −4.8048 | 0.8438 | 0.9342 | 0.9414 | 0.0185 | 0.9051 | 0.9777 |
| Visit 11, week 20 | −4.8908 | 0.9063 | 0.9342 | 0.9729 | 0.0113 | 0.9508 | 0.9951 |
| Visit 12, week 24 | −4.7668 | 0.9688 | 0.9773 | 0.9952 | 0.0030 | 0.9893 | 1.0011 |
The first time point in which sensitivity and specificity were both above 80% occurred at week 8 for Gelesis100 and week 16 for placebo (represented in bold).
Optimal threshold to predict 5% or greater weight loss at 24 weeks in Gelesis100 group is at least 3% weight loss at 8 weeks. Early responders achieved mean weight loss of 9.9% at week 24 versus 2.1% for non‐early responders.
When applying the threshold of 3% weight loss at 8 weeks to placebo group, mean weight loss of 8.9% at week 24 for early responders versus 1.5% for non‐early responders was observed. However, the analysis for placebo group demonstrated predictive values >0.8 only at 16 weeks with weight loss threshold of 4.8%.
AUC, area under the curve; ROC, receiver operating characteristic.
SE of AUC.
95% CI for AUC.
Effect on cardiovascular risk factors
Overall, there were no significant differences between groups in the well‐known cardiovascular risk factors such as LDL‐C, HDL‐C, TG, SBP, DBP, or insulin resistance estimated by HOMA‐IR. However, in patients who started with elevated levels, those treated with Gelesis100 had a greater reduction in LDL‐C levels (P = 0.0347) and greater conversion rate to normal blood pressure (P = 0.0434) (Table 2). Patients with elevated HOMA‐IR at baseline treated with Gelesis100 had a reduction compared with the placebo group (P = 0.0080) (Figure 4). This improvement in HOMA‐IR was mainly driven by a reduction in fasting serum insulin in the Gelesis100 group (P = 0.0102).
Figure 4.
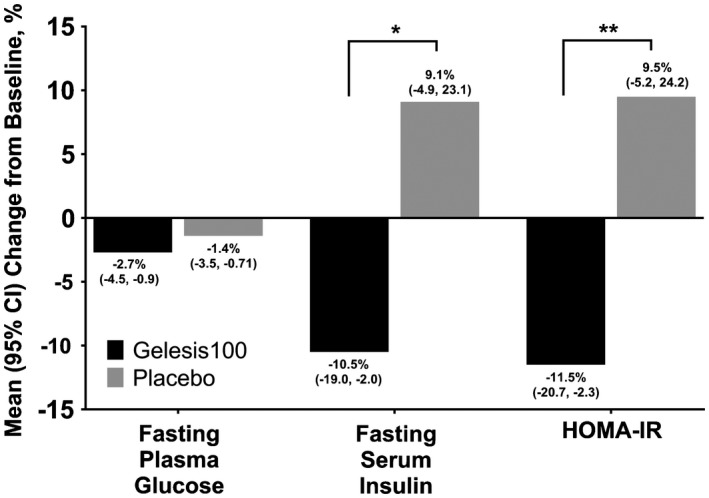
Percent change from baseline in glycemic control parameters (completers with baseline FPG ≥ 90 mg/dL and not treated with antidiabetes medication). Baseline FPG was 100.9 mg/dL in the Gelesis100 group and 102.5 mg/dL in the placebo group. Mean percent change (95% CI) from baseline in FPG in Gelesis100 (n = 121) and placebo (n = 111; P = 0.1872). Baseline fasting serum insulin was 11.5 mU/L in the Gelesis100 group and 12.1 mU/L in the placebo group. Mean percent change (95% CI) from baseline in fasting serum insulin in Gelesis100 (n = 120) and placebo (n = 111; P = 0.0102). Baseline HOMA‐IR was 2.9 in the Gelesis100 group and 3.2 in the placebo group. Mean percent change (95% CI) from baseline in HOMA‐IR in Gelesis100 (n = 120) and placebo (n = 111; P = 0.0080). *P < 0.05; **P < 0.01. FPG, fasting plasma glucose; HOMA‐IR, homeostasis model assessment‐insulin resistance.
Safety
All 436 patients in the GLOW study are included in the safety analysis except for 2 patients in the placebo group who did not receive the investigational product. The most common AEs in both groups were gastrointestinal related, infections and infestations, and musculoskeletal and connective tissue disorders. The most common (> 5%) gastrointestinal AEs in the Gelesis100 group were diarrhea, abdominal distension, infrequent bowel movements, flatulence, constipation, nausea, and abdominal pain. In the Gelesis100 group, 158 (85%) gastrointestinal AEs reported by 84 (38%) patients were deemed possibly or probably related to the study treatment versus 105 (78%) AEs reported by 58 (28%) patients in the placebo group (P = 0.0248). Fifteen patients withdrew from the study because of an AE (eight in the Gelesis100 group and seven in the placebo group) before completing the treatment phase; five in the Gelesis100 group and four in the placebo group were considered probably or possibly related to the study treatment (Table 4).
Table 4.
Adverse events (safety population).
| Patients, n (%) | Difference (95% CI) | P value | Patients, n (%) | Difference (95% CI) | P value | |||
|---|---|---|---|---|---|---|---|---|
| All | Probably or possibly related | |||||||
| Gelesis100 (n = 223) | Placebo (n = 211) | Gelesis100 (n = 223) | Placebo (n = 211) | |||||
| Summary | ||||||||
| Any AE | 159 (71.3) | 149 (70.6) | 0.7 (−8.1 to 9.5) | 0.9159 | 88 (39.5) | 64 (30.3) | 9.1 (−0.2 to 18.2) | 0.0557 |
| Mild | 124 (55.6) | 117 (55.5) | 0.2 (−9.4 to 9.8) | 1.0000 | 75 (33.6) | 54 (25.6) | 8.0 (−0.9 to 16.8) | 0.0744 |
| Moderate | 88 (39.5) | 83 (39.3) | 0.1 (−9.3 to 9.6) | 1.0000 | 24 (10.8) | 18 (8.5) | 2.2 (−3.8 to 8.2) | 0.5165 |
| Severe | 8 (3.6) | 10 (4.7) | −1.2 (−5.6 to 3.1) | 0.6335 | 3 (1.3) | 2 (0.4) | 0.4 (−2.6 to 3.4) | 1.0000 |
| Withdrawal due to AE | 8 (3.6) | 7 (3.3) | 0.3 (−3.9 to 4.3) | 1.0000 | 5 (2.2) | 4 (1.9) | 0.3 (−3.2 to 3.8) | 1.0000 |
| System organ class AEs (most common [≥ 2%]) | ||||||||
| Blood and lymphatic system disorders | 1 (0.4) | 1 (0.5) | −0.0 (−2.6 to 2.4) | 1.0000 | 0 (0) | 0 (0) | ||
| Cardiac disorders | 0 (0) | 1 (0.5) | −0.5 (−3.0 to 1.7) | 0.4862 | 0 (0) | 0 (0) | ||
| Ear and labyrinth disorders | 0 (0) | 2 (0.9) | −0.9 (−3.7 to 1.3) | 0.2358 | 0 (0) | 0 (0) | ||
| Eye disorders | 6 (2.7) | 2 (0.9) | 1.7 (−1.5 to 5.2) | 0.2860 | 0 (0) | 1 (0.5) | −0.5 (−3.0 to 1.7) | 0.4862 |
| Gastrointestinal related | 96 (43.0) | 72 (34.1) | 8.9 (−0.6 to 18.2) | 0.0614 | 84 (37.7) | 58 (27.5) | 10.2 (1.0 to 19.1) | 0.0248 |
| Diarrhea | 28 (12.6) | 18 (8.5) | 4.0 (−2.2 to 10.2) | 0.2121 | 23 (10.3) | 16 (7.6) | 2.7 (−3.1 to 8.5) | 0.4015 |
| Abdominal distension | 26 (11.7) | 14 (6.6) | 5.0 (−0.8 to 10.9) | 0.0959 | 24 (10.8) | 12 (5.7) | 5.1 (−0.5 to 10.7) | 0.0579 |
| Infrequent bowel movements | 21 (9.4) | 10 (4.7) | 4.7 (−0.6 to 10.0) | 0.0641 | 20 (9.0) | 10 (4.7) | 4.2 (−1.0 to 9.5) | 0.0910 |
| Flatulence | 19 (8.5) | 11 (5.2) | 3.3 (−1.9 to 8.6) | 0.1899 | 19 (8.5) | 10 (4.7) | 3.8 (−1.4 to 9.0) | 0.1272 |
| Abdominal pain | 12 (5.4) | 6 (2.8) | 2.5 (−1.8 to 6.9) | 0.2313 | 11 (4.9) | 6 (2.8) | 2.1 (−2.1 to 6.4) | 0.3258 |
| Constipation | 12 (5.4) | 11 (5.2) | 0.2 (−4.7 to 4.9) | 1.0000 | 10 (4.5) | 10 (4.7) | −0.3 (−4.9 to 4.2) | 1.0000 |
| Nausea | 11 (4.9) | 11 (5.2) | −0.3 (−5.1 to 4.4) | 1.0000 | 8 (3.6) | 8 (3.8) | −0.2 (−4.5 to 3.9) | 1.0000 |
| Dyspepsia | 9 (4.0) | 2 (0.9) | 3.1 (−0.4 to 6.9) | 0.0632 | 7 (3.1) | 2 (0.9) | 2.2 (−1.1 to 5.8) | 0.1766 |
| Frequent bowel movements | 8 (3.6) | 7 (3.3) | 0.3 (−3.9 to 4.3) | 1.0000 | 8 (3.6) | 7 (3.3) | 0.3 (−3.9 to 4.3) | 1.0000 |
| Abdominal pain upper | 0 (0) | 9 (4.3) | −2.0 (−6.2 to 1.8) | 0.2830 | 4 (1.8) | 5 (2.4) | −0.6 (−4.2 to 2.8) | 0.7454 |
| Feces hard | 2 (0.9) | 5 (2.4) | −1.5 (−4.9 to 1.6) | 0.2730 | 2 (0.9) | 5 (2.4) | −1.5 (−4.9 to 1.6) | 0.2730 |
| General disorders and administration site conditions | 9 (4.0) | 16 (7.6) | −3.5 (−8.6 to 1.3) | 0.1486 | 1 (0.4) | 1 (0.5) | −0.0 (−2.6 to 2.4) | 1.0000 |
| Hepatobiliary disorders | 1 (0.4) | 0 (0) | 0.4 (−1.8 to 2.9) | 1.0000 | 0(0) | 0 (0) | ||
| Infections and infestations | 74 (33.2) | 70 (33.2) | 0.0 (−9.1 to 9.1) | 1.0000 | 2 (0.9) | 1 (0.5) | 0.4 (−2.2 to 3.1) | 1.0000 |
| Nasopharyngitis | 26 (11.7) | 30 (14.2) | −2.6 (−9.3 to 4.1) | 0.4750 | 0 (0) | 0 (0) | ||
| Influenza | 9 (4.0) | 10 (4.7) | −0.7 (−5.3 to 3.7) | 0.8162 | 0 (0) | 0 (0) | ||
| Upper respiratory tract infection | 8 (3.6) | 12 (5.7) | −2.1 (−6.8 to 2.3) | 0.3623 | 0 (0) | 0 (0) | ||
| Bronchitis | 5 (2.2) | 1 (0.5) | 1.8 (−1.1 to 5.0) | 0.2166 | 0 (0) | 0 (0) | ||
| Gastroenteritis | 5 (2.2) | 4 (1.9) | 0.3 (−3.2 to 3.8) | 1.0000 | 0 (0) | 0 (0) | ||
| Viral infection | 4 (1.8) | 5 (2.4) | −0.6 (−4.2 to 2.8) | 0.7454 | 0 (0) | 0 (0) | ||
| Injury, poisoning, and procedural complications | 22 (9.9) | 12 (5.7) | 4.2 (−1.3 to 9.7) | 0.1116 | 0 (0) | 0 (0) | ||
| Investigations | 10 (4.5) | 7 (3.3) | 1.2 (−3.1 to 5.4) | 0.6244 | 3 (1.3) | 3 (1.4) | −0.1 (−3.3 to 3.0) | 1.0000 |
| Metabolism and nutrition disorders | 3 (1.3) | 6 (2.8) | −1.5 (−5.2 to 1.8) | 0.3269 | 0 (0) | 4 (1.9) | −1.9 (−5.1 to 0.6) | 0.0551 |
| Musculoskeletal and connective tissue disorders | 31 (13.9) | 34 (16.1) | −2.2 (−9.3 to 4.9) | 0.5908 | 2 (0.9) | 0 (0) | 0.9 (−1.5 to 3.5) | 0.4992 |
| Back pain | 8 (3.6) | 10 (4.7) | −1.2 (−5.6 to 3.1) | 0.6335 | 0 (0) | 0 (0) | ||
| Arthralgia | 7 (3.1) | 13 (6.2) | −3.0 (−7.7 to 1.4) | 0.1702 | 0 (0) | 0 (0) | ||
| Neoplasms benign, malignant and unspecified (incl. cysts and polyps) | 1 (0.4) | 3 (1.4) | −1.0 (−4.0 to 1.7) | 0.3599 | 0 (0) | 0 (0) | ||
| Nervous system disorders | 27 (12.1) | 22 (10.4) | 1.7 (−4.7 to 8.0) | 0.6499 | 4 (1.8) | 2 (0.9) | 0.8 (−2.2 to 4.0) | 0.6860 |
| Headache | 16 (7.2) | 18 (8.5) | −1.4 (−7.0 to 4.1) | 0.7213 | 2 (0.9) | 2 (0.9) | −0.1 (−2.9 to 2.7) | 1.0000 |
| Psychiatric disorders | 4 (1.8) | 3 (1.4) | 0.4 (−2.9 to 3.6) | 1.0000 | 0 (0) | 0 (0) | ||
| Renal and urinary disorders | 3 (1.3) | 6 (2.8) | −1.5 (−5.2 to 1.8) | 0.3269 | 1 (0.4) | 0 (0) | 0.4 (−1.8 to 2.9) | 1.0000 |
| Reproductive system and breast disorders | 4 (1.8) | 4 (1.9) | −0.1 (−3.5 to 3.2) | 1.0000 | 0 (0) | 1 (0.5) | −0.5 (−3.0 to 1.7) | 0.4862 |
| Respiratory, thoracic, and mediastinal disorders | 6 (2.7) | 13 (6.2) | −3.5 (−8.1 to 0.8) | 0.1002 | 1 (0.4) | 1 (0.5) | −0.0 (−2.6 to 2.4) | 1.0000 |
| Oropharyngeal pain | 1 (0.4) | 6 (2.8) | −2.4 (−6.0 to 0.5) | 0.0615 | 0 (0) | 0 (0) | ||
| Skin and subcutaneous tissue disorders | 5 (2.2) | 5 (2.4) | −0.1 (−3.8 to 3.4) | 1.0000 | 1 (0.4) | 3 (1.4) | −1.0 (−4.0 to 1.7) | 0.3599 |
| Vascular disorders | 3 (1.3) | 2 (0.9) | 0.4 (−2.6 to 3.4) | 1.0000 | 0 (0) | 0 (0) | ||
AE, adverse event.
Overall, gastrointestinal‐related AEs were significantly different between groups (P = 0.0248). However, none of the individual gastrointestinal AEs, regardless of their level of severity, reached statistical significance. Most of these events were assessed as mild. The incidence of gastrointestinal events considered to be either moderate or severe was 39 events in 21 patients in the Gelesis100 group and 22 events in 15 patients in the placebo group.
In the Gelesis100 group, eight patients reported a severe AE versus ten patients in the placebo group. The majority of severe AEs occurred within 3 months of randomization and were resolved within 2 weeks without sequelae. In the placebo group, one patient (0.5%) reported an SAE of a benign colon tumor. No patients in the Gelesis100 group reported an SAE. No deaths occurred during the study.
There were no significant differences in the serum levels of vitamins A, B1, B2, B6, B9, B12, and D between the two groups in the subcohort whose vitamin levels were measured.
In summary, other than an increase in overall gastrointestinal AEs, there was no difference in the incidence and severity of AEs between the Gelesis100 and placebo groups. In both treatment groups, most AEs were mild or moderate in intensity, occurred within the first 3 months, and resolved within 2 weeks (Table 4).
GLOW‐EX results
GLOW‐EX was offered to the last 52 completers of the GLOW study (Gelesis100 and placebo groups) who had lost ≥ 3% body weight from baseline. Of these eligible patients, 39 (21 from the Gelesis100 group and 18 from the placebo group) enrolled in GLOW‐EX. Patients treated with Gelesis100 in GLOW achieved a mean of 7.1% (SD 2.8%) weight loss at the time of enrollment in GLOW‐EX. Continuation of Gelesis100 resulted in a mean of 7.6% (SD 5.1%) weight loss at 48 weeks (ITT population, P < 0.0001 from GLOW baseline), showing maintenance of weight loss at 48 weeks. Patients treated with placebo in GLOW achieved a mean of 7.1% (SD 4.1%) weight loss at the time of enrollment in GLOW‐EX. Addition of Gelesis100 resulted in a mean of 9.4% (SD 6.4%) weight loss at 48 weeks (ITT population, P < 0.0001 from GLOW baseline). GLOW‐EX safety results were consistent with the GLOW safety data. During GLOW‐EX, no SAEs were reported.
Discussion
Results from the GLOW study demonstrate that Gelesis100 is an effective weight loss therapy that is safe and well tolerated. Repeated administration of Gelesis100 over 6 months resulted in significant weight loss over placebo (P = 0.0007). Although the placebo‐adjusted weight loss was 2.1% and did not reach the 3% threshold, importantly, 59% of patients treated with Gelesis100 lost ≥ 5% of their body weight (co‐primary end point) and 27% lost ≥ 10%, versus 42% and 15% with placebo, respectively. The odds to achieve both thresholds were doubled versus placebo (adjusted OR). Of note, Gelesis100 treatment had no increased safety risk, and only gastrointestinal AEs, when combined, were reported at a higher (9%) incidence than with placebo. Notably, only five patients withdrew from the Gelesis100 group because of gastrointestinal‐related AEs versus four from the placebo group.
New tools are needed to supplement lifestyle management for treatment of overweight and obesity. There is a particular need for treatments that produce significant weight loss without major AEs 11, 14. The outstanding safety profile of Gelesis100 combined with its demonstrated efficacy should make it an attractive option for obesity treatment.
There is wide interindividual variability in response to weight loss therapies, and it would be helpful to understand how to better match treatment to the patient 20. The availability of reliable weight loss predictors would increase the probability of patients achieving and maintaining weight loss and could improve cost‐effectiveness 20. The GLOW study revealed the following two useful tools that could support a personalized approach utilizing Gelesis100 and guide clinicians in selecting patients who will benefit the most from treatment: FPG and weight loss achieved as early as 8 weeks of therapy.
In the FLOW pilot study, an unexpected association was observed between baseline FPG levels and the effectiveness of the treatment 18. The GLOW study replicated these findings. Despite the fact that in patients with prediabetes or drug‐naive T2D the difference between the treatment groups for achieving ≥ 5% weight loss was not significant, as the thresholds for weight loss became higher and harder to achieve, the difference became substantial and significant. Similarly, the increase in 5% responders over normoglycemic patients was the same in both treatment groups. However, a clear difference favoring Gelesis100 was observed in the 7.5% and 10% responder groups (Figure 3). When taking Gelesis100, the odds of achieving ≥ 10% weight loss were six times higher compared with placebo for patients with prediabetes or drug‐naive T2D. This finding demonstrated a benefit for a higher‐risk population otherwise known to be less responsive to therapy. Although this population was relatively small (n = 68), these findings, in addition to the results of the FLOW study, suggest that FPG could be a simple predictor that may be used as a tool for identifying patients who are both at higher clinical risk and more likely to achieve greater levels of weight loss when treated with Gelesis100.
Early response to treatment is an additional tool to predict the effectiveness of Gelesis100 treatment with a high level of precision. Results of AUC ROC analysis suggest that a weight loss of ≥ 3% after as few as 8 weeks of treatment with Gelesis100 is predictive of a weight loss of ≥ 5% after 6 months. Notably, early responders achieved a mean weight loss of 9.9% versus 2.1% in nonearly responders at week 24. Although there are no overall increased safety risks with Gelesis100, predicting successful treatment early allows efficient use of resources and provides a key milestone to motivate patients with overweight or obesity.
Long‐term weight loss maintenance is difficult to achieve solely with lifestyle modification interventions 21, 22. Weight loss was maintained for an additional 24 weeks among the 21 participants who lost at least 3% with Gelesis100 after 6 months in the GLOW study and who were enrolled in the GLOW‐EX study.
Considering the repeated intriguing findings in patients with elevated FPG and the observed reduction in insulin resistance in the Gelesis100 group (Figure 4), future studies should confirm these findings and explore the underlying mechanisms of action.
Given the evident safety profile of Gelesis100, it is important to undertake clinical studies in the pediatric population. Also, as the treatment of patients with overweight or obesity often involves multiple strategies, future studies of Gelesis100 treatment in combination with other therapeutic approaches are warranted.
In conclusion, Gelesis100 is an effective and safe new nonsystemic therapy with a unique mechanism of action for overweight and obesity. Treatment doubles the odds of achieving clinically meaningful weight loss (≥ 5% and ≥ 10%). In addition, because of its highly desirable safety and tolerability profile, if approved, Gelesis100 could be considered a promising new therapy for the treatment of overweight and obesity.
Supporting information
Acknowledgments
The authors would like to thank all the investigators, study site staff, and patient volunteers who participated in the GLOW and GLOW‐EX studies. A complete list of the study investigators is provided in the Supporting Information Table S1. Caroline Walsh Cazares and Lamara D. Shrode of JB Ashtin provided medical writing support (funded by Gelesis, Inc.), developed the first draft of the manuscript based on an author‐approved outline, and assisted in implementing author revisions throughout the editorial process. Elizabeth Kane of BBA provided statistical analysis support (funded by Gelesis, Inc.). The authors would also like to acknowledge EastHORN, Clinical Services in CEE, Ltd. (Nicosia, Cyprus), Clinical Research Technology s.r.l. (Salerno, Italy), RECERCA CLINICA, S.L. (Barcelona, Spain), Medpace Medical Device (Blaine, Minnesota), and PREVEDIG spol. s.r.o. (Prague, Czech Republic).
Gelesis is committed to responsible sharing of data from clinical trials we sponsor. This includes summary data and anonymized individual patient data as well as other information (e.g., protocols, clinical study reports). Requests from any qualified researchers who engage in rigorous, independent scientific research will be considered as long as the trials are not part of an ongoing or planned regulatory submission (this includes requests for data on unlicensed products and indications). Data will be provided following review and approval of a research proposal and statistical analysis plan and execution of a data sharing agreement. Data requests can be submitted at any time, and the data will be accessible for 12 months, with possible extensions considered. For more information on how to request access to the data, please email info@gelesis.com.
See Commentary, pg. 189.
Funding agencies: This study was supported by Gelesis, Inc.
Disclosure: FLG has received funding/grant support/honorarium from A2 Milk, Novo Nordisk, Novartis, NuSirt, Zaluvida, Baronova, Basic Research, JennyCraig/Curves, General Nutrition Corporation, Microbiome Therapeutics, NeuroQuest, Plensat, and Zafgen. LJA has received funding/grant support/honorarium from Gelesis, Myos Corporation, Jamieson Wellness, Aspire Bariatrics, Inc., Eisai, Inc., Allurion, Novo Nordisk, Pfizer, Takeda Pharmaceuticals, Zafgen BMIQ, ERX, Astra Zeneca, Sanofi, Janssen, and United Heath Group, and he owns Gelesis stock options as a scientific advisor. AR has received funding/grant support/honorarium from Arla Foods, Nordic Sugar, Harboe Breweries, The EU FP7 and Horizon2020 programs, The Cambridge Weight Plan, Dairy Research Institute (United States), International Sweeteners Association, The Danish Meat and Research Institute, Gelesis, and The Danish Agriculture & Food Council. AA has received funding/grant support/honorarium for consultancy from Dutch Beer Institute, Feast Kitchen, Groupe Ethique et Sante, McCain Foods Limited, Nestle Research Center, Weight Watchers, Arla Foods, Danish Dairy Research Council, Gelesis, BioCare Copenhagen, Zaluvida, Basic Research, Beachbody, Danish Agriculture and Food Council, Novo Nordisk, Saniona, Scandinavian Airlines System, and Ikea, and he owns Gelesis stock options as a scientific advisor. CMA has received funding/grant support/honorarium from Gelesis, Novo Nordisk, Rhythm, Takeda, and Orexigen, and she owns Gelesis stock options as a scientific advisor. JOH has received funding/grant support/honorarium from Gelesis, Dupont, National Cattlemen’s Beef Association, Retrofit, and General Mills, and he owns Gelesis stock options as a scientific advisor. LMK has received honorarium for consultancy from AMAG, Ethicon, Gelesis, Novartis, Novo Nordisk, Rhythm, and Sanofi, and he owns stock options of Gelesis as a scientific advisor. KF has received honorarium for consultancy from Gelesis. LG has received funding/grant support/honorarium from Novo Nordisk and L. Manetti‐H. Roberts & C. AS, CS, CD, LEU, HL, EC, ESR, YZ, and HMH own Gelesis stock or stock options as employees. EM, SS, LL, SNC, JAM, and CDS declared no conflict of interest.
Clinical trial registration: ClinicalTrials.gov identifier NCT03008954.
Article has been corrected by erratum posted 12 February 2019 and has since been updated.
References
- 1. Bessesen DH. Update on obesity. J Clin Endocrinol Metab 2008;93:2027‐2034. [DOI] [PubMed] [Google Scholar]
- 2. Bray GA. Medical consequences of obesity. J Clin Endocrinol Metab 2004;89:2583‐2589. [DOI] [PubMed] [Google Scholar]
- 3. Pi‐Sunyer X. The medical risks of obesity. Postgrad Med 2009;121:21‐33. [DOI] [PMC free article] [PubMed] [Google Scholar]
- 4. GBD 2015 Obesity Collaborators ; Afshin A, Forouzanfar MH, Reitsma MB, et al. Health effects of overweight and obesity in 195 countries over 25 years. N Engl J Med 2017;377:13‐27. [DOI] [PMC free article] [PubMed] [Google Scholar]
- 5. Berrington de Gonzalez A, Hartge P, Cerhan JR, et al. Body‐mass index and mortality among 1.46 million white adults. N Engl J Med 2010;363:2211‐2219. [DOI] [PMC free article] [PubMed] [Google Scholar]
- 6. Ng M, Fleming T, Robinson M, et al. Global, regional, and national prevalence of overweight and obesity in children and adults during 1980–2013: a systematic analysis for the Global Burden of Disease Study 2013. Lancet 2014;384:766‐781. [DOI] [PMC free article] [PubMed] [Google Scholar]
- 7. Xia Y, Kelton CM, Guo JJ, Bian B, Heaton PC. Treatment of obesity: pharmacotherapy trends in the United States from 1999 to 2010. Obesity (Silver Spring) 2015;23:1721‐1728. [DOI] [PubMed] [Google Scholar]
- 8. Prospective Studies Collaboration ; Whitlock G, Lewington S, Sherliker P, et al. Body‐mass index and cause‐specific mortality in 900 000 adults: collaborative analyses of 57 prospective studies. Lancet 2009;373:1083‐1096. [DOI] [PMC free article] [PubMed] [Google Scholar]
- 9. Samaranayake NR, Ong KL, Leung RY, Cheung BM. Management of obesity in the National Health and Nutrition Examination Survey (NHANES), 2007–2008. Ann Epidemiol 2012;22:349‐353. [DOI] [PubMed] [Google Scholar]
- 10. Thomas CE, Mauer EA, Shukla AP, Rathi S, Aronne LJ. Low adoption of weight loss medications: a comparison of prescribing patterns of antiobesity pharmacotherapies and SGLT2s. Obesity (Silver Spring) 2016;24:1955‐1961. [DOI] [PMC free article] [PubMed] [Google Scholar]
- 11. Shannon K, Koo M, Leckenby N. Obesity disease coverage. Datamonitor Healthcare report 2017:56‐59. [Google Scholar]
- 12. Booth HP, Prevost AT, Gulliford MC. Access to weight reduction interventions for overweight and obese patients in UK primary care: population‐based cohort study. BMJ Open 2015;5:e006642. doi: 10.1136/bmjopen-2014-006642 [DOI] [PMC free article] [PubMed] [Google Scholar]
- 13. McLaughlin JC, Hamilton K, Kipping R. Epidemiology of adult overweight recording and management by UK GPs: a systematic review. Br J Gen Pract 2017;67:e676‐e683. [DOI] [PMC free article] [PubMed] [Google Scholar]
- 14. Bray GA, Greenway FL. Pharmacological treatment of the overweight patient. Pharmacol Rev 2007;59:151‐184. [DOI] [PubMed] [Google Scholar]
- 15. Demitri C, Zohar Y, Heshmati HM, Urban LE, Aschenbach WG, Sannino A. Satiety and glycemic control enhancing properties vary between functional fibers, mixed salad, and a novel hydrogel (Gelesis100) [abstract 145‐LB]. Diabetes 2017;66(suppl 1A):LB38. [Google Scholar]
- 16. US Food and Drug Administration . Is the product a medical device? https://www.fda.gov/Medicaldevices/Deviceregulationandguidance/Overview/Classifyyourdevice/Ucm051512.htm. Updated March 22, 2018. Accessed July 17, 2018.
- 17. Lim CT, Bershadsky A, Sheetz MP. Mechanobiology. J R Soc Interface 2010;7(suppl 3):S291‐S293. [DOI] [PMC free article] [PubMed] [Google Scholar]
- 18. Astrup A, Kristensen M, Gnessi L, et al. Oral administration of Gelesis100, a novel hydrogel, significantly decreases body weight in overweight and obese subjects. Presented at: Endocrine Society’s 96th Annual Meeting and Expo; June 21‐24, 2014; Chicago, IL. Abstract SUN‐0897. [Google Scholar]
- 19. Association American Diabetes . 2. Classification and diagnosis of diabetes: Standards of Medical Care in Diabetes‐2018. Diabetes Care 2018;41(suppl 1):S13‐S27. [DOI] [PubMed] [Google Scholar]
- 20. Guaraldi F, Pagotto U, Pasquali R. Predictors of weight loss and maintenance in patients treated with antiobesity drugs. Diabetes Metab Syndr Obes 2011;4:229‐243. [DOI] [PMC free article] [PubMed] [Google Scholar]
- 21. Jensen MD, Ryan DH, Donato KA, et al. Guidelines (2013) for managing overweight and obesity in adults. Obesity (Silver Spring) 2014;22(S2):S1‐S410. [DOI] [PubMed] [Google Scholar]
- 22. Diabetes Prevention Program Research Group ; Knowler WC, Fowler SE, Hamman RF, et al. 10‐year follow‐up of diabetes incidence and weight loss in the Diabetes Prevention Program Outcomes Study. Lancet 2009;374:1677‐1686. [DOI] [PMC free article] [PubMed] [Google Scholar]
Associated Data
This section collects any data citations, data availability statements, or supplementary materials included in this article.
Supplementary Materials