

Abstract
Background
Sarcopenia, the unintentional loss of skeletal muscle mass, is associated with poor outcomes in adult patient populations. In adults, sarcopenia is often ascertained by cross‐sectional imaging of the psoas muscle area (PMA). Although children with chronic medical illnesses may be at increased risk for muscle loss because of nutritional deficiencies, physical deconditioning, endocrine anomalies, and systemic inflammation, consistent quantitative definitions for sarcopenia in children are lacking. We aimed to generate paediatric reference values for PMA at two intervertebral lumbar levels, L3–4 and L4–5.
Methods
In this cross‐sectional study, we analysed abdominal computed tomography scans of consecutive children presenting to the emergency department. Participants were children 1–16 years who required abdominal cross‐sectional imaging after paediatric trauma between January 1, 2005 and December 31, 2015 in a large Canadian quaternary care centre. Children with a documented chronic medical illness or an acute spinal trauma at presentation were excluded. Total PMA (tPMA) at levels L3–4 and L4–5 were measured in square millimetres (mm2) as the sum of left and right PMA. Age‐specific and sex‐specific tPMA percentile curves were modelled using quantile regression.
Results
Computed tomography images from 779 children were included. Values of tPMA at L4–5 were significantly larger than at L3–4 at all ages, but their correlation was high for both girls (r = 0.95) and boys (r = 0.98). Amongst girls, tPMA 50th percentile values ranged from 365 to 2336 mm2 at L3–4 and from 447 to 2704 mm2 for L4–5. Amongst boys, 50th percentile values for tPMA ranged between 394 and 3050 mm2 at L3–4 and from 498 to 3513 mm2 at L4–5. Intraclass correlation coefficients were excellent at L3–4 (0.97, 95% CI 0.94 to 0.981) and L4–5 (0.99, 95% CI 0.986 to 0.995). Weight and tPMA were correlated, stratified by sex for boys (L3–4 r = 0.90; L4–5 r = 0.90) and for girls (L3–4 r = 0.87; L4–5 r = 0.87). An online application was subsequently developed to easily calculate age‐specific and sex‐specific z‐scores and percentiles.
Conclusions
We provide novel paediatric age‐specific and sex‐specific growth curves for tPMA at intervertebral L3–4 and L4–5 levels for children between the ages of 1‐16 years. Together with an online tool (https://ahrc-apps.shinyapps.io/sarcopenia/), these tPMA curves should serve as a reference enabling earlier identification and targeted intervention of sarcopenia in children with chronic medical conditions.
Keywords: Sarcopenia, Children, Chronic Disease
1. Introduction
Sarcopenia refers to the loss of skeletal muscle mass and strength, typically accompanying the normal aging process as well as in chronic conditions.1, 2 Sarcopenia is a major cause of physical disability, poor quality of life, loss of independence, and death. Multiple modalities exist to evaluate muscle mass and nutritional status in clinical practice.3 While anthropometrics (such as weight, body mass index, mid‐arm circumference, and triceps skinfold thickness) and biochemical markers are readily clinically obtainable at the bedside,4, 5 their values may be imprecise or confounded by disease‐related complications such as concurrent ascites, peripheral oedema and organomegaly seen in patients with end‐stage organ failure, malignancy, chronic inflammatory disease conditions, or post‐surgery.6, 7, 8 Specialized investigations exist to ascertain sarcopenia, including bioelectrical impedance and air‐displacement plethysmography.9 However, these are not routinely obtained clinical tests and require dedicated training and equipment thereby limiting the widest utilization. Measurement of psoas muscle area (PMA) from single slice cross‐sectional abdominal computed tomography (CT) images represents an easily accessible and quick method to assess the presence of sarcopenia.10, 11 Amongst adults, multiple definitions of sarcopenia using PMA have been utilized, including distinct sex‐specific cut‐off values in healthy and diseased populations,12, 13, 14 as well as at different landmarks such as discrete lumbar (L3 and L4)disc levels, intervertebral lumbar (L3–4 and L4–5) disc levels, or the level of the umbilicus.11, 15, 16, 17, 18
Sarcopenia is not a problem exclusive to the adults. Children with chronic medical illnesses experience nutritional deficiencies, physical deconditioning, and systemic inflammation that are potentially contributory to the unintentional muscle loss demonstrated in paediatric leukaemia, inflammatory bowel disease, type 2 diabetes, end‐stage liver disease, or intestinal failure.6, 8, 19, 20, 21, 22, 23 Sarcopenia has been evaluated in the paediatric population using dual energy X‐absorptiometry24, 25 and abdominal CT imaging of the PMA at the L4 level.26 PMA reference values at various lumbar levels have been reported in the adult literature in acknowledgement that values may be impacted by refractory ascites and associated prominent lordosis, sacralization of the fourth lumbar vertebra, and lumbarization of the first sacral vertebra.27 However, reference values for adults cannot be extrapolated to growing children. Our goal was to generate sex‐specific and age‐specific PMA growth charts for intervertebral lumbar (L3–4 and L4–5) disc levels by reviewing clinically obtained cross‐sectional abdominal CT images for PMA values in a cohort of otherwise healthy children presenting after acute trauma to the emergency room of an academic health sciences centre.
2. Methods
2.1. Study population
We performed a cross‐sectional single‐centre study at the Hospital for Sick Children (SickKids) in Toronto, Canada. Patients were ascertained using the SickKids trauma database, a prospectively compiled database that houses clinical, biochemical, and radiological data from children presenting to the SickKids emergency room (ER). All children below 18 years of age presenting to the SickKids ER following acute trauma and requiring cross‐sectional abdominal CT imaging between January 2005 and December 2015 were eligible for inclusion. Children were excluded if their abdominal CT studies did not adequately scan the lumbar spine (L3–L5) region, or they had one or more of the following documented medical conditions: cerebral palsy, cardiac disease, malignancies, autoimmune diseases, diabetes mellitus, autistic spectrum disorders, thoracolumbar spinal trauma affecting paraspinal musculature, and chronic inflammatory disorders. The study was approved by the SickKids Research Ethics Board.
2.2. Data collection
All medical charts were reviewed for relevant clinical information, including sex, age at CT (years), weight (kilogrammes), height (metres), and other anthropometric data available. Sex‐specific and age‐specific anthropometric z‐scores were calculated from the Center for Disease Control and Prevention (CDC) reference charts.28
2.3. Measurement of muscle mass
Abdominal CT images were retrieved from the SickKids Picture Archiving and Communication System (PACS). From axial CT images, L3–4 and L4–5 levels were identified following cross‐referencing on sagittal plane reconstructions. Landmark lumbar (L3 and L4) vertebrae were identified in the sagittal plane by counting down from the thoracic (T12) vertebra, which was assumed to be the most caudal rib‐bearing vertebra. In cases where the exact level was unclear, we identified the cervical C2 level (in available cases where CT of neck, chest, and abdomen was performed) and counted vertebral bodies downwards (Figure 1). Alternatively, a chest X‐ray was reviewed to confirm 12 pairs of ribs were present, with the most caudal pair assumed to be T12. On the corresponding axial cross‐sectional images, we delineated bilateral PMA using a dedicated free‐hand region‐of‐interest measurement tool available on picture archiving and communication system at each of the intervertebral lumbar L3–4 and L4–5 levels, assessed in square millimetres (mm2) (Figure 1). The total PMA (tPMA) was expressed as the sum of the right and left PMA in square millimetres (mm2) for each level. All PMA measurements were performed by one paediatric radiologist (HP). A random age‐stratified subset of CT images was measured bilaterally at both L3–4 and L4–5 levels by a second paediatric radiologist (GC) to ensure adequate interrater reliability. Both radiologists were blinded to clinical data.
Figure 1.
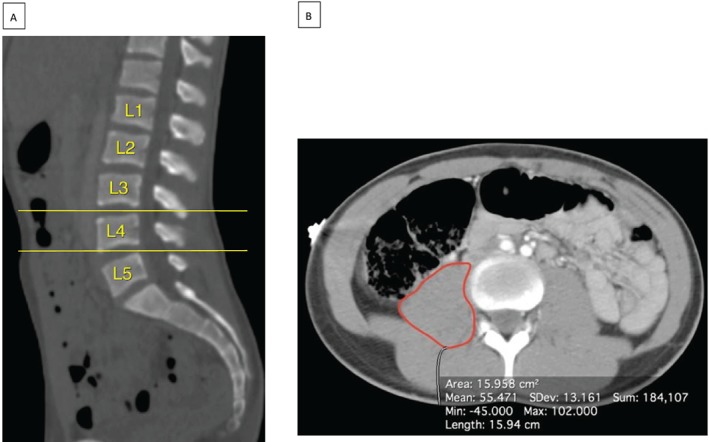
Axial and sagittal images. Lumbar levels were determined on (A) sagittal computed tomography images, enabling identification of the L3–4 and L4–5 intervertebral levels (yellow lines). (B) The axial images corresponding to these levels were then examined to determine the psoas muscle area (red lines).
2.4. Data analysis
Continuous variables were summarized using mean and standard deviation (SD). Categorical variables were summarized using frequencies and percentages. We used quantile regression with splines to model weight curves, which we compared with the CDC growth charts.28 A χ2 goodness of fit test was used to obtain the model with the best fit. We then used quantile regression with smoothed fractional polynomials to model the 5th, 10th, 25th, 50th, 75th, 90th, and 95th percentile curves for tPMA across patient ages between 1 and 16 years for both L4–5 and L3–4 levels after stratification by sex. Akaike's information criterion was used for model selection. We estimated the correlation between weight with tPMA (as measured at L3–4 and L4–5) stratified by sex using Pearson's correlation coefficients and interrater reliability for tPMA using intraclass correlation coefficients and Bland–Altman plots. Wilcoxon's paired signed‐rank test, overall and stratified by sex, was used to compare tPMA between lumbar levels. We estimated the correlation between lumbar levels using both Spearman's and Pearson's correlation coefficients and interrater reliability for tPMA using intraclass correlation coefficients and Bland–Altman plots. To allow a parametrization of the asymmetrical distribution of tPMA and derive z‐scores for an online tool, we determined standard deviations for half‐normal distributions above and below the median based on the median and 10th and 90th percentiles. Median, 10th, and 90th percentile for the online tool will therefore be identical to those published in this report. For remaining percentiles, there will be small differences between the online tool and published curves. The online tool is available as a Shiny web application built using R. The application allows users to input patient age (or date of birth and date of imaging), sex, lumbar level (L3–4 or L4–5), and tPMA (square millimetres, mm2). The age input is rounded to the nearest month and z‐scores are computed parametrically as described above. All analyses were carried out in R, version 3.5.0.29
3. Results
Review of the SickKids trauma database identified a total of 882 children requiring abdominal CT imaging at time of ER presentation between January 2005 and December 2015. Reasons for exclusion were established chronic medical condition (n = 33), acute lumbar spinal trauma (n = 5), and CT imaging not capturing the targeted L3 to L5 vertebral regions (n = 10). In addition, because of very small numbers of children <1 year (n = 10) and ≥16 years (n = 45), these patients were excluded as well. The final study cohort was comprised of 779 (36% female participants) children (Figure S1). The mean patient age was 9.5 years (SD 4.4). The age distributions for both sexes were similar (Figure S2). For male subjects, median (IQR) age was 9.91 (6.26–13.6) years. For female subjects, median (IQR) age was 9.86 (6.17–13.28) years.
Weight was normally distributed with a mean z‐score of 0.4 (SD 1.1) in the overall study cohort, 0.3 (SD 1.1) in girls, and 0.4 (SD 1.1) in boys. Figure 2 displays the weight curves stratified by sex from 5th to 95th percentile for the study cohort in comparison with CDC growth charts. Children at the 50th percentile of our population were heavier than those at the 50th percentile of CDC growth charts, by an average of 3.3 kg in girls and 3.6 kg in boys (P < 0.0001). Height values were available in only 26 (3%) of our study cohort of 779 participants and therefore were not part of subsequent analyses.
Figure 2.
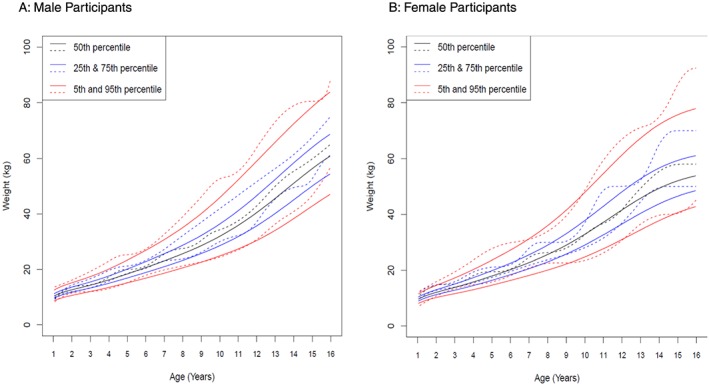
Weight distribution curves stratified by sex. Weight distribution curves (5th to 95th percentile) for (A) male and (B) female participants from the Hospital for SickKids (dashed lines) are compared with Center for Disease Control (CDC) growth charts (full lines). Weight curves differ significantly (P < 0.0001) for male and female participants, with this study's cohort being slightly heavier.
3.1. Sex‐specific tPMA curves
Growth charts for tPMA with 5th, 25th, 50th, 75th, and 95th percentile curves for boys and for girls at both lumbar levels are presented in Figure 3 (L3–4) and Figure 4 (L4–5). At both L3–4 and L4–5 levels, tPMA values increased with patient age. Until the age of 7 years, tPMA values at both L3–4 and L4–5 levels were similar between sexes. From 8 years upwards, tPMA values were larger on average in boys than girls (P < 0.05). Values of tPMA at these percentiles in 6 months increments for patient ages 1 to 16 years are available. Values for tPMA at L4–5 were larger than those measured at L3–4 [mean difference 282 (95%CI 266 to 298) mm2, P < 0.05]. This difference was seen in both girls [mean difference 255 (95%CI 231to 280) mm2, P < 0.01] and boys [mean difference 298 (95% CI 278 to 318) mm2, P < 0.01]. The correlation between tPMA values at L3–4 and at L4–5 was high for girls (r = 0.95, P < 0.001) and boys (r = 0.98, P < 0.01). Psoas muscle configuration was subjectively rounder at L4–5 than L3–4. Figure 5 shows the high correlation between weight and tPMA stratified by sex for boys (L3–4 r = 0.90; L4–5 r = 0.90) and girls (L3–4 r = 0.87; L4–5 r = 0.87). Interrater reliability between independent radiologists (coinvestigators HP & GC) in a random sample cohort (n = 53, 7%) was excellent, with intraclass correlation coefficients of 0.97 (95% CI 0.94 to 0.98) at the lumbar level L3–4 and 0.99 (95% CI 0.986 to 0.995) at L4–5. The Bland–Altman plots further support good agreement for tPMA measurements at L3–4 and L4–5 levels (Figure S3).
Figure 3.
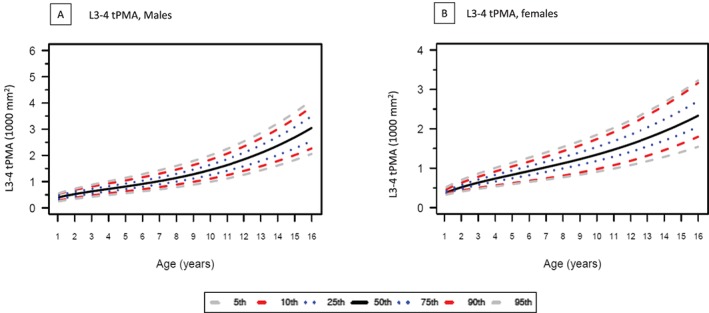
Total psoas muscle area (tPMA) at lumbar level L3–4 showing 5th to 95th percentiles for (A) male and (B) female participants. tPMA values at L3–4 increases with patient age.
Figure 5.
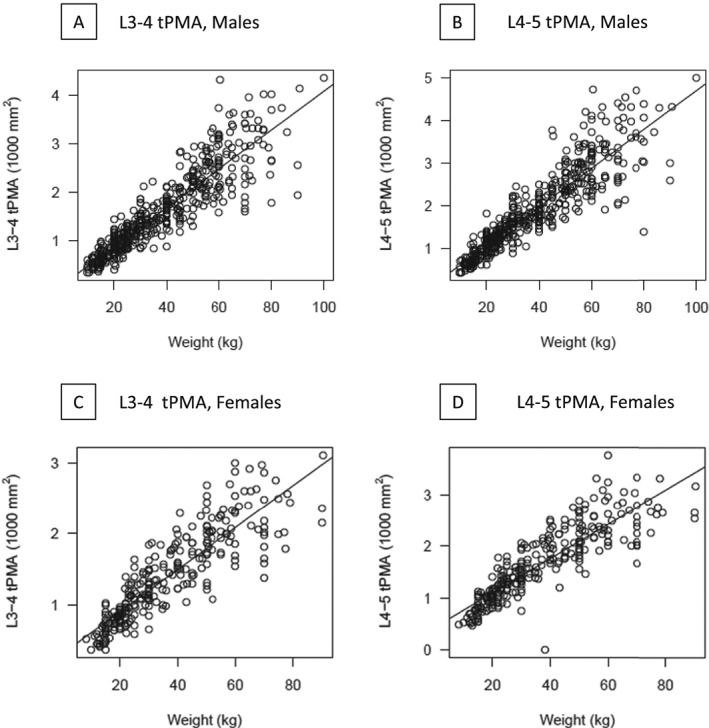
Correlations of weight and total psoas muscle area (tPMA) at lumbar levels L3–4 and L4–5 stratified by sex. Weight and tPMA highly correlate for male and female participants at L3–4 and L4–5, respectively. (Pearson's correlation coefficient r = 0.90 for boys at L3–4 and L4–5 and r = 0.87 for girls at L3–4 and L4–5). Upper and lower dashed lines represent upper and lower boundaries of the 95% reference range.
Figure 4.
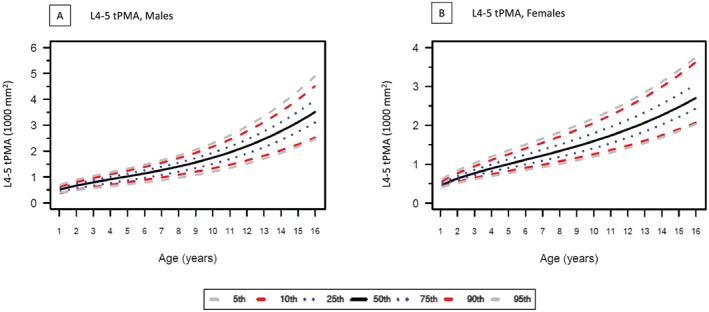
Total psoas muscle area (tPMA) at lumbar level L4–5 showing 5th to 95th percentiles for (A) male and (B) female participants. tPMA values at L4–5 increases with patient age.
The online tool is available at https://ahrc-apps.shinyapps.io/sarcopenia/. It uses the results above to display sex‐specific and lumbar level‐specific percentiles of tPMA from age 1 year to 16 years. A patient's individual age and tPMA is overlaid as a point on the chart for visual comparison with the model and the patient's age, z‐score, and percentile values are included in text.
4. Discussion
Drawing on cross‐sectional CT imaging from almost 780 healthy children, this study proposes novel sex‐specific references values and percentile curves for total psoas muscle area at lumbar levels L3–4 and L4–5 for children between the ages of 1 and 16 years. Interobserver agreement was excellent at both lumbar levels, highlighting the feasibility of making these measurements. In addition, we created an online calculator that generates age‐specific and sex‐specific tPMA percentiles and z‐scores, further enhancing the practical application of this measure.
Sarcopenia traditionally denotes the loss of skeletal muscle mass and function that occurs with the normal aging process. Sarcopenia can also be a pathologic manifestation of disease states, including end‐stage organ disease, malignancies,6 and inflammatory diseases in children.7, 8 The significance of sarcopenia derives from its association with adverse outcomes. For example, in adults with cirrhosis, sarcopenia, as assessed on CT, has been linked to impaired quality of life, hepatic decompensation, mortality in patients listed for liver transplantation (LT), increased length of hospitalization, infection, and higher health care costs.12, 22, 30, 31, 32 Sarcopenia is closely linked to frailty, a clinical syndrome reflecting increased vulnerability to medical stressors and adverse health outcomes.33, 34 Frailty was first described as a clinical phenotype by Fried and colleagues in older adults.35 Numerous studies have since demonstrated frailty to be a prognostic marker for poorer outcomes in multiple adult populations.36, 37
The concepts of sarcopenia and frailty have been relatively neglected in the paediatric setting, yet both are likely highly relevant. Children are not exempt from the unintentional muscle loss because of nutritional deficiencies, physical deconditioning, and systemic inflammation present in chronic medical illnesses.38 Two paediatric pilot studies reported smaller tPMA values measured on CT in children with end‐stage liver disease as well as intestinal and kidney failure19, 20 compared with matched healthy controls. Importantly, tPMA has been observed to have no association with traditional clinical anthropometric measures, highlighting the potential role of tPMA (and sarcopenia) as an independent biomarker of paediatric frailty.19, 20 The results of this present study demonstrated a high correlation of weight and tPMA in healthy children. In a recent prospective multicentre cohort study of paediatric chronic liver disease, the assessment of frailty was adapted for paediatric application; school‐age children with end‐stage liver disease listed for LT were found to have significantly higher frailty scores than healthy controls, establishing the relevance of frailty in paediatric as well as adult populations.39 Because frailty assessments are difficult in children less than 6 years of age, the availability of an objective biomarker, such as sarcopenia using tPMA measurement, offers the opportunity to be inclusive of the youngest children who are particularly vulnerable to the sequelae and morbidities of end‐stage organ failure.33, 38, 40, 41
The lack of a consensus definition for sarcopenia is an important hindrance to the early identification of at‐risk patients who would benefit from early nutritional prehabilitation. In adults and adolescents, CT‐based tPMA values at multiple levels have been published.11, 18, 42, 43, 44, 45, 46, 47 We elected to evaluate the psoas muscle at two intervertebral disc levels, L3–4 and L4–547, 48, 49, 50 . Although a recent systematic review highlighted L3 to be a commonly reported level in adult patients to assess muscle mass on CT,11 anatomical variations may complicate reliable identification of borders of the muscle which often requires multiplanar reformation and can be time‐consuming.50 The psoas muscle becomes more round and distinct from other paraspinal muscles in lower lumbar levels (Chavhan, personal communication). When the vertebral body is used, there is variability in the exact anatomic definition of the level at which psoas muscle is measured. In contrast, the intervertebral disc space level is narrower/thinner and enable a more consistent level determination for measurement of the psoas. Several studies have reported measurements at L3–L451, 52 and L4–L5.48, 49, 53, 54, 55 The feasibility of measuring tPMA at these two levels has been previously demonstrated in studies assessing paravertebral muscle area with other muscle groups and overall strength in adolescents and adults.45, 56
Harbaugh et al. recently published paediatric tPMA reference values at the mid‐L4 level derived from CT images in children presenting with acute appendicitis or acute traumatic injuries in Michigan.26 Our study provides reference range curves for tPMA values evaluated at intervertebral levels from CT scans in children. Additional differences between our study and that by Harbaugh et al. relate to the patient population.26 In Michigan, 76% of the population is White, followed by 14% Black and 5% Hispanic.57 As supported by the 2016 Canadian census, there is greater ethnic variation in Toronto (48% White, 13% South Asian, 11% Chinese, 9% Black, 6% Filipino, 3% Hispanic).58 In addition, the obesity rates amongst children In Canada are lower than those in USA.59 This is relevant as ethnicity and obesity have been shown to impact tPMA muscle mass values.60, 61, 62, 63, 64, 65 The tPMA values derived using our Toronto cohort represent a more diverse population, and we propose to be potentially more broadly generalizable. We also expect that the availability of reference ranges at two landmarks (rather than one), coupled with an easy‐to‐use online calculator, will greatly facilitate the identification of at‐risk children. Such tools are needed because current conventional anthropometric measures, such as weight and skinfold thickness, are confounded by numerous factors, such as ascites or peripheral oedema and organomegaly, which are common in many chronic diseases. To this point, Suzuki et al. showed that in a paediatric leukaemia cohort, while some patients lost weight and others gained, all patients had a decrease in tPMA during induction treatment.6 tPMA is easily assessed using cross‐sectional CT imaging, which is frequently performed in the work‐up of children with end‐stage organ disease, malignancy, and other chronic conditions.38, 66 This is critical as it means additional scan time is not needed solely for tPMA determination.
Our study has numerous strengths. They include the examination of a large, unbiased, and ethnically diverse paediatric cohort, with careful exclusion of children with medical conditions that might confound tPMA values. A subset of images was also read by two experienced radiologists to ensure reproducibility. Furthermore, we examined two levels, rather than just a single level. The L4–5 level may be the most clinically relevant and useful. This level has been referenced as the landmark for assessing visceral adipose tissue and thus one image at this level could be used for measurement of skeletal muscle (tPMA) and adipose tissue.67, 68 The cross‐sectional psoas muscle shape at L4–5 was also a bit rounder than at L3–4 (where it was flatter), potentially facilitating more accurate contour drawing. Interrater reliability was slightly higher at L4–5 (intraclass correlation coefficient of 0.99). Lastly, an online application was subsequently developed to easily calculate age‐specific and sex‐specific z‐scores and percentiles.
We also acknowledge the limitations of our study. First, because of low rates of abdominal trauma in children under 1 year, this group of the youngest patients could not be examined. We acknowledge that reference values in this age group would be particularly helpful especially for infants with chronic liver disease such as biliary atresia, the most common indication for paediatric LT.69, 70 While CT in children less than 1 year solely for tPMA determination is difficult to justify given the exposure to ionizing radiation, Tandon and colleagues recently showed excellent agreement between tPMA assessed using CT and magnetic resonance imaging, the latter being free of ionizing radiation.71 In the future, magnetic resonance imaging could therefore be considered in these youngest of children to measure tPMA. Second, we were unable to standardize tPMA by height because of the very limited height data available in this trauma data set. However, Golse et al. recently showed that tPMA alone performed identically to a tPMA:height2 index for predicting 1‐year post‐LT mortality in adults with area under the curve of 0.753.16 Finally, our population was on average 3–4 kg heavier than standard CDC curves.28 These CDC curves were derived in the early 2000s, whereas our population spanned 2005–2015, such that the differences are likely to reflect secular trends in body weight in North America.72
In conclusion, we have defined novel paediatric reference curves for total psoas muscle area as a marker of sarcopenia in children, along with an online calculator to facilitate ease of use. These tools will greatly facilitate the identification of children at risk for sarcopenia to enable early implementation of targeted therapies to avoid associated comorbidity and optimize outcomes. In addition, these tools have important research applications and will help elucidate the relationship between sarcopenia and frailty and, ultimately, the prognostic significance of these parameters.
Conflict of interest
Eberhard Lurz has received speaker honoraria from Nutricia and Abbvie, but there is no conflict with this manuscript. Binita Kamath has received an unrestricted educational grant from Mirum. She is a consultant for Mirum, Shire, and DCI. None of these activities are in conflict with this manuscript. Peter Jüni serves as unpaid member of the steering group of trials funded by Astra Zeneca, Biotronik, Biosensors, St. Jude Medical, and The Medicines Company and has received research grants to the institution from Astra Zeneca, Biotronik, Biosensors International, Eli Lilly, and The Medicines Company and honoraria to the institution for participation in advisory boards from Amgen but has not received personal payments by any pharmaceutical company or device manufacturer. Vicky L. Ng is a consultant for Albireo, but there is no conflict with this manuscript. Hiten Patel, Gerald Lebovic, Claudia Quammie, Jessica P. Woolfson, Manuela Perez, Amanda Ricciuto, Paul W. Wales, and Govind B. Chavhan declare that they have no conflict of interest.
Funding
This work is supported by the SickKids Transplant and Regenerative Medicine Center and the Ashley's Angels fund.
Supporting information
Figure S1. Study cohort flow chart
Figure S2. Histogram showing age distributions of (A) male (n = 499) and (B) female (n = 280) participants.
Figure S3. Bland Altman Plots for tPMA measurements in a random sample cohort (n = 53) performed by two independent radiologists for tPMA at (A) L3‐4 (ICC = 0.97) and (B) L4‐5 (ICC = 0.99).
Acknowledgements
The authors of this manuscript certify that they comply with the ethical guidelines for authorship and publishing in the Journal of Cachexia, Sarcopenia and Muscle.73 We thank Brian Kirkham for helping with the creation of the tPMA calculator.
Lurz E., Patel H., Lebovic G., Quammie C., Woolfson J. P., Perez M., Ricciuto A., Wales P. W., Kamath B. M., Chavhan G. B., Jüni P., and Ng V. L. (2020) Paediatric reference values for total psoas muscle area, Journal of Cachexia, Sarcopenia and Muscle, 11, 405–414. 10.1002/jcsm.12514.
Peter Jüni and Vicky L. Ng contributed equally to this article.
References
- 1. Rosenberg IH. Sarcopenia: origins and clinical relevance. J Nutr 1997;127, 990:s‐1, s. [DOI] [PubMed] [Google Scholar]
- 2. Carvalho do Nascimento PR, Poitras S, Bilodeau M. How do we define and measure sarcopenia? Protocol for a systematic review. Syst Rev 2018;7:51. [DOI] [PMC free article] [PubMed] [Google Scholar]
- 3. Beaudart C, McCloskey E, Bruyere O, Cesari M, Rolland Y, Rizzoli R, et al. Sarcopenia in daily practice: assessment and management. BMC Geriatr 2016;16:170. [DOI] [PMC free article] [PubMed] [Google Scholar]
- 4. Sevilla WMA. Nutritional considerations in pediatric chronic disease. Pediatr Rev 2017;38:343–352. [DOI] [PubMed] [Google Scholar]
- 5. Abd Aziz NAS, Teng N, Abdul Hamid MR, Ismail NH. Assessing the nutritional status of hospitalized elderly. Clin Interv Aging 2017;12:1615–1625. [DOI] [PMC free article] [PubMed] [Google Scholar]
- 6. Suzuki D, Kobayashi R, Sano H, Hori D, Kobayashi K. Sarcopenia after induction therapy in childhood acute lymphoblastic leukemia: its clinical significance. Int J Hematol 2018;107:486–489. [DOI] [PubMed] [Google Scholar]
- 7. Ryan E, McNicholas D, Creavin B, Kelly ME, Walsh T, Beddy D. Sarcopenia and inflammatory bowel disease: a systematic review. Inflamm Bowel Dis 2020;25:67–73. [DOI] [PubMed] [Google Scholar]
- 8. Lopez JJ, Cooper JN, Albert B, Adler B, King D, Minneci PC. Sarcopenia in children with perforated appendicitis. J Surg Res 2017;220:1–5. [DOI] [PubMed] [Google Scholar]
- 9. Cooper C, Fielding R, Visser M, van Loon LJ, Rolland Y, Orwoll E, et al. Tools in the assessment of sarcopenia. Calcif Tissue Int 2013;93:201–210. [DOI] [PMC free article] [PubMed] [Google Scholar]
- 10. Boutin RD, Yao L, Canter RJ, Lenchik L. Sarcopenia: current concepts and imaging implications. AJR Am J Roentgenol 2015;205:W255–W266. [DOI] [PubMed] [Google Scholar]
- 11. Amini B, Boyle SP, Boutin RD, Lenchik L. Approaches to assessment of muscle mass and myosteatosis on computed tomography (CT): a systematic review. J Gerontol A Biol Sci Med Sci 2019;74:1671–1678. [DOI] [PMC free article] [PubMed] [Google Scholar]
- 12. Englesbe MJ, Patel SP, He K, Lynch RJ, Schaubel DE, Harbaugh C, et al. Sarcopenia and mortality after liver transplantation. J Am Coll Surg 2010;211:271–278. [DOI] [PMC free article] [PubMed] [Google Scholar]
- 13. Masuda T, Shirabe K, Ikegami T, Harimoto N, Yoshizumi T, Soejima Y, et al. Sarcopenia is a prognostic factor in living donor liver transplantation. Liver transplantation: official publication of the American Association for the Study of Liver Diseases and the International Liver Transplantation Society 2014;20:401–407. [DOI] [PubMed] [Google Scholar]
- 14. Tsien C, Garber A, Narayanan A, Shah SN, Barnes D, Eghtesad B, et al. Post‐liver transplantation sarcopenia in cirrhosis: a prospective evaluation. J Gastroenterol Hepatol 2014;29:1250–1257. [DOI] [PMC free article] [PubMed] [Google Scholar]
- 15. van Vugt JLA, Levolger S, de Bruin RWF, van Rosmalen J, Metselaar HJ, Ijzermans JNM. Systematic review and meta‐analysis of the impact of computed tomography‐assessed skeletal muscle mass on outcome in patients awaiting or undergoing liver transplantation. Am J Transplant 2016;16:2277–2292. [DOI] [PubMed] [Google Scholar]
- 16. Golse N, Octav Bucur P, Ciacio O, Pittau G, Sa Cunha A, Adam R, et al. A new definition of sarcopenia in patients with cirrhosis undergoing liver transplantation. Liver Transpl 2016. [DOI] [PubMed] [Google Scholar]
- 17. Bahat G, Tufan A, Tufan F, Kilic C, Akpinar TS, Kose M, et al. Cut‐off points to identify sarcopenia according to European Working Group on Sarcopenia in Older People (EWGSOP) definition. Clin Nutr 2016;35:1557–1563. [DOI] [PubMed] [Google Scholar]
- 18. Giusto M, Lattanzi B, Albanese C, Galtieri A, Farcomeni A, Giannelli V, et al. Sarcopenia in liver cirrhosis: the role of computed tomography scan for the assessment of muscle mass compared with dual‐energy X‐ray absorptiometry and anthropometry. Eur J Gastroenterol Hepatol 2015;27:328–334. [DOI] [PubMed] [Google Scholar]
- 19. Lurz E, Patel H, Frimpong RG, Ricciuto A, Kehar M, Wales PW, et al. Sarcopenia in children with end‐stage liver disease. J Pediatr Gastroenterol Nutr 2018;66:222–226. [DOI] [PubMed] [Google Scholar]
- 20. Mangus RS, Bush WJ, Kubal CA, Miller C. Severe sarcopenia and increased fat stores in pediatric patients with liver, kidney, or intestine failure. J Pediatr Gastroenterol Nutr 2017;65:579–583. [DOI] [PubMed] [Google Scholar]
- 21. Ziaaldini MM, Marzetti E, Picca A, Murlasits Z. Biochemical pathways of sarcopenia and their modulation by physical exercise: a narrative review. Front Med 2017;4:167. [DOI] [PMC free article] [PubMed] [Google Scholar]
- 22. Bouchi R, Fukuda T, Takeuchi T, Nakano Y, Murakami M, Minami I, et al. Association of sarcopenia with both latent autoimmune diabetes in adults and type 2 diabetes: a cross‐sectional study. J Diabetes Complications 2017;31:992–996. [DOI] [PubMed] [Google Scholar]
- 23. Trierweiler H, Kisielewicz G, Hoffmann Jonasson T, Rasmussen Petterle R, Aguiar Moreira C, Zeghbi Cochenski Borba V. Sarcopenia: a chronic complication of type 2 diabetes mellitus. Diabetol Metab Syndr 2018;10:25. [DOI] [PMC free article] [PubMed] [Google Scholar]
- 24. Kim K, Hong S, Kim EY. Reference values of skeletal muscle mass for Korean children and adolescents using data from the Korean National Health and Nutrition Examination Survey 2009‐2011. PLoS ONE 2016;11:e0153383. [DOI] [PMC free article] [PubMed] [Google Scholar]
- 25. McCarthy HD, Samani‐Radia D, Jebb SA, Prentice AM. Skeletal muscle mass reference curves for children and adolescents. Pediatr Obes 2014;9:249–259. [DOI] [PubMed] [Google Scholar]
- 26. Harbaugh CM, Zhang P, Henderson B, Derstine BA, Holcombe SA, Wang SC, et al. Personalized medicine: Enhancing our understanding of pediatric growth with analytic morphomics. J Pediatr Surg 2017;52:837–842. [DOI] [PubMed] [Google Scholar]
- 27. Kim HY, Jang JW. Sarcopenia in the prognosis of cirrhosis: Going beyond the MELD score. World J Gastroenterol 2015;21:7637–7647. [DOI] [PMC free article] [PubMed] [Google Scholar]
- 28. The Centers for Disease Control C . Overview of the CDC growth charts for use in the United States among children and teens aged 2 years to 20 years. 2015. [updated April 15, 2015. Available from: https://www.cdc.gov/nccdphp/dnpao/growthcharts/training/overview/index.html.
- 29. Team RC . R: A language and environment for statistical computing. Vienna, Austria: R Foundation for Statistical Computing; 2014. [Google Scholar]
- 30. Kaido T. Impact of sarcopenia on survival in patients undergoing living donor liver transplantation. Am J Transplant 2013;13:1549–1556. [DOI] [PubMed] [Google Scholar]
- 31. Krell RW, Kaul DR, Martin AR, Englesbe MJ, Sonnenday CJ, Cai S, et al. Association between sarcopenia and the risk of serious infection among adults undergoing liver transplantation. Liver transplantation: official publication of the American Association for the Study of Liver Diseases and the International Liver Transplantation Society 2013;19:1396–1402. [DOI] [PMC free article] [PubMed] [Google Scholar]
- 32. Peterson SJ, Braunschweig CA. Prevalence of sarcopenia and associated outcomes in the clinical setting. Nutrition in clinical practice: official publication of the American Society for Parenteral and Enteral Nutrition 2016;31:40–48. [DOI] [PubMed] [Google Scholar]
- 33. Carey EJ, Lai JC, Sonnenday C, Tapper EB, Tandon P, Duarte‐Rojo A, et al. A North American expert opinion statement on sarcopenia in liver transplantation. Hepatology 2019;70:1816–1829. [DOI] [PMC free article] [PubMed] [Google Scholar]
- 34. Lai JC, Sonnenday CJ, Tapper EB, Duarte‐Rojo A, Dunn MA, Bernal W, et al. Frailty in liver transplantation: an expert opinion statement from the American Society of Transplantation Liver and Intestinal Community of Practice. Am J Transplant 2019;19:1896–1906. [DOI] [PMC free article] [PubMed] [Google Scholar]
- 35. Fried LP, Tangen CM, Walston J, Newman AB, Hirsch C, Gottdiener J, et al. Frailty in older adults: evidence for a phenotype. J Gerontol A Biol Sci Med Sci 2001;56:M146–M156. [DOI] [PubMed] [Google Scholar]
- 36. Wang J, Zou Y, Zhao J, Schneider DB, Yang Y, Ma Y, et al. The impact of frailty on outcomes of elderly patients after major vascular surgery: a systematic review and meta‐analysis. European journal of vascular and endovascular surgery: the official journal of the European Society for Vascular Surgery 2018;56:591–602. [DOI] [PubMed] [Google Scholar]
- 37. Uppal S, Igwe E, Rice LW, Spencer RJ, Rose SL. Frailty index predicts severe complications in gynecologic oncology patients. Gynecol Oncol 2015;137:98–101. [DOI] [PubMed] [Google Scholar]
- 38. Orsso CE, Tibaes JRB, Oliveira CLP, et al. Low muscle mass and strength in pediatrics patients: Why should we care?. Clin Nutr. 2019;38(5):2002–2015. [DOI] [PubMed] [Google Scholar]
- 39. Lurz E, Quammie C, Englesbe M, Alonso EM, Lin HC, Hsu EK, et al. Frailty in children with liver disease: a prospective multicenter study. J Pediatr 2018;194:109–15.e4. [DOI] [PubMed] [Google Scholar]
- 40. Safer U, Kaplan M, Binay SV. Evaluation of sarcopenia in children. J Surg Res 2019;237:112. [DOI] [PubMed] [Google Scholar]
- 41. Ooi PH, Amber H, Mazurak VC, Dajani K, Bhargava R, Gilmour SM, et al. Sarcopenia in chronic liver disease: impact on outcomes. Liver transplantation: official publication of the American Association for the Study of Liver Diseases and the International Liver Transplantation Society 2019;25:1422–1438. [DOI] [PubMed] [Google Scholar]
- 42. Arbanas J, Pavlovic I, Marijancic V, Vlahovic H, Starcevic‐Klasan G, Peharec S, et al. MRI features of the psoas major muscle in patients with low back pain. European spine journal: official publication of the European Spine Society, the European Spinal Deformity Society, and the European Section of the Cervical Spine Research Society 2013;22:1965–1971. [DOI] [PMC free article] [PubMed] [Google Scholar]
- 43. Cruz RJ Jr, Dew MA, Myaskovsky L, Goodpaster B, Fox K, Fontes P, et al. Objective radiologic assessment of body composition in patients with end‐stage liver disease: going beyond the BMI. Transplantation 2013;95:617–622. [DOI] [PMC free article] [PubMed] [Google Scholar]
- 44. DiMartini A, Cruz RJ Jr, Dew MA, Myaskovsky L, Goodpaster B, Fox K, et al. Muscle mass predicts outcomes following liver transplantation. Liver transplantation: official publication of the American Association for the Study of Liver Diseases and the International Liver Transplantation Society 2013;19:1172–1180. [DOI] [PMC free article] [PubMed] [Google Scholar]
- 45. Hoshikawa Y, Iida T, Ii N, Muramatsu M, Nakajima Y, Chumank K, et al. Cross‐sectional area of psoas major muscle and hip flexion strength in youth soccer players. Eur J Appl Physiol 2012;112:3487–3494. [DOI] [PubMed] [Google Scholar]
- 46. Hoshikawa Y, Muramatsu M, Iida T, Ii N, Nakajima Y, Kanehisa H. Sex differences in the cross‐sectional areas of psoas major and thigh muscles in high school track and field athletes and nonathletes. J Physiol Anthropol 2011;30:47–53. [DOI] [PubMed] [Google Scholar]
- 47. Shen W, Punyanitya M, Wang Z, Gallagher D, St‐Onge MP, Albu J, et al. Total body skeletal muscle and adipose tissue volumes: estimation from a single abdominal cross‐sectional image. J Appl Physiol (1985) 2004;97:2333–2338. [DOI] [PubMed] [Google Scholar]
- 48. Byun SE, Kim S, Kim KH, Ha YC. Psoas cross‐sectional area as a predictor of mortality and a diagnostic tool for sarcopenia in hip fracture patients. J Bone Miner Metab 2019;37:871–879. [DOI] [PubMed] [Google Scholar]
- 49. Lacoste Jeanson A, Dupej J, Villa C, Bruzek J. Body composition estimation from selected slices: equations computed from a new semi‐automatic thresholding method developed on whole‐body CT scans. PeerJ 2017;5:e3302. [DOI] [PMC free article] [PubMed] [Google Scholar]
- 50. Faron A, Luetkens JA, Schmeel FC, Kuetting DLR, Thomas D, Sprinkart AM. Quantification of fat and skeletal muscle tissue at abdominal computed tomography: associations between single‐slice measurements and total compartment volumes. Abdominal radiology (New York) 2019;44:1907–1916. [DOI] [PubMed] [Google Scholar]
- 51. Derstine BA, Holcombe SA, Ross BE, Wang NC, Su GL, Wang SC. Skeletal muscle cutoff values for sarcopenia diagnosis using T10 to L5 measurements in a healthy US population. Sci Rep 2018;8:11369. [DOI] [PMC free article] [PubMed] [Google Scholar]
- 52. Linder N, Schaudinn A, Langenhan K, Krenzien F, Hau HM, Benzing C, et al. Power of computed‐tomography‐defined sarcopenia for prediction of morbidity after pancreaticoduodenectomy. BMC Med Imaging 2019;19:32. [DOI] [PMC free article] [PubMed] [Google Scholar]
- 53. Locke JE, Carr JJ, Nair S, Terry JG, Reed RD, Smith GD, et al. Abdominal lean muscle is associated with lower mortality among kidney waitlist candidates. Clin Transplant 2017;31. [DOI] [PMC free article] [PubMed] [Google Scholar]
- 54. Weig T, Irlbeck T, Frey L, Paprottka P, Irlbeck M. Above and beyond BMI: Alternative methods of measuring body fat and muscle mass in critically ill patients and their clinical significance. Anaesthesist 2016;65:655–662. [DOI] [PubMed] [Google Scholar]
- 55. Reid JG, Livingston LA, Pearsall DJ. The geometry of the psoas muscle as determined by magnetic resonance imaging. Arch Phys Med Rehabil 1994;75:703–708. [DOI] [PubMed] [Google Scholar]
- 56. Honkanen T, Mantysaari M, Leino T, Avela J, Kerttula L, Haapamaki V, et al. Cross‐sectional area of the paraspinal muscles and its association with muscle strength among fighter pilots: a 5‐year follow‐up. BMC Musculoskelet Disord 2019;20:170. [DOI] [PMC free article] [PubMed] [Google Scholar]
- 57. Bureau USC. Population estimates, July 1, 2018, (V2018) [Available from: https://www.census.gov/quickfacts/fact/table/MI.
- 58. Census , Statistics Canada Catalogue no. 98'316'X2016001 Ottawa, 2016, Released November 29, 2017. [Available from: https://www12.statcan.gc.ca/census-recensement/2016/dp-pd/prof/index.cfm? Lang = E
- 59. Rodd C, Sharma AK. Recent trends in the prevalence of overweight and obesity among Canadian children. CMAJ: Canadian Medical Association journal = journal de l'Association medicale canadienne 2016;188:E313–e20. [DOI] [PMC free article] [PubMed] [Google Scholar]
- 60. Permuth JB, Clark Daly A, Jeong D, Choi JW, Cameron ME, Chen DT, et al. Racial and ethnic disparities in a state‐wide registry of patients with pancreatic cancer and an exploratory investigation of cancer cachexia as a contributor to observed inequities. Cancer Med 2019;8:3314–3324. [DOI] [PMC free article] [PubMed] [Google Scholar]
- 61. Crawford RJ, Elliott JM, Volken T. Change in fatty infiltration of lumbar multifidus, erector spinae, and psoas muscles in asymptomatic adults of Asian or Caucasian ethnicities. European spine journal: official publication of the European Spine Society, the European Spinal Deformity Society, and the European Section of the Cervical Spine Research Society 2017;26:3059–3067. [DOI] [PubMed] [Google Scholar]
- 62. Newman AB, Kupelian V, Visser M, Simonsick E, Goodpaster B, Nevitt M, et al. Sarcopenia: alternative definitions and associations with lower extremity function. J Am Geriatr Soc 2003;51:1602–1609. [DOI] [PubMed] [Google Scholar]
- 63. Hamaguchi Y, Kaido T, Okumura S, Kobayashi A, Hammad A, Tamai Y, et al. Proposal for new diagnostic criteria for low skeletal muscle mass based on computed tomography imaging in Asian adults. Nutrition 2016;32:1200–1205. [DOI] [PubMed] [Google Scholar]
- 64. Tanaka NI, Murakami H, Ohmori Y, Aiba N, Morita A, Watanabe S, et al. Association of visceral fat area with abdominal skeletal muscle distribution in overweight Japanese adults. Obes Res Clin Pract 2018;12:378–383. [DOI] [PubMed] [Google Scholar]
- 65. Remigio‐Baker RA, Allison MA, Schreiner PJ, Carnethon MR, Nettleton JA, Mujahid MS, et al. Sex and race/ethnic disparities in the cross‐sectional association between depressive symptoms and muscle mass: the multi‐ethnic study of atherosclerosis. BMC Psychiatry 2015;15:221. [DOI] [PMC free article] [PubMed] [Google Scholar]
- 66. Carey EJ, Lai JC, Sonnenday C, et al. A North American Expert Opinion Statement on Sarcopenia in Liver Transplantation. Hepatology. 2019;70(5):1816–1829. [DOI] [PMC free article] [PubMed] [Google Scholar]
- 67. Morrell GR, Ikizler TA, Chen X, Heilbrun ME, Wei G, Boucher R, et al. Psoas muscle cross‐sectional area as a measure of whole‐body lean muscle mass in maintenance hemodialysis patients. J Ren Nutr 2016;26:258–264. [DOI] [PMC free article] [PubMed] [Google Scholar]
- 68. Shen W, Punyanitya M, Wang Z, Gallagher D, St‐Onge MP, Albu J, et al. Visceral adipose tissue: relations between single‐slice areas and total volume. Am J Clin Nutr 2004;80:271–278. [DOI] [PMC free article] [PubMed] [Google Scholar]
- 69. Alonso EM. Growth and developmental considerations in pediatric liver transplantation. Liver Transpl 2008;14:585–591. [DOI] [PubMed] [Google Scholar]
- 70. Squires RH, Ng V, Romero R, Ekong U, Hardikar W, Emre S, et al. Evaluation of the pediatric patient for liver transplantation: 2014 practice guideline by the American Association for the Study of Liver Diseases, American Society of Transplantation and the North American Society for Pediatric Gastroenterology, Hepatology and Nutrition. Hepatology 2014;60:362–398. [DOI] [PubMed] [Google Scholar]
- 71. Tandon P, Mourtzakis M, Low G, Zenith L, Ney M, Carbonneau M, et al. Comparing the variability between measurements for sarcopenia using magnetic resonance imaging and computed tomography imaging. Am J Transplant 2016;16:2766–2767. [DOI] [PubMed] [Google Scholar]
- 72. Ng M, Fleming T, Robinson M, Thomson B, Graetz N, Margono C, et al. Global, regional, and national prevalence of overweight and obesity in children and adults during 1980‐2013: a systematic analysis for the Global Burden of Disease Study 2013. Lancet (London, England) 2014;384:766–781. [DOI] [PMC free article] [PubMed] [Google Scholar]
- 73. von Haehling S, Morley JE, Coats AJS, Anker SD. Ethical guidelines for publishing in the journal of cachexia, sarcopenia and muscle: update 2017. J Cachexia Sarcopenia Muscle 2017;8:1081–1083. [DOI] [PMC free article] [PubMed] [Google Scholar]
Associated Data
This section collects any data citations, data availability statements, or supplementary materials included in this article.
Supplementary Materials
Figure S1. Study cohort flow chart
Figure S2. Histogram showing age distributions of (A) male (n = 499) and (B) female (n = 280) participants.
Figure S3. Bland Altman Plots for tPMA measurements in a random sample cohort (n = 53) performed by two independent radiologists for tPMA at (A) L3‐4 (ICC = 0.97) and (B) L4‐5 (ICC = 0.99).