

Abstract
The advent of deep-sequencing techniques has revealed that mutations in G protein–coupled receptor (GPCR) signaling pathways in cancer are more prominent than was previously appreciated. An emergent theme is that cancer-associated mutations tend to cause enhanced GPCR pathway activation to favor oncogenicity. Regulators of G protein signaling (RGS) proteins are critical modulators of GPCR signaling that dampen the activity of heterotrimeric G proteins through their GTPase-accelerating protein (GAP) activity, which is conferred by a conserved domain dubbed the “RGS-box.” Here, we developed an experimental pipeline to systematically assess the mutational landscape of RGS GAPs in cancer. A pan-cancer bioinformatics analysis of the 20 RGS domains with GAP activity revealed hundreds of low-frequency mutations spread throughout the conserved RGS domain structure with a slight enrichment at positions that interface with G proteins. We empirically tested multiple mutations representing all RGS GAP subfamilies and sampling both G protein interface and non-interface positions with a scalable, yeast-based assay. Finally, a subset of mutants was validated using G protein activity biosensors in mammalian cells. Our findings reveal that a sizable fraction of RGS protein mutations leads to a loss of function through various mechanisms, including disruption of the G protein binding interface, loss of protein stability, or allosteric effects on G protein coupling. Moreover, our results also validate a scalable pipeline for the rapid characterization of cancer-associated mutations in RGS proteins.
One-sentence summary:
Cancer-associated mutations in RGS proteins impair their ability to inhibit G protein signaling.
Editor’s summary:
Impairing RGS protein function
Mutations in the genes encoding the α subunits of heterotrimeric G proteins are associated with cancer. In particular, mutations that prevent the Gα subunits from hydrolyzing GTP, thus rendering them constitutively active, are pro-oncogenic. DiGiacomo et al. surveyed cancer-associated mutations in regulator of G protein signaling (RGS) proteins, which are physiological inhibitors of G proteins. Through bioinformatics analysis, protein-protein interaction studies in yeast, and functional assays in mammalian cells, the authors showed that many cancer-associated RGS mutants fail to inhibit G protein signaling because of reduced protein stability or impaired interactions with their targets. With these tools, further cancer-associated mutations in RGS proteins can be characterized.
INTRODUCTION
It has been said that heterotrimeric guanine nucleotide–binding proteins (G proteins) “regulate everything from sex in yeast to cognition in humans” (1). This conveys not only their important role in diverse biological processes, but also the evolutionary conservation of their mechanism of action. Heterotrimeric G proteins were originally discovered as transducers of extracellular signals acting on G protein–coupled receptors (GPCRs) (2, 3), a mechanism that is crucial in a myriad of physiological processes and the subject of countless drug discovery efforts (4, 5). How does this mechanism work? GPCRs are guanine nucleotide exchange factors (GEFs) that act on G protein trimers (Gαβγ) composed of a nucleotide-binding Gα subunit and an obligatory Gβγ dimer. This GEF activity promotes the exchange of GDP for GTP on Gα, which in turn promotes the release of free Gβγ. Both Gα-GTP and free Gβγ work as active signaling species, and they modulate directly the activity of their respective downstream effectors. Gα subunits are classified into families based on sequence similarity and how they regulate specific effectors directly. In broad strokes, Gs family members stimulate adenylyl cyclase (AC) activity, whereas Gi/o family members inhibit it; Gq/11 family members stimulate phospholipase C (PLC) activity and that of a subgroup of RhoGEFs; and G12/13 family members stimulate a different subgroup of RhoGEFs (6, 7). The signaling activities of both Gα and Gβγ are terminated when GTP is hydrolyzed to GDP, which favors the re-association of the subunits into an inactive Gαβγ trimer, which is then susceptible to undergoing a new cycle of activation by GPCRs.
Whereas the importance of the GPCR–G protein signaling mechanism in hormone- and neurotransmitter-mediated physiological responses was established early on, its importance in cancer has remained concealed and underappreciated until more recently. Early work pointed at the existence of activating mutations in some Gα subunits in cancer (8, 9), which worked by rendering them GTPase-deficient and therefore constitutively active. Subsequent work showed that equivalent activating mutations introduced artificially in essentially any Gα subunit (for example, Gαq, Gαi2, Gαo, Gαz, Gα12, and Gα13) led them to cause oncogenic transformation in cells in vitro (10–17). However, it has not been until the more recent advent of deep-sequencing techniques that it has become apparent that components of the GPCR–G protein signaling axis are frequently mutated in cancer (18–20). The “poster child” for this phenomenon is uveal melanoma, in which essentially every tumor contains activating mutations in one of two homologous G proteins, Gαq (encoded by GNAQ) or Gα11 (GNA11) (21, 22), or in other components of their signaling pathway (for example, the GPCR encoded by CYSLTR2) (23, 24). Other examples include activating mutations in Gαs (GNAS), which can be as frequent as 70% in certain subtypes of pancreatic ductal carcinomas (25, 26), or in Gαi2, which can be as frequent as 24% in epitheliotropic intestinal T-cell lymphomas (27). Activating mutations have also been described in Gβ1 (GNB1) and Gβ2 (GNB2) subunits in various leukemias (28), which lead to enhanced activation of signaling through the excessive dissociation of free Gβγ competent to engage effectors. Similarly, there are examples of GPCRs that are either overexpressed or that contain mutations that favor G protein activation (18, 23, 29), further supporting the theme that G protein hyperactivation in cancer tends to be pro-oncogenic. The exception to this general theme is Gα13 in some types of lymphoma, which contains frequent mutations that are inactivating, thereby suggesting that Gα13 has a tumor suppressor function in these cancer types (30, 31), instead of having an oncogene function as was previously suggested from experiments in vitro (11, 13).
A poorly investigated aspect of GPCR–G protein signaling in cancer is the role played by regulators of G protein signaling (RGS) proteins. These are cytoplasmic factors that work as negative regulators of G protein signaling, a function originally identified in genetic studies of the GPCR-mediated pheromone response in the yeast Saccharomyces cerevisiae (32, 33). It quickly became evident that RGS proteins were negative regulators of G protein signaling conserved in evolutionarily distant species, including Caenorhabditis elegans or mammals, and that this action was mediated through direct interaction with Gα subunits (34–38). The mechanism by which RGS proteins inhibit G protein signaling is by stabilizing the transition state of GTP hydrolysis of Gα subunits, thereby stimulating their intrinsic GTPase activity and accelerating deactivation. In other words, they are GTPase-accelerating proteins (GAPs) (39–41). G protein binding and GAP activity are mediated by a conserved domain dubbed the “RGS-box” (42, 43). To date, canonical RGS GAPs act on Gα subunits of the Gi/o and/or Gq/11 families (a divergent subfamily of RGS proteins has also been found to exert GAP activity on G12/13) (44–46).
The first clue that RGS proteins might be involved in oncogenesis came from the known properties of cancer-promoting G protein mutants. For example, the two most common mutations of Gαq in uveal melanoma affect the residues Gln209 and Arg183, resulting in proteins with similar deficiencies in intrinsic GTPase activity. The only known difference among the properties of Gαq Gln209 mutants and Arg183 mutants is that the former are insensitive to RGS GAPs whereas the GTPase activities of the latter can be accelerated by RGS proteins (41, 47, 48). In cells, Gαq Gln209 mutants are much more potent in promoting mitogenic signaling and oncogenesis than are Gαq Arg183 mutants (21, 22), and, in naturally occurring tumors, Gαq Gln209 mutations are also much more frequent (21, 22), suggesting that they are endowed with a selective advantage for growth. Along these lines, patients with the Sturge-Weber syndrome bear Arg183 mutations in Gαq without developing tumors (49). Together, these observations suggest that the loss of RGS GAP–mediated regulation in Gαq Gln209 mutants might be critical to render them sufficiently active to promote oncogenic transformation, whereas RGS GAP–mediated inhibition of Arg183 mutants suppresses their ability to promote oncogenic transformation. Similar observations have been made with mutations in the corresponding residues of Gαi2, which belongs to the other G protein family sensitive to RGS GAPs , in that the Q205L Gαi2 mutant is more potent than the R179C mutant in promoting oncogenic transformation in vitro (17). In summary, this suggests that loss of GAP-mediated inhibition of G protein activity contributes to oncogenesis.
Subsequent sporadic studies have investigated the role of RGS proteins in cancer more directly, but the findings are somewhat contradictory (50). Some studies have suggested that loss of RGS protein function favors cancer progression; namely, RGS proteins have a tumor suppressor activity (51–57), which is consistent with the general theme of G protein hyperactivation as a pro-oncogenic signal. In contrast, some other studies have suggested that RGS proteins have the opposite role by actively promoting cancer (50, 58–61). A confounding factor is that many RGS proteins not only work as GAPs, but also have GAP-independent functions (62). A compelling example of a GAP-dependent, tumor-suppressive function was provided by Xie et al. (52), who showed that the inhibition of tumor xenograft growth in mice mediated by RGS4 could be reversed by introducing a mutation that specifically disrupts its GAP activity. Similarly, loss of RGS17 in several cancer types leads to the enhancement of G protein signaling that favors cancer growth (63). However, other studies have shown that some RGS proteins, such as RGS6, can work as tumor suppressors even when their GAP activity is specifically ablated (64). Overall, the prevalence of loss of RGS GAP activity as a mechanism that contributes to cancer is still unclear.
The effect of somatic mutations naturally occurring in cancer on RGS protein function has not been systematically characterized to date. A challenge for inferring functional consequences of such mutations from genomics data is that the frequency of mutations in individual RGS proteins is low and mutations are scattered throughout the protein sequence without any apparent mutation “hotspots” (65). Although the distribution of mutations throughout the protein sequence is commonly observed for tumor suppressors (66), which might be an expected role of RGS proteins as inhibitors of pro-oncogenic signaling associated with enhanced G protein activation, the low frequency of mutations makes it difficult to ascertain if these mutations have a direct effect on protein function or are just passenger mutations. We reasoned that the high conservation of the structure and mechanism of action of the RGS-box domain (42–44) could be leveraged to gain further insight into the functional consequences of cancer-associated mutations found in this family of G protein regulators. Here, we describe a systematic analysis of cancer mutations in the conserved coordinates of the RGS-box and their consequences on G protein regulation. In doing so, we provide: (i) a comprehensive analysis of RGS protein mutations identified in human cancer genomics campaigns; (ii) proof-of-principle empirical evidence that a sizable portion of mutations impairs RGS-mediated G protein regulation; and (iii) a scalable assay suitable for the systematic interrogation of cancer-associated RGS protein mutants.
RESULTS
Pan-cancer mutations in the RGS GAP domain
Although the RGS-box was originally discovered as a domain that conferred GAP activity toward Gα subunits, it was subsequently shown that not all RGS-box domains have GAP activity (44, 45). Based on our interest in characterizing RGS proteins with canonical GAP activity, we focused our analysis of cancer-associated mutations on the 20 proteins of the RGS protein families A/RZ, B/R4, C/R7, and D/R12 (Fig. 1, A and B). It is well-established that all of these RGS proteins act as GAPs for Gi/o proteins, Gq/11 proteins, or both, and that the structural basis for this mechanism is highly conserved: there is high similarity in the tertiary structure of their RGS domains and in how they form a binding interface with Gα subunits (42, 43), with the exception of how RGS2 binds to Gαq, which adopts a somewhat divergent pose (67). We also excluded members of the RGS protein family F/GEF because, even though some of them have GAP activity toward G12/13, the binding pose on G proteins and the structural basis for G protein regulation differ markedly from those of the canonical RGS GAPs (68–70). The RGS domain of the F/GEF family members primarily engages Gα with an effector-like pose, whereas an N-terminal extension not present in other RGS GAPs confers the G protein regulatory activity (68–70).
Fig. 1. The cancer mutational landscape of canonical RGS-box domains with GAP activity.
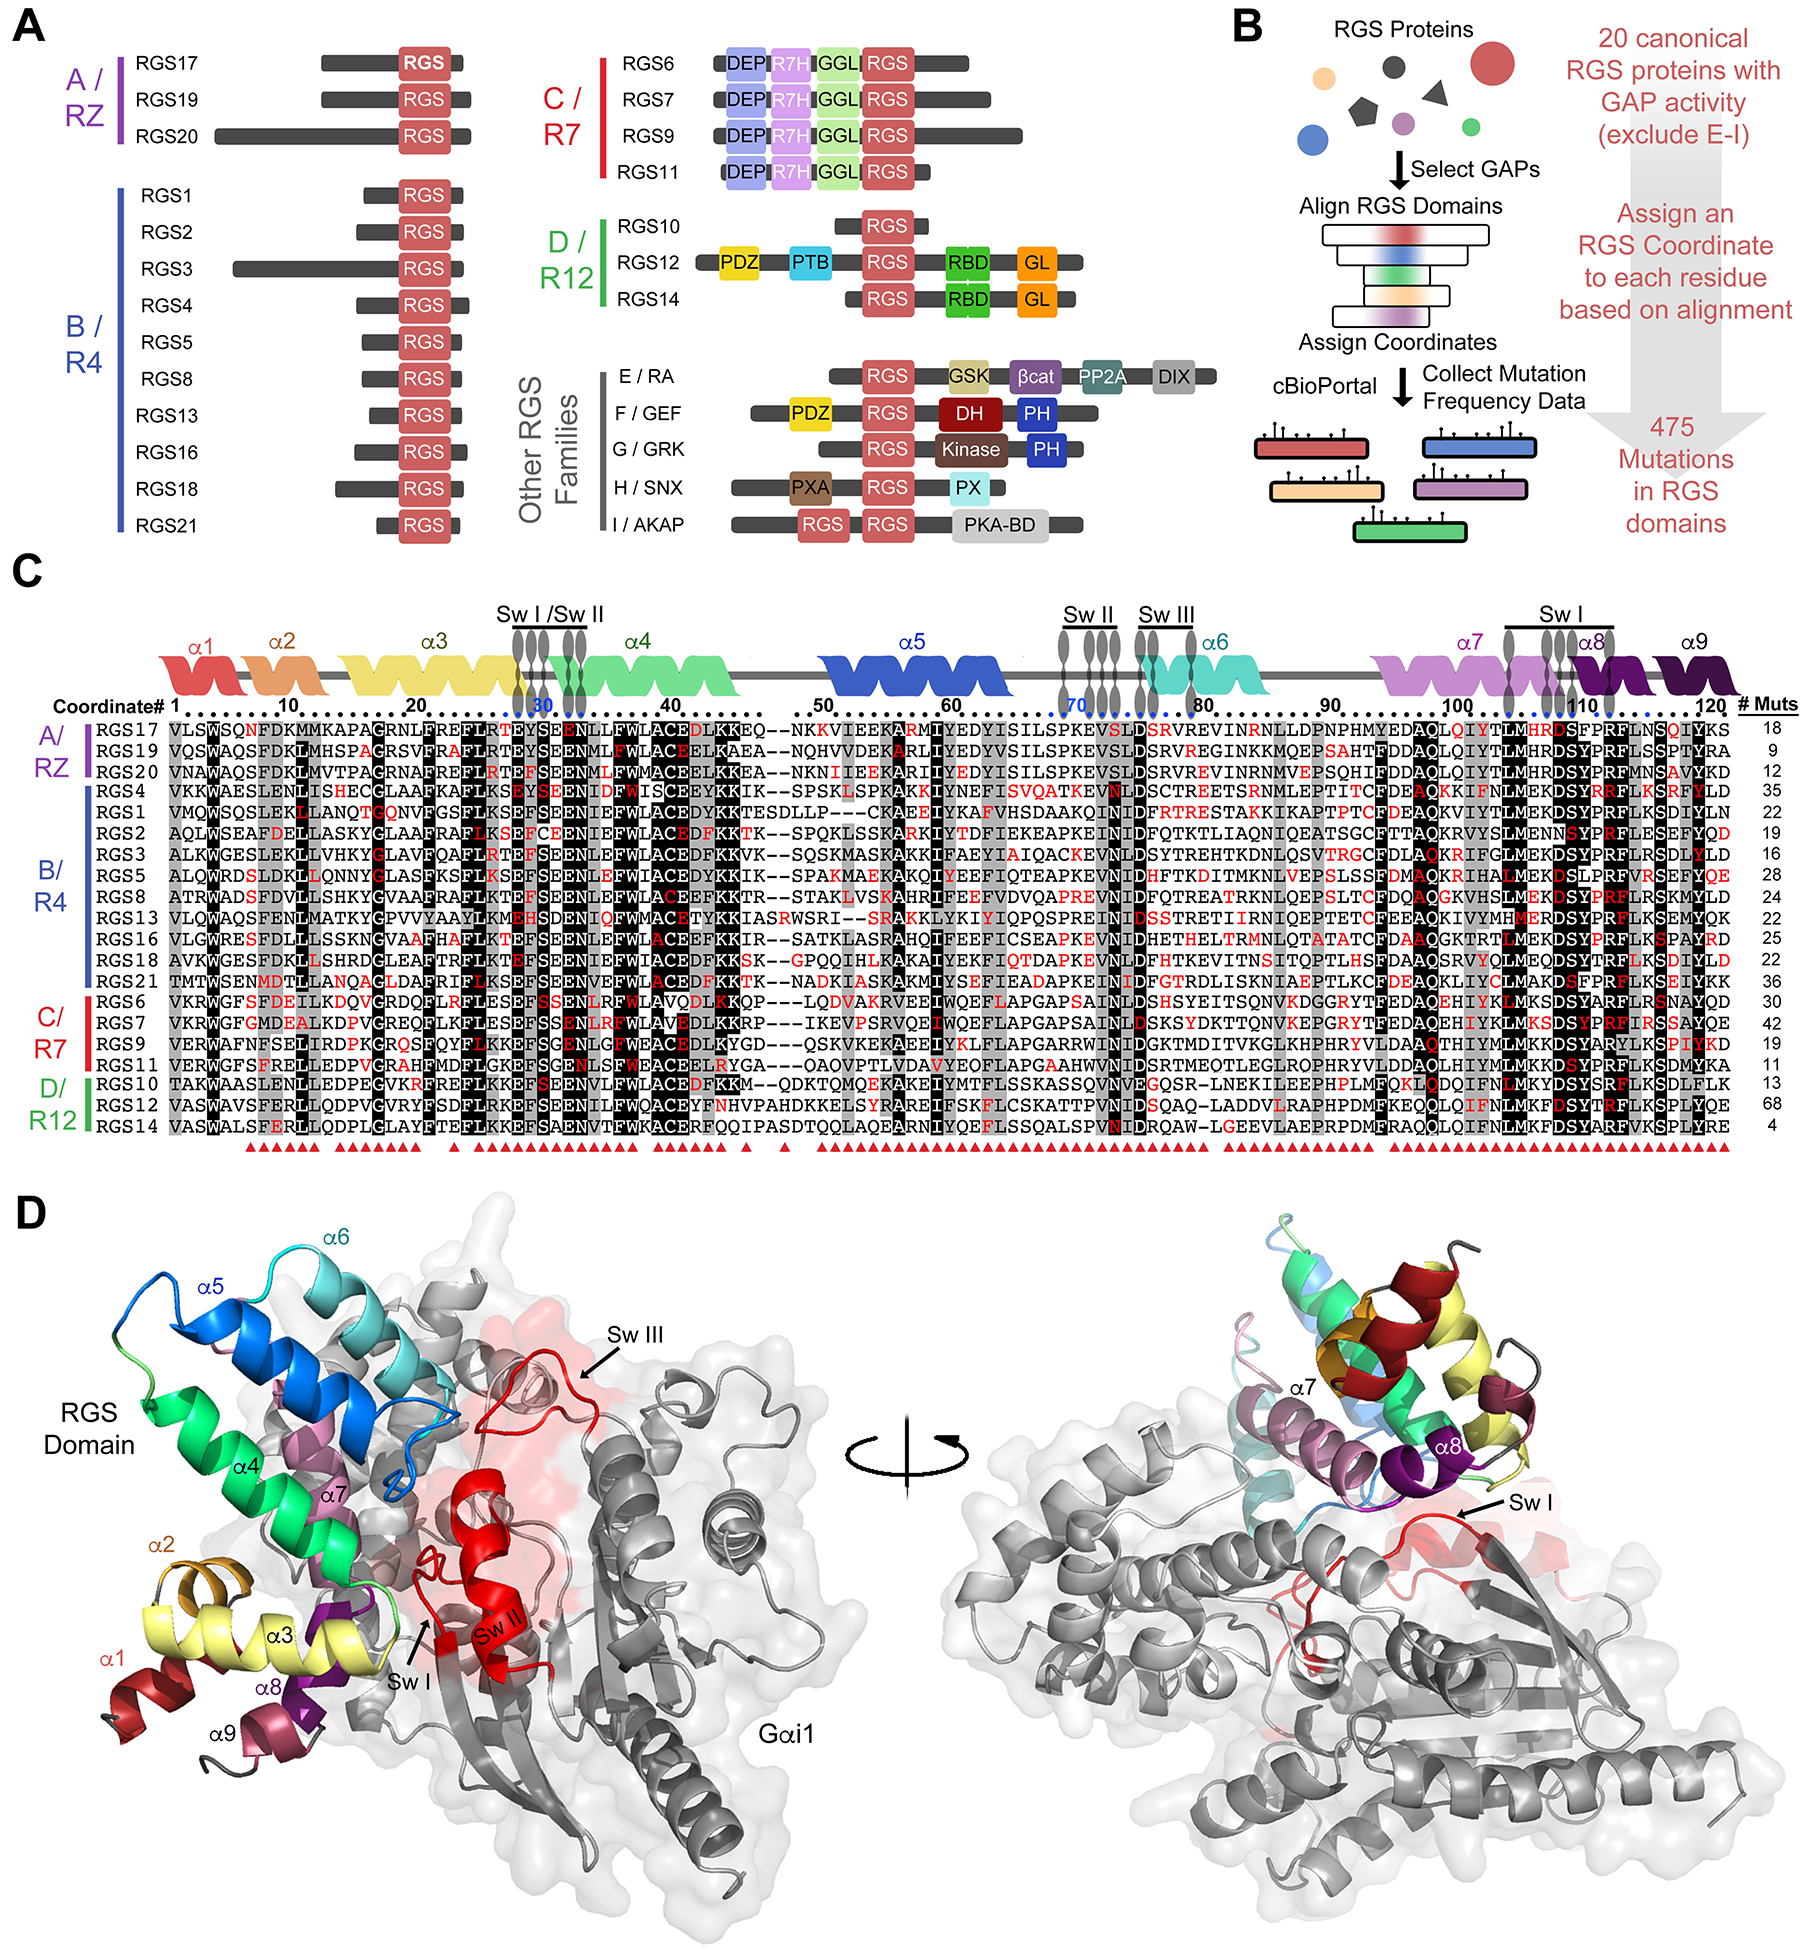
(A) Canonical RGS proteins with GAP activity toward Gi/o, Gq/11, or both are classified into four families (A/RZ, B/R4, C/R7, and D/R12), all of which contain a conserved RGS domain (red box). RGS-like domains are found in other proteins without GAP activity toward Gi/o, Gq/11, or both, which constitute other RGS protein families (E/RA, F/GEF, G/GRK, H/SNX, and I/AKAP). The approximate sizes of the proteins and the locations of domains are shown to reflect the diversity among the different families and individual proteins. (B) Workflow for the mining of cancer genomic data and comparative analysis of cancer-associated mutations found in the RGS domain of canonical GAPs. (C) Alignment of the RGS domains of all the 20 canonical RGS GAPs in humans and the amino acid positions mutated in cancer. Each position in the alignment is assigned a coordinate number (#) relative to the first residue of the RGS-box domain of RGS4 (numbers above the alignment) to facilitate the comparison of sequence and mutation prevalence at any given position across multiple RGS proteins. The secondary structure elements of RGS4 are indicated above the sequence by colored helices, and the positions that make contact with each one of the three switch regions (Sw I, Sw II, and Sw III) of Gαi1 are indicated by blue dots. Amino acids found to be mutated in the cBioPortal database are indicated in red. Conservation of identical residues in ≥50% of the sequences is indicated by black shading, whereas conservation of similar residues is indicated by gray shading. Red arrowheads beneath the alignment indicate that a given RGS protein coordinate is mutated at least once. (D) Three-dimensional (3D) rendering of the structure of Gαi1 (in gray with the switch regions in red) in complex with RGS4 [color-coded as in the secondary structure diagram above the sequences shown in (C)]. PDB: 1AGR.
We reasoned that by analyzing collectively the cancer mutations present across the conserved, canonical RGS-box of all 20 RGS proteins, we could gain insights into their potential functional consequences, possibly by identifying conserved positions that, when mutated, would disrupt the G protein binding interface or destabilize the RGS domain fold. To perform this analysis, we first aligned the 20 canonical RGS-box domains and assigned each amino acid in the sequences a relative coordinate number using the 122 amino acids of the RGS-box domain of RGS4 as a reference (Fig. 1, B and C). We then extracted all known mutations in the RGS domains described in The Cancer Genome Atlas (TCGA) through cBioportal (65). Mutations in the corresponding gene located outside the RGS domain were excluded from the analysis because their divergence of sequence and functional domains preclude a unified analysis to make generalizable conclusions. Nevertheless, we found that the frequency of mutations per amino acid was similar within or outside the RGS-box for most of the RGS proteins investigated (fig. S1). The total number of mutations in the RGS-box was 475, which collectively covered ~90% of the domain coordinates (Fig. 1, C and D). Mutations were identified in the RGS-box from every single RGS protein, ranging from as few as 4 (in RGS14) to as many as 68 (in RGS12) (Fig. 1C). RGS-box mutations were present in 22 cancer types classified broadly by organ of origin, ranging from one mutation in medulloblastoma to dozens in lung cancers and melanomas (fig. S2).
Bioinformatics analysis of cancer-associated mutations in the RGS domain
Having assembled a comprehensive dataset of RGS-box mutations, we set out to analyze emergent features. Of the 475 mutations, 15% are expected to give rise to a loss of function, because they are splice-interfering, frameshift (indels), or nonsense mutations (Fig. 2A). The remaining 405 mutations were missense amino acid replacements. When graphed as a lollipop plot over the RGS protein coordinate numbers, no missense mutation hotspot positions were evident, although some coordinate numbers were more frequently mutated than others (Fig. 2B). For example, ~20% of the coordinate numbers (24 of the 122) were mutated 5 or more times, accounting for ~37% of the total missense mutations. When these more frequently mutated coordinates were overlaid on the RGS domain structure, they appeared scattered throughout the 3D structure, including positions within and outside the G protein–binding interface (Fig. 2C). When all 405 missense mutations were analyzed to assess the frequency of mutation in coordinates corresponding to the G protein–binding interface or to noninterface positions, a slight but statistically significant enrichment was found for mutations at the interface coordinates (Fig. 2D).
Fig. 2. Bioinformatics analysis of cancer-associated mutations in the RGS-box domain.

(A) Classification of cancer-associated mutations found in all 20 RGS-box domains by mutation type (total number and percentage). (B) Position-based frequency of mutations in the RGS domain. The number of mutations found for each alignment-based RGS-box domain coordinate position across all 20 RGS proteins was integrated and presented as a “lollipop plot.” (C) Localization of frequent missense mutations in the 3D structure of the RGS domain. Left: Structure of a representative RGS domain (RGS4, gray) bound to active Gαi1 (green). Middle and right: The integrated mutation frequency at a given RGS protein coordinate is color-coded (bottom bar of middle panel) mapped onto the representative RGS protein structure (right). (D) RGS protein amino acid positions at the G protein interface (within 5Å of Gα) are more frequently mutated than are non-interface positions. The indicated P value was determined with the Mann-Whitney U test. (E and F) At least 60% of RGS domain missense mutations are predicted to disrupt protein function according to PolyPhen (E) and SIFT (F). Results are presented as scatter plots of the scores for each cancer-associated RGS protein missense mutation (left) and the percentage of mutation in each category of the prediction (right; tolerated/ possibly damaging/ probably damaging). (G) RGS protein amino acids at the G protein interface (“I”) are more frequently predicted to disrupt protein function than those at non-interface positions (“N.I”) according to PolyPhen (left) and SIFT (right) disruption categories. The color code used is the same as that in (E). The indicated P values were determined by the χ2 test for PolyPhen and by Fisher’s exact test for SIFT.
As noted earlier, 15% of the 475 RGS protein mutations are expected to be damaging (that is, cause a loss of function) because of the introduction of premature stop codons (splicing, frameshift, nonsense mutations). To assess the potentially damaging effect of the 405 missense mutations, we used two different prediction algorithms implemented by the programs PolyPhen and SIFT (Fig. 2, E and F). The overall results from both programs were similar in that ~60% of mutations were predicted to be “probably or possibly damaging” (Fig. 2, E and F). If these predictions are correct, it is possible that as many as ~65% of all 475 mutations found in the RGS-box domain result in a loss of function (15% from splice, frameshift, or non-sense mutations and the rest from missense mutations). Mutations at the G protein interface were also predicted by both PolyPhen and SIFT to be more frequently damaging compared to mutations at non-interface positions (Fig. 2G).
Functional characterization of a large representative set of RGS protein mutants in a yeast-based assay
Next, we set out to empirically characterize the effect of cancer-associated missense mutations on G protein regulation by RGS GAPs. Although analyzing all of the >400 mutations would not be feasible, we reasoned that selecting a large representative pool of them would enable us to draw broadly generalizable conclusions. We used several criteria to select this pool of representative mutants (Fig. 3A). First, we focused on RGS protein coordinate numbers that were mutated 5 times or more. Because there are no obvious mutation hotspots (Fig. 2B), the motivation of this selection was not to try to enrich for mutants with cancer-associated functional consequences, but to achieve a larger representation of the total pool of mutations. The selected 24 coordinate numbers based on this criterion encompassed 151 mutations (~37% of all missense mutations) representing all 20 RGS proteins. Within this pool, we selected a subset of 49 mutations based on obtaining representation of (i) all four RGS GAP protein families, (ii) as many individual RGS proteins as possible (17 out of 20), and (iii) a large proportion of the coordinate numbers (19 out of 24) (Fig. 3A). We also took care to include examples of mutations of the same coordinate number in different RGS proteins, as well as to balance the number of mutations in coordinates within and outside the G protein–binding interface.
Fig. 3. Systematic assessment of cancer-associated RGS protein mutations on GAP activity using a scalable yeast-based assay.

(A) Criteria for selecting a representative set of 49 cancer-associated mutations in RGS domains to screen for potential disruptive effects. (B) Diagram of the yeast-based β-galactosidase (β-gal) assay used to assess the function of mutant RGS proteins in inhibiting human G protein signaling. AGS1 stimulates the G protein–dependent activation of the Fus1 promoter in yeast lacking pheromone-responsive GPCRs through Gβγ. This activation response is suppressed by the GAP activity of RGS proteins, which accelerate the deactivation of human Gαi3. (C) Representative readout of the β-gal assay described in (B). Inhibition of AGS1-dependent G protein activation by a WT or mutant RGS protein was determined with a fluorogenic β-galactosidase substrate in a 96-well format. (D) Effects of different RGS8 mutants on G protein activation in yeast. β-gal activity (normalized to the percentage of maximal activation, “AGS1 only”) was used to calculate the relative GAP activity using the inset equation. Data are means ± SEM of six experiments. **P < 0.01 and ***P < 0.001 as compared to “AGS1 only” (black asterisks) or to “AGS1 + RGS8 WT” (red asterisks) by one-way ANOVA with Bonferroni multiple-comparisons test. (E) Effects of the selected 49 RGS protein cancer-associated mutations on GAP activity in the yeast-based G protein activity assay. Relative GAP activity was determined relative to the respective RGS WT protein for each mutant as described for (D). Background is shaded yellow, orange, and red, respectively, to indicate mild (75 to 50% of WT), moderate (50 to 25% of WT), and severe (25 to 0% of WT) reductions in GAP activity. Results are means ± SEM of at least six experiments. (F) Percentage of screened mutations that severely, moderately, or mildly affected GAP function as described for (E) when considered in aggregate (“All mutants”) or when stratified as “Interface” (within 5Å of Gα) or “Non-interface” positions.
Because analyzing 49 mutants across 17 RGS proteins is still a demanding target for biological experimentation, we turned to a yeast-based assay system to enable sufficient throughput. This assay is based on a genetically engineered S. cerevisiae strain (71, 72) in which the endogenous Gα protein (Gpa1) is replaced by human Gαi3 and that lacks pheromone-responsive GPCRs (Fig. 3B). This constitutes a “humanized” yeast system in which an exogenous G protein activator can stimulate the GPCR-dependent signaling pathway that normally results in the activation of the FUS1 promoter in response to mating pheromone, which can be monitored using a β-galactosidase reporter. For our experiments, we used the nonGPCR GEF AGS1 (also known as DEXRAS1) as the exogenous activator of G proteins. It was previously shown in this same experimental system that AGS1 is a potent activator of G protein signaling, and that its activity can be efficiently suppressed upon co-expression of some exogenous RGS GAPs (71, 72). We validated and extended these previous observations in our hands with two control experiments. First, we confirmed that expression of the RGS-box of RGS4 inhibited AGS1-promoted activation and that this effect was efficiently reverted by previously described loss-of-function mutations (N128A and N88A) (fig. S3A) (73). Next, we co-expressed AGS1 and the RGS-box domain of each of the 17 RGS proteins containing the representative set of cancer-associated mutations described earlier. We found that all of the 17 RGS-box domains suppressed AGS1-mediated activation in the G protein activity reporter yeast strain (fig. S3B). We used the decrease in AGS1-promoted G protein activation as a metric to compare the GAP activity of each individual cancer-associated mutant relative to its corresponding wild-type (WT) counterpart (Fig. 3C). For nomenclature purposes, each missense replacement is described based on the amino acid number from the full-length RGS protein to which it belongs followed by the coordinate number of the aligned RGS domain (Fig. 1C) in parenthesis. Taking the results for RGS8 as a representative example (Fig. 3D), we observed a range of effects of mutations on GAP activity, from complete suppression [in the case of the A146D (#97) mutant], to moderate suppression [for S56F (#7)], to no effect [for F78S (#29)]. Analysis of the complete set of 49 mutations across 17 RGS proteins revealed that only about one fourth of them resulted in a reduction in GAP activity of 25% or more (Fig. 3, E and F and table S1). The mutations that resulted in a decrease in GAP activity were largely absent from the ExAC database of naturally occurring variations in nontransformed cells from >60,000 individuals (table S1) (74). When the results were stratified based on the localization of the mutant coordinate numbers within or outside the G protein binding interface, a similar overall frequency was observed, although mutations at the interface seemed to have more severe defects in GAP activity (Fig. 3F). These results suggest that a sizable portion of cancer-associated mutations in RGS proteins result in a loss of GAP activity.
Selection of RGS protein mutants for validation in mammalian cells
Before drawing further conclusions about the effect of RGS protein cancer mutations on G protein activity from the yeast experiment results described earlier, we set out to validate the findings about a select group of mutants in mammalian cells. This validation is important because, although the yeast-based assay enabled higher throughput, it is a heterologous system lacking some of the features of G protein signaling in their natural environment, including their activation by GPCRs. Also, the yeast-based experiments were performed with isolated RGS-box domains rather than with full-length RGS proteins. To overcome these potential limitations, we selected 9 mutants with the intention of testing the effects of their mutations on the activity of full-length RGS proteins in mammalian cell assays that directly monitor G protein activity. The criteria to select the 9 mutants were: (i) to sample the various mutation severities (mild, moderate, or strong), (ii) to explore both G protein interface and noninterface mutations, and (iii) to include mutations at the same coordinate number in different RGS proteins (Fig. 4A).
Fig. 4. Selection of RGS protein mutants for validation in mammalian cells using a BRET-based G protein activity biosensor.

(A) Left: Selection of a representative set of 9 RGS-box cancer-associated mutations from the 49 that were assessed in yeast. Criteria for selection (shown in the table) included sampling mutations with various degrees of defective GAP activity in yeast, as well as position within and outside the G protein interface, among others. Right: The protein structure depicts the positions of the selected mutations (colored yellow or red according to the increasing frequency of mutation at that coordinate) are shown relative to the Gα interface (green). (B) Description of the assay to assess RGS protein GAP activity in mammalian cells using a BRET-based biosensor. Agonist-induced GPCR activation leads to the dissociation of Venus-tagged Gβγ from Gα, which in turn binds to the c-terminal domain of GRK3 fused to nanoluciferase (Nluc) resulting in increased BRET. Subsequent addition of a GPCR antagonist causes a decline of the BRET signal upon G protein inactivation, which can be accelerated by the GAP activity of an RGS protein. Comparison of the acceleration of the deactivation rate in the presence of WT or mutant RGS proteins was used to determine their relative GAP activities.
Effect of RGS protein cancer mutations on G protein activation in mammalian cells
To analyze the properties of the selected RGS protein mutants on G protein activity in mammalian cells, we used a bioluminescence resonance energy transfer (BRET) assay that directly monitors G protein activity in HEK 293T cells (Fig. 4B). Briefly, dissociation of Gαβγ heterotrimers upon GPCR activation leads to the association of free Venus-Gβγ (BRET acceptor) with the C-terminal domain of its effector GRK3 fused to an enhanced luciferase (Nluc, BRET donor), which leads to an increase in BRET (75–77). This response can be reverted by the addition of a GPCR antagonist, which proceeds at a rate dependent on the deactivation kinetics (GTP hydrolysis) of Gα (77, 78). This assay provides sufficient temporal resolution to accurately determine activation and deactivation rates in addition to response amplitude. The G protein regulatory activity of RGS proteins in this assay is recapitulated best by the effect on deactivation kinetics (“off rate”) when ligand-activated GPCRs are shut off upon addition of an antagonist (Fig. 4B). Consistent with their GAP activity toward Gα proteins, RGS protein expression leads to faster off-rates in this assay (77, 78). Although RGS proteins can also lead to decreases in response amplitude in this assay (77, 78), this readout is less robust than monitoring the effects on rates of deactivation for several reasons. First, the effect of RGS proteins on response amplitude depends on the specific RGS protein, G protein, and GPCR (77–79). Also, the effects of RGS proteins on response amplitude tend to result in a shift of the GPCR agonist stimulation curve, which can be masked at high concentrations of agonist (77–79). On the other hand, the effect of RGS proteins on the rate of deactivation is largely independent of agonist concentration, receptor number, or the specific RGS protein or GPCR (77–79). For these reasons, we used deactivation rates in this assay as a more consistent metric for RGS GAP activity across different experimental conditions.
Initially, we assessed the effect of the RGS proteins on the activity of Gi proteins by co-expressing the α2A adrenergic receptor and Gαi3 together with the other components required for BRET measurements in HEK 293T cells (Fig. 5). The nine mutants selected based on the criteria described earlier correspond to four different RGS proteins: RGS4, RGS8, RGS7, and RGS14. Each mutant was expressed in transfected cells and compared side-by-side with its WT counterpart. Because we anticipated that some mutations might affect the function of RGS proteins by decreasing their overall abundance rather than by directly affecting RGS-G protein interactions, we assessed RGS protein amounts by Western blotting analysis (Fig. 5, C, G, K, and O, table S2). For this, we compared cells expressing the various mutants to cells transfected with half the amount of plasmid DNA encoding their corresponding WT counterpart (0.5 μg instead of 1.0 μg), a condition we named “WT(low).” We reasoned that, in some cases, this might clarify whether functional defects in RGS protein mutants were due to diminished binding to G proteins or to reduced protein abundance, which turned out to be the case. For example, the RGS4 R167L (#112) mutant failed to recapitulate the acceleration of Gαi3 deactivation observed in cells expressing WT RGS4 (Fig. 5, A and B). However, this mutant was present at lower abundance than that of the WT protein when the cells were transfected with the same amounts of WT- and mutant-encoding plasmids (1 μg) (Fig. 5C), raising the question of whether the defect in activity is instead caused by reduced abundance. Comparison of cells expressing the RGS4 R167L (#112) mutant with cells transfected with half the amount of plasmid encoding WT RGS4 solved this question, because despite being present in similar amounts (Fig. 5C), cells expressing the mutant RGS protein still had defective activity compared to “WT(low)” cells (Fig. 5, A and B). Thus, the likely cause of the defective activity of the RGS4 R167L (#112) mutant is improper coupling to Gαi. This interpretation is consistent with the presence of R167 at the G protein–binding interface of RGS4 (Fig. 5D). This type of analysis was extended to all 9 mutants, showing that 8 of them had a decrease in relative GAP activity > 25% (Fig. 5Q). The effects on response amplitude (fig. S4) show trends consistent with the changes in GAP activity as determined by deactivation rates described earlier, although, as expected, with larger variability from RGS protein to RGS protein and from experiment to experiment. Overall, the effect of the mutants in the BRET assays correlated well with the results obtained in the yeast-based assays.
Fig. 5. Representative cancer-associated mutations show different degrees of GAP activity disruption across multiple RGS proteins.

(A to P) The effects of RGS protein mutations on Gi signaling deactivation rates and relative RGS protein abundances were assessed for full-length RGS4 (A to D), RGS8 (E to H), RGS7 (I to L), and RGS14 (M to P). HEK293T cells were transfected with plasmids encoding the components of the BRET system and the GPCR α2-AR in the presence or absence (no GAP) of the indicated RGS proteins. For all RGS protein–expressing plasmids, 1.0 μg of DNA was used per transfection, except for the condition labeled WT(low), in which case, the cells were transfected with 0.5 μg of the appropriate plasmid. Cells were treated with 1 μM brimonidine at 30 s and 50 μM yohimbine at 90 s during BRET measurements. Data in (A), (E), (I), and (M) show traces of normalized BRET responses after the addition of antagonist (yohimbine). Data in (B), (F), (J), and (N) are scatter plots of the quantification of the deactivation rates (koff) for the indicated conditions. Results are means ± SEM of four experiments.*P < 0.05, **P < 0.01, ***P < 0.001. Red and gray asterisks indicate statistical significance with respect to the WT and WT(low) conditions, respectively, as determined by one-way ANOVA with Bonferroni multiple-comparisons test. Data in (C), (G), (K), and (O) are Western blots from two or three independent experiments. (D, H, L, and P) Structural models of the RGS domain indicating the position of the mutated residues (colored yellow or red according to the increasing frequency of mutation at that coordinate). (Q) Summary of the relative GAP activity of all of the examined mutants with respect to each corresponding WT RGS protein. Each mutant is clustered by its RGS protein coordinate (X-axis) designating its position in the representative RGS protein structure (as shown in Fig. 1). Background is shaded yellow, orange, and red, respectively, to indicate mild (75 to 50% of WT), moderate (50 to 25% of WT), and severe (25 to 0% of WT) reductions in GAP activity. Data are means ± SEM of four experiments. For quantification of Western blotting data, see table S2.
Correlation of the effects of RGS protein cancer-associated mutations on Gq with the effect on Gi
RGS4 and RGS8, like other members of the B/R4 family, are GAPs not only for Gi proteins, but also for Gq proteins. Because enhanced signaling by both Gi and Gq has been linked to cancer (8, 10, 15, 21–24, 27), we set out to determine whether mutations that impaired RGS GAP activity did so across different G protein subtypes. For this, we examined the effect of the RGS4 and RGS8 mutations that we investigated with Gi3 (Fig. 5) on the deactivation kinetics of Gq using the same BRET-based assay except that the muscarinic M3 receptor (M3R) was used as the GPCR and that Gαq replaced Gαi3 (Fig. 6, A to H). The results revealed a correlation between the relative GAP activity on Gq and Gi for each one of the mutants (Fig. 6, I and J), suggesting that loss-of-function defects apply broadly to the G protein GAP regulatory activity of RGS proteins.
Fig. 6. RGS protein cancer-associated mutations have similar effects on GAP activity toward Gαi and Gαq.

(A to H) The effects of RGS protein mutations on the deactivation rates of Gi signaling and RGS protein abundances were assessed for full-length RGS4 (A to D) and RGS8 (E to H). HEK293T cells were transfected with plasmids encoding the components of the BRET system and the GPCR M3R in the presence or absence (no GAP) of the indicated RGS proteins. For all RGS protein–expressing plasmids, 1.0 μg of DNA was used per transfection, except for the condition labeled WT(low), in which case, the cells were transfected with 0.5 μg of the appropriate plasmid.. Cells were treated with 100 μM carbachol at 30 s and 100 μM atropine at 90 s during BRET measurements. Data in (A) and (E) show traces of normalized BRET responses after the addition of antagonist (atropine). Data in (B) and (F) are scatter plots of the quantification of the deactivation rates (koff) for the indicated conditions. Data are means ± SEM of four experiments. *P < 0.05, **P < 0.01, ***P < 0.001. Red and gray asterisks indicate statistical significance with respect to the WT and WT(low) conditions, respectively, as assessed by one-way ANOVA with Bonferroni multiple-comparisons test. Data in (C) and (G) are representative Western blots from two experiments. (D and H) Structural models of the RGS domain indicating the position of the mutated residues (colored yellow or red according to the increasing frequency of mutation at that coordinate). (I) Summary of the relative GAP activity of all of the examined mutants with respect to each corresponding WT RGS proteins for both Gi and Gq signaling. Each mutant is clustered by its RGS protein coordinate (X-axis). Background is shaded yellow, orange, and red, respectively, to indicate mild (75 to 50% of WT), moderate (50 to 25% of WT), and severe (25 to 0% of WT) reductions in GAP activity. Data are means ± SEM of four experiments. (J) Correlation plot comparing the relative GAP activity on Gi and Gq signaling by each RGS protein mutant. The indicated P value was calculated from Pearson correlation.
Mechanistic basis for loss-of-function defects associated with RGS protein cancer-associated mutations
As noted earlier, loss of RGS protein function in mutants could be due to decreased protein abundance, defects in directly exerting GAP activity on G proteins, or both. Although other mechanisms might also account for the loss of function (for example, subcellular mislocalization), we focused on these two potential mechanisms as the most likely scenarios to simplify the interpretation of our results. We used only the data on Gi3 regulation, instead of also including the observations for Gq, for the sake of simplicity, and because the dataset for Gi3 is more comprehensive than that for Gq.
A first distinction to classify the effect of the mutants investigated by BRET in mammalian cells was whether their abundance was less than that of their WT counterparts when less plasmid was used, namely, the condition we called “WT(low)” (Fig. 7A). This enabled us to separate those mutations that caused marked defects in protein abundance from those that did not. For those mutants that were as abundant as the WT protein under “WT(low)” conditions but had apparent GAP activity less than that under “WT(low)” conditions, we interpreted that the loss of function was due to a defect in directly regulating G protein activity (Fig. 7A). Five of the nine mutants fell into this category. RGS7 E358K (#32), RGS4 R167L (#112), and RGS8 R161M (#112) contain mutations located at the G protein interface, which could easily explain the loss of RGS function by disruption of G protein binding. The other two mutations, RGS8 S56F (#7) and RGS14 S127P (#65), are not located at the G protein interface, suggesting that coupling to G proteins might be allosterically perturbed by these mutations.
Fig. 7. Integrative analysis of RGS protein mutations reveals multiple loss-of-function mechanisms, correlation among assays, and false bioinformatics-based predictions.
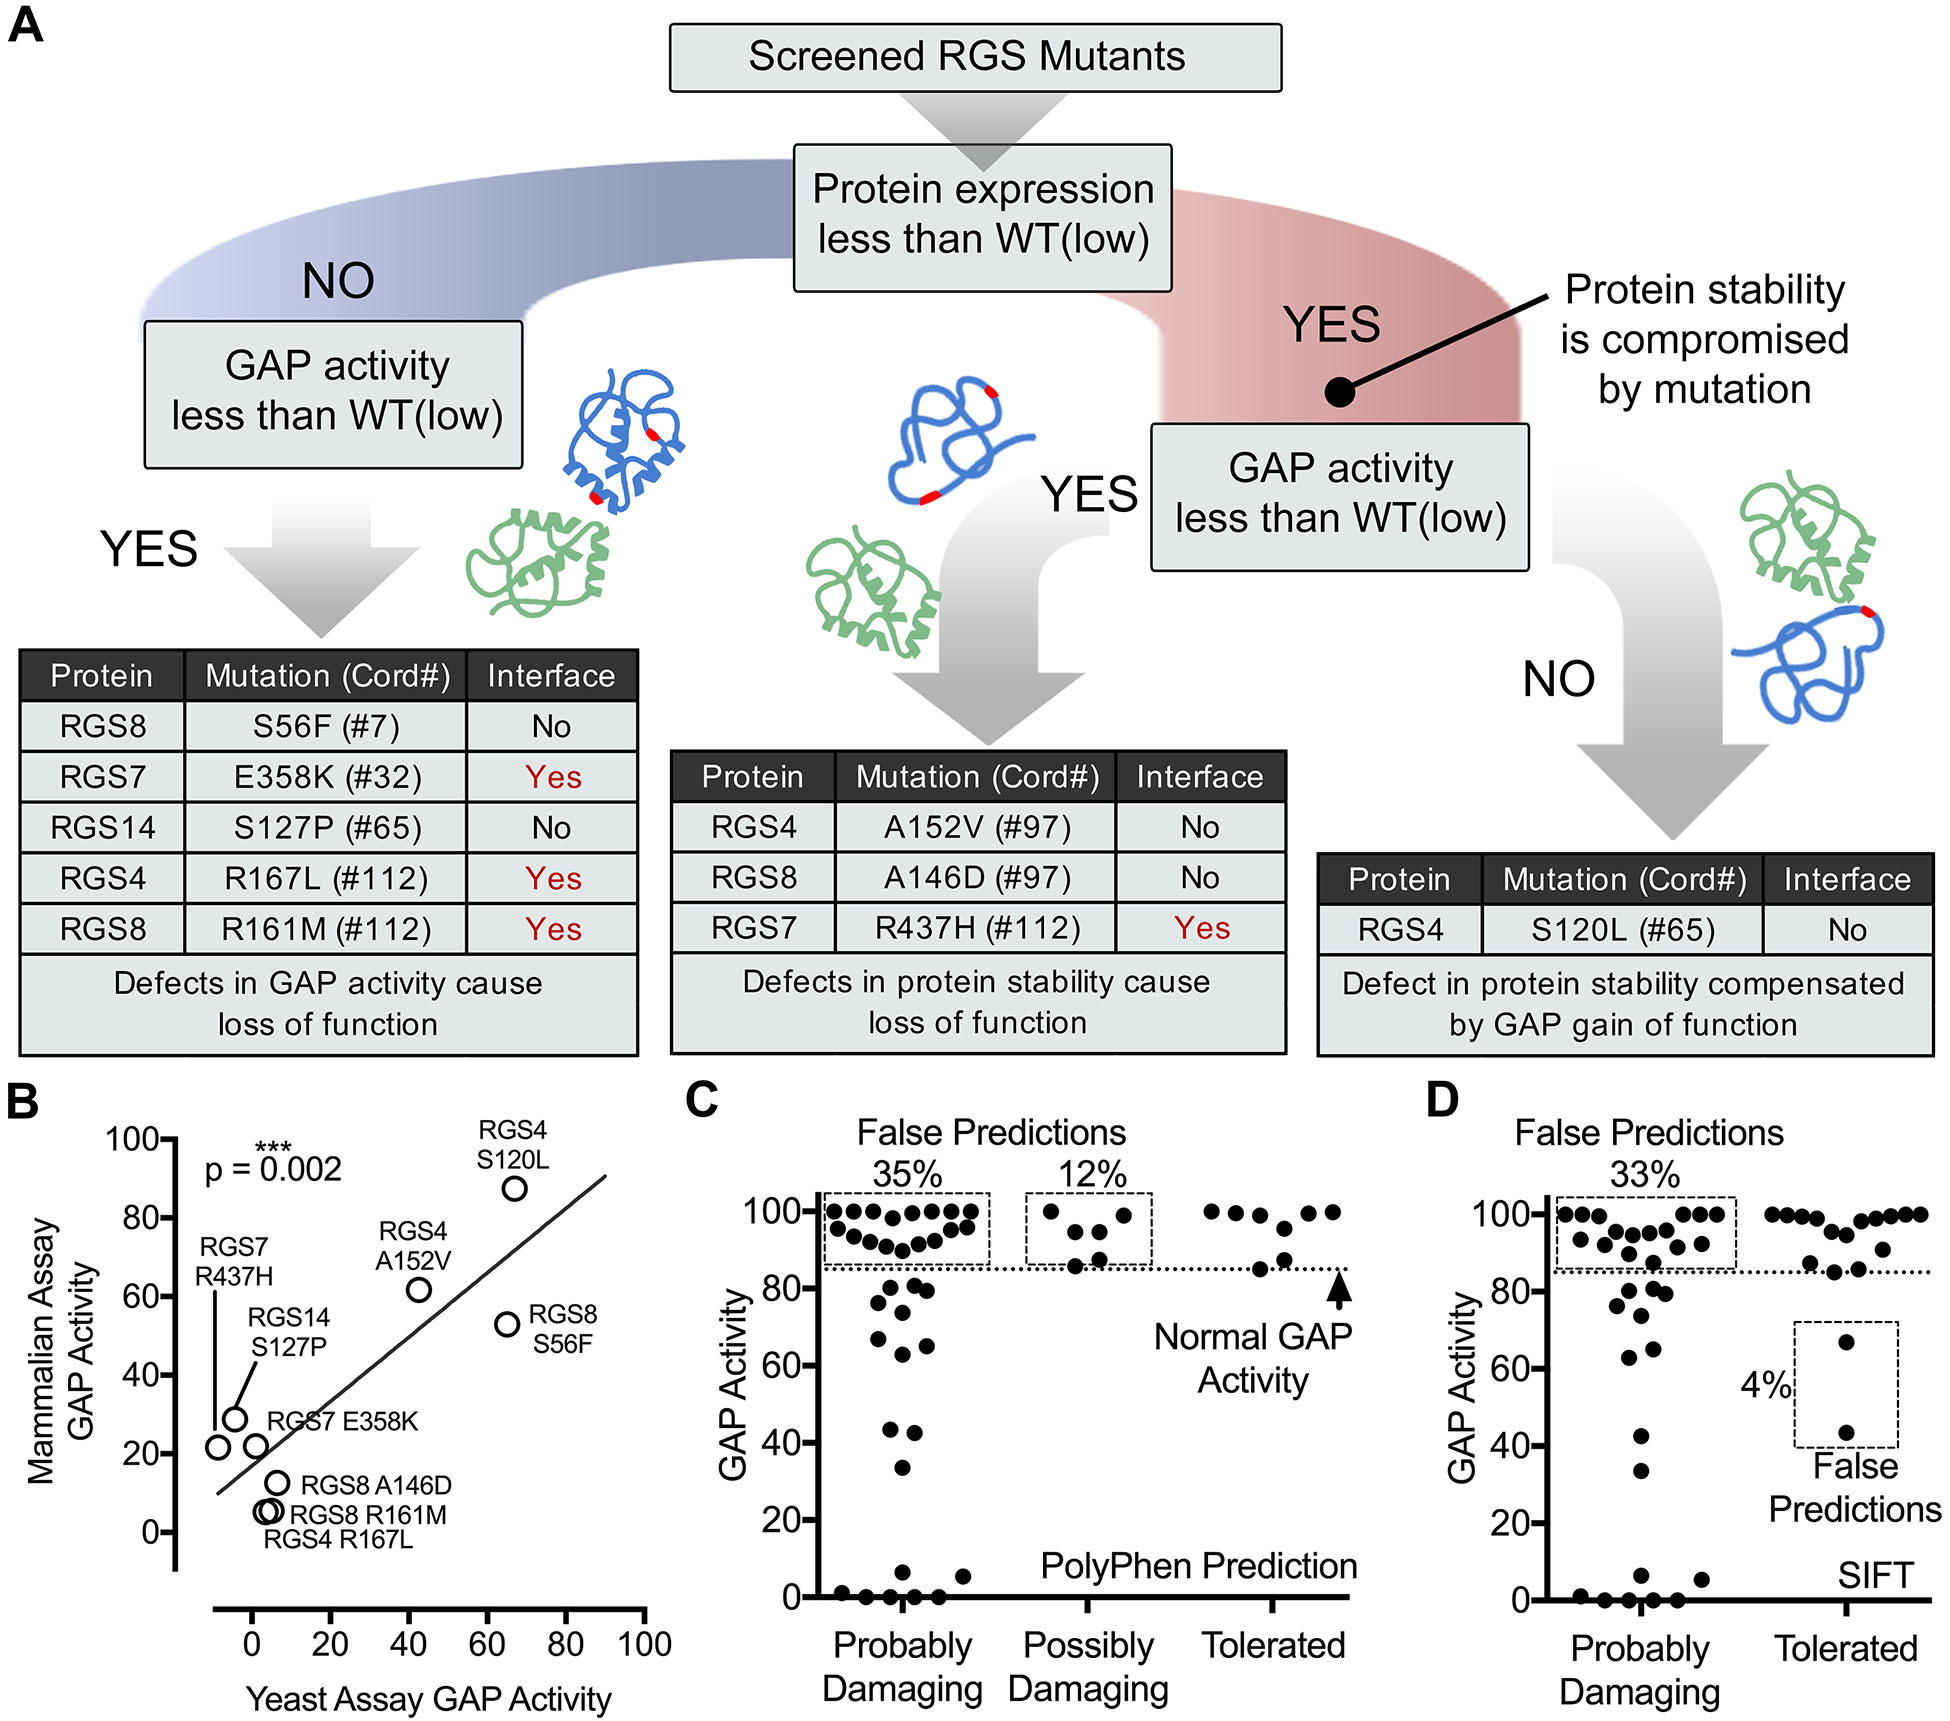
(A) Summary of GAP-activity and protein abundance effects for the nine representative RGS protein mutations analyzed in mammalian cells. A putative cause of loss of function is given based on an assessment of the results presented earlier. (B) The effects of mutations on RGS GAP activity in the mammalian cell BRET assay correlates well with the effect on the GAP activity in the yeast-based assay. The indicated P value was calculated from Pearson correlation. (C and D) Comparisons of experimentally determined RGS GAP activities and bioinformatics-based predictions of the damaging effects of cancer-associated missense mutations. The GAP activity of 49 RGS domain mutations derived from the yeast-based assay is plotted for each of the damaging/tolerated categories of both PolyPhen (C) and SIFT (D) predictions. The percentage of false predictions (dotted boxes) is given where the functional screening and predictive methods do not agree.
For the three mutants with apparent GAP activity lower than that under “WT(low)” conditions and also accompanied by protein abundances less than those of the WT proteins under “WT(low)” conditions, we propose that the main mechanism contributing to the loss of function is diminished protein stability (Fig. 7A). For RGS4 A152V (#97) and RGS8 A146D (#97), this could be explained on the basis that these mutations correspond to amino acids that are not surface exposed and are located internally within the helical bundle of the RGS-box domain (see Fig. 5, D and H). On the other hand, RGS7 R437H (#112) corresponds to a solvent-exposed amino acid residue at the G protein binding interface, which makes the possible cause for structural destabilization less obvious. Mutation of the same position (#112) in RGS4 and RGS8 led to reduced function due to direct impairment of GAP activity rather than protein destabilization, because RGS protein function was impaired compared to that in cells expressing the same amounts of the WT proteins (see Fig. 5, B, C, F, and G). Thus, it is possible that the loss of function in RGS7 R437H (#112) is due not only to its reduced abundance, but also to disruption of the RGS–G protein–binding interface.
The results from experiments with the remaining mutant, RGS4 S120L (#65), are puzzling. This mutation causes a marked decrease in protein abundance; however, its apparent GAP activity was not statistically significantly altered (see Fig. 5, A to C). It is possible that this mutation impairs protein stability while simultaneously enhancing the GAP activity of RGS4, thereby compensating so that the overall G protein regulatory activity was similar to that observed in control cells. This idea is supported by previous evidence that “modulatory” residues located in the periphery of the G protein–binding interface of RGS proteins, such as Ser120 of RGS4, influence RGS–G protein recognition and the efficiency of GAP activity (80, 81), which can potentially lead to enhancement of activity. In summary, although additional work is required to pinpoint the specific molecular details of each individual mutant, our analysis of a subset of cancer-associated RGS protein mutations suggests that they lead to a loss of function through diverse mechanisms.
Comparison of yeast, mammalian cell, and bioinformatics analyses of RGS protein cancer mutations
Regardless of the mechanism by which cancer-associated RGS protein mutations lead to a loss of function, there are several conclusions that can be drawn from the systematic analysis described here. The first one is that the yeast-based assay implemented with isolated RGS-box domains (Fig. 3) recapitulated the GAP activity of full-length RGS proteins measured directly by G protein activity biosensors in mammalian cells (Fig. 7B). The first implication of this observation is increased confidence about the results obtained with the larger representative set of 49 mutants analyzed in yeast. The second implication is that the yeast-based system is a scalable assay that could be implemented in the future as a platform to systematically screen RGS protein mutants, therefore overcoming the limitation in throughput of mammalian-based assays (such as those described in Fig. 4). One potential limitation of this yeast-based platform is that it relies on measuring Gαi activity, so it could not be implemented for RGS2, which acts solely on Gαq. Nevertheless, our data suggest that the effects of mutations on RGS proteins that act on both Gαi and Gαq correlate well among both G proteins (Fig. 6, I and J), making the yeast-based assay a suitable approach for initial screening. Another potential limitation is that this yeast-based assay would not capture the functional consequences linked to the non-GAP domains of RGS proteins; however, it provides the means to rapidly assess the direct modulation of G protein activity empirically. The ability to empirically test the functional consequences of RGS protein mutations is crucial to gain an understanding of this family of G protein regulators in cancer.
Having empirical information on the functional consequences of 49 RGS protein mutations (Fig. 3), we could assess the validity of bioinformatics-based predictions on the same representative set of mutants. When we compared the relative GAP activity of each RGS protein mutant with the predictions based on PolyPhen (Fig. 5C) or SIFT (Fig. 5D), we found that the rate of false predictions was 47 and 37%, respectively (Fig. 7, C and D). Approximately one third of the mutations that were predicted as “Probably damaging” by either of the two programs turned out to have close to normal activity in the signaling assay (that is, not less than 75% of the WT activity), suggesting a high rate of false positives from the bioinformatics predictions. As for false negatives, only two mutants that had defects in the signaling assays were predicted by one of the programs (SIFT) to be “Tolerated.” Thus, these results suggest that these bioinformatics tools tend to overestimate the number of RGS protein cancer mutations that are damaging, highlighting the importance of having assays in place to systematically characterize RGS protein mutants identified in genomics campaigns.
DISCUSSION
The main advance provided by this work is to fill a gap between already available genomic data and the lack of knowledge about the associated functional consequences for a family of important regulators of GPCR–G protein signaling. Although efforts during the last decade have shed light onto the relevance of GPCR–G protein signaling in human cancer, the role of RGS proteins in this context remains understudied. Here we provided a systematic assessment of cancer-associated mutations in the domain that confers G protein regulatory activity to RGS proteins. In addition to analyzing mutation patterns bioinformatically, we provided empirical evidence to suggest that a sizable portion of mutations impair RGS-mediated G protein regulation and the proof-of-principle validation for a scalable assay that could be used to expand this type of study to other RGS protein mutations in the future.
One of our conclusions is that relying solely on bioinformatics tools might overestimate how frequently mutations in the RGS-box result in a loss of function in cancer (Fig. 7, C and D). Nevertheless, our empirical results still suggest that a sizable portion of these mutations are damaging. If we were to extrapolate the information gained from the 49 mutants studied to all RGS-box missense mutations, approximately 20% of all RGS-box mutations would be expected to be loss-of-function missense mutations. This added to the 15% of other loss-of-function mutations (premature stop codons; Fig. 2A), would result in a frequency of approximately 35%. Note that this might be an underestimation of the actual portion of inactivating mutations in full-length RGS proteins because it does not account for mutations found outside the RGS-box that appear at a similar frequency (fig. S1). However, it is difficult to make generalizable conclusions from mutations outside the RGS-box given the divergence of sequence and domain composition across different RGS proteins.
Based on our calculations, the RGS-box domain considered in aggregate would meet the criteria of the “20/20 rule” to be deemed to have a tumor-suppressor function (66). The 20/20 rule was proposed by Vogelstein et al. to overcome the limitation of predicting driver mutations based only on frequency data. Instead, the authors proposed that the pattern of mutation is very relevant to identify drivers, such that tumor suppressors present inactivating mutations distributed along their sequence without clear mutation hotspots such as those found in oncogenes. The authors proposed that for a protein to be classified as a tumor suppressor, it is required that that >20% of the recorded mutations are inactivating (66). According to this criterion, mutations in the RGS-box would be cancer-driving events rather than passenger mutations. This interpretation must be made with caution for several reasons. One caveat is that this rule does not take into account whether the mutation occurs in one or two alleles, which could be relevant for cases in which loss of heterozygosity has not occurred. Another is that multiple RGS proteins can be expressed in the same cell, so there is the potential for functional redundancy that may compensate for the loss of function caused by mutation of only one of them. However, there is evidence that loss of a single RGS protein amidst other co-expressed RGS proteins in the same cell type can have strong biological consequences (82). Overall, we propose that loss of RGS GAP function should be taken into consideration as a factor that contributes to heterotrimeric G protein hyperactivation in cancer. As in many other cases of genomic alterations in cancer, loss of RGS GAP function might serve as one of the multiple simultaneous “hits” typically required to induce complete oncogenic transformation. As for the potential therapeutic implications of modulating RGS proteins in cancer, there are ongoing efforts to identify and optimize small-molecule modulators of RGS protein function, including approaches to enhance their GAP activity as one would desire in the context of cancer (46, 83).
MATERIALS AND METHODS
Plasmids and cloning
Plasmids containing cDNA encoding RGS1, RGS3 (isoform 4), RGS6, RGS8 (isoform 2), RGS10 (isoform 3), RGS12, RGS14, RGS16, RGS17, RGS18, RGS20 (isoform 5), and RGS21 were obtained from the DNA Resource Core PlasmidID Repository (Harvard Medical School). Unless otherwise indicated, these cDNAs correspond to the reference sequence (isoform 1) in Uniprot. Plasmids encoding RGS7 and RGS9 were generously provided by Kendall J. Blumer (Washington University, Saint Louis MO). Plasmids expressing RGS4 and RGS5, as well as pFUS1::LacZ and AGS1-expressing vectors used for β-galactosidase assays were a kind gift from Mary Cismowski (Nationwide Children’s Hospital, Columbus OH). Plasmid expressing RGS19 (also known as GAIP) was donated by Marilyn G. Farquhar (University of California, San Diego CA). All sequences were for human proteins with the exception of RGS12 (mouse, 96% sequence identity to human RGS12 in the RGS domain) and RGS19 (rat, 94% sequence identity to human RGS19 in the RGS domain). Expression of the BRET donor in mammalian cells was performed with the plasmid pcDNA3.1-mas-GRK3ct-NanoLuc (76), which was kindly provided by Kirill Martemyanov (The Scripps Research Institute, Jupiter FL). The Gβ1 and Gγ2 constructs with the Venus protein split between them used to form the BRET acceptor were encoded by the plasmids pcDNA3.1-Venus(a.a. 155–239)-Gβ1 and pcDNA3.1-Venus(a.a. 1–155)-Gγ2 (75), which were kindly provided by Nevin Lambert (Augusta University, Augusta GA). The plasmid for expression of rat Gαi3 (pcDNA3-Gαi3) has been previously described (84). The pcDNA3-HA-Gαq plasmid, which encodes Gαq internally tagged with HA (85), was a generous gift from Philip Wedegaertner (Thomas Jefferson University, Philadelphia PA). The pcDNA3-α2A/D-AR plasmid encoding the rat homolog of human α2A-AR (86) was a gift from Joe Blumer (Medical University of South Carolina, Charleston SC) and the pcDNA3.1-HA-M3R plasmid for the muscarinic acetylcholine receptor M3 was obtained from the cDNA Resource Center (Bloomsberg PA). Cloning of the sequences encoding the “RGS-box” domain into vectors for yeast expression was performed with a previously described ligation-independent cloning (LIC) procedure (87). Primers were designed to amplify the region encoding the RGS domains of different proteins flanked by LIC adapter sequences. The PCR reactions corresponded to the following amino acid (a.a.) sequences: RGS1(a.a. 74–199), RGS3(a.a. 781–907), RGS4 (a.a. 51–177), RGS5 (a.a. 53–179), RGS6(a.a. 325–450), RGS7(a.a. 322–447), RGS8(a.a. 63–189), RGS9 (a.a. 291–416), RGS10(a.a. 22–147), RGS12(a.a. 704–831), RGS14(a.a. 56–183), RGS16 (a.a. 53–180), RGS17 (a.a. 74–199), RGS18 (a.a. 75–202), RGS19 (a.a. 79–205), RGS20 (a.a. 251–377) and RGS21 (a.a. 10–136). Amino acid numbers were assigned from the canonical sequence designated by the UniProt regardless of the isoform cDNA from which they were amplified. RGS domains were defined by aligning each protein sequence to that of RGS4 and extracting the homologous sequences matching Val51 to Leu177, corresponding to the crystalized domain structure (PDB: 1AGR). LIC-RGS domains sequences were subcloned into a modified pYES2 vector (pYES2-LIC-myc). This plasmid was generated by eliminating two SspI sites at nucleotides 5379 and 5400 in the pYES2 vector by mutagenesis and inserting an LIC cloning cassette between the Ssp I and BamH I restriction sites in the multiple cloning site with an upstream myc tag between the Hind III and Kpn I sites. Mutations were generated in RGS proteins by mutagenesis PCR. The construct for full-length, FLAG-tagged pcDNA3.1-Flag-RGS14 (rat) bearing the Q515A/R516A double mutation, rendering the GoLoco motif nonfunctional (79, 88), was a gift from John Hepler (Emory University, Atlanta GA). Plasmid encoding the HA-tagged, full-length pcDNA.3.1-HA-RGS7 was provided by Kendall J. Blumer (Washington University, Saint Louis MO). Plasmids encoding the RGS7-binding proteins R7BP and Gβ5 were a gift from Kirill Martemyanov (Scripps Research Institute, Jupiter FL). The plasmid pcDNA3.1–3xHA-RGS8 was obtained from the cDNA Resource Center (Bloomsberg PA). The pLIC-myc-RGS4 (N-terminal myc tag) plasmid was produced by subcloning the sequence encoding full-length RGS4 into the pLIC-myc vector (89), which was provided by John Sondek (University of North Carolina, Chapel Hill NC).
Bioinformatics searches and analyses
Data on the per-residue mutation frequency of all canonical RGS proteins with GAP function was gathered with cBioPortal (65) to draw from the indexed databases uploaded as of February 17th, 2016. Duplicate mutations due to representation in multiple versions of identical datasets were removed by assigning each mutation a unique ID dependent on the mutation and the sample ID with which it was associated. To facilitate an analysis of naturally occurring cancer mutations across the conserved sequences of RGS domains, we generated a coordinate system. Those residues aligning with Val56 of RGS4 (the first conserved residue across the 20 RGS proteins examined) were designated as Coordinate #1, continuing until Coordinate #121 (Asp176). Minimal gaps in the alignment were necessary (≤3/protein, all falling between Lys102 and Ser103 of RGS4), and gap residues relative to RGS4 were not issued a coordinate. For the identification of frequently mutated coordinates, only missense mutations were counted (for example, seven mutations at Coordinate #7); nonsense, splice-site, and insertion/deletion mutations were excluded. Highly mutated coordinates were defined as those in which five or more mutations were identified (which correspond to the top 20th percentile of coordinates when ranked by frequency of mutation). Predictions for the effect of each missense mutation in the dataset on protein stability were obtained using PolyPhen-2 (90) with protein ID inputs from UniProt. For comparison, the effect of each mutation on protein stability was also predicted with SIFT (91) using Ensembl ENSP protein IDs obtained from BioMart (92). Only canonical isoform sequences were used for mutation effect predictions. In all cases, the correct residue was manually verified for each position. Thresholds for prediction categories (tolerated, probably damaging, etc.) are defined by the programs. Interface and non-interface designations for RGS domain residues were assigned with PDBe-PISA (v1.52, EMBL-EBI) to find residues with substantially buried surface areas (93), corresponding to an approximate distance cutoff of 5Å. The crystal structure of AlF4−-activated Gαi1 bound to RGS4 [PDB: 1AGR (42)] was used as the representative structure for determining all RGS-Gα interface residue distances. Structure images were generated with PyMOL Molecular Graphics System (Schrödinger, LLC).
Yeast strains and manipulations
The Saccharomyces cerevisiae CY7967 strain [MATα GPA1(1–41)-Gαi3 far1Δ fus1p-HIS3 can1 ste14:trp1:LYS2 ste3Δ lys2 ura3 leu2 trp1 his3] used for all yeast assays was generously provided by James Broach of Penn State University (71, 72). This strain replaces the endogenous yeast Gα-subunit (Gpa1) with a yeast-human chimeric protein, Gpa1(1–41)-Gαi3(36–354), and deletes both the single pheromone-responsive GPCR expressed in this haploid yeast strain (Ste3) as well as the cell cycle arrest-inducing protein, Far1. Additionally, we transformed the CY7967 strain first with a centromeric TRP-selection plasmid containing the β-galactosidase gene (pFUS1::LacZ) downstream of the FUS1 promoter (activated by the pheromone response pathway). Selection was performed on synthetic defined (SD)-TRP medium (agar plates and then liquid culture for individual colonies). Subsequently, a single CY7967+pFUS1::LacZ strain was transformed with either a LEU-selection plasmid for constitutive expression of AGS1 or control empty vector. Double transformants were selected in SD-TRP-LEU medium. Plasmid transformations were performed using the lithium acetate method. The resulting strain enabled the yeast pheromone response pathway to be activated by ectopic expression of activators of Gαi3 (such as AGS1), driving LacZ reporter expression while the cell cycle arrest that normally occurs upon the native pheromone response was prevented by Far1 deletion. For expression of RGS proteins in yeast, the CY7967+pFUS1::LacZ+AGS1 and control CY7967+pFUS1::LacZ+empty-vector strains were transformed with high-copy, 2-micron pYES2-LIC plasmids (URA-selection) carrying the RGS-box domains of the GAPs described in the main text under a galactose-inducible promoter. Triple transformants were selected in SD-TRP-LEU-URA medium.
β-galactosidase activity assay
Individual yeast colonies were inoculated into 3 ml of SDgalactose-TRP-LEU-URA medium and incubated overnight at 30°C to induce the expression of the RGS-box domains under the control of the galactose-inducible promoter of pYES2. The OD at 600 nm was taken for the overnight cultures before permeabilization of the cells to enable eventual correction of β-galactosidase activity by biomass. Yeast cells (100 μl/well of a 96-well plate in duplicate) were permeabilized by the addition of Z buffer [60 mM Na2PO4, 40 mM NaH2PO4, 10 mM KCl, 1 mM MgCl2 and 0.25% (v:v) 2-mercaptoethanol, (pH 7.0), 25 μl/well] supplemented with 3% Triton X-100 (v:v). Permeabilization was achieved with orbital shaking for 1 hour at room temperature, after which 25 μl of fluorescein di-β-D-galactopyranoside (FDG) substrate diluted in Z-buffer (without Triton X-100) was added to each well to a final concentration of 0.1 mM. The fluorescent signal was read every 2 min for 90 min with an excitation of 485±10 nm and an emission of 528±10 nm using a BioTek Synergy H1 96-well plate reader. The plate was shaken for 2 s before every read. To determine a value for β-galactosidase activity, the linear region of the 90-min kinetic curve was used to determine an enzymatic rate (arbitrary fluorescence units/min). The rates were corrected for initial yeast cell concentrations by dividing by the OD600 values recorded before permeabilization. All OD-adjusted rates were then scaled to a percentage with respect to the positive control (“AGS1 only” equated with 100% activity) to determine a value for β-gal activity (% of AGS1). At least six independent yeast clones were assessed. The GAP activity for each WT RGS protein and the associated mutants was calculated by subtracting the β-gal activity of the negative control (“no AGS1”) from the activity of a given sample (“AGS1+RGS”) and dividing the result by the negative control activity subtracted from that of the positive control (“AGS1 only”):
Relative GAP activity was then defined as the quotient of the mutant GAP activity and the normal GAP activity expressed as a percentage. This value enabled the direct comparison of the effects of mutations across different RGS proteins despite the range of GAP potency observed (fig. S3), because it set the GAP activity of each WT RGS protein at 100%.
Bioluminescence resonance energy transfer (BRET) assays
BRET assays were performed similarly to previous work (94, 95). HEK 293T cells (CRL-3216, ATCC) were seeded on 6-well plates coated with gelatin at a density of ~400,000 cells/well for transfection on the next day. Cells were transfected with the BRET donor and acceptor components GRK3ct-nLuc (0.2 μg), Venus(ct)-Gβ1 (0.2 μg), and Venus(nt)-Gγ2 (0.2 μg), as well as with plasmids encoding the appropriate G proteins and GPCRs. For experiments with Gi, cells were cotransfected with 1 μg of plasmid encoding Gαi3 and 0.2 μg of plasmid encoding α2-AR. For Gq experiments, plasmids encoding Gαq (1 μg) and M3R (0.2 μg) were used. Cells were also cotransfected with either 0.5 or 1 μg of plasmid encoding tagged, full-length RGS protein (or empty vector for controls) with the BRET components, and plasmids encoding G protein and GPCR. For RGS7, cells were also cotransfected with 1 μg each of plasmids encoding R7BP and Gβ5 to reconstitute full GAP activity (77). Empty pcDNA3.1 vector was used to equalize the total amount of DNA for each transfection. Transfections were performed with the calcium phosphate method. Approximately 16 to 24 hours after transfection, cells were washed once in room-temperature PBS and gently harvested from the plate surface in 1 ml of PBS by scraping. Recovered cells were centrifuged for 5 min at 550g and resuspended at a concentration of ~1 × 10⁶ cells/ml in BRET Buffer [140 mM NaCl, 5 mM KCl, 1 mM MgCl2, 1 mM CaCl2, 0.37 mM NaH2PO4, 24 mM NaHCO3, 10 mM HEPES and 0.1% glucose, (pH 7.4)]. For BRET measurements, approximately 15,000 cells were added to a white opaque 96-well plate (Opti-Plate, Perkin Elmer) and mixed with Nano-Glo nanoluciferase substrate (Promega, final dilution of 1:200) in a final volume of 100 μl for 2 min before measuring luminescence. Baseline luminescence was recorded for 30 s before the addition of 1 μM brimonidine agonist (for the Gi studies) or 100 μM carbachol (for the Gq studies). After 60 s of monitoring the BRET response to stimulation, 50 μM yohimbine (antagonist used for the Gi studies) or 100 μM atropine (antagonist used for the Gq studies) was added to measure the off-rate kinetics. Luminescence signals were simultaneously measured at 460±40 and 535±35 nm using a PolarSTAR plate reader (BMG Labtech) at 28°C every 0.24 s. BRET values represent the ratio between the 535±35 nm and 460±40 nm emission intensities (raw BRET ratio). For the calculation of response amplitudes, the difference between the raw BRET ratio before and 60 s after agonist stimulation was calculated. For presentation and the calculation of off-rate results, the maximal deactivation value reached after the addition of antagonist (plateau signal) was subtracted from the raw BRET ratio of each timepoint (recovery corrected ΔBRET), and each resulting value was scaled to the percentage of the maximal agonist-induced activation value directly before the addition of antagonist (final result “%Max BRET”). Off-rates were determined by plotting the recovery-corrected ΔBRET values for 150 s after the addition of antagonist (starting at 90 s, Y0) and fitting to a one-phase decay model to determine the rate (k), where the plateau is the maximal deactivation value:
Protein sample preparation and Western blotting
Protein from the HEK 293T cells used for the BRET experiments was extracted by pelleting the cells for 1 min at 14,000g and lysing them in 20 mM HEPES, 5 mM Mg(CH3COO)2, 125 mM K(CH3COO), 0.4% Triton X-100, 1 mM DTT, and protease inhibitor mixture (pH 7.2). After clearing the lysates by centrifugation at 14,000g at 4°C for 10 min, the protein concentration was determined using the Bradford assay. Samples were supplemented with Laemmli buffer and boiled for 5 min before being loaded onto SDS-PAGE gels and undergoing transfer to PVDF membranes. Primary antibodies used for Western blotting were against the following targets: α-Tubulin (Sigma #T6074, at a 1:2500 dilution); Gαi3 (Aviva # OAAB19207, 1:1000); Gβ (Santa Cruz Biotechnology, M-14, 1:250); FLAG (Sigma #F1804, 1:1000); HA (Roche clone 12CA5, 1:1000); Myc (Cell Signaling #9B11, 1:1000); Gαq (Santa Cruz Biotechnology, E-17, 1:1000). The Odyssey Infrared Imaging System (Li-Cor Biosciences) was used for detection with AlexaFluor 680– or AlexaFluor 800 IRDye-conjugated secondary antibodies, which were used at a dilution of 1:10,000 for goat anti-rabbit or goat anti-mouse antibodies. Western blots images were processed with ImageJ software (NIH) and assembled for presentation with Adobe Photoshop. Densitometric analysis of Western blot bands corresponding to RGS proteins was performed using Image Studio software (Li-Cor Biosciences).
Supplementary Material
Fig. S1. Distribution of cancer-associated RGS protein mutations inside and outside the RGS-box.
Fig. S2. Distribution of cancer-associated mutations in the RGS-box across different cancer types.
Fig. S3. Comparison of GAP potency across the 17 RGS-box proteins tested in yeast.
Fig. S4. Effects of representative cancer-associated RGS protein mutations on G protein BRET response amplitudes.
Table S1. GAP activities and related features for each of the 49 RGS-box mutants selected for screening in yeast.
Table S2. RGS protein quantification by Western blotting analysis.
Acknowledgments:
We thank K. J. Blumer (Washington University, Saint Louis, MO), M. Cismowski (Nationwide Children’s Hospital, Columbus, OH), M. G. Farquhar (University of California, San Diego, CA), K. Martemyanov (Scripps Research Institute, Jupiter, FL), N. Lambert (Augusta University, Augusta, GA), P. Wedegaertner (Thomas Jefferson University, Philadelphia, PA), J. Blumer (Medical University of South Carolina, Charleston, SC), J. Hepler (Emory University, Atlanta, GA), and J. Sondek (University of North Carolina, Chapel Hill, NC) for providing plasmids, and J. Broach (Penn State University, PA) for providing the CY7967 yeast strain. We thank R. Haddad (DeepBiome Therapeutics Cambridge, MA) for consultation about the appropriateness of statistical methods.
Funding: This work was supported by NIH grants R01GM130120 and R21MH118745 (to M.G.-M.). V.D.G. was supported by a postdoctoral fellowship from the Hartwell Foundation and M.M. was supported by an American Cancer Society-Funding Hope Postdoctoral Fellowship, PF-19-084-01-CDD.
Footnotes
Publisher's Disclaimer: This manuscript has been accepted for publication in Science Signaling. This version has not undergone final editing. Please refer to the complete version of record at http://www.sciencesignaling.org/. The manuscript may not be reproduced or used in any manner that does not fall within the fair use provisions of the Copyright Act without the prior, written permission of AAAS.”
Competing interests: The authors declare that they have no competing interests.
Data and materials availability: All data needed to evaluate the conclusions in the paper are present in the paper or the Supplementary Materials.
REFERENCES AND NOTES
- 1.Marx J, Nobel Prizes. Medicine: a signal award for discovering G proteins. Science (New York, N.Y 266, 368–369 (October 21, 1994). [DOI] [PubMed] [Google Scholar]
- 2.Gilman AG, G proteins: transducers of receptor-generated signals. Annual review of biochemistry 56, 615–649 (1987). [DOI] [PubMed] [Google Scholar]
- 3.Weis WI, Kobilka BK, The Molecular Basis of G Protein-Coupled Receptor Activation. Annual review of biochemistry 87, 897–919 (June 20, 2018). [DOI] [PMC free article] [PubMed] [Google Scholar]
- 4.Sriram K, Insel PA, G Protein-Coupled Receptors as Targets for Approved Drugs: How Many Targets and How Many Drugs? Mol Pharmacol 93, 251–258 (April, 2018). [DOI] [PMC free article] [PubMed] [Google Scholar]
- 5.Hopkins AL, Groom CR, The druggable genome. Nature reviews. Drug discovery 1, 727–730 (September, 2002). [DOI] [PubMed] [Google Scholar]
- 6.Neves SR, Ram PT, Iyengar R, G protein pathways. Science 296, 1636–1639 (May 31, 2002). [DOI] [PubMed] [Google Scholar]
- 7.Dorsam RT, Gutkind JS, G-protein-coupled receptors and cancer. Nature reviews 7, 79–94 (February, 2007). [DOI] [PubMed] [Google Scholar]
- 8.Lyons J, Landis CA, Harsh G, Vallar L, Grunewald K, Feichtinger H, Duh QY, Clark OH, Kawasaki E, Bourne HR, et al. , Two G protein oncogenes in human endocrine tumors. Science 249, 655–659 (August 10, 1990). [DOI] [PubMed] [Google Scholar]
- 9.Landis CA, Masters SB, Spada A, Pace AM, Bourne HR, Vallar L, GTPase inhibiting mutations activate the alpha chain of Gs and stimulate adenylyl cyclase in human pituitary tumours. Nature 340, 692–696 (August 31, 1989). [DOI] [PubMed] [Google Scholar]
- 10.Kalinec G, Nazarali AJ, Hermouet S, Xu N, Gutkind JS, Mutated alpha subunit of the Gq protein induces malignant transformation in NIH 3T3 cells. Molecular and cellular biology 12, 4687–4693 (October, 1992). [DOI] [PMC free article] [PubMed] [Google Scholar]
- 11.Xu N, Voyno-Yasenetskaya T, Gutkind JS, Potent transforming activity of the G13 alpha subunit defines a novel family of oncogenes. Biochemical and biophysical research communications 201, 603–609 (June 15, 1994). [DOI] [PubMed] [Google Scholar]
- 12.Xu N, Bradley L, Ambdukar I, Gutkind JS, A mutant alpha subunit of G12 potentiates the eicosanoid pathway and is highly oncogenic in NIH 3T3 cells. Proceedings of the National Academy of Sciences of the United States of America 90, 6741–6745 (July 15, 1993). [DOI] [PMC free article] [PubMed] [Google Scholar]
- 13.Voyno-Yasenetskaya TA, Pace AM, Bourne HR, Mutant alpha subunits of G12 and G13 proteins induce neoplastic transformation of Rat-1 fibroblasts. Oncogene 9, 2559–2565 (September, 1994). [PubMed] [Google Scholar]
- 14.Wong YH, Chan JS, Yung LY, Bourne HR, Mutant alpha subunit of Gz transforms Swiss 3T3 cells. Oncogene 10, 1927–1933 (May 18, 1995). [PubMed] [Google Scholar]
- 15.Pace AM, Wong YH, Bourne HR, A mutant alpha subunit of Gi2 induces neoplastic transformation of Rat-1 cells. Proceedings of the National Academy of Sciences of the United States of America 88, 7031–7035 (August 15, 1991). [DOI] [PMC free article] [PubMed] [Google Scholar]
- 16.Ram PT, Horvath CM, Iyengar R, Stat3-mediated transformation of NIH-3T3 cells by the constitutively active Q205L Galphao protein. Science 287, 142–144 (January 7, 2000). [DOI] [PubMed] [Google Scholar]
- 17.Gupta SK, Gallego C, Lowndes JM, Pleiman CM, Sable C, Eisfelder BJ, Johnson GL, Analysis of the fibroblast transformation potential of GTPase-deficient gip2 oncogenes. Molecular and cellular biology 12, 190–197 (January, 1992). [DOI] [PMC free article] [PubMed] [Google Scholar]
- 18.O’Hayre M, Vazquez-Prado J, Kufareva I, Stawiski EW, Handel TM, Seshagiri S, Gutkind JS, The emerging mutational landscape of G proteins and G-protein-coupled receptors in cancer. Nature reviews 13, 412–424 (June, 2013). [DOI] [PMC free article] [PubMed] [Google Scholar]
- 19.Kan Z, Jaiswal BS, Stinson J, Janakiraman V, Bhatt D, Stern HM, Yue P, Haverty PM, Bourgon R, Zheng J, Moorhead M, Chaudhuri S, Tomsho LP, Peters BA, Pujara K, Cordes S, Davis DP, Carlton VE, Yuan W, Li L, Wang W, Eigenbrot C, Kaminker JS, Eberhard DA, Waring P, Schuster SC, Modrusan Z, Zhang Z, Stokoe D, de Sauvage FJ, Faham M, Seshagiri S, Diverse somatic mutation patterns and pathway alterations in human cancers. Nature 466, 869–873 (August 12, 2010). [DOI] [PubMed] [Google Scholar]
- 20.Garcia-Marcos M, Ghosh P, Farquhar MG, Molecular basis of a novel oncogenic mutation in GNAO1. Oncogene 30, 2691–2696 (June 9, 2011). [DOI] [PMC free article] [PubMed] [Google Scholar]
- 21.Van Raamsdonk CD, Bezrookove V, Green G, Bauer J, Gaugler L, O’Brien JM, Simpson EM, Barsh GS, Bastian BC, Frequent somatic mutations of GNAQ in uveal melanoma and blue naevi. Nature 457, 599–602 (January 29, 2009). [DOI] [PMC free article] [PubMed] [Google Scholar]
- 22.Van Raamsdonk CD, Griewank KG, Crosby MB, Garrido MC, Vemula S, Wiesner T, Obenauf AC, Wackernagel W, Green G, Bouvier N, Sozen MM, Baimukanova G, Roy R, Heguy A, Dolgalev I, Khanin R, Busam K, Speicher MR, O’Brien J, Bastian BC, Mutations in GNA11 in uveal melanoma. The New England journal of medicine 363, 2191–2199 (December 2, 2010). [DOI] [PMC free article] [PubMed] [Google Scholar]
- 23.Moore AR, Ceraudo E, Sher JJ, Guan Y, Shoushtari AN, Chang MT, Zhang JQ, Walczak EG, Kazmi MA, Taylor BS, Huber T, Chi P, Sakmar TP, Chen Y, Recurrent activating mutations of G-protein-coupled receptor CYSLTR2 in uveal melanoma. Nature genetics 48, 675–680 (June, 2016). [DOI] [PMC free article] [PubMed] [Google Scholar]
- 24.Chua V, Lapadula D, Randolph C, Benovic JL, Wedegaertner PB, Aplin AE, Dysregulated GPCR Signaling and Therapeutic Options in Uveal Melanoma. Molecular cancer research : MCR 15, 501–506 (May, 2017). [DOI] [PMC free article] [PubMed] [Google Scholar]
- 25.Ideno N, Yamaguchi H, Ghosh B, Gupta S, Okumura T, Steffen DJ, Fisher CG, Wood LD, Singhi AD, Nakamura M, Gutkind JS, Maitra A, GNAS(R201C) Induces Pancreatic Cystic Neoplasms in Mice That Express Activated KRAS by Inhibiting YAP1 Signaling. Gastroenterology 155, 1593–1607 e1512 (November, 2018). [DOI] [PMC free article] [PubMed] [Google Scholar]
- 26.Wu J, Matthaei H, Maitra A, Dal Molin M, Wood LD, Eshleman JR, Goggins M, Canto MI, Schulick RD, Edil BH, Wolfgang CL, Klein AP, Diaz LA Jr., Allen PJ, Schmidt CM, Kinzler KW, Papadopoulos N, Hruban RH, Vogelstein B, Recurrent GNAS mutations define an unexpected pathway for pancreatic cyst development. Science translational medicine 3, 92ra66 (July 20, 2011). [DOI] [PMC free article] [PubMed] [Google Scholar]
- 27.Nairismagi ML, Tan J, Lim JQ, Nagarajan S, Ng CC, Rajasegaran V, Huang D, Lim WK, Laurensia Y, Wijaya GC, Li ZM, Cutcutache I, Pang WL, Thangaraju S, Ha J, Khoo LP, Chin ST, Dey S, Poore G, Tan LH, Koh HK, Sabai K, Rao HL, Chuah KL, Ho YH, Ng SB, Chuang SS, Zhang F, Liu YH, Pongpruttipan T, Ko YH, Cheah PL, Karim N, Chng WJ, Tang T, Tao M, Tay K, Farid M, Quek R, Rozen SG, Tan P, Teh BT, Lim ST, Tan SY, Ong CK, JAK-STAT and G-protein-coupled receptor signaling pathways are frequently altered in epitheliotropic intestinal T-cell lymphoma. Leukemia 30, 1311–1319 (June, 2016). [DOI] [PMC free article] [PubMed] [Google Scholar]
- 28.Yoda A, Adelmant G, Tamburini J, Chapuy B, Shindoh N, Yoda Y, Weigert O, Kopp N, Wu SC, Kim SS, Liu H, Tivey T, Christie AL, Elpek KG, Card J, Gritsman K, Gotlib J, Deininger MW, Makishima H, Turley SJ, Javidi-Sharifi N, Maciejewski JP, Jaiswal S, Ebert BL, Rodig SJ, Tyner JW, Marto JA, Weinstock DM, Lane AA, Mutations in G protein beta subunits promote transformation and kinase inhibitor resistance. Nature medicine 21, 71–75 (January, 2015). [DOI] [PMC free article] [PubMed] [Google Scholar]
- 29.Wright SC, Kozielewicz P, Kowalski-Jahn M, Petersen J, Bowin CF, Slodkowicz G, Marti-Solano M, Rodriguez D, Hot B, Okashah N, Strakova K, Valnohova J, Babu MM, Lambert NA, Carlsson J, Schulte G, A conserved molecular switch in Class F receptors regulates receptor activation and pathway selection. Nature communications 10, 667 (February 8, 2019). [DOI] [PMC free article] [PubMed] [Google Scholar]
- 30.O’Hayre M, Inoue A, Kufareva I, Wang Z, Mikelis CM, Drummond RA, Avino S, Finkel K, Kalim KW, DiPasquale G, Guo F, Aoki J, Zheng Y, Lionakis MS, Molinolo AA, Gutkind JS, Inactivating mutations in GNA13 and RHOA in Burkitt’s lymphoma and diffuse large B-cell lymphoma: a tumor suppressor function for the Galpha13/RhoA axis in B cells. Oncogene 35, 3771–3780 (July 21, 2016). [DOI] [PMC free article] [PubMed] [Google Scholar]
- 31.Muppidi JR, Schmitz R, Green JA, Xiao W, Larsen AB, Braun SE, An J, Xu Y, Rosenwald A, Ott G, Gascoyne RD, Rimsza LM, Campo E, Jaffe ES, Delabie J, Smeland EB, Braziel RM, Tubbs RR, Cook JR, Weisenburger DD, Chan WC, Vaidehi N, Staudt LM, Cyster JG, Loss of signalling via Galpha13 in germinal centre B-cell-derived lymphoma. Nature 516, 254–258 (December 11, 2014). [DOI] [PMC free article] [PubMed] [Google Scholar]
- 32.Dohlman HG, Song J, Ma D, Courchesne WE, Thorner J, Sst2, a negative regulator of pheromone signaling in the yeast Saccharomyces cerevisiae: expression, localization, and genetic interaction and physical association with Gpa1 (the G-protein alpha subunit). Molecular and cellular biology 16, 5194–5209 (September, 1996). [DOI] [PMC free article] [PubMed] [Google Scholar]
- 33.Dohlman HG, Apaniesk D, Chen Y, Song J, Nusskern D, Inhibition of G-protein signaling by dominant gain-of-function mutations in Sst2p, a pheromone desensitization factor in Saccharomyces cerevisiae. Molecular and cellular biology 15, 3635–3643 (July, 1995). [DOI] [PMC free article] [PubMed] [Google Scholar]
- 34.Koelle MR, Horvitz HR, EGL-10 regulates G protein signaling in the C. elegans nervous system and shares a conserved domain with many mammalian proteins. Cell 84, 115–125 (January 12, 1996). [DOI] [PubMed] [Google Scholar]
- 35.Druey KM, Blumer KJ, Kang VH, Kehrl JH, Inhibition of G-protein-mediated MAP kinase activation by a new mammalian gene family. Nature 379, 742–746 (February 22, 1996). [DOI] [PubMed] [Google Scholar]
- 36.De Vries L, Elenko E, Hubler L, Jones TL, Farquhar MG, GAIP is membrane-anchored by palmitoylation and interacts with the activated (GTP-bound) form of G alpha i subunits. Proceedings of the National Academy of Sciences of the United States of America 93, 15203–15208 (December 24, 1996). [DOI] [PMC free article] [PubMed] [Google Scholar]
- 37.De Vries L, Mousli M, Wurmser A, Farquhar MG, GAIP, a protein that specifically interacts with the trimeric G protein G alpha i3, is a member of a protein family with a highly conserved core domain. Proceedings of the National Academy of Sciences of the United States of America 92, 11916–11920 (December 5, 1995). [DOI] [PMC free article] [PubMed] [Google Scholar]
- 38.Siderovski DP, Hessel A, Chung S, Mak TW, Tyers M, A new family of regulators of G-protein-coupled receptors? Current biology : CB 6, 211–212 (February 1, 1996). [DOI] [PubMed] [Google Scholar]
- 39.Apanovitch DM, Slep KC, Sigler PB, Dohlman HG, Sst2 is a GTPase-activating protein for Gpa1: purification and characterization of a cognate RGS-Galpha protein pair in yeast. Biochemistry 37, 4815–4822 (April 7, 1998). [DOI] [PubMed] [Google Scholar]
- 40.Watson N, Linder ME, Druey KM, Kehrl JH, Blumer KJ, RGS family members: GTPase-activating proteins for heterotrimeric G-protein alpha-subunits. Nature 383, 172–175 (September 12, 1996). [DOI] [PubMed] [Google Scholar]
- 41.Berman DM, Wilkie TM, Gilman AG, GAIP and RGS4 are GTPase-activating proteins for the Gi subfamily of G protein alpha subunits. Cell 86, 445–452 (August 9, 1996). [DOI] [PubMed] [Google Scholar]
- 42.Tesmer JJ, Berman DM, Gilman AG, Sprang SR, Structure of RGS4 bound to AlF4--activated G(i alpha1): stabilization of the transition state for GTP hydrolysis. Cell 89, 251–261 (April 18, 1997). [DOI] [PubMed] [Google Scholar]
- 43.Soundararajan M, Willard FS, Kimple AJ, Turnbull AP, Ball LJ, Schoch GA, Gileadi C, Fedorov OY, Dowler EF, Higman VA, Hutsell SQ, Sundstrom M, Doyle DA, Siderovski DP, Structural diversity in the RGS domain and its interaction with heterotrimeric G protein alpha-subunits. Proceedings of the National Academy of Sciences of the United States of America 105, 6457–6462 (April 29, 2008). [DOI] [PMC free article] [PubMed] [Google Scholar]
- 44.Squires KE, Montanez-Miranda C, Pandya RR, Torres MP, Hepler JR, Genetic Analysis of Rare Human Variants of Regulators of G Protein Signaling Proteins and Their Role in Human Physiology and Disease. Pharmacological reviews 70, 446–474 (July, 2018). [DOI] [PMC free article] [PubMed] [Google Scholar]
- 45.Hollinger S, Hepler JR, Cellular regulation of RGS proteins: modulators and integrators of G protein signaling. Pharmacological reviews 54, 527–559 (September, 2002). [DOI] [PubMed] [Google Scholar]
- 46.Kimple AJ, Bosch DE, Giguere PM, Siderovski DP, Regulators of G-protein signaling and their Galpha substrates: promises and challenges in their use as drug discovery targets. Pharmacological reviews 63, 728–749 (September, 2011). [DOI] [PMC free article] [PubMed] [Google Scholar]
- 47.Chidiac P, Ross EM, Phospholipase C-beta1 directly accelerates GTP hydrolysis by Galphaq and acceleration is inhibited by Gbeta gamma subunits. The Journal of biological chemistry 274, 19639–19643 (July 9, 1999). [DOI] [PubMed] [Google Scholar]
- 48.Scheschonka A, Dessauer CW, Sinnarajah S, Chidiac P, Shi CS, Kehrl JH, RGS3 is a GTPase-activating protein for g(ialpha) and g(qalpha) and a potent inhibitor of signaling by GTPase-deficient forms of g(qalpha) and g(11alpha). Mol Pharmacol 58, 719–728 (October, 2000). [DOI] [PubMed] [Google Scholar]
- 49.Shirley MD, Tang H, Gallione CJ, Baugher JD, Frelin LP, Cohen B, North PE, Marchuk DA, Comi AM, Pevsner J, Sturge-Weber syndrome and port-wine stains caused by somatic mutation in GNAQ. The New England journal of medicine 368, 1971–1979 (May 23, 2013). [DOI] [PMC free article] [PubMed] [Google Scholar]
- 50.Sethakorn N, Dulin NO, RGS expression in cancer: oncomining the cancer microarray data. Journal of receptor and signal transduction research 33, 166–171 (June, 2013). [DOI] [PubMed] [Google Scholar]
- 51.Cao X, Qin J, Xie Y, Khan O, Dowd F, Scofield M, Lin MF, Tu Y, Regulator of G-protein signaling 2 (RGS2) inhibits androgen-independent activation of androgen receptor in prostate cancer cells. Oncogene 25, 3719–3734 (June 22, 2006). [DOI] [PubMed] [Google Scholar]
- 52.Xie Y, Wolff DW, Wei T, Wang B, Deng C, Kirui JK, Jiang H, Qin J, Abel PW, Tu Y, Breast cancer migration and invasion depend on proteasome degradation of regulator of G-protein signaling 4. Cancer research 69, 5743–5751 (July 15, 2009). [DOI] [PMC free article] [PubMed] [Google Scholar]
- 53.Hooks SB, Callihan P, Altman MK, Hurst JH, Ali MW, Murph MM, Regulators of G-Protein signaling RGS10 and RGS17 regulate chemoresistance in ovarian cancer cells. Molecular cancer 9, 289 (November 2, 2010). [DOI] [PMC free article] [PubMed] [Google Scholar]
- 54.Yang J, Platt LT, Maity B, Ahlers KE, Luo Z, Lin Z, Chakravarti B, Ibeawuchi SR, Askeland RW, Bondaruk J, Czerniak BA, Fisher RA, RGS6 is an essential tumor suppressor that prevents bladder carcinogenesis by promoting p53 activation and DNMT1 downregulation. Oncotarget 7, 69159–69172 (October 25, 2016). [DOI] [PMC free article] [PubMed] [Google Scholar]
- 55.Huang J, Stewart A, Maity B, Hagen J, Fagan RL, Yang J, Quelle DE, Brenner C, Fisher RA, RGS6 suppresses Ras-induced cellular transformation by facilitating Tip60-mediated Dnmt1 degradation and promoting apoptosis. Oncogene 33, 3604–3611 (July 3, 2014). [DOI] [PMC free article] [PubMed] [Google Scholar]
- 56.Maity B, Stewart A, O’Malley Y, Askeland RW, Sugg SL, Fisher RA, Regulator of G protein signaling 6 is a novel suppressor of breast tumor initiation and progression. Carcinogenesis 34, 1747–1755 (August, 2013). [DOI] [PMC free article] [PubMed] [Google Scholar]
- 57.Qutob N, Masuho I, Alon M, Emmanuel R, Cohen I, Di Pizio A, Madore J, Elkahloun A, Ziv T, Levy R, Gartner JJ, Hill VK, Lin JC, Hevroni Y, Greenberg P, Brodezki A, Rosenberg SA, Kosloff M, Hayward NK, Admon A, Niv MY, Scolyer RA, Martemyanov KA, Samuels Y, RGS7 is recurrently mutated in melanoma and promotes migration and invasion of human cancer cells. Scientific reports 8, 653 (January 12, 2018). [DOI] [PMC free article] [PubMed] [Google Scholar]
- 58.James MA, Lu Y, Liu Y, Vikis HG, You M, RGS17, an overexpressed gene in human lung and prostate cancer, induces tumor cell proliferation through the cyclic AMP-PKA-CREB pathway. Cancer research 69, 2108–2116 (March 1, 2009). [DOI] [PMC free article] [PubMed] [Google Scholar]
- 59.Sokolov E, Iannitti DA, Schrum LW, McKillop IH, Altered expression and function of regulator of G-protein signaling-17 (RGS17) in hepatocellular carcinoma. Cellular signalling 23, 1603–1610 (October, 2011). [DOI] [PMC free article] [PubMed] [Google Scholar]
- 60.Yang SH, Li CF, Chu PY, Ko HH, Chen LT, Chen WW, Han CH, Lung JH, Shih NY, Overexpression of regulator of G protein signaling 11 promotes cell migration and associates with advanced stages and aggressiveness of lung adenocarcinoma. Oncotarget 7, 31122–31136 (May 24, 2016). [DOI] [PMC free article] [PubMed] [Google Scholar]
- 61.Li Y, Li L, Lin J, Hu X, Li B, Xue A, Shen Y, Jiang J, Zhang M, Xie J, Zhao Z, Deregulation of RGS17 Expression Promotes Breast Cancer Progression. Journal of Cancer 6, 767–775 (2015). [DOI] [PMC free article] [PubMed] [Google Scholar]
- 62.Heximer SP, Blumer KJ, RGS proteins: Swiss army knives in seven-transmembrane domain receptor signaling networks. Science’s STKE : signal transduction knowledge environment 2007, pe2 (January 23, 2007). [DOI] [PubMed] [Google Scholar]
- 63.Hayes MP, Roman DL, Regulator of G Protein Signaling 17 as a Negative Modulator of GPCR Signaling in Multiple Human Cancers. The AAPS journal 18, 550–559 (May, 2016). [DOI] [PMC free article] [PubMed] [Google Scholar]
- 64.Stewart A, Maity B, Fisher RA, Two for the Price of One: G Protein-Dependent and -Independent Functions of RGS6 In Vivo. Progress in molecular biology and translational science 133, 123–151 (2015). [DOI] [PubMed] [Google Scholar]
- 65.Cerami E, Gao J, Dogrusoz U, Gross BE, Sumer SO, Aksoy BA, Jacobsen A, Byrne CJ, Heuer ML, Larsson E, Antipin Y, Reva B, Goldberg AP, Sander C, Schultz N, The cBio cancer genomics portal: an open platform for exploring multidimensional cancer genomics data. Cancer discovery 2, 401–404 (May, 2012). [DOI] [PMC free article] [PubMed] [Google Scholar]
- 66.Vogelstein B, Papadopoulos N, Velculescu VE, Zhou S, Diaz LA Jr., Kinzler KW, Cancer genome landscapes. Science 339, 1546–1558 (March 29, 2013). [DOI] [PMC free article] [PubMed] [Google Scholar]
- 67.Nance MR, Kreutz B, Tesmer VM, Sterne-Marr R, Kozasa T, Tesmer JJ, Structural and functional analysis of the regulator of G protein signaling 2-galphaq complex. Structure 21, 438–448 (March 5, 2013). [DOI] [PMC free article] [PubMed] [Google Scholar]
- 68.Chen Z, Singer WD, Danesh SM, Sternweis PC, Sprang SR, Recognition of the activated states of Galpha13 by the rgRGS domain of PDZRhoGEF. Structure 16, 1532–1543 (October 8, 2008). [DOI] [PMC free article] [PubMed] [Google Scholar]
- 69.Chen Z, Singer WD, Sternweis PC, Sprang SR, Structure of the p115RhoGEF rgRGS domain-Galpha13/i1 chimera complex suggests convergent evolution of a GTPase activator. Nature structural & molecular biology 12, 191–197 (February, 2005). [DOI] [PubMed] [Google Scholar]
- 70.Chen Z, Singer WD, Wells CD, Sprang SR, Sternweis PC, Mapping the Galpha13 binding interface of the rgRGS domain of p115RhoGEF. The Journal of biological chemistry 278, 9912–9919 (March 14, 2003). [DOI] [PubMed] [Google Scholar]
- 71.Cismowski MJ, Takesono A, Ma C, Lizano JS, Xie X, Fuernkranz H, Lanier SM, Duzic E, Genetic screens in yeast to identify mammalian nonreceptor modulators of G-protein signaling. Nature biotechnology 17, 878–883 (September, 1999). [DOI] [PubMed] [Google Scholar]
- 72.Cismowski MJ, Takesono A, Ma C, Lanier SM, Duzic E, Identification of modulators of mammalian G-protein signaling by functional screens in the yeast Saccharomyces cerevisiae. Methods in enzymology 344, 153–168 (2002). [DOI] [PubMed] [Google Scholar]
- 73.Srinivasa SP, Watson N, Overton MC, Blumer KJ, Mechanism of RGS4, a GTPase-activating protein for G protein alpha subunits. The Journal of biological chemistry 273, 1529–1533 (January 16, 1998). [DOI] [PubMed] [Google Scholar]
- 74.Lek M, Karczewski KJ, Minikel EV, Samocha KE, Banks E, Fennell T, O’Donnell-Luria AH, Ware JS, Hill AJ, Cummings BB, Tukiainen T, Birnbaum DP, Kosmicki JA, Duncan LE, Estrada K, Zhao F, Zou J, Pierce-Hoffman E, Berghout J, Cooper DN, Deflaux N, DePristo M, Do R, Flannick J, Fromer M, Gauthier L, Goldstein J, Gupta N, Howrigan D, Kiezun A, Kurki MI, Moonshine AL, Natarajan P, Orozco L, Peloso GM, Poplin R, Rivas MA, Ruano-Rubio V, Rose SA, Ruderfer DM, Shakir K, Stenson PD, Stevens C, Thomas BP, Tiao G, Tusie-Luna MT, Weisburd B, Won HH, Yu D, Altshuler DM, Ardissino D, Boehnke M, Danesh J, Donnelly S, Elosua R, Florez JC, Gabriel SB, Getz G, Glatt SJ, Hultman CM, Kathiresan S, Laakso M, McCarroll S, McCarthy MI, McGovern D, McPherson R, Neale BM, Palotie A, Purcell SM, Saleheen D, Scharf JM, Sklar P, Sullivan PF, Tuomilehto J, Tsuang MT, Watkins HC, Wilson JG, Daly MJ, MacArthur DG, Analysis of protein-coding genetic variation in 60,706 humans. Nature 536, 285–291 (August 18, 2016). [DOI] [PMC free article] [PubMed] [Google Scholar]
- 75.Hollins B, Kuravi S, Digby GJ, Lambert NA, The c-terminus of GRK3 indicates rapid dissociation of G protein heterotrimers. Cellular signalling 21, 1015–1021 (June, 2009). [DOI] [PMC free article] [PubMed] [Google Scholar]
- 76.Masuho I, Ostrovskaya O, Kramer GM, Jones CD, Xie K, Martemyanov KA, Distinct profiles of functional discrimination among G proteins determine the actions of G protein-coupled receptors. Science signaling 8, ra123 (December 1, 2015). [DOI] [PMC free article] [PubMed] [Google Scholar]
- 77.Masuho I, Xie K, Martemyanov KA, Macromolecular composition dictates receptor and G protein selectivity of regulator of G protein signaling (RGS) 7 and 9–2 protein complexes in living cells. The Journal of biological chemistry 288, 25129–25142 (August 30, 2013). [DOI] [PMC free article] [PubMed] [Google Scholar]
- 78.Lambert NA, Johnston CA, Cappell SD, Kuravi S, Kimple AJ, Willard FS, Siderovski DP, Regulators of G-protein signaling accelerate GPCR signaling kinetics and govern sensitivity solely by accelerating GTPase activity. Proceedings of the National Academy of Sciences of the United States of America 107, 7066–7071 (April 13, 2010). [DOI] [PMC free article] [PubMed] [Google Scholar]
- 79.Brown NE, Lambert NA, Hepler JR, RGS14 regulates the lifetime of Galpha-GTP signaling but does not prolong Gbetagamma signaling following receptor activation in live cells. Pharmacol Res Perspect 4, e00249 (October, 2016). [DOI] [PMC free article] [PubMed] [Google Scholar]
- 80.Kosloff M, Travis AM, Bosch DE, Siderovski DP, Arshavsky VY, Integrating energy calculations with functional assays to decipher the specificity of G protein-RGS protein interactions. Nature structural & molecular biology 18, 846–853 (June 19, 2011). [DOI] [PMC free article] [PubMed] [Google Scholar]
- 81.Asli A, Sadiya I, Avital-Shacham M, Kosloff M, “Disruptor” residues in the regulator of G protein signaling (RGS) R12 subfamily attenuate the inactivation of Galpha subunits. Science signaling 11, (June 12, 2018). [DOI] [PubMed] [Google Scholar]
- 82.Neubig RR, And the winner is … RGS4! Circulation research 103, 444–446 (August 29, 2008). [DOI] [PMC free article] [PubMed] [Google Scholar]
- 83.Sjogren B, The evolution of regulators of G protein signalling proteins as drug targets - 20 years in the making: IUPHAR Review 21. British journal of pharmacology 174, 427–437 (March, 2017). [DOI] [PMC free article] [PubMed] [Google Scholar]
- 84.Ghosh P, Garcia-Marcos M, Bornheimer SJ, Farquhar MG, Activation of Galphai3 triggers cell migration via regulation of GIV. The Journal of cell biology 182, 381–393 (July 28, 2008). [DOI] [PMC free article] [PubMed] [Google Scholar]
- 85.Wedegaertner PB, Chu DH, Wilson PT, Levis MJ, Bourne HR, Palmitoylation is required for signaling functions and membrane attachment of Gq alpha and Gs alpha. The Journal of biological chemistry 268, 25001–25008 (November 25, 1993). [PubMed] [Google Scholar]
- 86.Lanier SM, Downing S, Duzic E, Homcy CJ, Isolation of rat genomic clones encoding subtypes of the alpha 2-adrenergic receptor. Identification of a unique receptor subtype. The Journal of biological chemistry 266, 10470–10478 (June 5, 1991). [PubMed] [Google Scholar]
- 87.Stols L, Gu M, Dieckman L, Raffen R, Collart FR, Donnelly MI, A new vector for high-throughput, ligation-independent cloning encoding a tobacco etch virus protease cleavage site. Protein expression and purification 25, 8–15 (June, 2002). [DOI] [PubMed] [Google Scholar]
- 88.Shu FJ, Ramineni S, Amyot W, Hepler JR, Selective interactions between Gi alpha1 and Gi alpha3 and the GoLoco/GPR domain of RGS14 influence its dynamic subcellular localization. Cellular signalling 19, 163–176 (January, 2007). [DOI] [PubMed] [Google Scholar]
- 89.Cabrita LD, Dai W, Bottomley SP, A family of E coli expression vectors for laboratory scale and high throughput soluble protein production. BMC biotechnology 6, 12 (March 1, 2006). [DOI] [PMC free article] [PubMed] [Google Scholar]
- 90.Adzhubei IA, Schmidt S, Peshkin L, Ramensky VE, Gerasimova A, Bork P, Kondrashov AS, Sunyaev SR, A method and server for predicting damaging missense mutations. Nature methods 7, 248–249 (April, 2010). [DOI] [PMC free article] [PubMed] [Google Scholar]
- 91.Sim NL, Kumar P, Hu J, Henikoff S, Schneider G, Ng PC, SIFT web server: predicting effects of amino acid substitutions on proteins. Nucleic Acids Res 40, W452–457 (July, 2012). [DOI] [PMC free article] [PubMed] [Google Scholar]
- 92.Smedley D, Haider S, Durinck S, Pandini L, Provero P, Allen J, Arnaiz O, Awedh MH, Baldock R, Barbiera G, Bardou P, Beck T, Blake A, Bonierbale M, Brookes AJ, Bucci G, Buetti I, Burge S, Cabau C, Carlson JW, Chelala C, Chrysostomou C, Cittaro D, Collin O, Cordova R, Cutts RJ, Dassi E, Di Genova A, Djari A, Esposito A, Estrella H, Eyras E, Fernandez-Banet J, Forbes S, Free RC, Fujisawa T, Gadaleta E, Garcia-Manteiga JM, Goodstein D, Gray K, Guerra-Assuncao JA, Haggarty B, Han DJ, Han BW, Harris T, Harshbarger J, Hastings RK, Hayes RD, Hoede C, Hu S, Hu ZL, Hutchins L, Kan Z, Kawaji H, Keliet A, Kerhornou A, Kim S, Kinsella R, Klopp C, Kong L, Lawson D, Lazarevic D, Lee JH, Letellier T, Li CY, Lio P, Liu CJ, Luo J, Maass A, Mariette J, Maurel T, Merella S, Mohamed AM, Moreews F, Nabihoudine I, Ndegwa N, Noirot C, Perez-Llamas C, Primig M, Quattrone A, Quesneville H, Rambaldi D, Reecy J, Riba M, Rosanoff S, Saddiq AA, Salas E, Sallou O, Shepherd R, Simon R, Sperling L, Spooner W, Staines DM, Steinbach D, Stone K, Stupka E, Teague JW, Dayem Ullah AZ, Wang J, Ware D, Wong-Erasmus M, Youens-Clark K, Zadissa A, Zhang SJ, Kasprzyk A, The BioMart community portal: an innovative alternative to large, centralized data repositories. Nucleic Acids Res 43, W589–598 (July 1, 2015). [DOI] [PMC free article] [PubMed] [Google Scholar]
- 93.Krissinel E, Henrick K, Inference of macromolecular assemblies from crystalline state. J Mol Biol 372, 774–797 (September 21, 2007). [DOI] [PubMed] [Google Scholar]
- 94.Maziarz M, Broselid S, DiGiacomo V, Park JC, Luebbers A, Garcia-Navarrete L, Blanco-Canosa JB, Baillie GS, Garcia-Marcos M, A biochemical and genetic discovery pipeline identifies PLCdelta4b as a nonreceptor activator of heterotrimeric G-proteins. The Journal of biological chemistry 293, 16964–16983 (November 2, 2018). [DOI] [PMC free article] [PubMed] [Google Scholar]
- 95.Maziarz M, Garcia-Marcos M, Rapid kinetic BRET measurements to monitor G protein activation by GPCR and non-GPCR proteins. Methods Cell Biol 142, 145–157 (2017). [DOI] [PMC free article] [PubMed] [Google Scholar]
Associated Data
This section collects any data citations, data availability statements, or supplementary materials included in this article.
Supplementary Materials
Fig. S1. Distribution of cancer-associated RGS protein mutations inside and outside the RGS-box.
Fig. S2. Distribution of cancer-associated mutations in the RGS-box across different cancer types.
Fig. S3. Comparison of GAP potency across the 17 RGS-box proteins tested in yeast.
Fig. S4. Effects of representative cancer-associated RGS protein mutations on G protein BRET response amplitudes.
Table S1. GAP activities and related features for each of the 49 RGS-box mutants selected for screening in yeast.
Table S2. RGS protein quantification by Western blotting analysis.