

Abstract
TAZ promotes growth, development and tumorigenesis by regulating the expression of target genes. However, the manner in which TAZ orchestrates the transcriptional responses is poorly defined. Here we demonstrate that TAZ forms nuclear condensates through liquid–liquid phase separation to compartmentalize its DNA-binding cofactor TEAD4, coactivators BRD4 and MED1, and the transcription elongation factor CDK9 for transcription. TAZ forms phase-separated droplets in vitro and liquid-like nuclear condensates in vivo, and this ability is negatively regulated by Hippo signalling through LATS-mediated phosphorylation and is mediated by the coiled-coil (CC) domain. Deletion of the TAZ CC domain or substitution with the YAP CC domain prevents the phase separation of TAZ and its ability to induce the expression of TAZ-specific target genes. Thus, we identify a mechanism of transcriptional activation by TAZ and demonstrate that pathway-specific transcription factors also engage the phase-separation mechanism for efficient and specific transcriptional activation.
The Hippo pathway is an evolutionarily conserved pathway that regulates cell proliferation, tissue homeostasis, organ size and tumorigenesis1–4. At the centre of this pathway is a kinase core that consists of the MST1 or MST2, LATS1 or LATS2 kinases, as well as two accessory molecules, SAV1 and MOB1 (refs. 5,6). A variety of signals derived from cell–cell contact, cell polarity, mechanotransduction, cellular stress and metabolism activate the MST1/2 and LATS1/2 kinases. In turn, the activated LATS1/2 phosphorylates the key transcription effectors TAZ and YAP, leading to the increased cytoplasmic localization and subsequent inhibition of their transcription activity of TAZ and YAP7–10. Once Hippo signalling is inactivated, TAZ and YAP accumulate in the nucleus and bind to the DNA-binding cofactor TEAD as well as transcriptional coactivators BRD4 and MED1 (refs. 11,12). Through these interactions, YAP and TAZ recruit these coactivators in addition to the transcription elongation complex to stimulate gene expression11,13. In normal tissues, the intact tissue architecture and cell–cell adhesion activate Hippo signalling to repress the activity of TAZ and YAP. In cancer in humans, in which tissue architecture is disrupted, the expression of TAZ and YAP is increased. In particular, TAZ is upregulated in more than 20% of breast cancer tissues14, and these high levels of TAZ correlate with increased invasiveness and poorer outcomes for patients15. Furthermore, overexpression of TAZ, especially the constitutively active TAZS89A, which is resistant to inhibition by LATS1/2, promotes the expansion of cancer stem cell population and tumour invasion15.
TAZ and YAP are paralogues with similar domain structures, partially overlapping functions16 and are similarly regulated by Hippo kinases. Furthermore, YAP and TAZ double-knockout (KO) mice display a more severe phenotype than either of the single-KO mice17,18, suggesting that there are some functional overlaps. However, YAP and TAZ are not redundant—TAZ KO mice are viable with defects in the kidney and lung, whereas YAP KO in mice is embryonically lethal with severe developmental defects19,20. These functional differences might arise from differential expression, localization and downstream target genes. TAZ and YAP both contain a TEAD-binding (TB) domain, a WW domain(s), a coiled-coil (CC) domain and a transcription activation (TA) domain, and can bind to the same transcription factors, including TEAD and Runx21,22. However, there are important differences in the sequences within these domains that enable them to bind to different transcription factors (for example, PPARγ and Pax3 for TAZ; ErbB4 and p73 for YAP)23 and activate different target genes16. Although several mechanisms have been proposed to mediate transcriptional activation by both YAP or TAZ11,12, the molecular mechanism that underlies the functional differences between the two has not been well defined.
Here we report that TAZ, but not YAP, forms liquid-like biomolecular condensates that compartmentalize and concentrate transcription coactivators and elongation machinery. The assembly of dynamic membraneless compartments through liquid–liquid phase separation (LLPS) is essential for temporal and spatial control of numerous biochemical processes. These LLPS condensates may function as scaffolds to concentrate proteins with similar functions, to insulate protein complexes that act in different signalling pathways to generate specificity, or to sequester proteins to facilitate or prevent inactivation. As such, these LLPS condensates are vital for many physiological processes, and their disruption may be associated with many pathological conditions24. Proteins that tend to undergo LLPS often contain intrinsically disordered regions (IDRs) or are involved in weak multivalent protein–protein or protein–RNA interactions. Other factors, such as temperature, pH, salt and protein concentrations, also influence the ability of proteins to undergo LLPS, and post-translational modifications can further regulate the ability of proteins to move in or out of these condensates, providing switch-like control.
Recently, LLPS has been shown to have a critical role in transcriptional control. The FET (FUS, EWS and TAF15) family of sequence-specific transcription factors, the transcription elongation factor P-TEFb as well as the super enhancers MED1 and BRD4 all form LLPS condensates to activate gene expression13,25,26. Given that TAZ and YAP can interact with the transcription elongation factors and function at the super enhancers together with BRD4 and MED1 (refs. 11,12), we investigated whether TAZ and YAP also form LLPS condensates. We found that, in the absence of crowding agents, TAZ, but not YAP, undergoes LLPS through its CC domain, and these TAZ LLPS structures compartmentalize transcriptional cofactors and transcription elongation machinery to facilitate TAZ-specific gene expression. Thus, we identified a phase-separation mechanism that distinguishes between TAZ and YAP to efficiently engage the transcriptional machinery for specific expression of target genes.
Results
TAZ undergoes phase separation in vitro and in vivo.
The full-length TAZ protein appears to be largely unfolded27 and contains many IDRs (Fig. 1a, top) as well as several domains that are important for interactions with other proteins2,28. Given that proteins with extensive IDRs that are also involved in multivalent protein interactions tend to undergo LLPS29,30, we investigated whether TAZ has the ability to undergo phase separation. Purified GFP–TAZ (Extended Data Fig. 1a) spontaneously formed microsized droplets in solutions (Fig. 1b), and the droplets were larger and more numerous at higher protein and salt concentrations and high temperatures (Fig. 1b–d), suggesting that hydrophobic interactions, rather than electrostatic interactions, are involved in this process. Consistent with this, droplet formation was substantially inhibited by 5% 1,6-hexanediol—a compound that putatively disrupts weak hydrophobic interactions (Fig. 1e)—and was completely abolished by treatment with heat or proteinase K (Extended Data Fig. 1b).
Fig. 1 |. TAZ undergoes LLPS in vitro and in vivo.

a, Domain structure and the intrinsically disordered tendency of TAZ (top) and YAp (bottom). IUpred assigned scores of disordered tendencies between 0 and 1 to the sequences (a score of more than 0.5 indicates disordered). b, GFp–TAZ and GFp–YAp were analysed for the formation of droplets at room temperature and 500 mM NaCl. c,d, GFp–TAZ or GFp–YAp (50 μM) was analysed using droplet-formation assays at room temperature with the indicated concentrations of NaCl (c) or at 4 °C or 37 °C with 150 mM NaCl (d). Temp, temperature. e, 1,6-hexanediol (Hex; 5%) disrupted droplet formation. GFp–TAZ (50 μM) was analysed at room temperature and with 500 mM NaCl with or without 5% Hex. For b–e, representative fluorescence and differential interference contrast (DIC) images of the droplets (left) and quantification of the size and number of droplets (right) are shown. Each dot represents a droplet. Data are mean ± s.e.m. Droplets in n = 3 fields (166 × 124 μm2) in each group were quantified. f, GFp–TAZ formed nuclear puncta in MCF-10A cells. Cells transfected with GFp–TAZ or GFp–YAp were treated with or without 5% Hex for 1 min and imaged. Nuclei were stained with 4,6-diamidino-2-phenylindole (DApI; blue). Inset: an enlarged view of the nuclear puncta magnified by 3.07, 3.47 and 2.96 times, respectively. Quantification of the percentage of cells that displayed nuclear puncta is shown on the right. Data are mean ± s.e.m.; 80 transfected cells in each group were quantified; n = 3 biologically independent samples. g, Endogenous TAZ showed nuclear puncta in the indicated cells. TAZ was stained with anti-TAZ antibodies (green). Insets, magnification by 2.56 and 3.04 times, respectively. h, TAZ formed nuclear puncta in tissues. The human breast cancer tissue array was stained with anti-TAZ antibodies (green), and representative images are shown. Insets, magnification by 13.34, 10.00 and 8.88 times, respectively. The experiments shown in b–g were repeated independently three times with similar results. The experiments shown in h were repeated independently twice with similar results. Source data are available online. For b–h, scale bars, 10 μm.
To test whether TAZ also undergoes LLPS in intact cells and tissues, we ectopically expressed GFP–TAZ in MCF-10A cells at a lower level than that of endogenous TAZ (Extended Data Fig. 1c) and found that GFP–TAZ formed discrete puncta in the nucleus, which could be disrupted by 5% 1,6-hexanediol (Fig. 1f). Ectopically expressed Flag–TAZ also formed nuclear puncta, excluding the possibility that the puncta were artificially formed by the GFP tag (Extended Data Fig. 1d). Importantly, endogenous TAZ also exhibited formation of nuclear puncta in both MCF-10A and HeLa cells (Fig. 1g). We also examined TAZ localization in a tissue array containing 27 normal breast samples and 294 invasive breast carcinoma samples. Compared with normal breast tissue samples, in which TAZ was expressed mainly in the cytoplasm at low levels, invasive breast cancer tissue samples showed significantly upregulated expression of TAZ that was localized in discrete nuclear puncta (Fig. 1h). Thus, TAZ forms phase-separated puncta in intact cells and breast cancer tissue samples.
YAP differs from TAZ in its ability to undergo LLPS.
YAP is a paralogue of TAZ with extensive sequence similarities, including extensive IDRs (Fig. 1a, bottom). Interestingly, under the same experimental conditions as described for TAZ, YAP failed to form droplets in vitro over a wide range of protein and salt concentrations and temperatures (Fig. 1b–d, Extended Data Fig. 2a–d). YAP1–2α, an isoform of YAP1 that contains two WW domains also failed to form droplets in vitro (Extended Data Fig. 2e). Only in the presence of specific crowding agents such as PEG-8000, Ficoll or Dextran—but not glycerol, sucrose or bovine serum albumin—did YAP form droplets (Extended Data Fig. 2f,g). This is consistent with a recent paper that suggested that YAP can phase separate in the presence of PEG-8000 (ref. 31). Ectopically expressed GFP–YAP did not form nuclear puncta in all of the cell lines tested in the absence of crowding agents (Fig. 1f, Extended Data Fig. 2h). Thus, YAP differs from TAZ in its ability to undergo LLPS.
TAZ puncta exhibit liquid-like properties.
A spherical shape, an ability to fuse and recovery from photobleaching are some of the features of a liquid-like phase-separated structure29,30. Live-cell imaging showed that the TAZ nuclear condensates readily fused into larger structures over time (Fig. 2a). Fluorescence recovery after photobleaching (FRAP) beam-size analysis32, using ×63 and ×40 objectives to generate two Gaussian laser beam sizes, was performed to examine the biophysical properties of the GFP–TAZ condensates32. If FRAP occurs by diffusion, τ (the characteristic fluorescence recovery time) is proportional to the bleached area (τD = ω2/4D where τD is the characteristic diffusion time, D the lateral diffusion coefficient and ω is the Gaussian radius of the laser beam). Thus, for recovery by lateral diffusion, the ratio between the τ values obtained with the two objectives, τ(×40)/τ(×63), should equal the ratio between the bleached areas (2.28)33. If FRAP occurs by exchange with free fluorescent proteins, τ reflects the chemical relaxation time, which is independent of the bleached area, that is τ(×40)/τ(×63) = 1 (refs. 32,34). Analysis of GFP–TAZ condensates with a diameter of ~3 μm showed that the τ(×40)/τ(×63) ratio (2.23) is similar to that expected for recovery by lateral diffusion33 (Fig. 2b–e). A similar value is expected for 3D diffusion in FRAP experiments involving fluorescence collection from a restricted confocal plane35. The calculated lateral diffusion coefficient (D) yields 0.11 ± 0.01 μm2 s−1, which is in line with that of the RNA-binding protein hnRNPA1 (4.2 s recovery time, with high recovery)36 and an RNA helicase (2.5 s, 80% recovery, with D of ~0.3 μm2 s−1)37 in nuclear LLPS droplets. By contrast, GFP–TAZ in the cytoplasm displays a much faster diffusion, with D = 1.5 μm2 s−1 (Fig. 2d). Notably, bleaching whole, small GFP–TAZ organelles in the nuclei (diameter of ~1.2 μm, using the ×40 objective) yielded τ of about 2.8 s with a mobile fraction of above 70% (Fig. 2g–j) and D = 0.12 μm2 s−1, in line with the results obtained on large organelles and with the reported recovery rates of RNA-binding proteins after bleaching whole droplets36. These data suggest that TAZ is highly dynamic, with rapid diffusion of molecules within the condensates as well as between the condensates and the surrounding nuclear contents, and that the TAZ nuclear condensates represent a separate liquid phase that is formed through LLPS.
Fig. 2 |. TAZ nuclear condensates display liquid-like properties.

a, Live-cell imaging of MCF-10A cells expressing GFp–TAZ. The arrows indicate representative TAZ puncta that fused over time. This assay was performed three times (three independent transfections) with similar results. b,c, Typical FrAp curves with ×40 (b) or ×63 (c) objectives in organelles larger than the laser beam. The solid lines are a nonlinear regression best fit to the diffusion equation. d,e, Average values for the FrAp data shown in b and c. Data are mean ± s.e.m. of GFp–TAZ in the cytoplasm (n = 45 independent measurements) or nuclear puncta (n = 40 independent measurements). f, FrAp beam-size bootstrap analysis. The studies used ×40 and ×63 objectives, the beam size measurements of which (n = 59 independent measurements) yielded a ω2(×40)/ω2(×63) ratio of 2.28 ± 0.05. A similar ratio for τ(×40)/τ(×63) is expected for FrAp by lateral diffusion, whereas a τ ratio of 1 indicates recovery by exchange. The s.e.m. values of the τ ratios were calculated from the τ values shown in d, nuclear organelle (n = 40 for each objective), using bootstrap analysis (1,000 bootstrap resampling values). The τ(×40)/τ(×63) ratio (2.26) of GFp–TAZ in the large organelles is similar to the 2.28 beam size ratio (P = 0.44, Student’s two-tailed t-test), in line with FrAp by diffusion. Calculating D from the τ values yields D = 0.11 ± 0.01 μm2 s−1, with Rf = 0.65–0.75. τ of GFp–TAZ in the cytoplasm (d), measured using a ×40 objective, is more than tenfold smaller (faster diffusion, D = 1.5 ± 0.07 μm2 s−1). g, A fluorescence image of GFp–TAZ organelles in the nuclei (arrow) processed for whole-organelle bleach (150 ms) using a ×40 objective. The assay was repeated 40 times with similar images obtained. Scale bar, 10 μm. h, A typical FrAp curve of bleaching a whole small organelle. i,j, Average values (τ in i, mobile fraction in j) of FrAp (×40 objective) of whole organelles with a diameter of ~1.2 μm. Data are mean ± s.e.m. of n = 52 independent experiments. The τ and Rf values were very similar to those obtained by bleaching a spot on a large organelle (compare with d and e). On the basis of the estimated organelle diameter, the D value from these experiments is 0.12 μm2 s−1. Source data are available online.
The CC domain is necessary for TAZ LLPS.
To identify the domains in TAZ that are required for phase separation, mutant GFP–TAZ with deletion of the TB, WW or CC domain individually, or the WW and the CC domains together (ΔWW+ΔCC) was purified (Extended Data Fig. 3a,b) and analysed using droplet-formation assays in vitro. Whereas the removal of the TB domain had little effects on TAZ LLPS, deletion of the WW or CC domain considerably reduced, but did not eliminate, droplet formation. Interestingly, deletion of both WW and CC domains abolished TAZ LLPS (Fig. 3a). Consistent with these results, deletion of the CC or WW domain individually substantially reduced LLPS and deletion of both abolished LLPS in cells (Fig. 3b, Extended Data Fig. 3c). Thus, the CC domain and—to a lesser extent—the WW domain are required for TAZ phase separation.
Fig. 3 |. The WW domain and CC domain are required for TAZ LLPS.
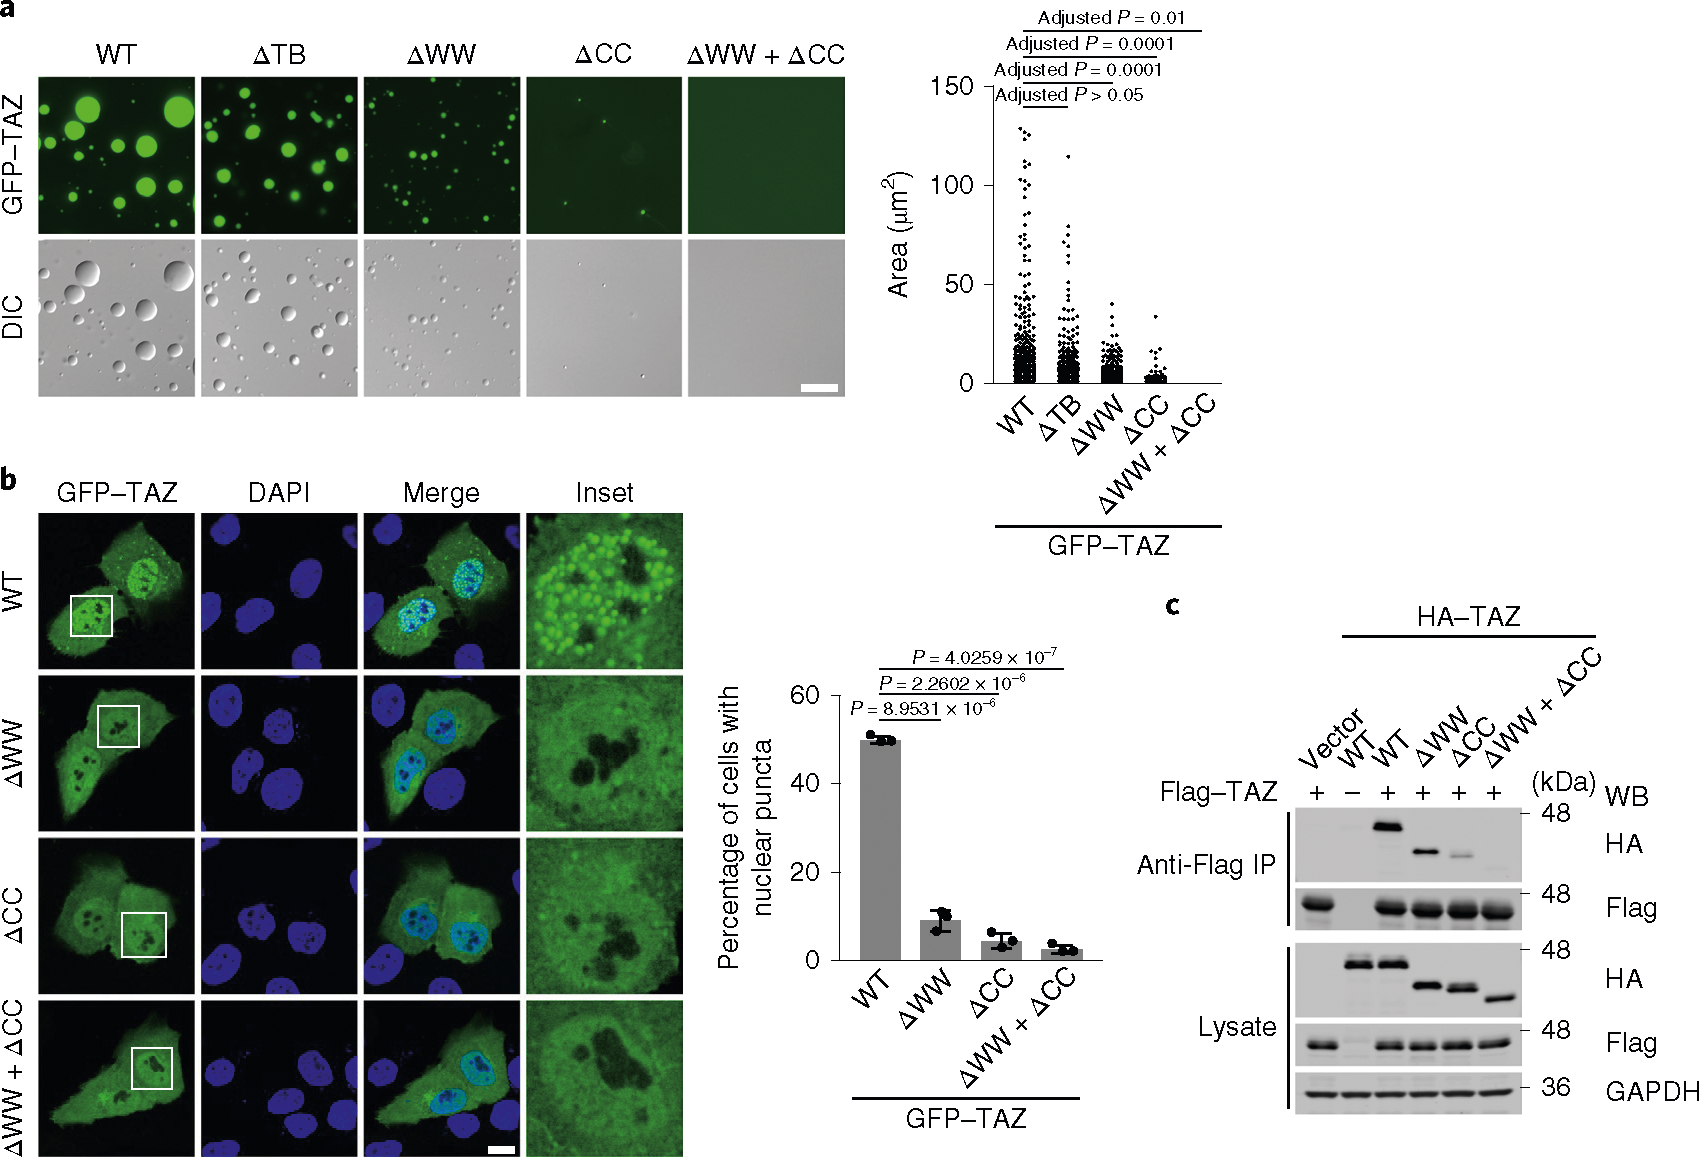
a, GFp–TAZ (WT), ΔTB, ΔWW, ΔCC and ΔWW+ΔCC proteins (50 μM) were analysed using droplet-formation assays at room temperature in the presence of 500 mM NaCl. right, quantification of the droplets. Scale bar, 10 μm. Data are mean ± s.e.m. Statistical significance was evaluated using one-way ANOVA with Krusk–Wallis test. Droplets in n = 3 fields in each group were quantified. b, Confocal microscopy images of MCF-10A cells transfected with GFP–TAZ and various mutants (left). Scale bar, 10 μm. right, quantification of the percentage of cells that showed nuclear puncta. Insets, magnification by 3.84, 3.84, 3.57 and 3.84 times, respectively. Data are mean ± s.e.m. P values were determined using unpaired two-tailed Student’s t-tests; 80 transfected cells in each group were quantified; n = 3 biologically independent samples. c, HA-tagged WT or mutant TAZ was cotransfected into HEK293T cells together with Flag–TAZ. Dimerization of TAZ was analysed by immunoprecipitation (Ip) with anti-Flag antibodies and detected using western blotting (WB) with anti-HA antibodies (top). The abundance of these proteins in the cell lysates was assessed using western blotting (bottom). GApDH was used as a loading control. The experiments in a–c were repeated independently three times with similar results. Source data are available online.
The CC domain distinguishes TAZ from YAP in their ability to undergo LLPS.
Taking advantage of the difference in the ability of YAP and TAZ to undergo LLPS, we generated TAZ–YAP chimeric proteins in which the WW or CC domain of TAZ were swapped—either individually or together—with the WW or CC domains of YAP (Fig. 4a). In the in vitro droplet-formation assays (Fig. 4b,c), full-length TAZ and chimeric TAZ containing the YAP WW domain (WWY) readily formed droplets; by contrast, TAZ chimaeras containing the YAP CC domain (CCY) or the YAP WW and CC domains (WWY+CCY) failed to do so (Fig. 4c). Similarly, TAZ chimaeras that contained either the YAP CC domain alone or the YAP CC and WW domains did not form nuclear puncta in cells, but TAZ chimaeras that contained the YAP WW domain readily formed puncta, similar to wild-type TAZ (Fig. 4d, Extended Data Fig. 3d). The CC domain therefore distinguishes between TAZ and YAP in their ability to undergo LLPS. Interestingly, TAZ, but not YAP, could effectively homodimerize in vivo (Figs. 3c and 4e) and in vitro (Extended Data Fig. 3e) through its CC domain. Deletion of the TAZ CC domain (Fig. 3c) or substituting it with the CC domain of YAP (Fig. 4e) impaired this oligomerization substantially. This differential ability to engage in homo-oligomerization between TAZ and YAP may contribute to their difference in LLPS.
Fig. 4 |. The differential ability of TAZ and YAP to undergo phase separation lies in the CC domain.

a, Domain structure of TAZ chimaeras. b, Coomassie blue staining of various recombinant proteins purified from Escherichia coli. c, Droplet formation by TAZ chimaeras using the same conditions as described in Fig. 3a. Scale bar, 10 μm. Quantification of the droplets is shown on the right. Data are mean ± s.e.m. Statistical significance was evaluated using one-way ANOVA with Krusk–Wallis test. Droplets in n = 3 fields in each group were quantified. d, Confocal microscopy images of MCF-10A cells transfected with various chimaeras as indicated. Scale bar, 10 μm. Insets, magnified by 2.94, 2.94, 2.94 and 3.12 times, respectively. right, quantification of the percentage of cells that displayed nuclear puncta. Data are mean ± s.e.m. P values were determined using unpaired two-tailed Student’s t-tests; 80 transfected cells in each group were quantified; n = 3 biologically independent samples. e, Flag-tagged WT TAZ or YAP was cotransfected into HEK293T cells together with HA-tagged TAZ mutants or YAP as indicated. Dimerization of TAZ or YAp was evaluated using immunoprecipitation with anti-Flag antibodies and detected using western blotting with anti-HA antibodies (top). The abundance of these proteins in the cell lysates was assessed using western blotting (bottom). GApDH was used as a loading control. The experiments in b–e were repeated independently three times with similar results. Source data are available online.
Notably, we found that the TAZ WW domain also bound to TAZ itself, probably through the N-terminal regions (Extended Data Fig. 3e), and this could further enhance the multivalent interactions that are required for effective LLPS. This is why both the CC and WW domains are necessary for LLPS. In light of these data, we generated YAP chimeric proteins containing the TAZ WW and CC domains either individually or together (Extended Data Fig. 4a). In contrast to WT YAP, these chimeric proteins showed a substantially increased ability to phase separate in the presence of PEG (Extended Data Fig 4c–e) but could not undergo LLPS without PEG (Extended Data Fig. 4b), suggesting that, although the TAZ CC and WW domains are necessary for LLPS, they are not sufficient.
TAZ phase separation is negatively regulated by Hippo signalling and LATS1/2.
To examine whether the TAZ LLPS is regulated by Hippo signalling, we treated the MCF10A (Fig. 5) or HeLa (Extended Data Fig. 5) cells with serum, lysophosphatidic acid (LPA), EGF38 or fibronectin39, or altered cell density, matrix stiffness or the actin cytoskeleton. After serum starvation, TAZ was diffusely localized in the cytoplasm, as described previously40,41. The addition of serum or LPA or EGF led to the accumulation of TAZ in the nucleus and, in particular, in the nuclear puncta (Fig. 5a,b, Extended Data Fig. 5a). At high cell density, TAZ was largely cytoplasmic or degraded2,40, whereas, at low cell density, the stabilized TAZ was enriched in the nucleus and clearly formed nuclear condensates (Fig. 5c). Fibronectin also promoted TAZ localization in the nuclear puncta (Fig. 5d, Extended Data Fig. 5b). Furthermore, at high stiffness, TAZ accumulated in the nucleus and formed LLPS; by contrast, at low stiffness, TAZ was degraded (Fig. 5e, Extended Data Fig. 5c). Consistent with the notion that the actin cytoskeleton is essential for the regulation of TAZ and YAP by these mechanical and biochemical cues6,42, disruption of the actin cytoskeleton by latrunculin B effectively blocked TAZ LLPS (Fig. 5f, Extended Data Fig. 5d). Thus, TAZ LLPS is inhibited by Hippo signalling and is sensitive to mechanical cues.
Fig. 5 |. Hippo signalling negatively regulates TAZ phase separation.

a,b, MCF-10A cells were serum-starved for 16 h, treated with 10% FBS (a) or 1 μM LpA or 50 ng ml−1 EGF (b) for 1 h and then analysed using immunostaining with anti-TAZ (green) antibodies. For a and b, scale bars, 10 μm. Insets, magnification by 4.70 (a) and 3.07 (b) times. c, MCF-10A cells cultured at low or high density were analysed using immunostaining with anti-TAZ antibodies (green). Scale bar, 10 μm. Insets magnification by 4.48 and 5.83 times, respectively. d, Serum-starved MCF-10A cells were seeded on fibronectin-coated coverslips for 10 min and 2 h in serum-free medium and were then analysed using immunostaining with anti-TAZ antibodies (green) and Alexa-Fluor-555-conjugated phalloidin (red) for F-actin. Scale bar, 10 μm. Insets, magnification by 4.00 and 3.07 times, respectively. e, MCF-10A cells grown on fibronectin-coated polyacrylamide hydrogels with a stiffness of 1 kpa and 40 kpa were analysed using immunostaining with anti-TAZ antibodies (green) and Alexa-Fluor-555-conjugated phalloidin (red) for F-actin. Scale bar, 10 μm. Insets, magnification by 3.33 times. f, MCF-10A cells treated with 1 μg ml−1 latrunculin B (LatB) for 1 h were analysed using immunostaining with anti-TAZ antibodies (green) and Alexa-Fluor-555-conjugated phalloidin (red) for F-actin. Scale bar, 10 μm. Insets, magnification by 4.00 times. The experiments shown in a–f were repeated independently three times with similar results.
Ectopic expression of LATS2 either alone or together with MST2 inhibited TAZ LLPS, whereas the kinase-inactive LATS2KD failed to block this process (Fig. 6a), suggesting that phosphorylation of TAZ by LATS2 prevented LLPS. Consistent with this, knocking down LATS1 and LATS2 in cells in a high-density culture promoted TAZ LLPS (Fig. 6b). Furthermore, LATS2-expressing cells that were treated with the proteasome inhibitor MG132 retained most of the TAZ in the nucleus, but the phosphorylated TAZ did not form nuclear puncta (Fig. 6a), indicating that the lack of LLPS was not due to the degradation and nuclear export of phosphorylated TAZ. Ectopic expression of NDR1 or NDR2—two Ser–Thr kinases of the NDR/LATS family that also phosphorylate TAZ43—also impaired the ability of TAZ to undergo LLPS (Fig. 6c). Finally, when GFP–TAZ was phosphorylated by LATS2 in an in vitro kinase assay, it exhibited a greatly reduced ability to form droplets in vitro (Fig. 6d). Moreover, the TAZS89A mutant, which is resistant to LATS2 phosphorylation, displayed moderately enhanced formation of condensates compared with wild-type TAZ (Fig. 6e). This mutant also exhibited cytoplasmic puncta that colocalized with LATS2 (Extended Data Fig. 6a), suggesting that the cytoplasmic TAZ condensates could be the site of phosphorylation by LATS2. Taken together, these data indicate that the ability of TAZ to undergo LLPS can be inhibited by Hippo signalling through LATS/NDR-kinase-mediated phosphorylation.
Fig. 6 |. Hippo signalling negatively regulates TAZ phase separation through LATS2.

a, GFp–TAZ (green) was cotransfected with Flag-tagged WT LATS2, either alone or together with HA–MST2, or with the kinase inactive LATS2KD in the absence of presence of 40 μM MG132 for 6 h. LATS2 localization was detected by immunofluorescence using anti-Flag antibodies (red). Scale bars, 10 μm. b, MCF-10A cells transfected with sirNA control (siCtrl) or sirNA targeting LATS1/2 (siLATS1/2) were analysed using western blotting (top). Localization of GFp–TAZ in these cells at high cell density was examined using confocal microscopy (bottom). Scale bar, 10 μm. c, GFp–TAZ (green) was cotransfected with WT HA–NDR1 or HA–NDR2, either alone or together with HA–MST2. NDr1/2 localization was detected using immunofluorescence with anti-HA antibodies (red). Scale bars, 10 μm. d, In vitro phosphorylation and droplet formation. GFp–TAZ was phosphorylated in an in vitro kinase assay by WT or kinase-inactive LATS2 prepared from transfected HEK293T cells and analysed using a droplet-formation assay. phosphorylation of TAZ was detected by western blotting using antibodies specific for phosphorylated TAZ (bottom). Top, representative fluorescence and differential interference contrast images of the droplets. Scale bar, 10 μm. e, Confocal images of MCF-10A cells transfected with GFP–TAZ or GFP–TAZS89A. Scale bar, 10 μm. right, quantification of the percentage of cells that displayed nuclear puncta. Data are mean ± s.e.m. P values were determined using unpaired two-tailed Student’s t-tests; 80 transfected cells in each group were quantified; n = 3 biologically independent samples. The experiments in a–e were repeated independently three times with similar results. Source data are available online.
TAZ compartmentalizes TEAD and other transcription cofactors in LLPS condensates.
Colocalization studies indicated that TAZ condensates did not contain markers of promyelocytic leukemia (PML) bodies, nucleolus or Cajal bodies (Extended Data Fig. 7). We next examined whether the TAZ nuclear puncta contained its DNA-binding cofactor TEAD8,44,45 and other transcriptional coactivators. When expressed alone, TEAD4 was evenly distributed in the nucleus and did not undergo LLPS either in vivo or in vitro, but was recruited to the TAZ condensates by the ectopically expressed GFP–TAZ (Fig. 7a,b). This recruitment is dependent on the interaction between TAZ and TEAD and the ability of TAZ to undergo LLPS. The TAZS51A mutant is defective in TEAD binding46, yet the fraction of this mutant that localized in the nucleus47 still underwent LLPS. When coexpressed with the TAZS51A mutant, TEAD was not recruited to the TAZ LLPS, suggesting the importance of the TAZ–TEAD interaction for the localization of TEAD to the TAZ puncta. Deletion of the WW and CC domains of TAZ (ΔWW+ΔCC) not only disrupted TAZ LLPS but also prevented localization of TEAD4 in these puncta, even though this TAZ mutant remained bound to TEAD4 in the nucleus (Fig. 7c), confirming the requirement of TAZ LLPS for recruiting TEAD4. Finally, activation of TAZ, either by serum stimulation or LATS1/2 knockdown, resulted in the recruitment of TEAD to the TAZ LLPS puncta (Fig. 7d, Extended Data Fig. 6b,c). Together, these data suggest that TAZ interacts with TEAD4 and recruits TEAD4 to the liquid droplets.
Fig. 7 |. TAZ compartmentalizes TeAD and other transcriptional factors to the nuclear puncta.

a, Myc–TEAD4 was cotransfected into MCF-10A cells together with GFP vector or WT or mutant GFP–TAZ as indicated. TAZ and TEAD4 localization was monitored by GFp fluorescence and using immunofluorescence staining with anti-Myc antibodies (red), respectively. Scale bar, 10 μm. Insets, magnification by 2.96, 2.75, 2.75 and 2.75 times, respectively. b, In vitro droplet-formation assay. mCherry–TEAD4 (50 μM) either alone or mixed together with 50 μM WT GFp–TAZ or ΔWW+ΔCC was analysed using a droplet-formation assay under the same conditions as described in Fig. 3c. Scale bar, 10 μm. c, The ability of HA-tagged WT or mutant TAZ to interact with Flag–TEAD4 was examined using a co-immunoprecipitation assay with anti-Flag antibodies in the immunoprecipitation (Ip), followed by western blotting with anti-HA antibodies (top). The abundance of these proteins in the cell lysates was assessed using western blotting (bottom). d, Serum-starved MCF-10A cells transfected with Myc–TEAD4 and GFP–TAZ were treated with 10% FBS for 1 h and processed for immunofluorescence staining using anti-Myc antibodies (red). Scale bar, 10 μm. Inset, magnification by 3.02 times. e, Colocalization of BrD4, MED1 or CDK9 with GFp–TAZ in the nuclear puncta in MCF-10A cells. Localization of endogenous BrD4, MED1 and CDK9 was detected by indirect immunofluorescence (red). Scale bars, 10 μm. Insets, magnification by 2.85 times. f, Colocalization of active rNA pol II with Flag–TAZ in the nuclear puncta in MCF-10A cells was detected using immunofluorescence staining with antibodies targeting either the active rNA pol II, which is phosphorylated at Ser 5 (S5p) or Ser 2 (S2p) in its CTD (red), or Flag (green). The images were captured using super-resolution structured illumination microscopy. Colocalization (yellow) was analysed using Imaris. Scale bar, 2 μm. g, Localization of active or repressive histone marks in MCF-10A cells expressing GFp–TAZ was analysed using immunofluorescence staining with anti-H3K4me3 or anti-H3K9me3 antibodies (red). The images were captured using super-resolution structured illumination microscopy. Colocalization (yellow) was analysed using Imaris. Scale bar, 2 μm. The experiments in a–g were repeated independently three times with similar results. Source data are available online.
The TAZ nuclear condensates were also enriched for components of the transcriptional elongation machinery, CDK9, super-enhancer markers BRD4 and MED1 (Fig. 7e), and the active RNA polymerase II phosphorylated at Ser 2 or Ser 5 of its C-terminal domain (CTD; Fig. 7f), suggesting that the TAZ LLPS puncta are sites of active transcription. Consistent with this, we detected H3K4me3—the actively transcribed chromatin mark—but not the transcriptionally repressive mark H3K9me3 in the TAZ condensates (Fig. 7g). These data support the model that TAZ forms LLPS condensates that are enriched for key transcription factors to enable gene expression.
Phase separation promotes transcriptional activation by TAZ.
We next examined whether the ability of TAZ to undergo LLPS is required for the transcriptional activity of TAZ using the TAZ ΔCC mutant and TAZ CCY chimaera that do not form nuclear puncta but are still able to bind to TEAD4 and its regulator LATS2 (Fig. 7c, Extended Data Fig. 8). In both the TAZ-dependent luciferase reporter assay (Fig. 8a) and the experiments measuring the expression of two endogenous TAZ target genes, CTGF and CYR61 (Fig. 8b), deletion of the WW domain alone had little effect on transcription, whereas deletion of the CC domain either individually or together with the WW domain significantly decreased the transcriptional activity of TAZ. Thus, the transcriptional activity of TAZ is correlated with its ability to undergo LLPS.
Fig. 8 |. Phase separation of TAZ promotes transcription.

a,c, TAZ-dependent luciferase activity was measured in HEK293T cells expressing 8×GT-IIC-δ51LucII and various TAZ mutants (a) or TAZ–YAp chimaeras (c). Data are mean ± s.e.m. P values were determined using unpaired two-tailed Student’s t-tests; n = 4 biologically independent samples. b,d, Quantitative pCr with reverse transcription (rT–qpCr) analysis of CTGF and CYR61 mrNA expression in HEK293T cells transfected with various TAZ mutants (b) or TAZ–YAP chimaeras (d). Data are mean ± s.e.m. P values were determined using unpaired two-tailed Student’s t-tests; n = 3 biologically independent samples. e, Analysis of TAZ and YAp expression using western blotting in MDA-MB-231 cells with altered TAZ or YAp expression. GApDH was used as a loading control. f, Heat map summarizing genes that are significantly downregulated in TAZ KO cells, but not in YAp KO cells, using rNA-seq. Genes with the most-reduced expression are indicated in blue, and genes with the most-induced expression are indicated in red. The expression levels of downregulated genes in TAZ KO cells were restored in cells re-expressing Flag–TAZ but not Flag–TAZΔCC. The experiments in a and c were repeated independently four times with similar results. The experiments in b, d and e were repeated independently three times with similar results. Statistical analyses were calculated on the basis of the average numbers from these independent experiments. Source data are available online.
Under the same experimental conditions, YAP showed lower transcription activity than TAZ27 (Fig. 8c,d). Interestingly, whereas TAZ-WWY activated transcription to a similar extent as TAZ, TAZ-CCY and TAZ-WWY+CCY displayed reduced transcriptional activity, similar to YAP (Fig. 8c,d). As YAP and TAZ-CCY have the ability to activate transcription, albeit at a lower level, we speculated that TAZ LLPS is probably not essential for the basal transcription, but more for insulating the TAZ-specific pathways from those of YAP to establish signalling specificity. To test this, we knocked out TAZ or YAP using CRISPR–Cas9 in MDA-MB-231 cells (Fig. 8e) and compared the gene expression profiles of these cells with the expression profiles of the parental cells using RNA sequencing (RNA-seq). We identified a panel of around 46 genes that are strongly dependent on TAZ, but not on YAP, for expression (Fig. 8f). Reintroduction of WT TAZ, but not of the TAZ ΔCC mutant defective in LLPS, in the TAZ KO cells fully restored expression of these genes (Fig. 8f), strongly supporting the idea that TAZ LLPS is required for TAZ-specific gene expression. Taken together, our data suggest that an important function of TAZ LLPS is to act as hubs for efficient and TAZ-specific transcriptional activation.
Discussion
TAZ and YAP activate the expression of many cellular genes in response to a wide variety of signals derived from cell–cell contact, cell polarity, mechano-transduction, cellular stress and metabolism48–51. How these broad-spectrum transcriptional coactivators orchestrate such a diverse array of signals to generate specific downstream outcomes is an important but unanswered question. Here we show that phase separation is an important mechanism that enables TAZ to activate transcription in an efficient and specific manner. Under natural conditions (no crowding agents), TAZ, but not YAP, forms liquid-like droplets both in vitro and in vivo, and these LLPS condensates function as hubs for TAZ to compartmentalize its partner TEAD4, coactivators and core machinery, including BRD4, MED1 and CDK9 to activate the transcription of target genes. This process is negatively regulated by Hippo signalling through phosphorylation by LATS/NDR kinases. Thus, we have identified that LLPS is an important mechanism by which TAZ efficiently engages the transcriptional machinery to stimulate specific gene expression.
YAP differs from TAZ in its ability to phase separate. Cai et al. showed recently that YAP can undergo LLPS in the presence of crowding agent PEG and that the nuclear YAP condensates may be the site of transcription31. We found that, under conditions in which TAZ readily phase separated, YAP failed to form LLPS both in vitro or in vivo. YAP was able to form droplets only in the presence of several crowding agents. LLPS is often driven by IDRs or CC domains that mediate oligomerization and/or facilitate multivalent interactions that are necessary for LLPS52,53. TAZ and YAP both contain large stretches of IDRs and a CC domain, and it is the CC domain that distinguishes TAZ from YAP in its ability to phase separate. Deleting this domain or substituting it with the YAP CC domain significantly impaired TAZ LLPS and downstream target gene expression. The TAZ CC domain is required for TAZ oligomerization and additional multivalent interactions with other proteins. These interactions probably involve hydrophobic residues, as TAZ LLPS is enhanced by increasing salt concentrations and temperature—conditions that favour hydrophobic interactions. The TAZ CC domain has been previously reported to mediate interaction with the Smad2/3–Smad4 complex to promote their nuclear translocation54. However, evidence for the role of the TAZ CC domain in transcriptional activation has been lacking. Here we demonstrated a role of the CC domain in transcriptional activation through the induction of LLPS.
The distinct ability of TAZ and YAP to undergo LLPS leads to important differences in the transcriptional outcomes. Gene expression profiling analyses have shown that, although many genes can be activated by both TAZ and YAP, a substantial subset of genes are differentially induced by either TAZ or YAP, often in a cell- or tissue-specific manner16,55. How TAZ and YAP achieve this transcription specificity has not been well defined. Kaan et al. suggest that, in contrast to the YAP–TEAD dimer, TAZ–TEAD can form a heterotetramer, and this unique structural feature may affect DNA-target selectivity and transcription of some target genes27. Our results suggest that phase separation could be an important mechanism that enables physical separation of TAZ-specific signalling pathways from those of YAP and, therefore, provides pathway specificity. Indeed, our RNA-seq results showing that a panel of TAZ-specific genes requires LLPS for activation strongly support this notion.
LLPS is emerging as a key mechanism for transcriptional regulation. General transcription elongation factor P-TEFb, transcription initiation factors TAF15 and FUS56,57, stem-cell-specific transcription factors OCT4, MYC and SOX213, as well as transcription coactivators BRD4 and MED125 have all been shown to undergo phase separation to cluster in discrete membraneless condensates that function as hubs to enable efficient and dynamic regulation of transcription and RNA processing. Here we provide evidence that the signalling-pathway-specific transcription coactivator TAZ uses a similar LLPS mechanism through multivalent protein–protein interactions to regulate downstream gene expression. TAZ LLPS can achieve three goals. First, by concentrating TEAD4, BRD4 and MED1, and the general elongation factor P-TEFb in one compartment, TAZ LLPS enables more efficient transcription reactions. Second, TAZ LLPS physically sequesters the TAZ-specific pathway away from YAP to enable TAZ-specific downstream outcomes. Finally, TAZ LLPS spatially insulates TAZ from its upstream regulators LATS1 and LATS2 to prevent inactivation. As TAZ is a critical regulator of cell proliferation, survival, differentiation and transformation12,58, and its upregulation in human cancers can promote transcriptional addiction, understanding the role of phase separation in its mechanism of action may provide therapeutic targets for cancer in humans.
Online content
Any methods, additional references, Nature Research reporting summaries, source data, extended data, supplementary information, acknowledgements, peer review information; details of author contributions and competing interests; and statements of data and code availability are available at https://doi.org/10.1038/s41556-020-0485-0.
Methods
Plasmids, antibodies and reagents.
The GFP–TAZ and GFP–YAP constructs were generated by PCR and sub-cloned into the pEGFP-C1 vector (Clontech) or pGFP-2×Strep vector, provided by Q. Zhou (University of California, Berkeley). Mutant GFP–TAZ containing various truncations and mutations in the TAZ molecule were generated using PCR and similarly cloned into the above vectors. The chimeric GFP–TAZ molecules containing the substituted YAP WW (WWY: amino acids 171–204), CC (CCY: amino acids 260–309), or both WW and CC domains (WWY+CCY) were generated by PCR based on GFP–TAZ. Chimeric GFP–YAP containing the substituted TAZ WW (WWT, amino acids 124–157), CC (CCT, amino acids 225–259), or both WW and CC domains (WWT+CCT) were generated by PCR based on GFP–YAP. The mCherry–TEAD4 construct was generated by PCR and subcloned into the pHis-mCherry vector provided by Q. Zhou (University of California, Berkeley). cDNAs of TAZ, YAP, LATS2, LATS2 KD, TEAD4 and MST2 were provided by K.-L. Guan (University of California, San Diego) and A. Mauviel (Curie Institute).
The following antibodies and reagents were purchased from commercial sources: anti-TAZ (BD Pharmingen, 560235, M2–616, 1:100); anti-GAPDH (Santa Cruz, sc-25778, FL-335, 1:1,000); anti-Myc (Cell Signaling Technology, 2276, 9B11, 1:200); anti-MED1 (Santa Cruz, sc-8998, M-255, 1:100); anti-PML (Santa Cruz, sc-966, PG-M3, 1:100); anti-coilin (Santa Cruz, sc-55594, F-7, 1:100); anti-fibrillarin (Santa Cruz, sc-377340, G-8, 1:100); anti-RNA Pol II-S2P (Millipore, 04–1571, 3E10, 1:200); anti-RNA Pol II-S5P (Millipore, 04–1572, 3E8, 1:200); anti-H3K4me3 (Active Motif, 39160, 1:400); anti-H3K9me3 (Active Motif, 39162, 1:400); anti-Flag (Sigma, F3165, M2, 1:100 or 1:1,000); anti-Flag (Sigma, F7425, 1:1,000), anti-YAP/TAZ (Santa Cruz, sc-101199, 63.7, 1:1,000); anti-LATS1 (Cell Signaling Technology, 3477, C66B5, 1:1,000); anti-LATS2 (Bethyl Laboratories, A300–479A, 1:1,000); anti-glutathione S-transferase (GST) (Cell Signaling Technology, 2624, 26H1, 1:1,000); Alexa Fluor 555 Phalloidin (Thermo Fisher Scientific, A34055, 1:100); MG-132 (Selleck); LPA (Tocris Bioscience); EGF (PeproTech); fibronectin (Sigma); 1,6-hexanediol (Sigma); polyacrylamide hydrogels of 1 kPa and 40 kPa stiffness (Matrigen); Ficoll (Grainger); dextran (Sigma); PEG-1000 (Sigma); PEG-8000 (Sigma); and BSA (Sigma).
Antibodies against HA (1:100 or 1:1,000), CDK9 (1:400) and BRD4 (1:400) were generated as described previously59.
Protein expression and purification.
Plasmids containing Strep-GFP-, His-mCherry- or GST-tagged genes were transformed into E. coli BL21 cells. After induction with isopropyl-β-d-thiogalactoside, bacteria lysates in buffer (50 mM Tris-HCl pH 7.5, 500 mM NaCl, 1 mM dithiothreitol (DTT) and 1% Triton X-100) were sonicated, and the Strep–GFP-fusion proteins were purified using the Strep-Tactin Superflow beads (IBA). The His–mCherry-fusion proteins were purified using a Ni-NTA column (Thermo Fisher Scientific). The GST and GST-fusion proteins were purified using Glutathione Sepharose beads (GE Healthcare). The eluted proteins were dialysed in 1 l dialysed buffer (20 mM Tris-HCl pH 7.5, 37.5 mM NaCl and 1 mM DTT) overnight at 4 °C and concentrated with Amicon Ultra Centrifugal Filters (Millipore).
Droplet-formation assay.
Purified proteins were diluted to varying concentrations in buffer containing 20 mM Tris-HCl pH 7.5 and 1 mM DTT with the indicated salt concentrations. Protein solution (5 μl) was loaded onto a glass slide, covered with a coverslip and imaged using an AxioObserver Z1 inverted microscope (Zeiss). The sizes of the droplets in 3 166 × 124 μm2 fields were quantified using ImageJ (NIH).
Cell culture, transfection, infection and RNA interference.
HEK293T, HeLa and MDA-MB-231 cells were cultured in DMEM (Invitrogen) containing 10% FBS (HyClone) and 50 μg ml−1 penicillin–streptomycin (Pen–Strep). MCF10A cells were cultured in DMEM/F12 (Invitrogen) supplemented with 5% horse serum (Invitrogen), 20 ng ml−1 EGF, 0.5 μg ml−1 hydrocortisone, 10 μg ml−1 insulin, 100 ng ml−1 cholera toxin and 50 μg ml−1 Pen–Strep. All of the cell lines were authenticated at the UC Berkeley Cell Culture Facility by single-nucleotide polymorphism testing and were confirmed as negative for mycoplasma.
Transfection of cells was performed using Lipofectamine 3000 (Thermo Fisher Scientific) according to the manufacturer’s instructions. The CRISPR–Cas9 system was used to delete TAZ or YAP in MDA-MB-231 cells as previously described60, using lentiCRISPR v2 (Addgene plasmid 52961). The stable TAZ KO cells expressing Flag–TAZ or Flag–TAZΔCC were generated by retroviral infection as described previously61. RNA interference was performed using Lipofectamine RNAiMAX (Thermo Fisher Scientific) according to the manufacturer’s instructions. The following siRNAs obtained from Dharmacon were used: siGENOME SMARTpool Human LATS2 (M-003865–02), siGENOME SMARTpool Human LATS1 (M-004632–00) and Accell Control Pool Non-Targeting (D-001910–10–05).
Immunofluorescence staining and live-cell imaging.
Cells were seeded on glass coverslips, fixed with 4% paraformaldehyde PBS for 15 min, blocked in buffer containing 5% FBS and 0.3% Triton X-100 in PBS for 1 h and incubated with primary antibodies overnight at 4 °C. After washes, cells were incubated with Alexa-Fluor-488- or 555-conjugated secondary antibodies (Thermo Fisher Scientific) for 1 h at room temperature. The coverslips were mounted on glass slides in VECTASHIELD Antifade Mounting Medium with DAPI (Vector Laboratories) and sealed. To detect TAZ expression in human tissue samples, a paraffin-embedded human breast tissue array (US Biomax, BR6161) was deparaffinized, hydrated, heated in retrieval buffer (10 mM sodium citrate pH 6.0) for 10 min for antigen retrieval and then incubated with TAZ antibodies (Sigma, HPA007415, 1:100). Immunofluorescence was detected using a Zeiss LSM 710 confocal microscope or Zeiss Elyra PS1 super-resolution structured illumination microscope. Colocalization of green and red channels was performed using Imaris (Bitplane). The age, gender and diagnosis information of the patients is available at company’s website: https://www.biomax.us/tissue-arrays/Breast/BR6161.
Live-cell imaging was performed as previously described59. In brief, MCF-10A cells transfected with GFP–TAZ construct were seeded on LabTek chambered slides (Nunc) and examined under a Nikon Spinning Disk confocal microscope. During image acquisition, cells were incubated in an equilibrated observation chamber at 37 °C with 5% CO2. Images were acquired at intervals of 30 s and were analysed with ImageJ to identify fusion events.
FRAP and FRAP beam-size analysis.
HeLa cells grown on glass coverslips in 6-well plates were transfected with 2 μg per well of GFP–TAZ and analysed through quantitative FRAP studies 24 h after transfection as described previously32,62. Measurements were performed at 22 °C in Hank’s balanced salt solution supplemented with 20 mM HEPES pH 7.2. An argon-ion laser beam (Innova 70C; Coherent) was focused through a fluorescence microscope (Axio Imager.D1, Carl Zeiss MicroImaging) to a spot with a Gaussian radius (ω) of 0.77 ± 0.03 μm (plan apochromat ×63/1.4 NA oil-immersion objective) or 1.17 ± 0.05 μm (C apochromat ×40/1.2 NA water-immersion objective)33. The ratio between the bleach areas (ω2(×40)/ω2(×63)) was 2.28 ± 0.05 (n = 59; s.e.m. was calculated using bootstrap analysis as described below). After a brief measurement at monitoring intensity (488 nm, 1 μW), a 5 mW pulse (5–10 ms) bleached 60–75% of the fluorescence in the illuminated region, and recovery was followed by the monitoring beam. The characteristic fluorescence recovery time (τ) and mobile fraction (Rf) were extracted by nonlinear regression analysis, fitting to a lateral diffusion process32. The statistical differences between τ values measured with the same beam sizes were evaluated using Student’s t-tests. To compare the ratio measurements (τ(×40)/τ(×63) and ω2(×40)/ω2(×63)), we used bootstrap analysis, which is preferable for comparison between ratios63, as described previously62, using 1,000 bootstrap samples.
Immunoprecipitation, GST pull-down and immunoblotting.
Immunoprecipitation, GST pull-down and immunoblotting were performed as previously described61. In brief, cells were lysed in lysis buffer (50 mM HEPES pH 7.5, 150 mM NaCl, 1 mM EDTA, 1% NP-40, 10 mM pyrophosphate, 10 mM glycerophosphate, 50 mM NaF, 1.5 mM Na3VO4, protease inhibitor cocktail (Roche) and 1 mM phenylmethylsulfonyl fluoride), and clarified cell lysates were analysed using immunoprecipitation with anti-Flag M2 agarose beads (Sigma). For GST pull-down assays, purified GST or GST-fusion proteins were incubated with clarified cell lysates at 4 °C for 4 h, followed by incubation with Glutathione Sepharose for an additional 2 h. Proteins bound to Glutathione Sepharose were eluted, resolved using SDS–PAGE and detected by western blotting.
In vitro kinase assay.
Flag–LATS2 or Flag–LATS2KD was purified from transfected HEK293T cells, eluted as described previously61 and incubated with GFP–TAZ immobilized on the Strep-Tactin Superflow beads in kinase buffer (10 mM MgCl2, 50 Mm NaCl, 1 mM DTT, 50 mM HEPES pH 7.4) containing 5 mM ATP at room temperature for 12 h. After washing, the phosphorylated GFP–TAZ were eluted from the beads using 10 μl elution buffer (20 mM Tris-HCl pH 7.5, 37.5 mM NaCl, 1 mM DTT and 1 mM desthiobiotin).
Luciferase assay.
A total of 2.5 μg DNA (including 50 ng of 8×GT-IIC-δ51LucII Luciferase reporter construct and the indicated plasmids) was transiently transfected into HEK293T cells using Lipofectamine 2000. The luciferase activity was measured at 36 h after transfection as described previously61,64.
RNA extraction, reverse transcription and qPCR.
Total RNA was extracted using TRIzol Reagent (Ambion). RNA (1 μg) was reverse-transcribed using the SuperScript III First-Strand Synthesis System (Thermo Fisher Scientific). The resulting cDNA was analysed using RT–qPCR using the DyNAmo HS SYBR Green qPCR Kits (Thermo Fisher Scientific) and the Bio-Rad real-time PCR system (Bio-Rad), with β-actin as a control. The following primers were used: β-actin, forward: GCCGACAGGATGCAGAAGGAGATCA, reverse: AAGCATTTGCGGTGGACGATGGA; CTGF, forward: CCAATGACAACGCCTCCTG, reverse: TGGTGCAGCCAGAAAGCTC; CYR61, forward: AGCCTCGCATCCTATACAACC, reverse: TTCTTTCACAAGGCGGCACTC.
RNA-seq and bioinformatics analysis.
Total cellular RNAs were extracted using TRIzol, and cDNA libraries were prepared using high-quality RNA (RNA integrity number > 7). RNA-seq was performed by Novogene. In brief, the libraries were individually barcoded and run on a single lane of an Illumina NovaSeq system yielding 150-bp paired-end (PE150) reads. The reads were aligned to the hg19 reference genome using STAR v.2.5 (ref. 65). Only uniquely mapped reads were retained for further analysis. The number of reads for each gene was counted using HTSeq v.0.6.1 (ref. 66) according to Gencode human annotation release 24. For each sequenced library, the read counts were adjusted using the edgeR program package through one scaling normalized factor. Differential expression analysis of two groups was performed using the edgeR v.3.16.5R package. The P values were adjusted using the Benjamini–Hochberg method. Genes with an adjusted P < 0.005 and absolute log2[fold change] > 1 were considered to be significantly differentially expressed.
Statistics and reproducibility.
All data were derived from at least three independent experiments and are presented as means ± s.e.m. unless otherwise noted in the figure legend. Comparisons among groups were performed using one-way ANOVA with Krusk–Wallis test or Student’s t-tests with GraphPad Prism 7. FRAP beam-size ratio measurements used bootstrap analysis—which is preferable for comparison between ratios63, as described previously6—using 1,000 bootstrap samples. All attempts at replication were successful with similar results.
Reporting Summary.
Further information on research design is available in the Nature Research Reporting Summary linked to this article.
Extended Data
Extended Data Fig. 1 |. Regulation of TAZ droplet formation in vitro and nuclear puncta formation in vivo.

a, GFp-TAZ purified from E. coil were analysed by SDS-pAGE and visualized by Coomassie blue staining. b. 50 μM GFp-TAZ were heated-inactivated (5 min at 95 °C and immediately put on ice for 5 min) or treated with 100 μg/ml proteinase K for 30 min at 40 °C, and then subjected to droplet formation assay in vitro in the presence of 500 mM NaCl at room temperature. c, Ectopically expressed GFp-TAZ was expressed at a lower level than endogenous TAZ in MCF-10A cells as shown by western blotting. GApDH was used as a loading control. d, Flag-TAZ formed nuclear puncta when transfected into the MCF-10A cells, as detected by immunofluorescence staining with anti-Flag. Scale bar, 10 μm. Experiments in a–d were repeated independently three times with similar results. Unprocessed blots are provided in Unprocessed Blots Extended Data Fig. 1.
Extended Data Fig. 2 |. YAP does not form droplets in vitro and in vivo in the absence of crowding agents.
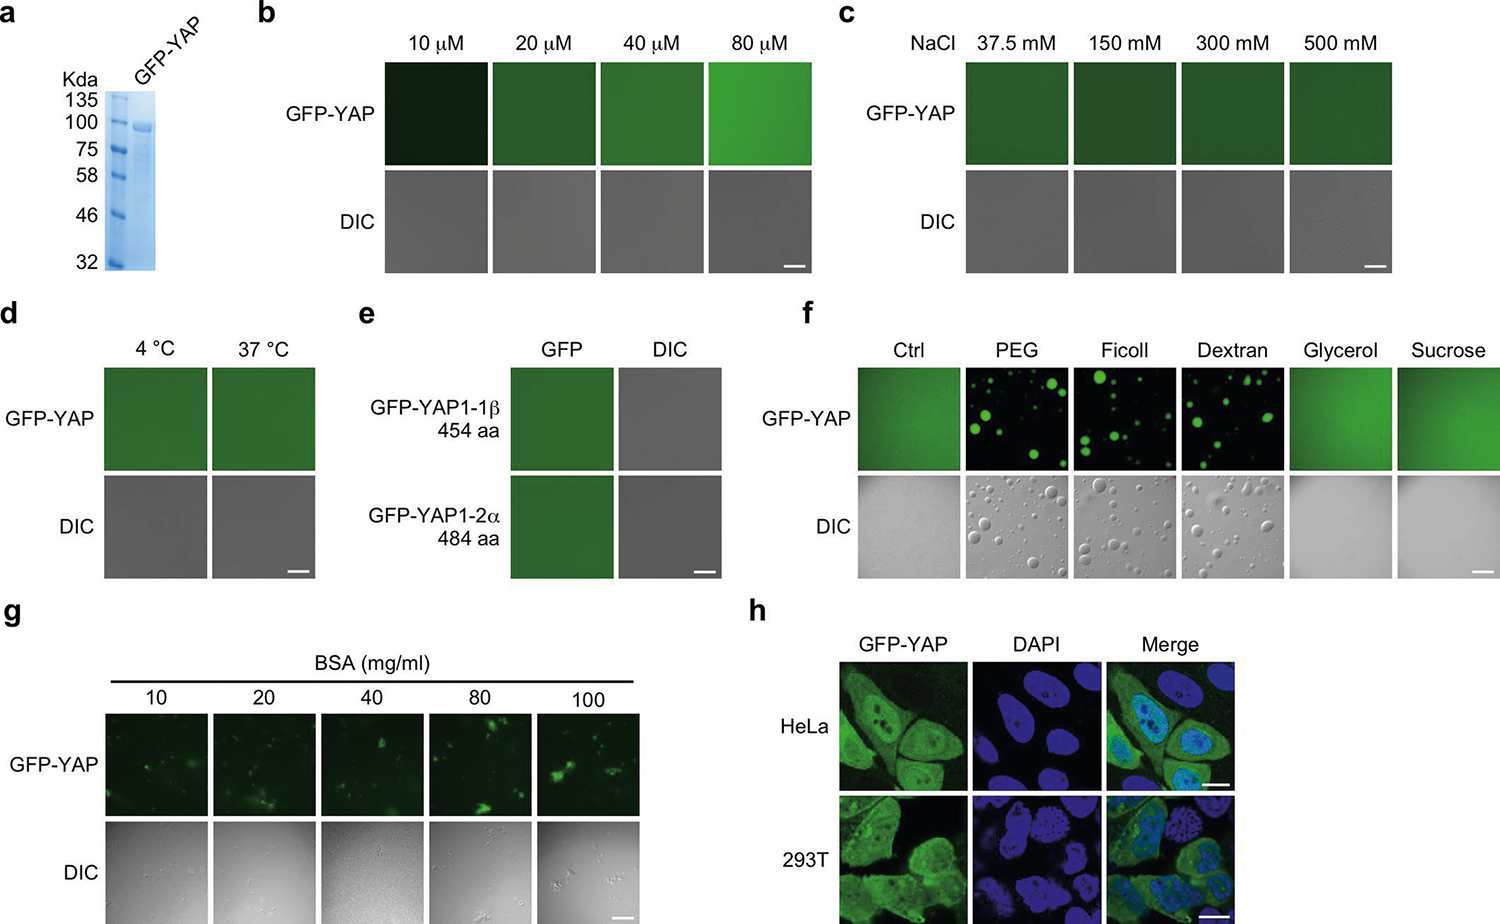
a, GFp-YAp purified from E. coil were analyzed by SDS-pAGE and visualized by Coomassie blue staining. b, GFp-YAp at varying concentrations was subjected to the droplet formation assay at room temperature and in the presence of 500 mM NaCl. c, 50 μM GFp-YAp was subjected to the droplet formation assay at room temperature in the presence of indicated salt concentrations. d, 50 μM GFp-YAp was subjected to droplet formation in the presence of 150 mM NaCl at 4 °C or 37 °C. e, Two YAp isoforms, GFp-YAp1–1β or GFp-YAp1–2α, did not form droplets (50 μM protein, 500 mM NaCl and room temperature). aa, amino acids. f, 50 μM GFp-YAp formed droplets in the presence of 10% pEG-8000, Ficoll or Dextran but not 10% glycerol or sucrose. Droplet formation assay was performed in the presence of 500 mM NaCl at room temperature. g, 50 μM GFp-YAp did not form droplets in the presence of BSA at varying concentrations. h, GFp-YAp did not form nuclear puncta in both HeLa cells and 293T cells. Scale bars, 10 μm. Experiments in a–h were repeated independently three times with similar results.
Extended Data Fig. 3 |. The CC and WW domains are required for TAZ to form nuclear puncta.

a, Domain structure of TAZ and TAZ truncations. The numbers above indicate the position of amino acid residues. b, Bacterially purified GFp-TAZ, ΔTB, ΔWW, ΔCC, and ΔWW+ΔCC proteins were analyzed by SDS-pAGE and detected by Coomasssie blue staining. c, Localization of GFp-TAZ and various mutants in HeLa cells. d, Localization of GFp-TAZ and various TAZ/YAp chimera in HeLa cells. Scale bars, 10 μm. e, A GST pull-down assay was performed by incubating immobilized GST fusion proteins with lysates of cells expressing HA-tagged WT or mutant TAZ, and the associated TAZ proteins were detected by western blotting with anti-HA (upper). GST fusion proteins were assessed by western blotting with anti-GST, and HA-TAZ proteins in the cell lysates were measured by western blotting (lower). Experiments in b–e were repeated independently three times with similar results. Unprocessed blots are provided in Unprocessed Blots Extended Data Fig. 3.
Extended Data Fig. 4 |. TAZ CC domain enhances YAP phase separation in the presence of PeG.

a, Domain structure of YAp chimera. b, Substitution of the YAp CC and WW domains with that of TAZ is not sufficient to enable YAp to undergo LLpS in MCF10A cells in the absence of pEG. c, Coomasssie blue staining of various recombinant proteins purified from E. coil. d, 25 μM bacterially purified GFp-YAp chimera proteins were subjected to droplet formation assay in the presence of 10% pEG-8000. Quantification of the droplets is on the right. Scale bar, 10 μm. Data shown as the mean ± s.e.m. Statistical significance was evaluated using One-way ANOVA with Krusk-Wallis test. Droplets in n = 3 fields in each group were quantified. e, The TAZ CC and WW domains enhanced LLpS by GFp-YAp in transfected MCF10A cells in the presence of pEG as shown by confocal microscopy. Scale bar, 10 μm. Quantification of the percentage of cells that displayed nuclear puncta is shown on the right. Data shown as the mean ± s.e.m.. P value was determined by unpaired two-tailed Student’s t-test. 80 transfected cells in each group were quantified. n = 3 biologically independent samples. Experiments in b, c, e were repeated independently three times with similar results. Experiments in d were repeated twice with similar results. Statistical source data for d, e, are provided in Statistical Source Date Extended Data Fig. 4.
Extended Data Fig. 5 |. Hippo signaling negatively regulates TAZ phase separation in HeLa cells.

TAZ localization was examined by immunofluorescence staining with anti-TAZ (green) in HeLa cells that have been subjected to the following treatments: a, Serum-starved HeLa cells were treated with 1 μM LpA or 50 ng/ml EGF for 1 h. b, Serum-starved HeLa cells were seeded on fibronectin-coated coverslips for 10 min or 2 h in serum-free medium. c, HeLa cells were grown on fibronectin-coated polyacrylamide hydrogels of 1 kpa and 40 kpa stiffness. d, HeLa cells were treated with 1 μg/ml Latrunculin B for 1 h. Alexa Fluor 555-conjugated phalloidin (red) staining was performed to detect F-actin in b-d. Scale bar, 10 μm. Experiments in a–d were repeated independently three times with similar results.
Extended Data Fig. 6 |. LATS2 regulates TAZ LLPS and recruitment of TeAD4 and BrD4.

a, MCF-10A cells transfected with GFp-TAZ-S89A and Flag-LATS2 were subjected to immunofluorescence staining with anti-Flag (red). Scale bar, 10 μm. b, MCF-10A cells stably expressing siLATS1/2 were transfected with GFp-TAZ and Flag-TEAD4. TEAD localization at high cell density was detected by immunofluorescence staining with anti-Flag (red). Scale bar, 10 μm. c, MCF-10A cells stably expressing siLATS1/2 were transfected with GFp-TAZ. Endogenous BrD4 localization was examined by immunofluorescence staining with anti-BrD4 (red). Scale bar, 10 μm. All experiments were repeated independently three times with similar results.
Extended Data Fig. 7 |. TAZ nuclear condensates do not co-localize with the PML bodies, Cajal bodies or nucleoli.
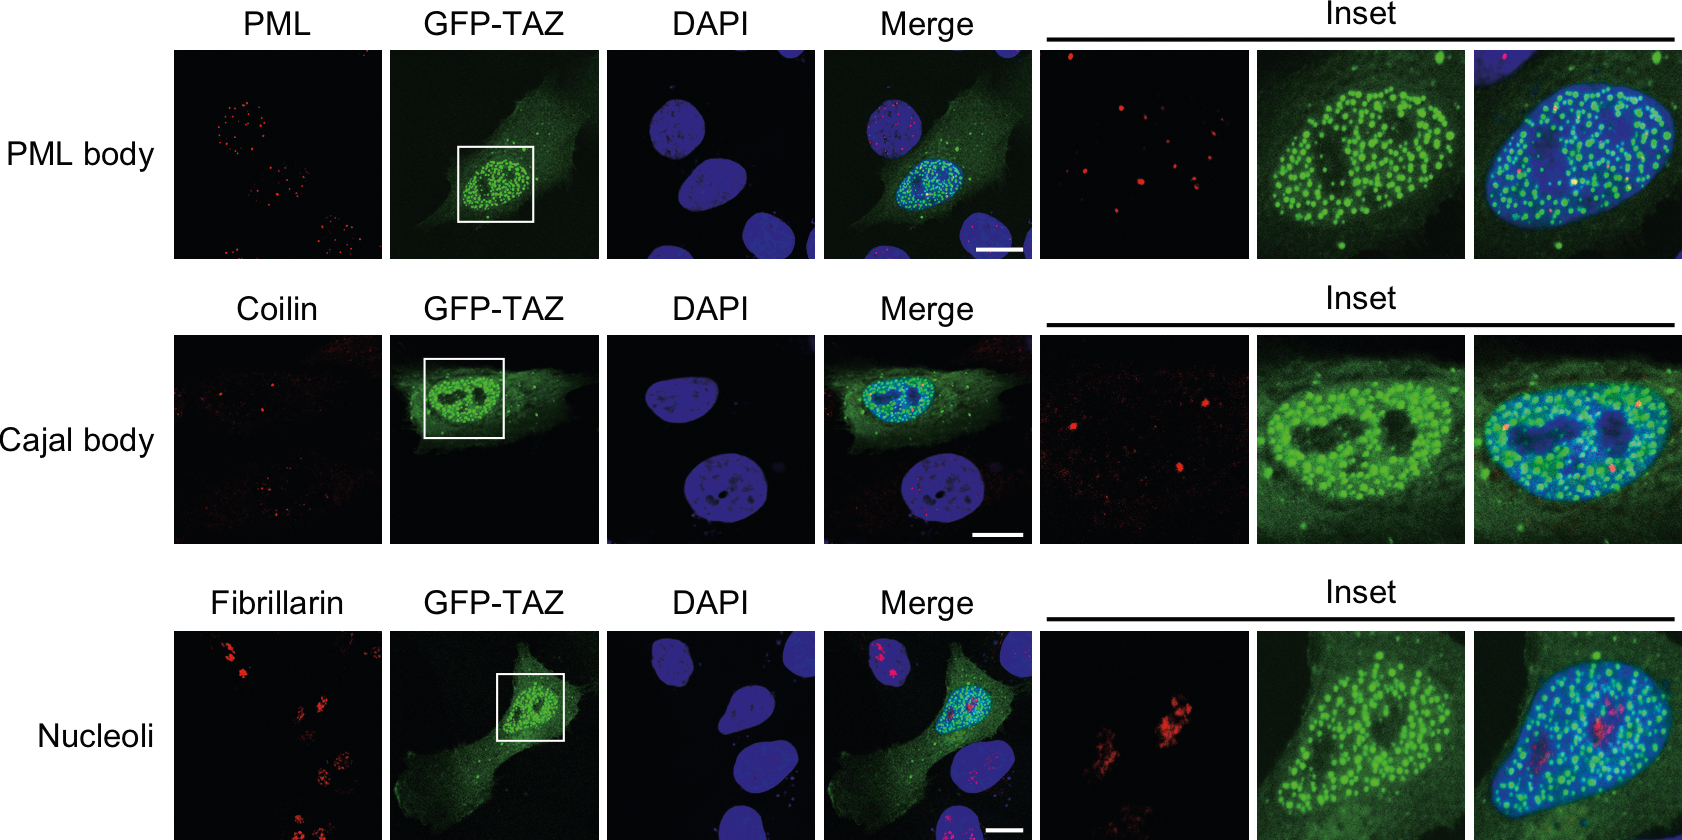
The pML nuclear bodies, Cajal Bodies and nucleoli in MCF-10A cells expressing GFp-TAZ (green) were detected by immunofluorescence staining with antibodies targeting pML, Coilin and Fibrillarin, respectively (red). Scale bar, 10 μm. Experiments were repeated independently three times with similar results.
Extended Data Fig. 8 |. TAZ mutants lacking the CC domain still bind to LAST2 and TeAD4.

a, HA-tagged WT and mutant TAZ were co-transfected into 293T cells with Flag-LATS2. TAZ proteins associated with LATS2 were isolated by immunoprecipitation with anti-Flag and detected by western blotting with anti-HA antibodies (upper panels). The abundance of these proteins in the cell lysates was assessed by western blotting (lower panels). GApDH was used as a loading control. b, Interaction of various TAZ mutants with Flag-TEAD4 was analyzed by co-Ip assay as described in a. c, Interaction of various TAZ/YAp chimera with LATS2 was analyzed by co-Ip as described in a. All experiments were repeated independently three times with similar results. Unprocessed blots are provided in Unprocessed Blots Extended Data Fig. 8.
Supplementary Material
Acknowledgements
We thank K.-L. Guan and A. Mauviel for providing cDNAs of components of the Hippo pathway and H. Sasaki for the 8xGT-IIC-δ51LucII construct; J. He for technical assistance and Q. Zhu for helpful suggestions, discussions and help with experimental procedures; and D. Schichnes and S. Ruzin at the CNR biological imaging facility at the University of California, Berkeley for assistance with microscopy. This study was supported by DOD/US Army Medical Research And Materiel Command W81XWH-15–1-0068 (to K.L. and Q.Z.), a Tel Aviv University-University of California Berkeley collaborative research grant (to Y.I.H. and K.L.), and NIH R01AI41757 (to Q.Z.). Y.I.H. is an incumbent of the Zalman Weinberg Chair in Cell Biology. Y.L. is supported by the Berkeley Scholars program, and T.W. was supported by the China Scholarship Council.
Footnotes
Competing interests
The authors declare no competing interests.
Additional information
Extended data is available for this paper at https://doi.org/10.1038/s41556-020-0485-0.
Supplementary information is available for this paper at https://doi.org/10.1038/s41556-020-0485-0.
Reprints and permissions information is available at www.nature.com/reprints.
Data availability
Source data for Figs. 1–4 and 6–8 and Extended Data Figs. 1, 3, 4 and 8 are available online. The RNA-seq data are available in the Gene Expression Omnibus (GEO) with the accession number GSE142474. All other data supporting the findings of this study are available from the corresponding author on reasonable request.
References
- 1.Pan D The Hippo signaling pathway in development and cancer. Dev. Cell 19, 491–505 (2010). [DOI] [PMC free article] [PubMed] [Google Scholar]
- 2.Ma S, Meng Z, Chen R & Guan KL The Hippo pathway: biology and pathophysiology. Annu. Rev. Biochem. 88, 577–604 (2018). [DOI] [PubMed] [Google Scholar]
- 3.Tapon N & Harvey KF The Hippo pathway—from top to bottom and everything in between. Semin. Cell Dev. Biol. 23, 768–769 (2012). [DOI] [PubMed] [Google Scholar]
- 4.Badouel C & McNeill H SnapShot: the Hippo signaling pathway. Cell 145, 484 (2011). [DOI] [PubMed] [Google Scholar]
- 5.Schroeder MC & Halder G Regulation of the Hippo pathway by cell architecture and mechanical signals. Semin. Cell Dev. Biol. 23, 803–811 (2012). [DOI] [PubMed] [Google Scholar]
- 6.Yu FX & Guan KL The Hippo pathway: regulators and regulations. Genes Dev. 27, 355–371 (2013). [DOI] [PMC free article] [PubMed] [Google Scholar]
- 7.Dong JX et al. Elucidation of a universal size-control mechanism in Drosophila and mammals. Cell 130, 1120–1133 (2007). [DOI] [PMC free article] [PubMed] [Google Scholar]
- 8.Ota M & Sasaki H Mammalian Tead proteins regulate cell proliferation and contact inhibition as transcriptional mediators of Hippo signaling. Development 135, 4059–4069 (2008). [DOI] [PubMed] [Google Scholar]
- 9.Enderle L & McNeill H Hippo gains weight: added insights and complexity to pathway control. Sci. Signal. 6, re7 (2013). [DOI] [PubMed] [Google Scholar]
- 10.Shreberk-Shaked M & Oren M New insights into YAP/TAZ nucleocytoplasmic shuttling: new cancer therapeutic opportunities? Mol. Oncol. 13, 1335–1341 (2019). [DOI] [PMC free article] [PubMed] [Google Scholar]
- 11.Galli GG et al. YAP drives growth by controlling transcriptional pause release from dynamic enhancers. Mol. Cell 60, 328–337 (2015). [DOI] [PMC free article] [PubMed] [Google Scholar]
- 12.Zanconato F et al. Transcriptional addiction in cancer cells is mediated by YAP/TAZ through BRD4. Nat. Med. 24, 1599–1610 (2018). [DOI] [PMC free article] [PubMed] [Google Scholar]
- 13.Boija A et al. Transcription factors activate genes through the phase-separation capacity of their activation domains. Cell 175, 1842–1855 (2018). [DOI] [PMC free article] [PubMed] [Google Scholar]
- 14.Chan SW et al. A role for TAZ in migration, invasion, and tumorigenesis of breast cancer cells. Cancer Res. 68, 2592–2598 (2008). [DOI] [PubMed] [Google Scholar]
- 15.Cordenonsi M et al. The Hippo transducer TAZ confers cancer stem cell-related traits on breast cancer cells. Cell 147, 759–772 (2011). [DOI] [PubMed] [Google Scholar]
- 16.Plouffe SW et al. The Hippo pathway effector proteins YAP and TAZ have both distinct and overlapping functions in the cell. J. Biol. Chem. 293, 11230–11240 (2018). [DOI] [PMC free article] [PubMed] [Google Scholar]
- 17.Xin M et al. Hippo pathway effector Yap promotes cardiac regeneration. Proc. Natl Acad. Sci. USA 110, 13839–13844 (2013). [DOI] [PMC free article] [PubMed] [Google Scholar]
- 18.Nishioka N et al. The Hippo signaling pathway components Lats and Yap pattern Tead4 activity to distinguish mouse trophectoderm from inner cell mass. Dev. Cell 16, 398–410 (2009). [DOI] [PubMed] [Google Scholar]
- 19.Morin-Kensicki EM et al. Defects in yolk sac vasculogenesis, chorioallantoic fusion, and embryonic axis elongation in mice with targeted disruption of Yap65. Mol. Cell. Biol. 26, 77–87 (2006). [DOI] [PMC free article] [PubMed] [Google Scholar]
- 20.Hossain Z et al. Glomerulocystic kidney disease in mice with a targeted inactivation of Wwtr1. Proc. Natl Acad. Sci. USA 104, 1631–1636 (2007). [DOI] [PMC free article] [PubMed] [Google Scholar]
- 21.Passaniti A, Brusgard JL, Qiao YT, Sudol M & Finch-Edmondson M Roles of RUNX in Hippo pathway signaling. Adv. Exp. Med. Biol. 962, 435–448 (2017). [DOI] [PMC free article] [PubMed] [Google Scholar]
- 22.Zhao B et al. TEAD mediates YAP-dependent gene induction and growth control. Gene Dev. 22, 1962–1971 (2008). [DOI] [PMC free article] [PubMed] [Google Scholar]
- 23.Zhao B, Tumaneng K & Guan KL The Hippo pathway in organ size control, tissue regeneration and stem cell self-renewal. Nat. Cell Biol. 13, 877–883 (2011). [DOI] [PMC free article] [PubMed] [Google Scholar]
- 24.Alberti S, Gladfelter A & Mittag T Considerations and challenges in studying liquid-liquid phase separation and biomolecular condensates. Cell 176, 419–434 (2019). [DOI] [PMC free article] [PubMed] [Google Scholar]
- 25.Sabari BR et al. Coactivator condensation at super-enhancers links phase separation and gene control. Science 361, eaar3958 (2018). [DOI] [PMC free article] [PubMed] [Google Scholar]
- 26.Lu H, Liu R & Zhou Q Balanced between order and disorder: a new phase in transcription elongation control and beyond. Transcription 10, 157–163 (2019). [DOI] [PMC free article] [PubMed] [Google Scholar]
- 27.Kaan HYK et al. Crystal structure of TAZ-TEAD complex reveals a distinct interaction mode from that of YAP-TEAD complex. Sci. Rep. 7, 2035 (2017). [DOI] [PMC free article] [PubMed] [Google Scholar]
- 28.Piccolo S, Dupont S & Cordenonsi M The biology of Yap/Taz: Hippo signaling and beyond. Physiol. Rev. 94, 1287–1312 (2014). [DOI] [PubMed] [Google Scholar]
- 29.Hyman AA, Weber CA & Juelicher F Liquid-liquid phase separation in biology. Annu. Rev. Cell Dev. Biol. 30, 39–58 (2014). [DOI] [PubMed] [Google Scholar]
- 30.Boeynaems S et al. Protein phase separation: a new phase in cell biology. Trends Cell Biol. 28, 420–435 (2018). [DOI] [PMC free article] [PubMed] [Google Scholar]
- 31.Cai D et al. Phase separation of YAP reorganizes genome topology for long-term YAP target gene expression. Nat. Cell Biol. 21, 1578–1589 (2019). [DOI] [PMC free article] [PubMed] [Google Scholar]
- 32.Henis YI, Rotblat B & Kloog Y FRAP beam-size analysis to measure palmitoylation-dependent membrane association dynamics and microdomain partitioning of Ras proteins. Methods 40, 183–190 (2006). [DOI] [PubMed] [Google Scholar]
- 33.Eisenberg S, Giehl K, Henis YI & Ehrlich M Differential interference of chlorpromazine with the membrane interactions of oncogenic K-Ras and its effects on cell growth. J. Biol. Chem. 283, 27279–27288 (2008). [DOI] [PubMed] [Google Scholar]
- 34.Shvartsman DE et al. Src kinase activity and SH2 domain regulate the dynamics of Src association with lipid and protein targets. J. Cell Biol. 178, 675–686 (2007). [DOI] [PMC free article] [PubMed] [Google Scholar]
- 35.Wolfenson H et al. A role for the juxtamembrane cytoplasm in the molecular dynamics of focal adhesions. PLoS ONE 4, e4304 (2009). [DOI] [PMC free article] [PubMed] [Google Scholar]
- 36.Molliex A et al. Phase separation by low complexity domains promotes stress granule assembly and drives pathological fibrillization. Cell 163, 123–133 (2015). [DOI] [PMC free article] [PubMed] [Google Scholar]
- 37.Nott TJ et al. Phase transition of a disordered nuage protein generates environmentally responsive membraneless organelles. Mol. Cell 57, 936–947 (2015). [DOI] [PMC free article] [PubMed] [Google Scholar]
- 38.Fan R, Kim NG & Gumbiner BM Regulation of Hippo pathway by mitogenic growth factors via phosphoinositide 3-kinase and phosphoinositide-dependent kinase-1. Proc. Natl Acad. Sci. USA 110, 2569–2574 (2013). [DOI] [PMC free article] [PubMed] [Google Scholar]
- 39.Kim NG & Gumbiner BM Adhesion to fibronectin regulates Hippo signaling via the FAK-Src-PI3K pathway. J. Cell Biol. 210, 503–515 (2015). [DOI] [PMC free article] [PubMed] [Google Scholar]
- 40.Totaro A, Panciera T & Piccolo S YAP/TAZ upstream signals and downstream responses. Nat. Cell Biol. 20, 888–899 (2018). [DOI] [PMC free article] [PubMed] [Google Scholar]
- 41.Yu FX et al. Regulation of the Hippo-YAP pathway by G-protein-coupled receptor signaling. Cell 150, 780–791 (2012). [DOI] [PMC free article] [PubMed] [Google Scholar]
- 42.Panciera T, Azzolin L, Cordenonsi M & Piccolo S Mechanobiology of YAP and TAZ in physiology and disease. Nat. Rev. Mol. Cell Biol. 18, 758–770 (2017). [DOI] [PMC free article] [PubMed] [Google Scholar]
- 43.Hergovich A The roles of NDR protein kinases in Hippo signalling. Genes 7, 21 (2016). [DOI] [PMC free article] [PubMed] [Google Scholar]
- 44.Chan SW et al. TEADs mediate nuclear retention of TAZ to promote oncogenic transformation. J. Biol. Chem. 284, 14347–14358 (2009). [DOI] [PMC free article] [PubMed] [Google Scholar]
- 45.Noland CL et al. Palmitoylation of TEAD transcription factors is required for their stability and function in Hippo pathway signaling. Structure 24, 179–186 (2016). [DOI] [PubMed] [Google Scholar]
- 46.Zhang H et al. TEAD transcription factors mediate the function of TAZ in cell growth and epithelial-mesenchymal transition. J. Biol. Chem. 284, 13355–13362 (2009). [DOI] [PMC free article] [PubMed] [Google Scholar]
- 47.Rausch V et al. The Hippo pathway regulates caveolae expression and mediates flow response via caveolae. Curr. Biol. 29, 242–255 (2019). [DOI] [PMC free article] [PubMed] [Google Scholar]
- 48.Misra JR & Irvine KD The Hippo signaling network and its biological functions. Annu. Rev. Genet. 52, 65–87 (2018). [DOI] [PMC free article] [PubMed] [Google Scholar]
- 49.Zhang L, Yue T & Jiang J Hippo signaling pathway and organ size control. Fly 3, 68–73 (2009). [DOI] [PMC free article] [PubMed] [Google Scholar]
- 50.Gill MK et al. A feed forward loop enforces YAP/TAZ signaling during tumorigenesis. Nat. Commun. 9, 3510 (2018). [DOI] [PMC free article] [PubMed] [Google Scholar]
- 51.Richardson HE & Portela M Tissue growth and tumorigenesis in Drosophila: cell polarity and the Hippo pathway. Curr Opin. Cell Biol. 48, 1–9 (2017). [DOI] [PubMed] [Google Scholar]
- 52.Zeng M et al. Phase transition in postsynaptic densities underlies formation of synaptic complexes and synaptic plasticity. Cell 166, 1163–1175 (2016). [DOI] [PMC free article] [PubMed] [Google Scholar]
- 53.Fang X et al. Arabidopsis FLL2 promotes liquid-liquid phase separation of polyadenylation complexes. Nature 569, 265–269 (2019). [DOI] [PMC free article] [PubMed] [Google Scholar]
- 54.Varelas X et al. TAZ controls Smad nucleocytoplasmic shuttling and regulates human embryonic stem-cell self-renewal. Nat. Cell Biol. 10, 837–848 (2008). [DOI] [PubMed] [Google Scholar]
- 55.Zhang JM et al. YAP-dependent induction of amphiregulin identifies a non-cell-autonomous component of the Hippo pathway. Nat. Cell Biol. 11, 1444–1450 (2009). [DOI] [PMC free article] [PubMed] [Google Scholar]
- 56.Kwon I et al. Phosphorylation-regulated binding of rna polymerase ii to fibrous polymers of low-complexity domains. Cell 155, 1049–1060 (2013). [DOI] [PMC free article] [PubMed] [Google Scholar]
- 57.Kato M et al. Cell-free formation of RNA granules: low complexity sequence domains form dynamic fibers within hydrogels. Cell 149, 753–767 (2012). [DOI] [PMC free article] [PubMed] [Google Scholar]
- 58.Hagenbeek TJ et al. The Hippo pathway effector TAZ induces TEAD-dependent liver inflammation and tumors. Sci. Signal. 11, eaaj1757 (2018). [DOI] [PubMed] [Google Scholar]
- 59.Lu H et al. Phase-separation mechanism for C-terminal hyperphosphorylation of RNA polymerase II. Nature 558, 318–323 (2018). [DOI] [PMC free article] [PubMed] [Google Scholar]
- 60.Plouffe SW et al. Characterization of Hippo pathway components by gene inactivation. Mol. Cell 64, 993–1008 (2016). [DOI] [PMC free article] [PubMed] [Google Scholar]
- 61.Zhu Q et al. SnoN antagonizes the Hippo kinase complex to promote TAZ signaling during breast carcinogenesis. Dev. Cell 37, 399–412 (2016). [DOI] [PMC free article] [PubMed] [Google Scholar]
- 62.Eisenberg S et al. Raft protein clustering alters N-Ras membrane interactions and activation pattern. Mol. Cell. Biol 31, 3938–3952 (2011). [DOI] [PMC free article] [PubMed] [Google Scholar]
- 63.Efron B & Tibshirani R in An Introduction to Bootstrap (eds Cox DR et al. ) 124–130 (Chapman & Hall, 1993). [Google Scholar]
- 64.Rashidian J et al. Ski regulates Hippo and TAZ signaling to suppress breast cancer progression. Sci. Signal. 8, ra14 (2015). [DOI] [PMC free article] [PubMed] [Google Scholar]
- 65.Dobin A et al. STAR: ultrafast universal RNA-seq aligner. Bioinformatics 29, 15–21 (2013). [DOI] [PMC free article] [PubMed] [Google Scholar]
- 66.Anders S, Pyl PT & Huber W HTSeq–a Python framework to work with high-throughput sequencing data. Bioinformatics 31, 166–169 (2015). [DOI] [PMC free article] [PubMed] [Google Scholar]
Associated Data
This section collects any data citations, data availability statements, or supplementary materials included in this article.
Supplementary Materials
Data Availability Statement
Source data for Figs. 1–4 and 6–8 and Extended Data Figs. 1, 3, 4 and 8 are available online. The RNA-seq data are available in the Gene Expression Omnibus (GEO) with the accession number GSE142474. All other data supporting the findings of this study are available from the corresponding author on reasonable request.