

Abstract
Although extreme heat exposure (EHE) was reported to be associated with increased risks of multiple diseases, little is known about the effects of EHE on pregnancy complications. We examined the EHE-pregnancy complications associations by lag days, subtypes, sociodemographic characteristics, and areas in New York State (NYS). We conducted a case-crossover analysis to assess the EHE-pregnancy complications associations in summer (June–August) and transitional months (May and September). All emergency department (ED) visits and hospital admissions due to pregnancy complications (ICD 9 codes: 630–649) from 2005 to 2013 in NYS were included. Daily mean temperature > 90th percentile of the monthly mean temperature in each county was defined as an EHE. We used conditional logistic regression while controlling for other weather factors, air pollutants and holidays to assess the EHE-pregnancy complications associations. EHE was significantly associated with increased ED visits for pregnancy complications in summer (ORs ranged: 1.01–1.04 from lag days 0–5). There was also a significant and stronger association in transitional months (ORs ranged: 1.02–1.06, Lag 0). Furthermore, we found EHE affected multiple subtypes of pregnancy complications, including threatened/spontaneous abortion, renal diseases, infectious diseases, diabetes, and hypertension (ORs range: 1.13–1.90) during transitional months. A significant concentration response effect between the number of consecutive days of EHE and ED visits in summer (P for trend <0.001), ED visits in September (P for trend =0.03), and hospital admission in May (P for trend<0.001) due to pregnancy complications was observed, respectively. African Americans and residents in lower socioeconomic position (SEP) counties were more susceptible to the effects of EHE. In conclusion, we found an immediate and prolonged effect of EHE on pregnancy complications in summer and a stronger, immediate effect in transitional months. These effects were stronger in African Americans and counties with lower SEP. Earlier warnings regarding extreme heat are recommended to decrease pregnancy complications.
Keywords: Heat, Hot, Temperature, Transitional months, Pregnancy complications
GRAPHICAL ABSTRACT

1. Introduction
Climate change has increased the frequency and intensity of both ambient temperatures and heatwaves in recent decades (Crimmins et al., 2016). Heat exposure causes a substantial economic burden on healthcare systems (Wondmagegn et al., 2019). These heat-related healthcare costs are likely to increase as extreme heat exposure (EHE) becomes more frequent, severe, and geographically widespread as a result of the changing climate (Wondmagegn et al., 2019).
EHE has been shown to relate to a wide spectrum of human health issues, such as cardiovascular disease (CVD) (Bayram et al., 2017; De Blois et al., 2015), renal disease (Fletcher et al., 2012), respiratory diseases (Lin et al., 2012), waterborne and foodborne diseases (Lin et al., 2016), and overall excess mortality (Limaye et al., 2018). In addition, more recent research has linked heatwaves with increased incidence of depression and other mental health disorders (Thompson et al., 2018). Perhaps most alarming is the impact that EHE has on reproductive outcomes, including preterm birth, stillbirth, and low birth weight (Bekkar et al., 2020; Lawrence et al., 2020; Zhang et al., 2017; Zhong et al., 2018) and debilitating birth defects, such as congenital heart disease (Agay-Shay et al., 2013; Auger et al., 2017b; Konkel, 2019; Lin et al., 2018; Zhang et al., 2019) and neural tube defects (Auger et al., 2017a; Van Zutphen et al., 2012).
While multiple prior studies have examined the effects of EHE on the risk of multiple health conditions, only a few studies have evaluated the association between EHE and selected phenotypes of pregnancy complications, including premature rupture of membrane (Ha et al., 2018; Song et al., 2019; Yackerson et al., 2008), miscarriage (Asamoah et al., 2018; Sun et al., 2020), placental abruption (He et al., 2018), early labor (Bekkar et al., 2020; Beltran et al., 2013; Ha et al., 2017b; Lajinian et al., 1997), hypertension in pregnancy (preeclampsia, eclampsia and gestational hypertension) (Beltran et al., 2013; Cil and Cameron, 2017; Xiong et al., 2020), and uterine bleeding during pregnancy (Cil and Cameron, 2017). Despite such findings, there is no research systematically examining the association between EHE and total pregnancy complications and all the detailed phenotypes, particularly by lag-days and socioeconomic characteristics, highlighting the need for further research.
To fill these knowledge gaps, this study examined whether EHE is associated with emergency department (ED) visits and hospital admissions due to total pregnancy complications in summer (June–August) and transitional months (May and September). Specifically, the EHE-pregnancy complications associations were evaluated on different lag days, by subtypes, by various sociodemographic characteristics, and in different geographic areas in New York State (NYS). It is essential to systematically identify any EHE-pregnancy complication associations to develop evidence-based interventions, especially considering the projected increase in EHE, the already high prevalence of pregnancy complications in pregnant women (46.9%), and all associated resource utilization (Law et al., 2015).
2. Materials and methods
2.1. Population and study design
Our study population was identified from the New York Statewide Planning and Research Cooperative System (SPARCS), a legislatively mandated database covering over 95% of hospital records in NYS (Zhang et al., 2018). We retained hospital admissions and ED visits reporting with a principal diagnosis of pregnancy complication (International Classification of Diseases 9 (ICD-9): 630–649) between January 1, 2005 and December 31, 2013.
We used a case-crossover design, which is appropriate for case-only data, especially when the outcome is acute and the exposure is brief and transient (Maclure, 1991). A time-stratified approach was used for reference selection, with each month serving as a referent window for the cases within the month (Janes et al., 2005). Referent dates were all dates at 1, 2, and 3 weeks before and/or after the index (case) date (Fletcher et al., 2012; Rich et al., 2019; Zhang et al., 2018). In a case-crossover analysis, cases serve as their own controls and, therefore, potential socio-demographic confounders and inherited factors are automatically controlled for by this study design compared to other methods.
2.2. Outcomes
We focused on the acute and severe exacerbation rather than chronic occurrence of pregnancy complications by including all the ED and hospital admissions with principal diagnoses as follows: threatened or spontaneous abortion (ICD9: 634, 640), early or threatened labor (644), hypertension complications (642), infections of genitourinary tract (646.6), renal diseases (646.2), diabetes mellitus (648.0, 648.8), mental illness (648.4), cardiovascular diseases in pregnancy (648.5, 648.6), antepartum hemorrhage abruption placentae and placenta previa (641), and other infectious and parasitic conditions (647).We used principal diagnoses, which were discharged diagnoses with laboratory testing and final confirmation, and these were defined according to the international standardized ICD-9 codes (640–649). “Non-principal diagnoses” have not been used to define the outcomes in this study as some pregnancy complications could be chronic and, therefore, should not been used to link with transient heat exposure based on biological plausibility. The chronic effect of extreme heat exposure on health will be examined in a future study.
2.3. Exposure definition
Daily weather data at the county level was obtained from the US Environmental Protection Agency (EPA) and the US National Oceanic and Atmospheric Administration (NOAA). For each county in each month (throughout the study years), we identified the 90th percentiles among the daily average temperature and defined the days with a mean temperature above this cutoff point as EHE days (i.e., 1) while all others were defined as common days (i.e., 0). We used 90th percentile as the threshold to define extreme heat because it was most frequently used in previous studies assessing the effect of extreme heat on health outcomes (D’Ippoliti et al., 2010; Gronlund et al., 2014; Ha et al., 2017a, 2017b; Heo et al., 2019; Tobías et al., 2014; Williams et al., 2012; Zhang et al., 2017). In addition, using the 90th percentile ensured an apprpriate trade-off between a sufficiently large sample for analysis and potential exposure misclassification. EHE was also defined based on the daily average temperature of 0, 1, 2, 3, 4, 5, and 6 days prior to the case or control days and on the moving average of the daily average temperature during the previous 0–1, 0–2, 0–3, 0–4, 0–5, and 0–6 days. We used lags up to 6 days for the following reasons: 1) This study focused on acute and severe exacerbation of pregnancy complications rather than chronic occurrence of these complications; 2) To include all acute and severe cases, our study included the cases from both ED visits and hospital admission with a principal diagnosis of one of these pregnancy complications; 3) We used a case-crossover analysis, a method for studying the acute or transient effects of environmental events, which usually examines the effects of exposure within one week; and 4) Based on the results, we observed that the effect of extreme heat on these pregnancy complications vanished after lag 5 day, both in summer and in the transitional months. Thus, we determined that lags up to 6 days may be enough and appropriate to address the immediate or acute effect of extreme heat on the exacerbation of pregnancy complications. To examine the potential concentration response relationship between pregnancy complications and the number of consecutive EHE days, we converted the dichotomized indicator of EHE days to an ordinary variable indicating the order (i.e., 1st, 2nd, etc.) of each day in consecutive days of EHE. We then assigned the ordered EHE days to the cases and controls according to location (i.e., county) and dates.
2.4. Statistical analysis and confounders
We used conditional logistic regression for the EHE-pregnancy complication association assessment. Specifically, we regressed the case day/control day status against the EHE indicator (0/1 or an ordinary variable indicating the number of prior consecutive days in an EHE event), while controlling for confounders including air pressure, wind speed, rainfall, and relative humidity. We also adjusted for the confounding effect of ambient fine particulate matter PM2.5 and ozone concentrations (CMAQ, available at https://www.epa.gov/cmaq) and holidays in the model. In this comprehensive study, we stratified our estimates by 1) admission type: hospitalization admissions or ED visits, 2) month (May, June–August, September), 3) lag days (0–6 days separately and cumulatively), 4) subtypes of pregnancy complications as described above, and 5) multiple sociodemographic characteristics including age, ethnicity, race, and insurance source. We also generated a map displaying the spatial heterogeneity of EHE impacts. In addition, sensitivity analyses were conducted by 1) using a different study design and analysis, i.e., time series analysis using general additive model (GAM) (Ravindra et al., 2019); 2) defining EHE exposure by different percentile, i.e., 90th, 95th, and 97.5th percentile of the daily mean temperature in each month of each county; 3) defining EHE exposure based on seasonal temperature (summer) distribution instead of monthly temperature distribution. We completed geocoding using the Street and Address Maintenance Program in ArcGIS 10.3.1 (The NYS GIS Program Office, 2017) and accomplished all analyses with R 3.4.1.
3. Results
As is shown in Table 1, EHE in summer (June to August) was significantly associated with increased ED visits for pregnancy complications (odds ratios (ORs) ranged from 1.00 to 1.02). In particular, the effect of EHE on ED visits for pregnancy complications lasted for 5 days and there was a cumulative effect of EHE on pregnancy complications (ORs for cumulative lags: 1.01–1.04). EHE in transitional months (May and September) was also associated with increased ED visits and hospital admissions for pregnancy complications, and the effect tended to occur on the same day of exposure (ED visits in May on lag-0 day: OR = 1.02, 95% confidence interval (CI): 1.00–1.04; ED visits in September on lag-0 day: OR = 1.03, 95%CI: 1.00–1.05; hospital admission in May on lag-0 day: OR = 1.06, 95%CI: 1.02–1.09; hospital admission in September on lag-0 day: OR = 1.02, 95%CI: 0.99–1.05). In addition, EHE in May had a stronger effect on hospital admissions for pregnancy complications compared to summer.
Table 1.
Associations between extreme heat exposure and number of emergency department visits and hospital admissions due to pregnancy complications, NY, 2005–2013a,b
| Lags | May | June to August | September |
|---|---|---|---|
| Emergency department visit (Lag) (Total Case N = 1,934,918) | Case (N = 163,538) |
Case (N = 495,526) |
Case (N = 160,087) |
| 0 | 1.02 (1.00–1.04) | 1.02 (1.00–1.03) | 1.03 (1.00–1.05) |
| 1 | 0.96 (0.94–0.98) | 1.02 (1.01–1.04) | 1.01 (0.99–1.03) |
| 2 | 1.00 (0.97–1.02) | 1.02 (1.01–1.03) | 1.02 (1.00–1.04) |
| 3 | 0.98 (0.95–1.00) | 1.01 (1.00–1.03) | 1.02 (1.00–1.04) |
| 4 | 1.00 (0.97–1.03) | 1.01 (1.00–1.02) | 1.01 (0.99–1.03) |
| 5 | 0.99 (0.96–1.02) | 1.01 (1.00–1.02) | 0.99 (0.97–1.00) |
| 6 | 0.97 (0.94–1.00) | 1.00 (0.99–1.01) | 0.97 (0.95–0.99) |
| 0–1 | 1.01 (0.98–1.03) | 1.03 (1.02–1.05) | 1.00 (0.97–1.02) |
| 0–2 | 0.99 (0.96–1.02) | 1.03 (1.01–1.05) | 1.01 (0.99–1.04) |
| 0–3 | 0.98 (0.96–1.01) | 1.04 (1.02–1.05) | 1.00 (0.97–1.02) |
| 0–4 | 1.01 (0.98–1.04) | 1.03 (1.01–1.05) | 1.01 (0.98–1.03) |
| 0–5 | 1.00 (0.97–1.03) | 1.01 (0.99–1.03) | 1.00 (0.97–1.02) |
| 0–6 | 1.01 (0.97–1.04) | 0.99 (0.98–1.02) | 0.99 (0.96–1.01) |
| Lags | May | June to August | September |
| Hospital Admission (Lag) (Total Case N = 835,465) |
Case (N = 69,877) |
Case (N = 214,602) |
Case (N = 70,696) |
| 0 | 1.06 (1.02–1.09) | 0.99 (0.98–1.01) | 1.02 (0.99–1.05) |
| 1 | 0.94 (0.91–0.98) | 1.00 (0.98–1.02) | 0.98 (0.94–1.01) |
| 2 | 0.96 (0.93–1.00) | 1.00 (0.98–1.02) | 0.98 (0.95–1.01) |
| 3 | 0.97 (0.93–1.01) | 1.01 (0.99–1.03) | 1.00 (0.97–1.03) |
| 4 | 0.97 (0.92–1.01) | 1.00 (0.98–1.02) | 1.00 (0.97–1.03) |
| 5 | 1.00 (0.95–1.05) | 1.01 (0.99–1.03) | 0.96 (0.93–0.99) |
| 6 | 0.93 (0.88–0.98) | 1.00 (0.99–1.02) | 0.93 (0.90–0.95) |
| 0–1 | 0.99 (0.96–1.03) | 1.01 (0.98–1.03) | 0.98 (0.94–1.01) |
| 0–2 | 0.96 (0.92–1.00) | 1.00 (0.97–1.03) | 0.98 (0.94–1.01) |
| 0–3 | 1.00 (0.95–1.04) | 1.01 (0.98–1.04) | 0.93 (0.90–0.97) |
| 0–4 | 0.99 (0.94–1.04) | 1.00 (0.98–1.03) | 0.96 (0.92–1.00) |
| 0–5 | 0.96 (0.91–1.01) | 0.99 (0.96–1.02) | 0.95 (0.91–0.99) |
| 0–6 | 1.00 (0.95–1.06) | 0.98 (0.95–1.02) | 0.95 (0.91–0.99) |
Adjusted for holiday, PM2.5, ozone, station pressure, wind speed, rainfall, and relative humidity.
Extreme heat exposure was defined as daily temperature above 90th percentiles of the monthly Tmean in each county.
Fig. 1 shows the relationship between risk of ED visits and hospital admissions due to pregnancy complications and number of consecutive EHE days. We found a significant concentration response effect between the number of consecutive days of EHE and ED visits in summer (P for trend <0.001), ED visits in September (P for trend =0.03), and hospital admission in May (P for trend<0.001) due to pregnancy complications. The significantly higher risk of ED visits for pregnancy complications was observed on the 4th day of consecutive EHE in summer (OR = 1.10, 95%CI: 1.05–1.16). Furthermore, the significantly higher risk for hospital admissions and ED visits for pregnancy complications occurred on the 6th and 3rd day of consecutive EHE in May and September, respectively. Generally, risk of pregnancy complications increased significantly after 3 consecutive days of EHE, both in summer and in transitional months (Table A.1).
Fig. 1.
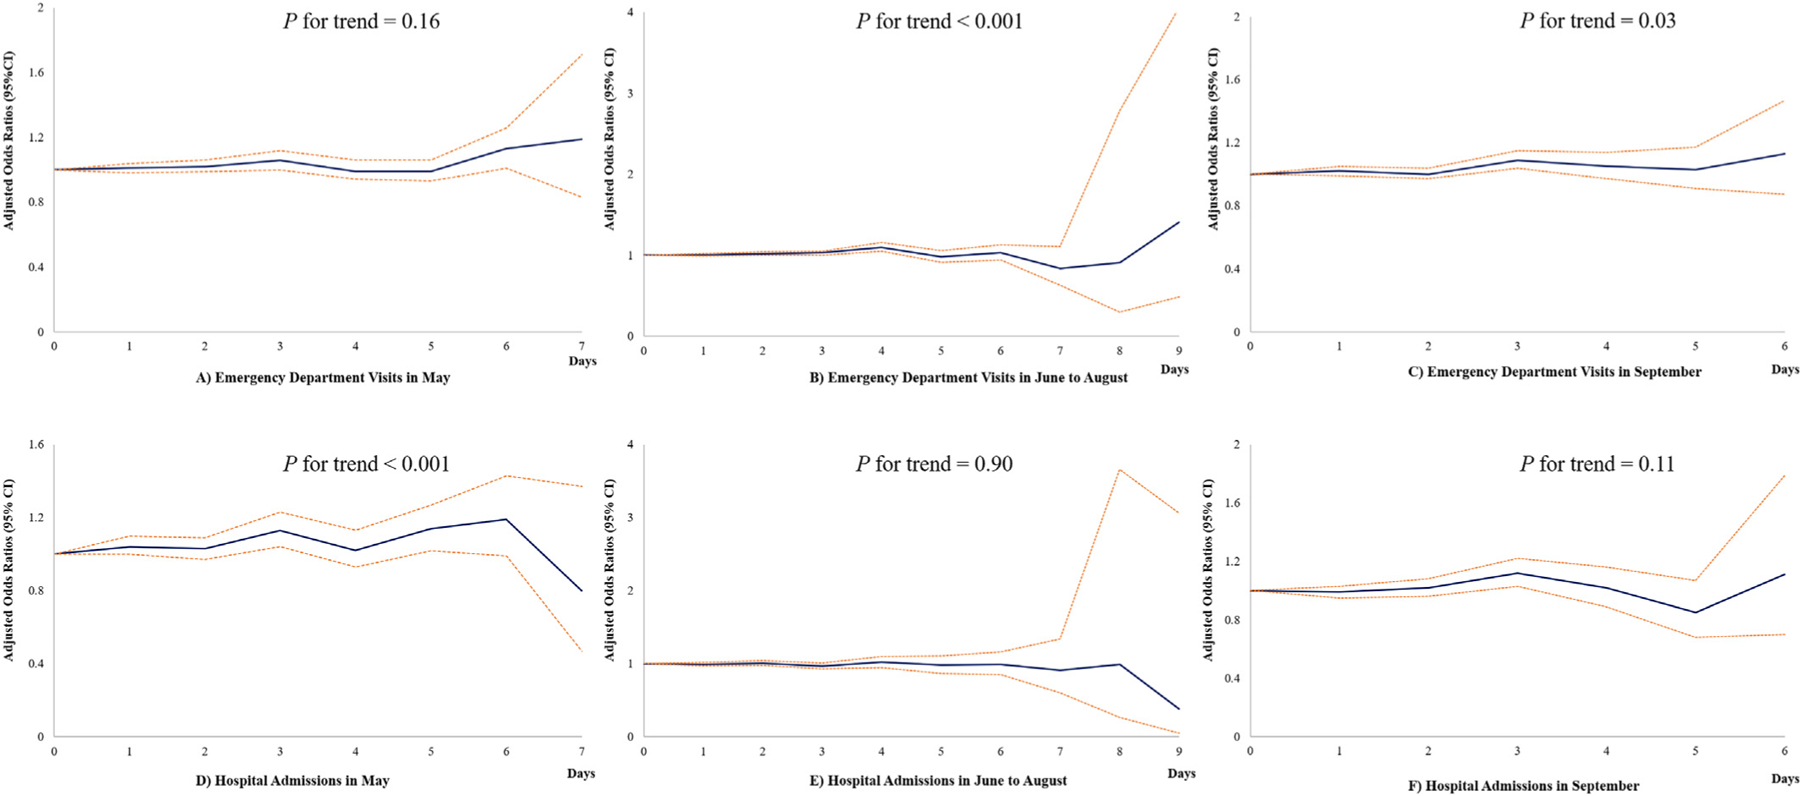
Adjusted odds ratios and 95% confidence intervals of the associations between number of consecutive days with extreme heat exposure and emergency department visits and hospital admissions due to pregnancy complications, NY, 2005–2013 a,b a Adjusted for holiday, PM2.5, ozone, station pressure, wind speed, rainfall, and relative humidity; b Extreme heat exposure was defined as daily temperature above 90th percentiles of the monthly Tmean in each county.
The associations between EHE and ED visits and hospital admissions due to various subtypes of pregnancy complications are presented in Table 2. EHE was marginally, but consistently, associated with increased risk of threatened/spontaneous abortion in summer and transitional months (May: OR = 1.03, 95%CI: 0.99–1.09; summer: OR = 1.02, 95% CI: 0.99–1.05; September: OR = 1.05, 95%CI: 1.00–1.11). In May, EHE was associated with immediate increases in ED visits for renal disease (OR = 1.90, 95%CI: 1.19–3.04), infectious and parasitic diseases (OR = 1.29, 95%CI: 1.05–1.58), and diabetes mellitus (OR = 1.17, 95% CI: 1.01–1.36). In May, EHE was also associated with an immediate increase in hospital admissions for diabetes mellitus (OR = 1.22, 95%CI: 1.08–1.39). Meanwhile, in September, EHE was associated with an immediate increase in ED visits due to hypertension complications (OR = 1.13, 95%CI: 1.02–1.25).
Table 2.
Associations between extreme heat exposure and emergency department visits and hospital admissions due to pregnancy complications, by subtypes, NY, 2005–2013a,b,c.
| Subtypes | ICD 9 code | May |
June–August |
September |
|||
|---|---|---|---|---|---|---|---|
| Case N | aORs | Case N | aORs | Case N | aORs | ||
| Emergency department visit Threatened or spontaneous abortion |
634,640 |
30,094 |
1.03 (0.99–1.09) |
90,378 |
1.02 (0.99–1.05) |
28,325 |
1.05 (1.00–1.11) |
| Early or threatened labor | 644 | 19,690 | 1.00 (0.94–1.06) | 61,766 | 1.01 (0.97–1.04) | 19,863 | 1.03 (0.97–1.09) |
| Hypertension disorders | 642 | 6850 | 1.07 (0.96–1.19) | 20,333 | 0.93 (0.87–0.99) | 6849 | 1.13 (1.02–1.25) |
| Infections of genitourinary tract | 646.6 | 9473 | 1.01 (0.92–1.10) | 30,405 | 1.02 (0.97–1.07) | 9725 | 1.00 (0.92–1.08) |
| Renal diseases | 646.2 | 292 | 1.90 (1.19–3.04) | 861 | 0.79 (0.59–1.06) | 279 | 0.98 (0.61–1.59) |
| Diabetes mellitus | 648.0,648.8 | 3307 | 1.17 (1.01–1.36) | 10,644 | 0.96 (0.89–1.04) | 3547 | 1.07 (0.93–1.23) |
| Mental illness | 648.4 | 1397 | 0.94 (0.75–1.19) | 4384 | 1.02 (0.89–1.16) | 1353 | 1.18 (0.93–1.48) |
| Cardiovascular diseases | 648.5648.6 | 389 | 0.68 (0.42–1.09) | 1098 | 1.07 (0.84–1.38) | 368 | 0.96 (0.60–1.54) |
| Antepartum hemorrhage abruption placentae and placenta previa | 641 | 3702 | 1.15 (0.99–1.33) | 11,273 | 1.00 (0.92–1.08) | 3561 | 0.96 (0.83–1.10) |
| Other infectious and parasitic conditions | 647 | 1679 | 1.29 (1.05–1.58) | 4774 | 0.89 (0.78–1.01) | 1643 | 0.95 (0.77–1.17) |
| Hospital admission Threatened or spontaneous abortion |
634,640 |
176 |
1.37 (0.69–2.73) |
581 |
0.70 (0.47–1.05) |
175 |
0.78 (0.41–1.47) |
| Early or threatened labor | 644 | 8193 | 1.02 (0.92–1.12) | 24,796 | 1.03 (0.97–1.09) | 7802 | 1.06 (0.96–1.16) |
| Hypertension disorders | 642 | 9233 | 1.02 (0.93–1.12) | 27,192 | 0.98 (0.92–1.03) | 8921 | 1.04 (0.95–1.14) |
| Infections of genitourinary tract | 646.6 | 1591 | 0.87 (0.69–1.09) | 5189 | 1.00 (0.89–1.13) | 1717 | 0.98 (0.81–1.19) |
| Renal diseases | 646.2 | 232 | 1.70 (0.98–2.95) | 693 | 0.97 (0.70–1.35) | 207 | 0.99 (0.55–1.78) |
| Diabetes mellitus | 648.0,648.8 | 4550 | 1.22 (1.08–1.39) | 14,363 | 1.00 (0.93–1.07) | 4899 | 1.02 (0.91–1.15) |
| Mental illness | 648.4 | 1030 | 0.94 (0.73–1.23) | 3256 | 1.08 (0.93–1.26) | 1003 | 1.29 (0.99–1.67) |
| Cardiovascular diseases | 648.5648.6 | 385 | 0.96 (0.59–1.54) | 1189 | 0.84 (0.66–1.09) | 377 | 0.99 (0.63–1.54) |
| Antepartum hemorrhage abruption placentae and placenta previa | 641 | 2282 | 1.18 (0.98–1.42) | 6886 | 0.98 (0.88–1.09) | 2212 | 0.99 (0.83–1.17) |
| Other infectious and parasitic conditions | 647 | 1138 | 1.11 (0.86–1.43) | 3371 | 0.84 (0.72–0.98) | 1133 | 0.81 (0.63–1.05) |
Adjusted for holiday, PM2.5, ozone, station pressure, wind speed, rainfall, and relative humidity.
Extreme heat exposure was defined as daily temperature above 90th percentiles of the monthly Tmean in each county.
Associations between extreme heat exposure and pregnancy complications were assessed on the same day of exposure.
Table 3 presents the associations between EHE and ED visits and hospital admissions due to pregnancy complications according to different patient characteristics. Risk of ED visits due to pregnancy complications increased significantly in non-Hispanic (ORs ranged from 1.02 to 1.03) and African Americans (ORs ranged from 1.02 to 1.04) pregnant women in summer and in transitional months. The associations between EHE and hospital admissions of pregnancy complications in May were also significantly stronger among non-Hispanic (OR = 1.06, 95%CI: 1.02–1.10) and African Americans (OR = 1.08, 95%CI: 1.00–1.17) participants.
Table 3.
Associations between extreme heat exposure and emergency department visits and hospital admissions due to pregnancy complications, by patient characteristics, NY, 2005–2013a,b.
| Characteristics | May |
June–August |
September |
|||
|---|---|---|---|---|---|---|
| Case N | aORs | Case N | aORs | Case N | aORs | |
| Emergency department visit | ||||||
| Age (years) | ||||||
| < 20 | 19,105 | 0.96 (0.90–1.03) | 57,784 | 1.02 (0.98–1.06) | 18,645 | 1.01 (0.95–1.08) |
| 20–30 | 89,051 | 1.02 (0.99–1.05) | 270,821 | 1.02 (1.00–1.04) | 87,277 | 1.01 (0.98–1.04) |
| 30–35 | 37,119 | 1.03 (0.99–1.08) | 111,683 | 1.00 (0.97–1.02) | 36,438 | 1.07 (1.03–1.12) |
| > 35 | 18,263 | 1.04 (0.97–1.10) | 55,238 | 1.02 (0.98–1.06) | 17,727 | 1.03 (0.97–1.10) |
| Ethnic | ||||||
| Spanish/hispanic origin | 40,344 | 0.99 (0.95–1.04) | 122,187 | 1.00 (0.98–1.03) | 39,284 | 1.02 (0.98–1.06) |
| Others | 123,194 | 1.03 (1.00–1.05) | 373,339 | 1.02 (1.01–1.03) | 120,803 | 1.03 (1.00–1.05) |
| Race | ||||||
| White | 58,671 | 1.04 (1.00–1.08) | 177,063 | 1.01 (0.99–1.03) | 57,922 | 1.00 (0.96–1.04) |
| African Americans | 51,781 | 1.03 (0.99–1.07) | 156,415 | 1.02 (1.00–1.04) | 49,245 | 1.04 (1.01–1.08) |
| Others | 53,086 | 0.99 (0.95–1.03) | 162,048 | 1.02 (1.00–1.04) | 52,920 | 1.04 (1.00–1.08) |
| Insurance | ||||||
| Self-pay | 14,009 | 1.04 (0.97–1.11) | 48,197 | 1.00 (0.96–1.04) | 16,016 | 1.07 (1.00–1.14) |
| Medicaid | 32,283 | 1.02 (0.97–1.07) | 101,166 | 1.03 (1.00–1.05) | 32,841 | 1.01 (0.96–1.06) |
| Others | 117,246 | 1.02 (0.99–1.04) | 346,163 | 1.01 (1.00–1.03) | 111,230 | 1.03 (1.00–1.05) |
| Hospital admission | ||||||
| Age (years) | ||||||
| < 20 | 5155 | 1.00 (0.89–1.14) | 16,110 | 1.00 (0.93–1.07) | 5297 | 0.96 (0.86–1.08) |
| 20–30 | 34,390 | 1.07 (1.02–1.12) | 105,451 | 0.98 (0.96–1.01) | 34,739 | 1.02 (0.97–1.06) |
| 30–35 | 21,006 | 1.05 (0.99–1.12) | 64,395 | 0.99 (0.96–1.03) | 21,226 | 1.02 (0.97–1.08) |
| > 35 | 9326 | 1.07 (0.97–1.17) | 28,646 | 1.02 (0.97–1.08) | 9434 | 1.04 (0.95–1.13) |
| Ethnic | ||||||
| Spanish/hispanic origin | 11,061 | 1.03 (0.95–1.11) | 34,355 | 0.99 (0.94–1.03) | 11,294 | 0.99 (0.92–1.07) |
| Others | 58,816 | 1.06 (1.02–1.10) | 180,247 | 1.00 (0.98–1.02) | 59,402 | 1.02 (0.99–1.06) |
| Race | ||||||
| White | 31,764 | 1.06 (1.01–1.11) | 96,051 | 0.99 (0.96–1.02) | 31,282 | 0.97 (0.93–1.02) |
| African Americans | 12,513 | 1.08 (1.00–1.17) | 39,150 | 0.98 (0.94–1.02) | 12,820 | 1.06 (0.98–1.14) |
| Others | 25,600 | 1.03 (0.97–1.09) | 79,401 | 1.01 (0.98–1.05) | 26,594 | 1.05 (1.00–1.10) |
| Insurance | ||||||
| Self-pay | 1609 | 1.00 (0.81–1.24) | 5164 | 1.09 (0.96–1.23) | 1749 | 0.85 (0.69–1.04) |
| Medicaid | 15,504 | 1.07 (1.00–1.15) | 48,241 | 0.97 (0.93–1.01) | 15,963 | 0.99 (0.93–1.06) |
| Others | 52,764 | 1.05 (1.01–1.09) | 161,197 | 1.00 (0.98–1.02) | 52,984 | 1.03 (0.99–1.07) |
Adjusted for holiday, PM2.5, ozone, station pressure, wind speed, rainfall, and relative humidity.
Extreme heat exposure was defined as daily temperature above 90th percentiles of the monthly Tmean in each county.
Fig. 2 and Table A.2 shows the associations between EHE and ED visits and hospital admissions due to pregnancy complications in different counties of NYS. In transitional months (May and September), EHE was significantly associated with increased risks of ED visits due to pregnancy complications in Chemung, Clinton, Erie, Genesee, Greene, Jefferson, Nassau, Oneida, Orleans, New York city, and Queens (ORs ranged from 1.08 to 1.99). In addition, in May and summer, EHE was significantly associated with increased risks of hospital admissions due to pregnancy complications in Cattaraugus, Dutchess, Franklin, Hamilton, Monroe, Niagara, Rensselaer, Rockland, Schoharie, and Westchester (ORs ranged from 1.12 to 46.23). We summarized the socioeconomic position (SEP), including the percentage of labor force unemployed, percentage of population in poverty, and percentage of population aged 25 years and older with less than a high school degree of these counties in NYS (Table A.3). Most of these counties are considered lower SEP.
Fig. 2.
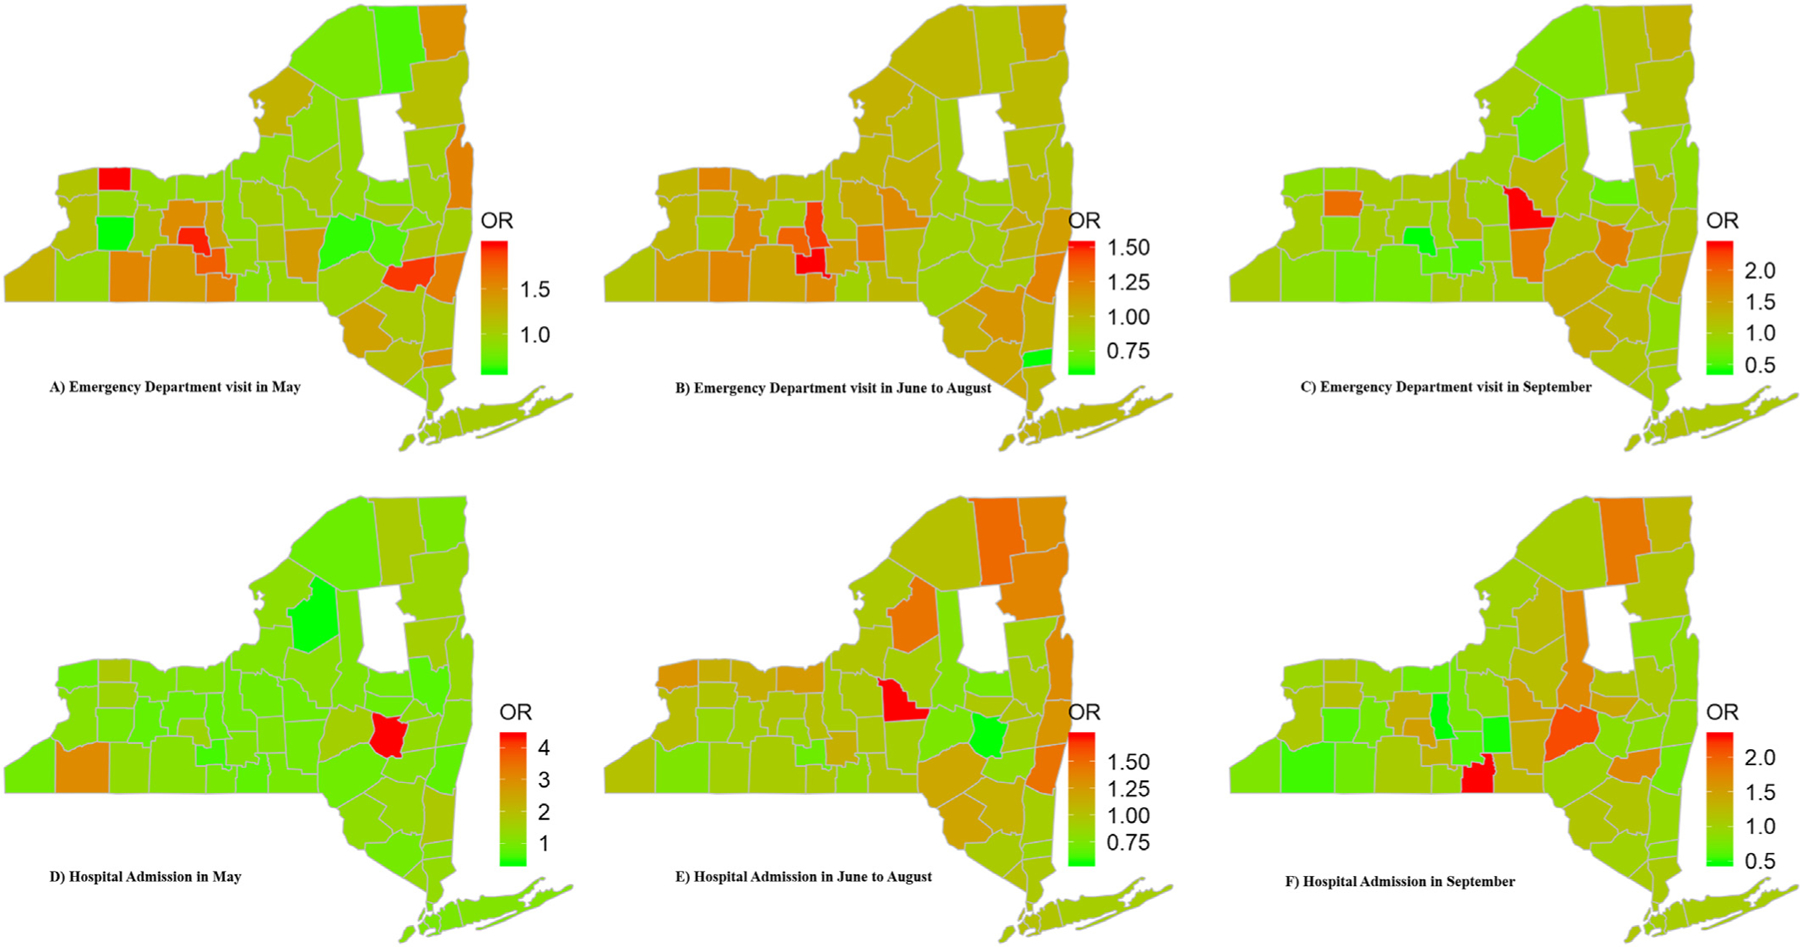
Associations between extreme heat exposures and emergency department visits and hospital admissions due to pregnancy complications, by county of New York State, 2005–2013a,b,c a Adjusted for holiday, PM2.5, ozone, station pressure, wind speed, rainfall, and relative humidity; b Extreme heat exposure was defined as daily temperature above 90th percentiles of the monthly Tmean in each county; c Data in Hamilton was deleted because of the very limited case number (<30) there. That’s why it is blank of Hamilton on the map.
Results of sensitivity analyses were presented in Tables A.4–A.6. We found even stronger effects of EHE on pregnancy complications when using time series analysis (GAM) (Table A.4). When defining EHE as a whole year daily average temperature exceeding the 90th, 95th, and 97.5th percentiles of the average temperature in each month of each county, we found that EHE was associated with increased ED visits of threatened/spontaneous abortion and early/threatened labor (Table A.5). When defining EHE using 90th percentile thresholds of seasonal average temperature in summer, we found similar effects of EHE on ED visits and hospital admissions due to pregnancy complications to the main analyses (Table A.6).
4. Discussion
4.1. EHE and pregnancy complications in summer
We found that EHE during summer was significantly associated with 1–2% excess risk of ED visits due to total pregnancy complications. Such adverse effects lasted for 5 days and the strongest cumulative effect occurred on 0‐3 days after EHE (4%). There was a concentration response effect of EHE on ED visits due to pregnancy complications in summer. Total pregnancy complications have been linked to high temperature in only one previous study. This was a case-crossover study from Charlottesville, Virginia, the US (Davis and Novicoff, 2018). They defined heatwave days as at least three consecutive days with temperature equal to or exceeding 35 °C, which is the 89th percentile, and compared ED visits between heatwave days and control days during warm seasons (April to September). Although no ORs were available in this study, they found a significant increase in ED visits for total pregnancy complications on lag-0 day of heatwave exposure (mean difference of ED visits in heatwave days case and control days = 0.4, 95% CI: 0–0.8, P = 0.034). Other previous studies only focused on 1 to 2 subtypes of pregnancy complication and found positive associations between EHE and selected subtypes (more detail will be described later) (Asamoah et al., 2018; Bekkar et al., 2020; Beltran et al., 2013; Cil and Cameron, 2017; Ha et al., 2017b, 2018; He et al., 2018; Lajinian et al., 1997; Song et al., 2019; Sun et al., 2020; Xiong et al., 2020; Yackerson et al., 2008). The effect estimates (e.g., ORs) of EHE on these subtypes of pregnancy complications ranged from 1.01 to 1.53, which is consistent with our findings.
The mechanisms by which maternal heat exposure contributes to pregnancy complications is not clear. Animal studies suggest that heat exposure during early pregnancy could interfere with normal protein synthesis through the production of heat-shock proteins (Bennett, 2010). Previous research on non-pregnant populations shows that circulating levels of markers of inflammation and oxidative stress are associated with ambient temperatures (Halonen et al., 2010; Kahle et al., 2015; Wu et al., 2017). This mechanism could potentially be applied to pregnant women.
Unlike for ED visits, we did not observe a similar significant association between EHE and hospital admission for pregnancy complications in summer. However, the estimates were just on the borderline. Fewer hospital admission cases compared to that from ED visits could contribute to the difference. Meanwhile, ED visits are less influenced by hospital admission policy and catch more moderate to severe cases rather than only the severe cases (hospitalized cases).
4.2. Impact of EHE on pregnancy complications in transitional months
We found a significant, immediate effect of EHE in transitional months (May and September) on pregnancy complications, for both ED visits and hospital admissions. These harmful effects were stronger than in summer. Also, in contrast to summer, the effect of EHE in transitional months tended to be immediate and did not last after the day of exposure. Previous studies assessing the associations between EHE and pregnancy complications usually combine transitional months with summer into warm seasons (April–September or May–September). The effect of EHE on pregnancy complications in transitional months and in summer is seldomly studied separately. However, a large US population-based, case-control study found that EHE in spring, but not summer, was significantly associated with selected congenital heart disease phenotypes (Lin et al., 2018). High temperature may trigger a stronger response during transitional months for pregnant women due to lack of physical and behavioral adaptation to sudden temperature changes (i.e., no use of fans and air conditioner, more outdoor activities, and no early heat warning for pregnant women) (Lin et al., 2018; Loughnan et al., 2014; Schifano et al., 2012). These results highlight the importance and potential effectiveness of early warnings against EHE in transitional months for pregnant women.
4.3. Associations between EHE and subtypes of pregnancy complications
For pregnancy complication subtypes, we found that EHE was consistently associated with increased ED visits of threatened/spontaneous abortion in both summer and transitional months. More subtypes, including renal disease (90% excess risk), following by infectious and parasitic conditions (29%), diabetes mellitus (17%–22%), and hypertension (13%) were significantly associated with EHE in transitional months compared to in summer. These complications tend to be acute exacerbations of chronic disease. There were no previous studies evaluating the effect of EHE on subtypes of pregnancy complications in translational months.
A consistently significant association (2–5% increase) between EHE and threatened/spontaneous abortion in both summer and transitional months was observed in the current study. Previous studies also reported a positive association between heat exposure and miscarriage (spontaneous abortion) (Asamoah et al., 2018; Sun et al., 2020). Asamoah et al. (2018) found a just outside two-sided statistical significant ORs (1.12, 95% CI: 0.90–1.39) of having a stillbirth or miscarriage with each additional degree increase in the wet-bulb globe temperature.24 Sun et al. (2020) found that days of extreme heat were associated with a relative risk of preterm birth of 1.03 (95% CI: 1.02, 1.04) over the subsequent four days.25 Potential mechanisms for the association between EHE and threatened/spontaneous abortion may include (Sun et al., 2020): 1) EHE leads to maternal dehydration and decreased flow of uterine blood to the fetus; 2) EHE may result in damage to cells, the placenta, and the vascular system, which may cause insufficient fetal nutrition and other detrimental effects; and/or 3) the inflammatory process and production of oxytocin and prostaglandin triggered by EHE could lead to threatened/spontaneous abortion.
We found that excess risk for renal disease complications increased most in response to EHE (90%). Although no direct evidence was available to compare, increasing temperature was previously linked to higher risk of renal disease among general population (Borg et al., 2017; Fletcher et al., 2012). Borg et al. (2017) found that a 1 °C increase in daily minimum temperature was associated with a 0.3% to 3.7% increase in daily ED visits for subtypes of renal disease in the general population (Borg et al., 2017). The other case-crossover study from NYS observed an overall 9% higher odds of hospitalization for acute renal failure per 5 °F (2.78 °C) increase of mean temperature on a 1-day lag (Fletcher et al., 2012). Our estimates seem to be higher than in these two studies, which may implicate a much stronger effect of EHE on the exacerbation of renal disease in pregnant women (Wiles et al., 2019). The association between EHE and renal disease could be the result of disrupted fluid balance or heatstroke due to either dehydration or direct kidney damage from rhabdomyolysis (Fletcher et al., 2012).
Additionally, we found a 29% increase of other infectious and parasitic conditions associated with EHE. No previous study has shown similar associations. However, EHE was found to be a risk factor for mortality of infectious diseases in general population (Basagaña et al., 2011). EHE might enhance the spread of infectious diseases because salmonella and cholera proliferate more rapidly at higher temperatures (Lin et al., 2016).
Diabetes mellitus are one of the most common pregnancy complications and we found that EHE was associated with a 17–22% increase in admissions for diabetes. A previous study found that each 10 °C increase in mean 30-day temperature was associated with a 6% higher odds of gestational diabetes mellitus (Booth et al., 2017). Pregnant women with gestational diabetes are vulnerable to heat due to impairment of their autonomic control and endothelial function (Schwartz, 2005).
In the current study, EHE was associated with a 13% increase in ED visits due to hypertension. A national cohort study including 2,043,182 pregnancy women in China found that extreme temperatures were associated with 7–49% increased odds of varied hypertension disorders in different pregnancy stages (Xiong et al., 2020). A systematic review assessing the associations between meteorology and pregnancy outcomes found higher risks of preeclampsia (one of hypertension disorders) for women with conception during the warmest months (Beltran et al., 2013). Another study found that even in the US, where there is widespread access to air conditioning, heat waves increase the fraction of maternal pregnancy-related hypertension (Cil and Cameron, 2017). EHE may increase hypertension through disturbing thermoregulation and inducing the activation of the sympathetic nervous system (Xiong et al., 2020).
4.4. EHE and pregnancy complications in different populations and geographical areas
We found that the effect of EHE on pregnancy complications was consistently stronger in non-Hispanic and African American mothers in summer and transitional months. Pregnant women from counties considered lower SEP seemed to have a higher risk of pregnancy complications due to EHE. African American mothers are the vulnerable group with the highest risk of other pregnancy complications from EHE (Bekkar et al., 2020). Insufficient healthcare access and lack of heat relief equipment (e.g., fans and air conditioner) or lack of financial resources to pay electric bills might account for the higher risk in this population (Lin et al., 2018). The NYS counties with significantly positive EHE-pregnancy complication associations tend to have lower SEP, i.e. a higher proportion of unemployment and a higher percentage of population in poverty, etc. (Table A.3, accessed from https://www.health.ny.gov/statistics/chac/indicators/ses.htm on August 27, 2020). The significant effect of EHE on pregnancy complications in New York city, Queens, and Long Island may also be a consequence of the urban heat island effect (Borg et al., 2017). Since some of the counties have very limited numbers of cases, the non-significant results may be due to lack of power and may not represent the true effects.
4.5. Clinical and research implications
Although the effect of EHE on pregnancy complications was modest in the current study, due to the high prevalence of pregnancy complications, i.e., about 46.9% of pregnant women endure at least one pregnancy complication (Law et al., 2015), even small effects of EHE can lead to meaningful impacts on long-term health resource utilization. For example, we included more than 1,900,000 cases in the current study, approximately 200,000 ED visits, and more than 90,000 hospital admissions due to pregnancy complications each year in NYS. These pregnancy complications are associated with substantially increased healthcare cost and resource utilization (Law et al., 2015). Heat exposure also causes a substantial economic burden on healthcare systems (Wondmagegn et al., 2019) and females are one of the groups with the highest heat-related healthcare costs, especially women prone to pregnancy complications (Wondmagegn et al., 2019). Avoiding heat-related pregnancy complications would translate into a significant reduction in healthcare cost and overall use of resources. In addition, the total effect of EHE on pregnancy complications may be underestimated in the current study because we only included the most severe cases (admission to ED and hospital). There are likely many more mild and moderate pregnant women with pregnancy complications affected by EHE that were omitted. Thus, our results are likely conservative.
Based on our results, pregnant women should be advised to avoid EHE, not only in summer but also in transitional months, to prevent severe pregnancy complications. Early warning and evidence-based education or intervention, such as research findings, heat prediction, and activity suggestion may be beneficial to pregnant women to decrease their risk of severe complications.
4.6. Strengths and limitations
There are several strengths of our study. First, we included a large sample size of cases with pregnancy complications. Second, the effect of EHE on pregnancy complications was estimated in two scenarios, including ED visits and hospital admissions. Third, we included comprehensive, detailed subtypes of pregnancy complications. Fourth, we used a case-crossover design, which controls for many between-person confounders. Finally, exposure was defined by assigning county level (62 counties in NY) weather data to the individual level. There are far more counties in NYS than monitor sites (N = 14) (Fletcher et al., 2012), which made our exposure estimates more accurate.
Several limitations should also be considered when interpreting our results. First, although we included a large sample size of patients with pregnancy complications, the number of cases with selected subtypes were limited. However, NYS is one of the largest states in the US and we accessed approximately 2,000,000 ED visits and hospital admissions in this study. Second, confounding is always a concern in observational studies. In the current study, we used a case-crossover design in which a lot of between-person confounders, such as family history, SEP, and pregnancy behavioral factors have been automatically controlled due to self-pairing. Meanwhile, we controlled for air pollutants and other weather factors together with time varying variables (holiday) in the model, thereby assessing the association between EHE and pregnancy complications. Third, we conducted multiple sensitivity analyses to verify our results. For example, 1) we used a different study design, time series analysis (GAM); 2) we used the 90th, 95th, and 97.5th percentile to define EHE, respectively; and 3) we used the seasonal (summer) average temperature distribution, instead of monthly average temperature, as the reference to define EHE. We found similar, stronger effects of EHE on pregnancy complications in the sensitivity analyses. Fourth, this study used ED visits and hospital admission data which only catch the most acute and severe exacerbation rather than chronic onsets of pregnancy complications. Under such context, our results may only bias the effect of extreme heat on onset of pregnancy complications to the null. In addition, this should not be a major concern, as pregnant women with complications are more likely to visit the ED compared to other individuals in the general population (Upadhyay et al., 2015). Fifth, the possible gaps between the onset date of pregnancy complications and the admission date cannot be excluded. However, since we focused on the acute and severe exacerbation of these complications and both ED and hospital admission patients were included, such time gaps may be minimized. Meanwhile, this unknown factor may introduce bias unrelated to heat exposure, and therefore, the bias would be non-differential. Finally, duration of pregnancy, which was unavailable in our study, may be a potential confounder in the association between extreme heat and pregnancy complications. We will collect this information to estimate the modifying effect of pregnancy trimester and extreme heat on major pregnancy complications in a future study.
5. Conclusions
Our results suggest a possible immediate and prolonged effect of EHE on pregnancy complications in summer, but an immediate and stronger effect of EHE in transitional months. EHE, mostly in transitional months, was significantly associated with increased risks of multiple subtypes of pregnancy complications, including threatened/spontaneous abortion, renal disease, infectious and parasitic conditions, diabetes, and hypertensions. African American and women living in lower SEP counties were most vulnerable to EHE. Early warning and education against EHE, especially during transitional months may help decrease a wide spectrum of these pregnancy complications.
Supplementary Material
Appendix A. Supplementary data
Supplementary data to this article can be found online at https://doi.org/10.1016/j.scitotenv.2021.146134.
HIGHLIGHTS.
EHE posted an immediate and prolonged effect on pregnancy complications in summer.
The effect of EHE was immediate, but stronger in transitional months than in summer.
EHE was associated with increased risk of common subtypes of pregnancy complications.
The effect of EHE was stronger among African Americans and in lower SES counties.
Funding
This work was supported by the NYS Energy Research and Development Authority (grant number 137487), the National Institute of Environmental Health Science (grant number 1R15ES02800001A1), and the Environmental Protection Agency (grant number 83563602) in the U.S. The funding sources has no involvement in the conduction or preparation of this article.
Footnotes
CRediT authorship contribution statement
Y.Q and S.L designed the study. Y.Q performed statistical analyses. Y. Q, W.Z, I.R, and X.D drafted the manuscript. G.D, X.L and S.L interpreted the results and reviewed the manuscript. I.R and S.L edited the manuscript.
Declaration of competing interest
The authors declare that they have no known competing financial interests or personal relationships that could have appeared to influence the work reported in this paper.
References
- Agay-Shay K, Friger M, Linn S, Peled A, Amitai Y, Peretz C, 2013. Ambient temperature and congenital heart defects. Hum. Reprod 10.1093/humrep/det244. [DOI] [PubMed] [Google Scholar]
- Asamoah B, Kjellstrom T, Östergren PO, 2018. Is ambient heat exposure levels associated with miscarriage or stillbirths in hot regions? A cross-sectional study using survey data from the Ghana Maternal Health Survey 2007. Int. J. Biometeorol 10.1007/s00484-017-1402-5. [DOI] [PMC free article] [PubMed] [Google Scholar]
- Auger N, Fraser WD, Arbour L, Bilodeau-Bertrand M, Kosatsky T, 2017a. Elevated ambient temperatures and risk of neural tube defects. Occup. Environ. Med 74, 315–320. 10.1136/oemed-2016-103956. [DOI] [PubMed] [Google Scholar]
- Auger N, Fraser WD, Sauve R, Bilodeau-Bertrand M, Kosatsky T, 2017b. Risk of congenital heart defects after ambient heat exposure early in pregnancy. Environ. Health Perspect 10.1289/EHP171. [DOI] [PMC free article] [PubMed] [Google Scholar]
- Basagaña X, Sartini C, Barrera-Gómez J, Dadvand P, Cunillera J, Ostro B, Sunyer J, Medina-Ramón M, 2011. Heat waves and cause-specific mortality at all ages. Epidemiology. 10.1097/EDE.0b013e31823031c5. [DOI] [PubMed] [Google Scholar]
- Bayram H, Bauer AK, Abdalati W, Carlsten C, Pinkerton KE, Thurston GD, Balmes JR, Takaro TK, 2017. Environment, global climate change, and cardiopulmonary health. Am. J. Respir. Crit. Care Med 10.1164/rccm.201604-0687PP. [DOI] [PMC free article] [PubMed] [Google Scholar]
- Bekkar B, Pacheco S, Basu R, DeNicola N, 2020. Association of air pollution and heat exposure with preterm birth, low birth weight, and stillbirth in the US: a systematic review. JAMA Netw. Open 3, e208243. 10.1001/jamanetworkopen.2020.8243. [DOI] [PMC free article] [PubMed] [Google Scholar]
- Beltran AJ, Wu J, Laurent O, 2013. Associations of meteorology with adverse pregnancy outcomes: a systematic review of preeclampsia, preterm birth and birth weight. Int.. Environ. Res. Public Health 10.3390/ijerph110100091. [DOI] [PMC free article] [PubMed] [Google Scholar]
- Bennett GD, 2010. Hyperthermia: malformations to chaperones. Birth Defects Res. B. Dev. Reprod. Toxicol 89, 279–288. 10.1002/bdrb.20254. [DOI] [PubMed] [Google Scholar]
- Booth GL, Luo J, Park AL, Feig DS, Moineddin R, Ray JG, 2017. Influence of environmental temperature on risk of gestational diabetes. CMAJ 10.1503/cmaj.160839. [DOI] [PMC free article] [PubMed] [Google Scholar]
- Borg M, Bi P, Nitschke M, Williams S, McDonald S, 2017. The impact of daily temperature on renal disease incidence: an ecological study. Environ. Heal. A Glob. Access Sci. Source. 10.1186/s12940-017-0331-4. [DOI] [PMC free article] [PubMed] [Google Scholar]
- Cil G, Cameron TA, 2017. potential climate change health risks from increases in heat waves: abnormal birth outcomes and adverse maternal health conditions. Risk Anal 10.1111/risa.12767. [DOI] [PubMed] [Google Scholar]
- Crimmins A, Balbus J, Gamble JL, Beard CB, Bell JE, Dodgen D, Eisen RJ, Fann N, Hawkins M, Herring SC, Jantarasami L, Mills DM, Saha S, Sarofim MC, Trtanj J, Ziska L, 2016. The impacts of climate change on human health in the United States: a scientific assessment. U.S. Glob. Chang. Res. Progr [Google Scholar]
- Davis RE, Novicoff WM, 2018. The Impact of Heat Waves on Emergency Department Admissions in Charlottesville, Virginia. U.S.A. Int. J. Environ. Res. Public Health 10.3390/ijerph15071436. [DOI] [PMC free article] [PubMed] [Google Scholar]
- De Blois J, Kjellstrom T, Agewall S, Ezekowitz JA, Armstrong PW, Atar D, 2015. The effects of climate change on cardiac health. Cardiol. 10.1159/000398787. [DOI] [PubMed] [Google Scholar]
- D’Ippoliti D, Michelozzi P, Marino C, De’Donato F, Menne B, Katsouyanni K, Kirchmayer U, Analitis A, Medina-Ramón M, Paldy A, Atkinson R, Kovats S, Bisanti L, Schneider A, Lefranc A, Iñiguez C, Perucci CA, 2010. The impact of heat waves on mortality in 9 European cities: results from the EuroHEAT project. Environ. Heal. A Glob. Access Sci. Source. 10.1186/1476-069X-9-37. [DOI] [PMC free article] [PubMed] [Google Scholar]
- Fletcher BA, Lin S, Fitzgerald EF, Hwang SA, 2012. Association of summer temperatures with hospital admissions for renal diseases in New York state: a casecrossover study. Am. J. Epidemiol 175, 907–916. 10.1093/aje/kwr417. [DOI] [PubMed] [Google Scholar]
- Gronlund CJ, Zanobetti A, Schwartz JD, Wellenius GA, O’Neill MS, 2014. Heat, heat waves, and hospital admissions among the elderly in the United States, 1992–2006. Environ. Health Perspect 10.1289/ehp.1206132. [DOI] [PMC free article] [PubMed] [Google Scholar]
- Ha S, Liu D, Zhu Y, Kim SS, Sherman S, Grantz KL, Mendola P, 2017a. Ambient temperature and stillbirth: a multi-center retrospective cohort study. Environ. Health Perspect 10.1289/EHP945. [DOI] [PMC free article] [PubMed] [Google Scholar]
- Ha S, Liu D, Zhu Y, Kim SS, Sherman S, Mendola P, 2017b. Ambient temperature and early delivery of singleton pregnancies. Environ. Health Perspect 10.1289/EHP97. [DOI] [PMC free article] [PubMed] [Google Scholar]
- Ha S, Liu D, Zhu Y, Sherman S, Mendola P, 2018. Acute associations between outdoor temperature and premature rupture of membranes. Epidemiology. 10.1097/EDE.0000000000000779. [DOI] [PMC free article] [PubMed] [Google Scholar]
- Halonen JI, Zanobetti A, Sparrow D, Vokonas PS, Schwartz J, 2010. Associations between outdoor temperature and markers of inflammation: a cohort study. Environ. Health 9, 42. 10.1186/1476-069X-9-42. [DOI] [PMC free article] [PubMed] [Google Scholar]
- He S, Kosatsky T, Smargiassi A, Bilodeau-Bertrand M, Auger N, 2018. Heat and pregnancy-related emergencies: risk of placental abruption during hot weather. Environ. Int 10.1016/j.envint.2017.11.004. [DOI] [PubMed] [Google Scholar]
- Heo S, Bell ML, Lee JT, 2019. Comparison of health risks by heat wave definition: applicability of wet-bulb globe temperature for heat wave criteria. Environ. Res 10.1016/j.envres.2018.09.032. [DOI] [PubMed] [Google Scholar]
- Janes H, Sheppard L, Lumley T, 2005. Case-crossover analyses of air pollution exposure data: referent selection strategies and their implications for bias. Epidemiology. 10.1097/01.ede.0000181315.18836.9d. [DOI] [PubMed] [Google Scholar]
- Kahle JJ, Neas LM, Devlin RB, Case MW, Schmitt MT, Madden MC, Diaz-Sanchez D, 2015. Interaction effects of temperature and ozone on lung function and markers of systemic inflammation, coagulation, and fibrinolysis: a crossover study of healthy young volunteers. Environ. Health Perspect 123, 310–316. 10.1289/ehp.1307986. [DOI] [PMC free article] [PubMed] [Google Scholar]
- Konkel L, 2019. Taking the heat: potential fetal health effects of hot temperatures. Environ. Health Perspect 10.1289/EHP6221. [DOI] [PMC free article] [PubMed] [Google Scholar]
- Lajinian S, Hudson S, Applewhite L, Feldman J, Minkoff HL, 1997. An association between the heat-humidity index and preterm labor and delivery: a preliminary analysis. Am. J. Public Health 10.2105/AJPH.87.7.1205. [DOI] [PMC free article] [PubMed] [Google Scholar]
- Law A, McCoy M, Lynen R, Curkendall SM, Gatwood J, Juneau PL, Landsman-Blumberg P, 2015. The prevalence of complications and healthcare costs during pregnancy. J. Med. Econ 18, 533–541. 10.3111/13696998.2015.1016229. [DOI] [PubMed] [Google Scholar]
- Lawrence WR, Soim A, Zhang W, Lin Z, Lu Y, Lipton EA, Xiao J, Dong GH, Lin S, 2020. A population-based case-control study of the association between weather-related extreme heat events and low birthweight. J. Dev. Orig. Health Dis 10.1017/S2040174420000392. [DOI] [PMC free article] [PubMed] [Google Scholar]
- Limaye VS, Vargo J, Harkey M, Holloway T, Patz JA, 2018. Climate change and heat-related excess mortality in the eastern USA. Ecohealth. 10.1007/s10393-018-1363-0. [DOI] [PMC free article] [PubMed] [Google Scholar]
- Lin S, Hsu WH, van Zutphen AR, Saha S, Luber G, Hwang SA, 2012. Excessive heat and respiratory hospitalizations in New York State: estimating current and future public health burden related to climate change. Environ. Health Perspect 10.1289/ehp.1104728. [DOI] [PMC free article] [PubMed] [Google Scholar]
- Lin S, Sun M, Fitzgerald E, Hwang SA, 2016. Did summer weather factors affect gastrointestinal infection hospitalizations in New York state? Sci. Total Environ 10.1016/j.scitotenv.2015.12.153. [DOI] [PubMed] [Google Scholar]
- Lin S, Lin Z, Ou Y, Soim A, Shrestha S, Lu Y, Sheridan S, Luben TJ, Fitzgerald E, Bell E, Shaw GM, Reefhuis J, Langlois PH, Romitti P, Feldkamp ML, Malik S, Pantea C, Nayak S, Hwang SA, Browne M, 2018. Maternal ambient heat exposure during early pregnancy in summer and spring and congenital heart defects – a large US population-based, case-control study. Environ. Int 10.1016/j.envint.2018.04.043. [DOI] [PMC free article] [PubMed] [Google Scholar]
- Loughnan M, Tapper N, Loughnan T, 2014. The impact of “unseasonably” warm spring temperatures on acute myocardial infarction hospital admissions in Melbourne, Australia: a city with a temperate climate. J. Environ. Public Health. 10.1155/2014/483785. [DOI] [PMC free article] [PubMed] [Google Scholar]
- Maclure M, 1991. The case-crossover design: a method for studying transient effects on the risk of acute events. Am. J. Epidemiol 10.1093/oxfordjournals.aje.a115853. [DOI] [PubMed] [Google Scholar]
- Ravindra K, Rattan P, Mor S, Aggarwal AN, 2019. Generalized additive models: building evidence of air pollution, climate change and human health. Environ. Int 10.1016/j.envint.2019.104987. [DOI] [PubMed] [Google Scholar]
- Rich DQ, Zhang W, Lin S, Squizzato S, Thurston SW, van Wijngaarden E, Croft D, Masiol M, Hopke PK, 2019. Triggering of cardiovascular hospital admissions by source specific fine particle concentrations in urban centers of New York state. Environ. Int 126, 387–394. 10.1016/J.ENVINT.2019.02.018. [DOI] [PMC free article] [PubMed] [Google Scholar]
- Schifano P, Leone M, De Sario M, Dedonato F, Bargagli AM, Dippoliti D, Marino C, Michelozzi P, 2012. Changes in the effects of heat on mortality among the elderly from 1998–2010: results from a multicenter time series study in Italy. Environ. Heal. A Glob. Access Sci. Source. 10.1186/1476-069X-11-58. [DOI] [PMC free article] [PubMed] [Google Scholar]
- Schwartz J, 2005. Who is sensitive to extremes of temperature?: a case-only analysis. Epidemiology 16, 67–72. 10.1097/01.ede.0000147114.25957.71. [DOI] [PubMed] [Google Scholar]
- Song J, Lu J, Wang E, Lu M, An Z, Liu Y, Zeng X, Li W, Li H, Xu D, Yao S, Wu W, 2019. Short-term effects of ambient temperature on the risk of premature rupture of membranes in Xinxiang, China: A time-series analysis. Sci. Total Environ 10.1016/j.scitotenv.2019.06.457. [DOI] [PubMed] [Google Scholar]
- Sun X, Luo X, Cao G, Zhao C, Xiao J, Liu X, Dong M, Wang J, Zeng W, Guo L, Wan D, Ma W, Liu T, 2020. Associations of ambient temperature exposure during pregnancy with the risk of miscarriage and the modification effects of greenness in Guangdong, China. Sci. Total Environ 10.1016/j.scitotenv.2019.134988. [DOI] [PubMed] [Google Scholar]
- The NYS GIS Program Office, 2017. The Street and Address Maintenance (SAM) Program [WWW Document]. [Google Scholar]
- Thompson R, Hornigold R, Page L, Waite T, 2018. Associations between high ambient temperatures and heat waves with mental health outcomes: a systematic review. Public Health 10.1016/j.puhe.2018.06.008. [DOI] [PubMed] [Google Scholar]
- Tobías A, Armstrong B, Gasparrini A, Diaz J, 2014. Effects of high summer temperatures on mortality in 50 Spanish cities. Environ. Heal. A Glob. Access Sci. Source. 10.1186/1476-069X-13-48. [DOI] [PMC free article] [PubMed] [Google Scholar]
- Upadhyay UD, Desai S, Zlidar V, Weitz TA, Grossman D, Anderson P, Taylor D, 2015. Incidence of emergency department visits and complications after abortion. Obstet. Gynecol 10.1097/AOG.0000000000000603. [DOI] [PubMed] [Google Scholar]
- Van Zutphen AR, Lin S, Fletcher BA, Hwang S-A, 2012. A population-based case-control study of extreme summer temperature and birth defects. Environ. Health Perspect 120, 1443–1449. 10.1289/ehp.1104671. [DOI] [PMC free article] [PubMed] [Google Scholar]
- Wiles K, Chappell L, Clark K, Elman L, Hall M, Lightstone L, Mohamed G, Mukherjee D, Nelson-Piercy C, Webster P, Whybrow R, Bramham K, 2019. Clinical practice guideline on pregnancy and renal disease. BMC Nephrol 10.1186/s12882-019-1560-2. [DOI] [PMC free article] [PubMed] [Google Scholar]
- Williams S, Nitschke M, Sullivan T, Tucker GR, Weinstein P, Pisaniello DL, Parton KA, Bi P, 2012. Heat and health in Adelaide, South Australia: Assessment of heat thresholds and temperature relationships. Sci. Total Environ 10.1016/j.scitotenv.2011.11.038. [DOI] [PubMed] [Google Scholar]
- Wondmagegn BY, Xiang J, Williams S, Pisaniello D, Bi P, 2019. What do we know about the healthcare costs of extreme heat exposure? A comprehensive literature review. Sci. Total Environ 10.1016/j.scitotenv.2018.11.479. [DOI] [PubMed] [Google Scholar]
- Wu S, Yang D, Pan L, Shan J, Li H, Wei H, Wang B, Huang J, Baccarelli AA, Shima M, Deng F, Guo X, 2017. Ambient temperature and cardiovascular biomarkers in a repeated-measure study in healthy adults: a novel biomarker index approach. Environ. Res 156, 231–238. 10.1016/j.envres.2017.02.036. [DOI] [PubMed] [Google Scholar]
- Xiong T, Chen P, Mu Y, Li X, Di B, Li J, Qu Y, Tang J, Liang J, Mu D, 2020. Association between ambient temperature and hypertensive disorders in pregnancy in China. Nat. Commun 10.1038/s41467-020-16775-8. [DOI] [PMC free article] [PubMed] [Google Scholar]
- Yackerson N, Piura B, Sheiner E, 2008. The influence of meteorological factors on the emergence of preterm delivery and preterm premature rupture of membrane. J. Perinatol 10.1038/jp.2008.69. [DOI] [PubMed] [Google Scholar]
- Zhang Y, Yu C, Wang L, 2017. Temperature exposure during pregnancy and birth outcomes: an updated systematic review of epidemiological evidence. Environ. Pollut 225, 700–712. 10.1016/j.envpol.2017.02.066. [DOI] [PubMed] [Google Scholar]
- Zhang W, Lin S, Hopke PK, Thurston SW, van Wijngaarden E, Croft D, Squizzato S, Masiol M, Rich DQ, 2018. Triggering of cardiovascular hospital admissions by fine particle concentrations in New York state: before, during, and after implementation of multiple environmental policies and a recession. Environ. Pollut 242, 1404–1416. 10.1016/j.envpol.2018.08.030. [DOI] [PubMed] [Google Scholar]
- Zhang W, Spero TL, Nolte CG, Garcia VC, Lin Z, Romitti PA, Shaw GM, Sheridan SC, Feldkamp ML, Woomert A, Hwang S-A, Fisher SC, Browne ML, Hao Y, Lin S, Study NBDP, 2019. Projected changes in maternal heat exposure during early pregnancy and the associated congenital heart defect burden in the United States. J. Am. Heart Assoc 8, e010995. 10.1161/JAHA.118.010995. [DOI] [PMC free article] [PubMed] [Google Scholar]
- Zhong Q, Lu C, Zhang W, Zheng X, Deng Q, 2018. Preterm birth and ambient temperature: strong association during night-time and warm seasons. J. Therm. Biol 10.1016/j.jtherbio.2018.11.002. [DOI] [PubMed] [Google Scholar]
Associated Data
This section collects any data citations, data availability statements, or supplementary materials included in this article.