

ABSTRACT
Secretion systems are essential for Gram-negative bacteria, as these nanomachineries allow communication with the outside world by exporting proteins into the extracellular space or directly into the cytosol of a host cell. For example, type I secretion systems (T1SS) secrete a broad range of substrates across both membranes into the extracellular space. One well-known example is the hemolysin A (HlyA) T1SS from Escherichia coli, which consists of an ABC transporter (HlyB), a membrane fusion protein (HlyD), the outer membrane protein TolC, and the substrate HlyA, a member of the family of repeats in toxins (RTX) toxins. Here, we determined the amount of TolC at the endogenous level (parental strain, UTI89) and under conditions of overexpression [T7 expression system, BL21(DE3)-BD]. The overall amount of TolC was not influenced by the overexpression of the HlyBD complex. Moving one step further, we determined the localization of the HlyA T1SS by superresolution microscopy. In contrast to other bacterial secretion systems, no polarization was observed with respect to endogenous or overexpression levels. Additionally, the cell growth and division cycle did not influence polarization. Most importantly, the size of the observed T1SS clusters did not correlate with the recently proposed outer membrane islands. These data indicate that T1SS clusters at the outer membrane, generating domains of so-far-undescribed identity.
IMPORTANCE Uropathogenic Escherichia coli (UPEC) strains cause about 110 million urinary tract infections each year worldwide, representing a global burden to the health care system. UPEC strains secrete many virulence factors, among these, the TX toxin hemolysin A via a cognate T1SS into the extracellular space. In this study, we determined the endogenous copy number of the HlyA T1SS in UTI89 and analyzed the surface localization in BL21(DE3)-BD and UTI89, respectively. With approximately 800 copies of the T1SS in UTI89, this is one of the highest expressed bacterial secretion systems. Furthermore, and in clear contrast to other secretion systems, no polarized surface localization was detected. Finally, quantitative analysis of the superresolution data revealed that clusters of the HlyA T1SS are not related to the recently identified outer membrane protein islands. These data provide insights into the quantitative molecular architecture of the HlyA T1SS.
KEYWORDS: membrane cluster, membrane localization, secretion systems, TolC, type I secretion, T1SS
INTRODUCTION
Gram-negative bacteria such as Bordetella pertussis (1–3), Vibrio cholerae (4), and uropathogenic Escherichia coli (UPEC) (5, 6) are the cause of a variety of human diseases. Such pathogens have evolved a series of mechanisms to ensure their own survival in different, often hostile environments. This requires strategies for exchange of information between the inside and outside of the cell, across the inner membrane (IM) and the outer membrane (OM), to adjust to often rapidly changing environmental conditions. A minimum of 15 different secretion systems have been identified in Gram-negative bacteria (7), covering a variety of distinct translocation mechanisms. The type III secretion system (T3SS), for example, uses a rod-ike structure with a tip as a warhead to distribute its payload into the target cell (8). The type IV secretion system (T4SS) facilitates infection by employing a pili-like structure to deliver a mix of target proteins and DNA into the cytosol of the target (9). The type VI secretion machine (T6SS) remarkably spans three membranes to translocate toxic effector proteins through a long tubular structure directly into the target cell (10, 11). The IM part possesses a significant degree of homology to T4SS and resembles bacteriophage tails, indicating a common origin (12). The T3SS, T4SS, and T6SS have in common that they simultaneously span the IM and OM (8, 9). This feature is shared by one other secretion system, the type I secretion system (T1SS), which delivers its cargo directly to the extracellular space. The secretion of the substrate occurs in an unfolded state with the C terminus appearing first at the cell surface (13). The substrates, which are characterized by a C-terminal secretion signal, vary in size from large adhesins, including LapA (14) with a molecular weight of approximately 900 kDa, SiiE with 595 kDa (15), and the ice-binding protein MpIBP from Marinomonas primoryensis with a molecular weight of 1.5 MDa (16). In contrast, the iron scavenger protein, such as HasA, is one of the smallest known secreted T1SS substrates containing a C-terminal secretion signal (17, 18), with a molecular weight of approximately 19 kDa. Interestingly, on the other hand, bacteriocins like ColV (19) are secreted by a T1SS in a folded state with a cleavable N-terminal secretion signal (20). The classical view, developed over decades, implying that the substrates of the T1SS are secreted in a single step, was recently refined (14). In the case of LapA from Pseudomonas fluorescens, the substrate is largely secreted, but the final release is prevented at the OM through a so-called retention module, which allows adhesion and biofilm formation (14).
One well-known T1SS substrate is hemolysin A (HlyA), named after its ability to lyse, for example, erythrocytes (21). Hemolysin is a member of the family of repeat in toxins (RTX) toxins (22). These nonapeptide repeats have the consensus sequence GGXGXDXUX (where X can be any amino acid, and U is a large, hydrophobic amino acid), which possesses an affinity for calcium ions in the high micromolar range (23). The binding of calcium ions induces the folding of the substrates in the extracellular space (24). For the T1SS to energize substrate translocation, an ABC transporter generates the power stroke. This half-size ABC transporter, hemolysin B (HlyB), is located in the IM and colocalizes with the membrane fusion protein (MFP), hemolysin D (HlyD). HlyB and HlyD are presumed to form an IM complex (IMC) of the T1SS (25–28). To secrete substrates simultaneously across the inner and outer membranes, a third protein in the OM, TolC, completes the T1SS translocon (29), which is recruited by the IMC in the presence of the substrate HlyA (25, 30). TolC is a channel-like protein, which reaches into the periplasm and interacts with different secretion systems and drug efflux pumps such as AcrAB, which is also located in the IM and acts as a connector to the extracellular space across the OM (31–34).
Quantification of the amount of a stalled and overexpressed HlyA T1SS in E. coli BL21(DE3)-BD expressing HlyB and HlyD resulted in approximately 4,500 copies under overexpression conditions of HlyA, HlyB, and HlyD (35). To evaluate whether this amount is limited by the endogenous amounts of TolC present in BL21(DE3)-BD, we quantified, in this study, the total number of the TolC proteins in the presence of an actively secreting HlyA T1SS by inducing a stalled complex. This was necessary, as the copy number of stalled T1SS does match the reported number of TolC proteins of approximately 1,500 in E. coli MC4100 (36). In both cases of our study, whether actively secreting or stalled, approximately 4,500 copies of trimeric TolC were determined. In the next step, the endogenous number of active HlyA T1SS was quantified using, again, the concept of a stalled secretion complex (13) in the UPEC strain UTI89. Here, we determined the number of 800 T1SS secretion machineries compared to 4,500 in BL21(DE3)-BD, but the total number of TolC proteins remained at approximately 4,500.
Another interesting aspect with regard to the bacterial secretion systems is their cellular localization. The T3SS of Shigella (37) and the T4SS of Legionella (38) possess a distinct and polar localization within the bacterial cell envelope that appears to be important for the pathogenicity of these bacteria (37). Accordingly, we analyzed the surface localization of the HlyA T1SS, again employing the concept of a stalled secretion system (13) by biochemical approaches and superresolution microscopy. Under conditions of overexpression, we have reported a clustered pattern of the HlyA T1SS, which did not show any sign of polarization within the secreting cells (35). To speed up the process of evaluation of a potential polarization, a semiautomated evaluation routine was developed. However, we detected neither distinct nor polarized surface localizations of T1SS translocons under conditions of overexpression or at the endogenous level.
(This research was conducted by T. Beer in partial fulfillment of the requirements for a Dr. rer. nat. degree from Heinrich Heine University Düsseldorf [39].)
RESULTS
Quantification of TolC in E. coli BL21(DE3)-BD and E. coli UTI89.
In our previous study (35), we used the concept of a stalled T1SS for the quantification of the amount of active HlyA T1SS in BL21(DE3)-BD cells. One has to stress that HlyB, HlyD, and enhanced green fluorescent protein (eGFP)-HlyAc, were overexpressed in these experiments, while the endogenous TolC was part of the T1SS complex. HlyAc is an N-terminal truncation of HlyA covering the last 223-amino-acid (aa) C terminus of HlyA, including three GG repeats as well as the secretion signal. This approach resulted in approximately 4,500 active T1SS, indicating that at least 4,500 copies of TolC are present in E. coli BL21(DE3)-BD. In a previous study investigating the resistance-nodulation-division (RND) pump AcrAB, the single components AcrA, AcrB, and TolC were also quantified (36). In this case, 5,000 to 7,000 copies of AcrA per cell during the exponential growth phase were found, as well as approximately 500 copies of AcrB and approximately 1,500 copies of TolC. The discrepancy between these results and our study that determined the amount of stalled T1SS of 4,500, which require at least 4,500 copies of TolC, prompted us to determine the copy number of TolC in E. coli BL21(DE3)-BD, as well as uropathogenic UTI89, which is the parental strain of the HlyA T1SS (6).
Purified TolC of known concentration was used to determine the cellular amount of TolC in E. coli BL21(DE3)-BD by quantitative Western blot analysis. Stepwise dilution of this TolC sample and a technical triplicate of BL21(DE3)-BD cells allowed us to calibrate the signal intensity of the TolC band and subsequently to calculate the concentration of endogenous TolC in BL21(DE3)-BD. The same approach was used for UTI89 cells. In the case of BL21(DE3)-BD, different plasmids containing different combinations of the components of the T1SS were transformed and overexpressed. In one combination, HlyB and HlyD in the presence of eGFP-HlyAc were used, while in another combination, HlyB, HlyD, and eGFP-HlyA were present. In the case of UTI89, only plasmid-encoded eGFP-HlyAc or eGFP-HlyA was transformed and was used to investigate its influence on the amount of TolC in the presence of endogenous levels of HlyB and HlyD. The different combinations of proteins were quantified by Western blotting for TolC. To detect a potential influence of the overexpression of HlyB/HlyD on one hand or eGFP-HlyAc or eGFP-HlyA on the other hand, the amount of TolC was also quantified in the absence of overexpression of the above-mentioned proteins (HlyB, HlyD, eGFP-HlyAc, and eGFP-HlyA). Western blotting of the different permutations to quantify TolC is summarized in Fig. S1 and S2 in the supplemental material. A statistical investigation of the quantified Western blotting signals via analysis of variance (ANOVA) and Tukey’s multiple comparisons indicated no significant differences between the analyzed samples. In all cases, the amount of TolC was not significantly influenced and remained at an average copy number of 4,472 ± 1,231 TolC trimers per cell (Fig. 1 and Tables S1 and S2).
FIG 1.
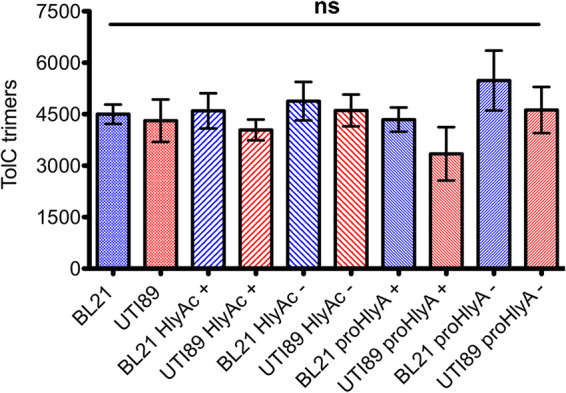
Quantification of TolC trimers. Bar diagram of the quantification of TolC by quantitative Western blot analysis. Blue, BL21(DE3)-BD cells; red, UTI89 cells; +, induction of eGFP-HlyA and eGFP-HlyAc, respectively; −, no induction during the experiment; ns, not significant. In the case of UTI89, HlyB and HlyD were not overexpressed, and only the endogenous protein levels were present. In BL21(DE3)-BD, HlyB and HlyD were also overexpressed. One-way ANOVA (P < 0.05) and Tukey’s multiple-comparison test indicated no significance differences. Bars represent the mean value of at least five independent quantifications, and the error bars represent the standard error of the mean.
Quantification of active T1SS in E. coli UTI89.
No distinguishable difference in the amount of TolC between BL21(DE3)-BD and UTI89 in the presence or absence of the T1SS was found. However, the number of active HlyA T1SS remained unknown in the latter strain. Therefore, the amount of active T1SS was determined by immunofluorescence. This method was also used to determine the amount of active T1SS, while they were overexpressed in BL21(DE3)-BD in a previous study (35). For the measurements in UTI89, an N-terminal truncated version of eGFP-HlyA, eGFP-HlyAc, was expressed. The reduced size of eGFP-HlyAc obviously reduces the proportion of HlyAc reaching the cell envelope, and consequently, only one antibody binds per translocator on the cell surface for steric reasons (35). For quantification, a polyclonal HlyA-specific primary antibody was used in combination with a Cy3-labeled secondary antibody for fluorescence readout. To determine the amount of nonspecific antibody binding on the cell surface and the fluorescence background, two approaches were used. First, UTI89 cells expressing eGFP-HlyAc were measured without antibody staining to determine the background fluorescence in the Cy3 channel caused by eGFP. Second, wild-type UTI89 cells that did not express eGFP-HlyAc were stained with primary and secondary antibodies to determine the residual antibody signal. The eGFP-HlyAc fluorescence at the emission wavelength of Cy3 (547 nm) was used for determination of the fluorescence background (Fig. S3). The intensity of the fluorescence signal was multiplied by the slope of a Cy3-antibody calibration line to calculate the amount of active T1SS (35). The number of T1SS translocons was then divided by the number of cells in the cuvette (8 × 10⁷ cells in 100 μL at an optical density at 600 nm (OD600) of 1 [40]). This calculation resulted in a number of 796 ± 62 active T1SS per UTI89 cell compared to a total number of TolC molecules of 4,500. In comparison, 4,532 ± 966 active T1SS were present in BL21(DE3)-BD when HlyB and HlyD were overexpressed (Fig. 2) (35). Thus, under endogenous conditions, TolC is always present in excess compared to HlyB and HlyD, which goes in line with the vital cellular processes it is involved in.
FIG 2.
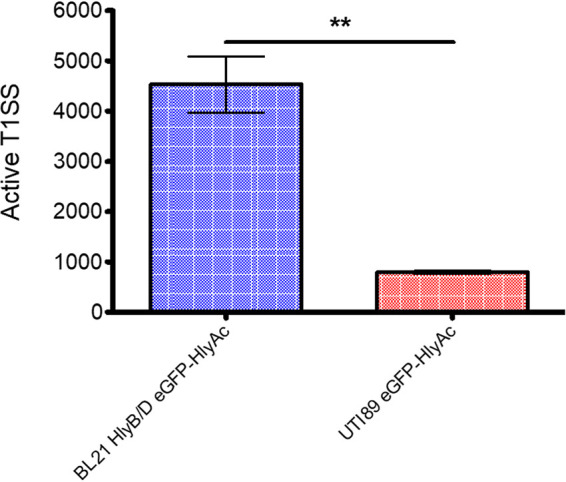
Quantification of active T1SS in E. coli BL21(DE3)-BD and UTI89. Error bars represent the standard error of the mean of three independent experiments. **, P < 0.01.
The expression of the hlyCABD operon is highly regulated (41–44) (for a review, see reference 45), and the endogenous expression levels of the individual components vary during cell growth. For example, the rfaH and cnf1 genes are major regulation factors. Moreover, the rfaH gene is involved in the regulation of lipopolysaccharide (LPS) synthesis and therefore linked to the growth of E. coli (46). Furthermore, secretion only occurs during the early to mid-exponential phase and is switched off during the transition to the stationary phase (47). To ensure that the maximal amount of the T1SS was present during our analysis, a growth curve was recorded, and the endogenous expression levels of HlyB and HlyD were investigated (Fig. 3A and B). An unexpected high proteolytic activity in UTI89 resulted in a substantial amount of degradation products (Fig. 3) and complicated an accurate determination of the absolute concentration of HlyB and HlyD. Nevertheless, it was still obvious that the expression of HlyB and HlyD increased during the initial growth phase and plateaued when growth changed from exponential to stationary phase. This is in line with published data (47) and suggests a very defined time window for the secretion of HlyA. Importantly, it indicates that the amount of HlyB and HlyD and, thus, the amount of active T1SS were maximal within the time frame of our analysis.
FIG 3.

Growth analysis of E. coli UTI89. (A) Western blotting against HlyB (left) and HlyD (right) of wild-type UTI89. Time points after inoculation (in hours) at which the samples were taken are indicated. Overnight cultures (o/n) corresponded to approximately 14 h. Polyclonal antibodies were used as stated. Arrows indicate the size of the corresponding full-length proteins. (B) Growth curve of E. coli UTI89 in a 96-well plate (for further details, see Materials and Methods). The curve represents the average of three biological replicates, each of which was performed in quadruplicate.
Surface localization of the T1SS in E. coli.
With our result of approximately 800 active T1SS in UTI89 at the endogenous level compared to approximately 4,500 copies in BL21(DE3)-BD under conditions of overexpression, the question arose if this 5-fold change had implications for the localization on the cell surface. Therefore, we analyzed the subcellular localization and distribution of the T1SS utilizing structured illumination microscopy (SIM) as a superresolution imaging technique to integrate detailed spatial information into our understanding of the T1SS machinery in UTI89 and BL21(DE3)-BD.
To address the question of polarization and clustering for HlyA T1SS, we applied again the concept of a stalled T1SS (13, 35). Here, the substrate, HlyA, was fused to eGFP at its N terminus. Since the C terminus of HlyA appears first at the cell surface (13, 35), N-terminal eGFP (13) folds prior to secretion and arrests the translocation process, leaving the C-terminal part of HlyA on the cell surface accessible to antibodies allowing visualization of the transporter by immunolabeling. Obviously, this process only recognizes secretion-competent T1SS. Therefore, the surface localization comparison refers to the strain transformed with HlyB/D and eGFP-HlyA when not otherwise stated. Figure 4A shows DAPI (4′,6-diamidino-2-phenylindole)-stained (blue channel) E. coli BL21(DE3)-BD and UTI89 E. coli cells expressing HlyA-eGFP (green channel) and anti-HlyA staining (red channel). The results revealed significant intensities in the eGFP-channel compared to cells without expression as shown in the unprocessed SIM maximum-intensity projections (MIPs) of the acquired z-stacks (Fig. 4A and Fig. S4).
FIG 4.

Surface staining of stalled eGFP-HlyA T1SS does not indicate a specific accumulation of the complex at the tip. (A) eGFP-HlyA expression was induced in BL21(DE3)-BD or UTI89, and cells were fixed after 2 h of expression. DNA was stained by DAPI, and cell surface-exposed HlyA was stained by immunofluorescence labeling. Cells were imaged by SIM. Maximum-intensity projections (MIPs) of raw data before processing show the DAPI channel in blue (DAPI), the eGFP channel in green (eGFP-HlyA), and the HlyA channel in red (anti-HlyA). Contrast was identical to the conditions applied to nonexpressing BL21(DE3)-BD and wild-type UTI89 cells (Fig. S4 in the supplemental material). Processed SIM MIPs are shown on the right (SIM). White square indicates the area displayed in panel B. Scale bar, 5 μm. (B, Left) Inset of SIM-processed MIP. (B, Middle) The first analysis step highlights the area of the bacterial cell (blue) and the detected maxima (white). (B, Right) The final output of the analysis included a color-coded classification for each bacterium highlighting both tips and the cell body areas. The selected bacterium displayed no specific accumulation at any tip, indicated by blue outline. Details on color coding can be found in the supplementary information under “Classification and quality management.” Scale bar, 1 μm. (C) Quantification of nonaccumulating and one tip- and both tip-accumulated HlyA signals. Staining and analysis were performed in duplicate using 3 to 5 different clones and at least 15 images for each replicate. In total, 1,411 UTI89 bacteria were analyzed with respect to a potential accumulation of the stalled HlyA T1SS at the tips, and 771 bacteria were analyzed in the case of BL21(DE3)-BD.
As described in more detail in Materials and Methods and the supplemental material, SIM data were processed and evaluated. Curiously, however, in both strains BL21(DE3)-BD and UTI89, we observed a small fraction of bacterial cells with accumulation of the HlyA T1SS in both tips of the cell (∼10% ± 7%). Approximately a quarter of the cells showed accumulation of signals in one of the tips (∼29% ± 8%), while the majority of all analyzed cells did not show any specific accumulation and are rather evenly distributed in the cell envelope.
To further characterize and compare the observed localization to other known OM structures such as OM islands, the anti-HlyA antibody signals were quantified with respect to their average size since OM islands showed an average diameter of ∼0.5 μm (48). To investigate this hypothesis, the previously used Fiji workflow was modified to calculate the widely accepted full-width half-maximum (FWHM) value as size measure of anti-HlyA antibody signals in 12 randomly chosen images (Fig. 5). The results showed a calculated median size of approximately 200 nm, indicating a significantly smaller size than OM islands with an average diameter of 0.5 μm.
FIG 5.
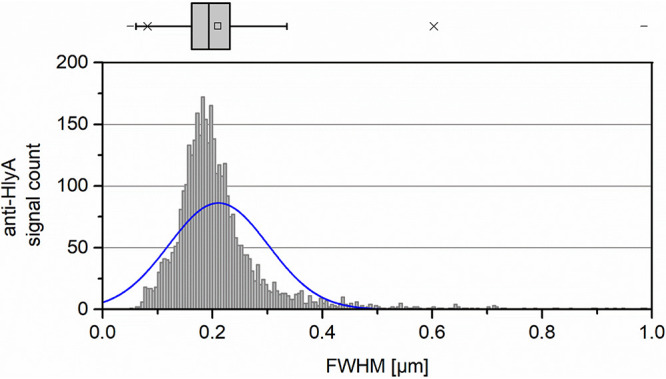
Quantification of anti-HlyA antibody cluster size in SIM data. Signals identified and used to estimate the polarized localization analysis (Fig. 4) were analyzed for full width half maximum (FWHM) as size parameter. Values were summed in bins of 5-nm sizes and plotted using the calculated FWHM in micrometer on the x axis and the absolute amount of occurring cluster sizes per bin on the y axis. A calculated normal distribution of the data was overlaid in blue. On top of the graph, a box-and-whisker plot of the distribution is displayed indicating the median (vertical line), average value (square), interquartile range (box), and 5%/95% (whiskers).
Since single-cell organisms can undergo changes in the active growth zones dependent on the cell cycle, both strains BL21(DE3)-BD and UTI89 were analyzed for changes in HlyA T1SS localization related to cell size. Therefore, the relative density of the HlyA T1SS signals was assessed using MicrobeJ as another, already established Fiji plugin (Fig. 6). The data show only a slight increase in signal density at the tip zones (∼10% relative density) at the length-normalized average bacteria shape compared to signal density at the cell mid-body (Fig. 6A). This confirms the results of the previous experiments indicating no significant accumulation of the HlyA T1SS at the tips of the cell, but only a very low level of polarized localization. This is true for both strains BL21(DE3)-BD and UTI89. When the signals were analyzed dependently of the cell length as a measure for the different stages of the cell cycle (Fig. 6B), the maximum density of HlyA T1SS signals was observed for cell sizes in the range of 1.5 to 2 μm. The signal density decreased for cell sizes larger than approximately 3 to 4 μm. Moreover, no significant increase or change in the distribution pattern of relative HlyA T1SS density to one or both tip zones could be observed with increasing cell length. These results indicate that there are no significant changes in the distribution of HlyA T1SS throughout the cell cycle of these E. coli strains.
FIG 6.

Anti-HlyA antibody clusters distribution in median bacteria shape and dependence on cell length. (A) Relative density plot of anti-HlyA antibody signals of BL21(DE3)-BD cells (left) and UTI89 (right) to a normalized median bacterial shape. Longitudinal and transversal size is indicated on the axes. (B) Anti-HlyA antibody signals of BL21(DE3)-BD (left) and UTI89 (right) cells are plotted on vertical lines sorted by cell length (x axis). Relative anti-HlyA signal densities are displayed for both figures as color-coded heatmap ranging from 1 (white) to 0 (black) as indicated on the right side panel.
DISCUSSION
Environmental conditions such as antibiotics (49), pH (50), metal ions, indoles, flavonoids (51), ethanol, and EDTA (52) have a regulating effect on TolC expression. Additionally, the regulatory effect of the small RNA (sRNA) RyeB, also referred to as SdrR, was discovered to have a direct influence on the TolC expression level by paring upstream to the untranslated 5′ regions from tolC, blocking translation (53). The absence of TolC leads to upregulation of TolC homologues or phenotypes, which were similar to strains carrying a deletion of acrAB (54, 55). Taken together, these data suggest that the expression of TolC is sensitive toward environmental clues. However, the overexpression of the T1SS had no influence on the amount of TolC. In both strains BL21(DE3)-BD (Fig. 1) and UTI89 (Fig. 2), respectively, no significant difference (overall, 4,472 ± 1,231 trimers) was detected independent of overexpression of proteins or combinations thereof (Fig. 1). This implies that the recruitment through the HlyA T1SS does not directly influence the expression levels of TolC, although nearly all available TolC proteins become engaged in substrate secretion under conditions of T1SS overexpression. A previous experiment showed no HlyA secretion 1 h after stalling was induced. Therefore, the stalled T1SS should have been stable for at least 1 h (13).
Additionally, the distribution and pattern of T1SS in the cell envelope itself was not influenced by the overexpression of the single components of the secretion system (Fig. 4). Under conditions of overexpression, only a 5-fold increase of the HlyA T1SS, from approximately 800 copies in the endogenous system to approximately 4,500 copies, was obtained. These copy numbers might be dependent on each other since TolC is not only part of the HlyA T1SS but also other tripartite systems such as AcrAB or MacAB (34, 36, 56–58). In 2004, Zgurskaya and coworkers quantified the amount of AcrA, AcrB, and TolC and detected approximately 5,000 to 7,000 copies of AcrA per cell during the exponential phase compared with approximately 500 copies of AcrB and approximately 1,500 copies of TolC (36). Currently, we cannot explain the difference between these and our results, but the amount of TolC in comparison to the amount of completely assembled AcrAB-TolC complexes confirms that only a part of the TolC pool is constantly engaged in this tripartite efflux pump (59). Even in light of the approximately 800 copies of the HlyA T1SS in UTI89, the number of TolC trimers is still sufficient to ensure the formation of other essential complexes. However, the number of TolC molecules and the amount of T1SS under conditions of overexpression (35) are nearly identical.
In a study with Salmonella enterica serovar Typhimurium, transmission electron microscopy (TEM) was used to determine the number of T3SS (60). Here, between 10 and 100 T3SS were observed on the cell surface. This is an 8-fold difference from the HlyA T1SS of UTI89. This difference is likely due to the different functions of the two secretion systems. T1SS targets the host cell by secretion of the substrate into the extracellular space and subsequent diffusion until a host cell is engaged, and pore formation can result in cell lysis. In contrast, the T3SS directly targets the infected cell and injects its pathogenic cargo into the host’s cytosol. For SipA, transport started 10 to 90 s after the injection needle penetrated the host cell’s plasma membrane and lasted between 100 and 600 s (61). In contrast, secretion of HlyA occurred in a time window ranging from early to mid-exponential phase and was turned off during the transition to the stationary phase (47). Thus, this T1SS operates similar to a broadly acting weapon, while the T3SS is more similar to a “precision strike” attack directly on the identified target. This difference in toxin versus effector action could be a reason for the 8-fold difference in the amount of the two secretion systems. The T3SS can deliver its pool of (6 ± 3) × 103 cargo molecules within 110 s (61), while the secretion of a single HlyA requires approximately 64 s (35). This further suggests that a larger amount of T1SS is required to reach a sufficient amount of hemolytic active HlyA in the extracellular space. Interestingly, the copy number of the Sec translocon, SecYEG, ranges between 200 and 600 (62–64). Thus, the HlyA T1SS and SecYEG are present at similar copy numbers.
Other studies have demonstrated that certain secretion systems, such as the Legionella T4SS (38) or Agrobacterium tumefaciens (65, 66) and the T3SS from Shigella (37), show specific polarizations. In the case of a T2SS from Vibrio cholerae, both the localization and the secretion appeared to be polarized (67). For the SecYEG translocon of Bacillus subtilis (68), a helical distribution was observed. Apparently, such a polarized localization might provide advantages, as the local concentration of secreted effectors can be easily increased (38). A possible polarization of a T1SS was, so far, not investigated. We demonstrated here that the HlyA T1SS adopts no discrete pattern or even polarization on the cell surface. This lack of polarization is also not influenced by the cell cycle (Fig. 6). Also, we show that this is not an artifact caused by overexpression since the endogenous system (E. coli UTI89) displayed an identical pattern. For HlyB, the mechanism required for insertion into the IM is not yet known; however, it very likely occurs via the Sec translocation in a cotranslational manner. In contrast, TolC is inserted into the OM while also being threaded through the peptidoglycan layer (69). The peptidoglycan undergoes constant reconstruction for inserting new proteins in the sacculus (70). Notably, the more restricted part of the T1SS with respect to diffusion is TolC. This is in line with experiments performed in S. enterica serovar Typhimurium (71). The TolC homolog SiiC of the SiiE T1SS was Halo tagged, while the ABC-transporter SiiF was SNAP tagged, and its localization was examined by superresolution microscopy. The SiiA T1SS clustered in a few unspecific spots, and SiiF possessed a low diffusion coefficient (71).
Additionally, it was shown in E. coli that binding of the bacteriocin colicin E9 to its OM receptor, OmpF, results in islands formation of OM protein islands of an average diameter of 0.5 μm that are composed of different membrane proteins of the OM (48). These OM islands then result in clustering of IM proteins such as the Tol complex (TolQ/TolR/TolA), which interacts with the OM protein Pal that is also engaged in these islands. Prior to Pal-TolC formation, the components of the Tol complex freely diffuse in the IM. However, upon interaction, clustering in the OM results in a similar clustering in the IM (72). Based on these and our own results, it is tempting to speculate that the pattern of surface distribution of the T1SS is determined by the interaction with TolC that is also present in OM islands with the IM components or with the peptidoglycan. The peptidoglycan grows from patches, which are inserted in the sacculus. When TolC is inserted via the Bam machinery (73) in the OM, it is likely that a physical interaction of the approximately 100-Å-long periplasmic helices of TolC with the peptidoglycan occurs. However, a “patch-like growing” (70) has been shown for the peptidoglycan, which might lead to clustering on the cell surface as recently proposed (70, 71). However, our data clearly demonstrate that the diameter of the T1SS clusters are significantly smaller than the diameter of OM islands (Fig. 5).
In the continuous growth of the sacculus, an immobilized T1SS would be forced to “follow” the growth direction of the sacculus, and, as a consequence, clustering would not be supported. Rather, the fluorescence signals of a stalled T1SS should correspond more to individual complex, which is not observed in our experiments. Bergmiller et al. (74) demonstrated exactly such a signal separation for the AcrAB-TolC complex. Here, fluorescence-tagged AcrB served as reporter. Under conditions of complex formation, i.e., assembly of the tripartite complex (AcrB/AcrA/TolC), the distribution of fluorescence in the cell was followed for several cell divisions. Here, a focus was on the long-lived phenotypic type of the maternal cell. The fluorescence measurement showed an uneven distribution of AcrB during cell division; 42% of eGFP-AcrB remained in the newly formed cell compared to 58% in the maternal cell. It was concluded that this distribution has a long-term effect (observation started after 100 min peaked and ended at 900 min) on the accumulation of AcrABTolC to one pole of the cell.
In conclusion, we show here that the T1SS distribution on the cell surface in wild-type E. coli UTI89 and BL21(DE3)-BD shows no specific pattern except clustering but, surely, no distinct polarization as described for T3SS or T4SS (37, 38, 65, 66). Furthermore, the T1SS in E. coli strain UTI89 was quantified giving approximately 800 copies of the HlyA T1SS at the endogenous level, compared to approximately 4,500 copies under conditions of overexpression of the IM components and the eGFP-fused substrate in BL21(DE). The stalling of the T1SS during secretion had no effect on the expression level of TolC (4,500 trimers). This indicates that T1SS and RND pumps, which both employ TolC (AcrAB, MacAB, and ColV T1SS [20, 36, 56]), can still recruit TolC, even when the HlyA T1SS is expressed in UTI89. The stalling of the HlyA T1SS at the endogenous level will not deplete the TolC pool. Regulation of T1SS expression ensures that a sufficient amount of TolC is present for assembly of the tripartite efflux pumps regardless of their vital role in resistance mechanisms (36, 55, 56, 75).
MATERIALS AND METHODS
Bacterial strains and plasmids.
E. coli DH5α cells were used for cloning. The generation of the pK184 plasmid coding for HlyB and HlyD and the pBAD plasmid coding for eGFP-HlyAc and eGFP-HlyA, respectively, was described previously (13). Plasmid pK184 is under the control of a Plac promoter (76), while the two pBAD-derived plasmids were under the control of a PBAD promoter. A synthetic, codon-optimized TolC gene (GenScript) was created based on the genomic sequence of TolC from E. coli BL21(DE3)-BD and inserted into a pET-25b(+) plasmid. Additionally, a C-terminal His tag and a thrombin cleavage site were introduced. All plasmids and oligonucleotides used in this study are summarized in Table S1 in the supplemental material. Two bacterial strains were used in this study, E. coli BL21(DE3)-BD for overexpression of HlyB and HlyD as well as eGFP-HlyAc, or eGFP-HlyA and the uropathogenic E. coli strain UTI89 (urinary tract infection) (77), which is the parental strain of HlyB, HlyD, and HlyA. Primers used in this study are listed in Table 1.
TABLE 1.
List of primers used in this study
| Primer name | Description | Reference |
|---|---|---|
| pSOI-HlyA-F | 5′-GATTGATTTAAAACTGCCAATACGCAAACCGCCTCTC-3′ | 13 |
| pSOI-HlyA-R | 5′-TTTAAATTAAAAATGTAGGGGTTCCGCGCACATTTCC-3′ | 76 |
| RF_pSOI-eGFP-for | 5′-CCATCATGGTGAGAATTTATATTTTCAAGGTGTG AGCAAGGGCGAGG-3′ | 13 |
| RF_pSOI-eGFP-rev | 5′-TGGAAGGGTGGGATTTACCGGACTTGTACAGCTCGTCCATGC-3′ | 13 |
| RF_pSOI-HlyA-for | 5′-CCCTTCCAGCATCGAAGGCCGCATGACAACAATAACCACTGCAC-3′ | 13 |
| RF_pSOI-HlyA-rev | 5′-TCCGCCAAAACAGCCAAGCTTATGCTGATGTGGTCAGGGT-3′ | 13 |
Cell cultivation and protein expression.
In the case of E. coli BL21(DE3)-BD, chemically competent cells were transformed with or without pK184-HlyBD and pBAD-eGFP-HlyAc, or pBAD-eGFP-HlyA, and grown at 37°C on 2× yeast extract-tryptone (2YT) agar plates supplemented with 100 μg mL−1 carbenicillin and 30 μg mL−1 kanamycin, respectively. Overnight cultures of a single colony were used to inoculate 25 mL 2YT supplemented with 100 μg mL−1 carbenicillin and 30 μg mL−1 kanamycin, respectively, at an OD600 of 0.1. Cultures were grown at 180 rpm, 37°C. The expression of HlyB and HlyD was induced by the addition of 1 mM IPTG (isopropyl-β-d-thiogalactopyranoside). The expression of eGFP-HlyAc or eGFP-HlyA was induced by the addition of 10 mM arabinose, and additionally, 5 mM CaCl2 was added to the media. Induction was started at an OD600 of 0.6 to 0.8 for 2 h. We harvested 1-mL aliquots by centrifugation for 3 min at 13,000 × g at room temperature (RT). Cells were adjusted with water to an ODequivalent of 0.1 and analyzed by Western blotting. Growth behavior of UTI89 cells was analyzed by taking aliquots every hour for up to 7 h with a final sample taken after overnight growth (approximately 14 h). Additionally, a growth curve was recorded in a Tecan (Sunrise) reader at 25°C with fast plate shaking.
The expression levels of HlyB and HlyD, as well as the expression levels of eGFP-HlyAc and eGFP-HlyA, were determined by Western blotting using polyclonal antibodies against HlyA, HlyB, or HlyD in combination with a horseradish peroxidase (HRP)-conjugated secondary antibody.
In the case of E. coli UTI89, electrical competent cells were transformed with pBAD-eGFP-HlyAc or pBAD-eGFP-HlyA and grown at 37°C on 2YT agar plates supplemented with 100 μg mL−1 carbenicillin. Overnight cultures of a single colony were used to inoculate 25 mL 2YT supplemented with 100 μg mL−1 carbenicillin and 30 μg mL−1 kanamycin, respectively, at an OD600 of 0.1. Cultures were grown at 180 rpm at 37°C. The expression of eGFP-HlyAc or eGFP-HlyA was induced by 10 mM arabinose, and additionally, 5 mM CaCl2 was added to the media. Induction was started at an OD600 of 0.6 to 0.8 for 2 h. We harvested 1-mL aliquots by centrifugation for 3 min at 13,000 × g at RT. Cells were adjusted with water to an ODequivalent of 0.1 and analyzed by Western blotting as described above.
Experiments to quantify TolC were performed with biological quintuplicates. The growth controls for UTI89 were performed in triplicates with technical quadruplicates for each clone. The quantification of T1SS polarization was performed at least twice. Expression controls are summarized in Fig. S1 [BL21(DE)] and Fig. S2 (UTI89).
Fluorescence spectroscopy of immunofluorescence-labeled and paraformaldehyde-treated E. coli UTI89 cells.
Immunofluorescence-labeled and paraformaldehyde-treated E. coli UTI89 cells expressing eGFP-HlyAc were adjusted to an OD600 of 1.0 and analyzed by fluorescence spectroscopy in a Horiba Fluorolog-3 to quantify the amount of T1SS in E. coli UTI89. All measurements were performed at 25°C in a 100-μL cuvette. Excitation was performed at 547 nm, and fluorescence emission was monitored at 563 nm with slit widths of 5 nm each. Fluorescence was recorded for 0.5 s. An identical experiment was carried out with phosphate-buffered saline (PBS) buffer and different concentrations of free Cy3 fluorophore-linked antibody (0.5 pM to 1.5 μM). To validate the results of the Cy3-labeled antibody, we used another, commercially available Cy3-labeled antibody (Molecular Probes). This antibody was used as described above to quantify the amount of T1SS in E. coli BL21(DE) (35). To obtain a background fluorescence for endogenous expression of HlyB, HlyD, and HlyA, UTI89 cells were treated as described above. To obtain the background fluorescence for eGFP-HlyAc, a sample of cells was induced and fixed without staining. The average signal count of unstained E. coli UTI89 with overexpressed eGFP-HlyAc at 563 nm was used as background.
Expression and purification of TolC in E. coli BL21(DE3)-BD.
Chemically competent E. coli BL21(DE3)-BD cells were transformed with pET-25b(+) TolC-6×His and grown at 37°C on 2YT agar plates supplemented with 100 μg mL−1 carbenicillin. Overnight cultures of a single colony were used to inoculate 6L 2YT supplemented with 100 μg mL−1 carbenicillin at an OD600 of 0.1. Cultures were grown at 180 rpm at 37°C. The expression of TolC was induced by 1 mM IPTG at an OD600 of 0.6 to 0.8 for 2 h. Cells were harvested by centrifugation for 15 min at 8,000 × g at 4°C. Twelve grams of cells were resuspended in lysis buffer (20 mM Tris, pH 7.8, 100 mM NaCl) and disrupted by three rounds at 1.5 kbar in a microfluidic cell disruptor (Microfluidics M-110P).
Cell debris was collected by centrifugation for 30 min at 30,000 × g and 4°C. The supernatant was applied to a high-spin centrifugation step for 90 min (200,000 × g at 4°C). The membrane pellet was resuspended in solubilization buffer (20 mM Tris pH 7.8, 250 mM NaCl). For storage at −80°C, 50% glycerol was added. For solubilization, membranes were thawed on ice and adjusted to 20 mg/mL overall protein concentration. Membranes were solubilized with 2% (wt/vol) Triton X-100 for 2 h at 4°C with gentle agitation in 20 mM Tris, pH 7.8, and 250 mM NaCl. Aggregates were separated by centrifugation at 100,000 × g for 10 min at 4°C. Solubilized membranes were diluted 1:1 with solubilization buffer, and 10 mM imidazole was added. Immobilized metal affinity chromatography (IMAC) purification was performed with an Ni2+-loaded 5-mL GE High Trap chelating column (GE Healthcare). After loading, detergent was exchanged. Thirty-column volume (CV) washing buffer (20 mM Tris pH 8, 300 mM NaCl, 0.01% DDM [N-dodecyl-β-d-maltopyranoside], and 10 mM imidazole) was used, followed by a 15-CV washing step with washing buffer supplemented with 100 mM imidazole. Elution was performed with washing buffer supplemented with 250 mM imidazole. The eluted protein was dialyzed overnight against 20 mM Tris, pH 8, 300 mM NaCl, 0.01% DDM, and 10 U thrombin per mg protein. The dialyzed protein was concentrated using a Millipore ultrafiltration device (molecular weight cutoff [MWCO] of 100 kDa) and loaded on a Superdex 200 increased 300/10 column (GE Healthcare). Fractions containing TolC were pooled, concentrated, and used for raising polyclonal TolC antibodies and quantification. Protein concentration was measured by a bicinchoninic acid (BCA) assay (Thermo Fisher).
Quantification of TolC in E. coli BL21(DE3)-BD and E. coli UTI89.
For the quantification of TolC, purified TolC was used in serial dilutions for quantitative Western blot analysis. Together with the serial dilutions, a reference sample of E. coli BL21(DE3)-BD was applied three times as a technical replicate to create an external standard for other Western blots. A polyclonal rabbit antibody against TolC was used for a quantitative Western blot analysis of E. coli BL21(DE3)-BD and E. coli UTI89. All blots used for quantification are summarized in Fig. S5 and S6.
Structured illumination microscopy.
Structured illumination microscopy was performed using the Zeiss Elyra PS.1 microscope system (Zeiss Microscopy GmbH, Oberkochen, Germany) equipped with a Plan Apochromat 63×/1.4 oil immersion lens objective. For excitation of DAPI, we used a 405-nm diode laser; for eGFP, a 488-nm diode laser; and for Abberior Star 635P, a 642-nm diode laser, respectively. Detection filters were set for the different channels as follows: for DAPI, bandpass (BP) 420–480/LP 750; for eGFP-HlyA, BP 495–570/LP 750; and for anti-HlyA plus Abberior Star 635P, LP 655. Three rotations with no averaging were set as parameters for SIM imaging. We acquired z-stacks that were processed internally with Zeiss ZEN black software at a fixed signal-to-noise filter of −6. Resulting data files contained superresolution and widefield data for all acquired channels. For downstream image analysis, the widefield of the DAPI channel and the superresolution data of HlyA signal in the red channel were used as maximum-intensity projections of the acquired z-stacks.
As a positive control, we acquired LifeAct-eGFP signal in Schizosaccharomyces pombe yeast cells that display clear accumulation of fluorescent signal depending on the life cycle with a Zeiss LSM 880 Airyscan microscope system (Zeiss Microscopy GmbH, Oberkochen, Germany), equipped with a Plan Apochromat 63×/1.4 oil immersion lens objective. Imaging parameters were set in Fast-Airyscan mode as follows. The pixel dwell time was set to 0.66 μs, with a line averaging of 4 at an excitation wavelength of 488 nm to excite LifeAct-eGFP and 633 nm as excitation wavelength of FM4-64FX dye (Thermo Fisher Scientific) for membrane staining. Detection filters were set as BP 420–480 + BP 495–550 for LifeAct-eGFP and BP 570–620/LP 645 for FM4-64FX. The resulting z-stacks were processed with the Zeiss Airyscan processing in ZEN black software using the automatic standard filter settings and converted into maximum-intensity projections before analysis with Fiji.
Staining.
After two h of induction, an ODequivalent of 0.1 from the induced cells was taken and centrifuged for 2 min at 13,000 × g at RT. The supernatant was discarded, and cells were resuspended in 100 μL fresh 2YT media. Bovine serum albumin (BSA) in PBS, pH 7.4, was added to a final concentration of 1% and incubated for 10 min at RT. Primary antibody (polyclonal rabbit) (35) against HlyA was added (1:50) and incubated under gentle agitation for 1 h at RT. Cells were collected by centrifugation for 2 min at 13,000 × g at RT and washed 3 times with 1 mL 2YT. After washing, the pellet was resuspended in 2 mL 4% paraformaldehyde (PFA) in PBS, pH 7.4. Cells were incubated under gentle agitation for 1 h at RT, collected again by centrifugation for 2 min at 13,000 × g at RT, and washed 2 times with 1 mL PBS, pH 7.4, followed by a third washing step with 100 mM NH4Cl in PBS, pH 7.4, for 20 min under gentle agitation to quench residual active PFA. Subsequently, cells were collected by centrifugation for 2 min at 13,000 × g at RT and washed 2 times with 1 mL PBS. Each aliquot was resuspended in 100 μL PBS containing 1% BSA. The secondary antibody (1:100) against rabbit was added, either with Cy3 label for the quantification experiment or AbberiorStar635P for the surface localization. Samples were incubated under gentle agitation for 1 h at RT, collected by centrifugation for 2 min at 13,000 × g at RT, and washed 3 times with 1 mL PBS, pH 7.4. Each aliquot was resuspended in 100 μL PBS. The DNA was stained by the addition of DAPI and incubated under gentle agitation for 5 min at RT before collecting by centrifugation for 2 min at 13,000 × g at RT and washing 3 times with 1 mL PBS. The cells were then resuspended in 100 μL PBS.
Slide preparation and postfixation.
For the sample preparation, poly-l-lysin slides were prepared freshly as follows. Cover glasses grade 1.5H were cleaned with 70% ethanol and dried by pressured air. Per cover glass, 500 μL of poly-l-lysin (0.1% [wt/vol] in H2O) was spread on top and incubated for 5 min. Residual poly-l-lysin was removed and dried with pressured air. The coated glass was placed cover up in a 12-well plate and overlaid with 1 mL PBS. Ten microliters of the stained sample were added to the well and mixed. The plate was centrifuged for 15 min at 4°C and 1,500 × g. The supernatant was discarded, and each sample was fixed to the coating by adding 1 mL PFA 4% in PBS to each sample for 10 min, washing with 1 mL PBS for 10 min, and finally washing with 1 mL PBS containing 100 mM NH4Cl for 10 min. The sample was finally washed 3 times with 1 mL PBS each. The cover glass with attached cells was then rinsed of residual PBS and embedded on a glass slide with one drop (10 μL) ProLong Diamond.
A detailed description of image processing can be found in the supplementary information.
Quantification of accumulated signal.
Image analysis for accumulated signals in the tip zones was carried out using a self-written Fiji macro. The full description of the workflow can be found in the supplementary information. In brief, the DAPI signal was preprocessed, and a threshold was created for slightly dilated bacterial outlines/regions of interest (ROIs). Based on this, rectangular areas of the bacterial mid-cell body and left/right tip zones were generated as cell area approximations that included the signals of the anti-HlyA antibody. These signal maxima were identified, and each signal intensity was estimated as the maximum of a calculated Gaussian fit across the plotted intensities of a small fixed-size box. The signal was intensity weighted in relation to the overall intensities present in the given image, e.g., resulting in an intensity score of 10 for the highest intensity found in the image or 1 for the lowest. Subsequently, the signal was normalized by the area size in which the signal was found to compensate for the effect that longer bacteria naturally have a higher chance to accumulate signals in the relatively large cell body. Next, the summed scores per zone (cell body/tip) of a single bacterium were compared, and the bacterium was finally classified. If a significant accumulation in one or both of the tip zones was detected (50% more weighted signal per area than the cell body), it was classified either as left-sided, right-sided, or as both-sided accumulated. Bacteria with less than three signals, no signals at all, or cells showing a cell body smaller than the tip zone areas were generally excluded from the analysis. The workflow of the Fiji macro was tested against two additional data sets:, a toy simulation of bacteria showing clear polarized accumulation of signals and images of Schizosaccharomyces pombe cells expressing LifeAct-eGFP with occasional accumulation of signals in the tips or cell body. Both showed results matching visual estimation (supplementary information). The threshold of >50% for accumulated classification was assessed by random signal toy simulations as the minimum threshold needed to avoid false-positive detected accumulation in five repetitions (supplementary information).
Quantification of anti-HlyA antibody signal size.
The median of the full width at half maximum (FWHM; width of a signal at half of its maximal intensity) of anti-HlyA signals served as an estimation for the cluster size. Therefore, the self-written Fiji macro was slightly modified to return the FWHM of the Gaussian fit across the small fixed bounding box around each signal. The Gaussian fit with y offset equation in Fiji is as follows:
where a is y offset, b is the height of the Gaussian fit peak at the expected value c, c is expected value (commonly labeled as μ), and d is standard deviation (commonly labeled as σ).
Each FWHM was calculated as
or
Signals of cells of 12 randomly chosen images from the BL21(DE3)-BD strain or the UTI89 strain were pooled, and values above 1 μm were filtered out, which were occasionally created by the Gaussian fit (∼6% of the 3,994 analyzed signals). These values were plotted in an Origin 9 histogram graph using bins of 5 nm and showing a calculated normal distribution curve of the data. On top of the graph, a box-and-whisker plot of the data is shown.
Distribution to relative cell length analysis.
Image analysis to investigate the overall distribution of anti-HlyA antibody signal in dependence of the size/length of the bacteria was performed using the already established Fiji plugin MicrobeJ [version 5.13i(20)-beta] (78). The detailed detection parameter for the MicrobeJ workflow can be found in the supplementary information. In summary, the preprocessed DAPI channel was used as a medial axis detection to generate outlines of the bacterial cells. To detect anti-HlyA antibody signals, the point-detection feature was applied to the anti-HlyA antibody channel. To include all signals of a bacterial cell, signals of 400 nm around the calculated boundaries of the bacterium were included. Results were displayed by the plugin-results feature, and a normalized heatmap was applied to visualize relative density of the signals dependent on their location. Finally, the plugin was used to plot the detected point-like anti-HlyA antibody signals to a length-normalized average shape or to plot the signal distribution according to the detected length of the cell. Twelve random images of BL21(DE3)-BD and UTI89 cells were used, resulting in 2,636 analyzed bacteria resulting in 16,777 signals for BL21(DE3)-BD and 2,000 bacterial cells resulting in 8,136 signals for UTI89, respectively.
ACKNOWLEDGMENTS
We thank Rodney Welch (University of Wisconsin-Madison) for the kind gift of UTI89. We are indebted to Colin McKenzie and Stefanie Scheu (Institute of Medical Microbiology and Hospital Hygiene [HHU]), as well as all members of the Institute of Biochemistry, for experimental support and stimulating discussions especially Hans Klose and Olivia Spitz. In addition, we thank Mohan Balasubramanian (Division of Biomedical Sciences, Warwick) for providing the S. pombe strain expressing LifeAct-eGFP and Abel Alcázar-Román (Eukaryotic Microbiology, Duesseldorf) for support in cultivating and handling the S. pombe cells.
This project was funded by the DFG (CRC 1208 project A01 to L.S. and project Z02 to S.W.-P.). The Center for Structural studies is funded by the DFG (grant number 417919780) to S.H.J.S.
Footnotes
Supplemental material is available online only.
Contributor Information
Lutz Schmitt, Email: lutz.schmitt@hhu.de.
Christopher A. Elkins, Centers for Disease Control and Prevention
REFERENCES
- 1.Carbonetti NH. 2010. Pertussis toxin and adenylate cyclase toxin: key virulence factors of Bordetella pertussis and cell biology tools. Future Microbiol 5:455–469. 10.2217/fmb.09.133. [DOI] [PMC free article] [PubMed] [Google Scholar]
- 2.Hasan S, Kulkarni NN, Asbjarnarson A, Linhartova I, Osicka R, Sebo P, Gudmundsson GH. 2018. Bordetella pertussis adenylate cyclase toxin disrupts functional integrity of bronchial epithelial layers. Infect Immun 86:e00445-17. 10.1128/IAI.00445-17. [DOI] [PMC free article] [PubMed] [Google Scholar]
- 3.Mouallem M, Farfel Z, Hanski E. 1990. Bordetella pertussis adenylate cyclase toxin: intoxication of host cells by bacterial invasion. Infect Immun 58:3759–3764. 10.1128/iai.58.11.3759-3764.1990. [DOI] [PMC free article] [PubMed] [Google Scholar]
- 4.Tam VC, Serruto D, Dziejman M, Brieher W, Mekalanos JJ. 2007. A type III secretion system in Vibrio cholerae translocates a formin/spire hybrid-like actin nucleator to promote intestinal colonization. Cell Host Microbe 1:95–107. 10.1016/j.chom.2007.03.005. [DOI] [PubMed] [Google Scholar]
- 5.Hooton TM, Stamm WE. 1997. Diagnosis and treatment of uncomplicated urinary tract infection. Infect Dis Clin North Am 11:551–581. 10.1016/s0891-5520(05)70373-1. [DOI] [PubMed] [Google Scholar]
- 6.Ristow LC, Welch RA. 2016. Hemolysin of uropathogenic Escherichia coli: a cloak or a dagger? Biochim Biophys Acta 1858:538–545. 10.1016/j.bbamem.2015.08.015. [DOI] [PubMed] [Google Scholar]
- 7.Costa TR, Felisberto-Rodrigues C, Meir A, Prevost MS, Redzej A, Trokter M, Waksman G. 2015. Secretion systems in Gram-negative bacteria: structural and mechanistic insights. Nat Rev Microbiol 13:343–359. 10.1038/nrmicro3456. [DOI] [PubMed] [Google Scholar]
- 8.Buttner D. 2012. Protein export according to schedule: architecture, assembly, and regulation of type III secretion systems from plant- and animal-pathogenic bacteria. Microbiol Mol Biol Rev 76:262–310. 10.1128/MMBR.05017-11. [DOI] [PMC free article] [PubMed] [Google Scholar]
- 9.Alvarez-Martinez CE, Christie PJ. 2009. Biological diversity of prokaryotic type IV secretion systems. Microbiol Mol Biol Rev 73:775–808. 10.1128/MMBR.00023-09. [DOI] [PMC free article] [PubMed] [Google Scholar]
- 10.Pukatzki S, Ma AT, Sturtevant D, Krastins B, Sarracino D, Nelson WC, Heidelberg JF, Mekalanos JJ. 2006. Identification of a conserved bacterial protein secretion system in Vibrio cholerae using the Dictyostelium host model system. Proc Natl Acad Sci USA 103:1528–1533. 10.1073/pnas.0510322103. [DOI] [PMC free article] [PubMed] [Google Scholar]
- 11.Zoued A, Brunet YR, Durand E, Aschtgen MS, Logger L, Douzi B, Journet L, Cambillau C, Cascales E. 2014. Architecture and assembly of the type VI secretion system. Biochim Biophys Acta 1843:1664–1673. 10.1016/j.bbamcr.2014.03.018. [DOI] [PubMed] [Google Scholar]
- 12.Leiman PG, Basler M, Ramagopal UA, Bonanno JB, Sauder JM, Pukatzki S, Burley SK, Almo SC, Mekalanos JJ. 2009. Type VI secretion apparatus and phage tail-associated protein complexes share a common evolutionary origin. Proc Natl Acad Sci USA 106:4154–4159. 10.1073/pnas.0813360106. [DOI] [PMC free article] [PubMed] [Google Scholar]
- 13.Lenders MHH, Weidtkamp-Peters S, Kleinschrodt D, Jaeger K-E, Smits SHJ, Schmitt L. 2015. Directionality of substrate translocation of the hemolysin A type I secretion system. Sci Rep 5:12470. 10.1038/srep12470. [DOI] [PMC free article] [PubMed] [Google Scholar]
- 14.Smith TJ, Font ME, Kelly CM, Sondermann H, O'Toole GA. 2018. An N-terminal retention module anchors the giant adhesin LapA of Pseudomonas fluorescens at the cell surface: a novel subfamily of type I secretion systems. J Bacteriol 200:e00734-17. 10.1128/JB.00734-17. [DOI] [PMC free article] [PubMed] [Google Scholar]
- 15.Barlag B, Hensel M. 2015. The giant adhesin SiiE of Salmonella enterica. Molecules 20:1134–1150. 10.3390/molecules20011134. [DOI] [PMC free article] [PubMed] [Google Scholar]
- 16.Guo S, Stevens CA, Vance TDR, Olijve LLC, Graham LA, Campbell RL, Yazdi SR, Escobedo C, Bar-Dolev M, Yashunsky V, Braslavsky I, Langelaan DN, Smith SP, Allingham JS, Voets IK, Davies PL. 2017. Structure of a 1.5-MDa adhesin that binds its Antarctic bacterium to diatoms and ice. Sci Adv 3:e1701440. 10.1126/sciadv.1701440. [DOI] [PMC free article] [PubMed] [Google Scholar]
- 17.Delepelaire P, Wandersman C. 1998. The SecB chaperone is involved in the secretion of the Serratia marcescens HasA protein through an ABC transporter. EMBO J 17:936–944. 10.1093/emboj/17.4.936. [DOI] [PMC free article] [PubMed] [Google Scholar]
- 18.Izadi-Pruneyre N, Wolff N, Redeker V, Wandersman C, Delepierre M, Lecroisey A. 1999. NMR studies of the C-terminal secretion signal of the haem-binding protein, HasA. Eur J Biochem 261:562–568. 10.1046/j.1432-1327.1999.00305.x. [DOI] [PubMed] [Google Scholar]
- 19.Šmajs D, Micenková L, Šmarda J, Vrba M, Ševčíková A, Vališová Z, Woznicová V. 2010. Bacteriocin synthesis in uropathogenic and commensal Escherichia coli: colicin E1 is a potential virulence factor. BMC Microbiol 10:288. 10.1186/1471-2180-10-288. [DOI] [PMC free article] [PubMed] [Google Scholar]
- 20.Zhang LH, Fath MJ, Mahanty HK, Tai PC, Kolter R. 1995. Genetic analysis of the colicin V secretion pathway. Genetics 141:25–32. 10.1093/genetics/141.1.25. [DOI] [PMC free article] [PubMed] [Google Scholar]
- 21.Noegel A, Rdest U, Springer W, Goebel W. 1979. Plasmid cistrons controlling synthesis and excretion of the exotoxin alpha-haemolysin of Escherichia coli. Mol Gen Genet 175:343–350. 10.1007/BF00397234. [DOI] [PubMed] [Google Scholar]
- 22.Welch RA. 1991. Pore-forming cytolysins of Gram-negative bacteria. Mol Microbiol 5:521–528. 10.1111/j.1365-2958.1991.tb00723.x. [DOI] [PubMed] [Google Scholar]
- 23.Ostolaza H, Soloaga A, Goni FM. 1995. The binding of divalent cations to Escherichia coli alpha-haemolysin. Eur J Biochem 228:39–44. [PubMed] [Google Scholar]
- 24.Chenal A, Guijarro JI, Raynal B, Delepierre M, Ladant D. 2009. RTX calcium binding motifs are intrinsically disordered in the absence of calcium: implication for protein secretion. J Biol Chem 284:1781–1789. 10.1074/jbc.M807312200. [DOI] [PubMed] [Google Scholar]
- 25.Balakrishnan L, Hughes C, Koronakis V. 2001. Substrate-triggered recruitment of the TolC channel-tunnel during type I export of hemolysin by Escherichia coli. J Mol Biol 313:501–510. 10.1006/jmbi.2001.5038. [DOI] [PubMed] [Google Scholar]
- 26.Mackman N, Nicaud JM, Gray L, Holland IB. 1985. Genetical and functional organisation of the Escherichia coli haemolysin determinant 2001. Mol Gen Genet 201:282–288. 10.1007/BF00425672. [DOI] [PubMed] [Google Scholar]
- 27.Pimenta AL, Young J, Holland IB, Blight MA. 1999. Antibody analysis of the localisation, expression and stability of HlyD, the MFP component of the E. coli haemolysin translocator. Mol Gen Genet 261:122–132. 10.1007/s004380050949. [DOI] [PubMed] [Google Scholar]
- 28.Wang RC, Seror SJ, Blight M, Pratt JM, Broome-Smith JK, Holland IB. 1991. Analysis of the membrane organization of an Escherichia coli protein translocator, HlyB, a member of a large family of prokaryote and eukaryote surface transport proteins. J Mol Biol 217:441–454. 10.1016/0022-2836(91)90748-u. [DOI] [PubMed] [Google Scholar]
- 29.Wandersman C, Delepelaire P. 1990. TolC, an Escherichia coli outer membrane protein required for hemolysin secretion. Proc Natl Acad Sci USA 87:4776–4780. 10.1073/pnas.87.12.4776. [DOI] [PMC free article] [PubMed] [Google Scholar]
- 30.Thanabalu T, Koronakis E, Hughes C, Koronakis V. 1998. Substrate-induced assembly of a contiguous channel for protein export from E. coli: reversible bridging of an inner-membrane translocase to an outer membrane exit pore. EMBO J 17:6487–6496. 10.1093/emboj/17.22.6487. [DOI] [PMC free article] [PubMed] [Google Scholar]
- 31.Bavro VN, Pietras Z, Furnham N, Perez-Cano L, Fernandez-Recio J, Pei XY, Misra R, Luisi B. 2008. Assembly and channel opening in a bacterial drug efflux machine. Mol Cell 30:114–121. 10.1016/j.molcel.2008.02.015. [DOI] [PMC free article] [PubMed] [Google Scholar]
- 32.Du D, Wang Z, James NR, Voss JE, Klimont E, Ohene-Agyei T, Venter H, Chiu W, Luisi BF. 2014. Structure of the AcrAB-TolC multidrug efflux pump. Nature 509:512–515. 10.1038/nature13205. [DOI] [PMC free article] [PubMed] [Google Scholar]
- 33.Koronakis V, Eswaran J, Hughes C. 2004. Structure and function of TolC: the bacterial exit duct for proteins and drugs. Annu Rev Biochem 73:467–489. 10.1146/annurev.biochem.73.011303.074104. [DOI] [PubMed] [Google Scholar]
- 34.Koronakis V, Sharff A, Koronakis E, Luisi B, Hughes C. 2000. Crystal structure of the bacterial membrane protein TolC central to multidrug efflux and protein export. Nature 405:914–919. 10.1038/35016007. [DOI] [PubMed] [Google Scholar]
- 35.Lenders MH, Beer T, Smits SH, Schmitt L. 2016. In vivo quantification of the secretion rates of the hemolysin A Type I secretion system. Sci Rep 6:33275. 10.1038/srep33275. [DOI] [PMC free article] [PubMed] [Google Scholar]
- 36.Tikhonova EB, Zgurskaya HI. 2004. AcrA, AcrB, and TolC of Escherichia coli form a stable intermembrane multidrug efflux complex. J Biol Chem 279:32116–32124. 10.1074/jbc.M402230200. [DOI] [PubMed] [Google Scholar]
- 37.Jaumouillé V, Francetic O, Sansonetti PJ, Tran Van Nhieu G. 2008. Cytoplasmic targeting of IpaC to the bacterial pole directs polar type III secretion in Shigella. EMBO J 27:447–457. 10.1038/sj.emboj.7601976. [DOI] [PMC free article] [PubMed] [Google Scholar]
- 38.Jeong KC, Ghosal D, Chang YW, Jensen GJ, Vogel JP. 2017. Polar delivery of Legionella type IV secretion system substrates is essential for virulence. Proc Natl Acad Sci USA 114:8077–8082. 10.1073/pnas.1621438114. [DOI] [PMC free article] [PubMed] [Google Scholar]
- 39.Beer T. 2019. Isolation and cellular characterization of the hemolysin A type I secretion system from Escherichia coli. PhD thesis. Heinrich Heine University Düsseldorf, Düsseldorf, Germany. [Google Scholar]
- 40.Ausubel FM. 2002. Short protocols in molecular biology, 2nd ed, vol 5. John Wiley & Sons, New York, NY. [Google Scholar]
- 41.Bailey MJA, Hughes C, Koronakis V. 1997. RfaH and the ops element, components of a novel system controlling bacterial transcription elongation. Mol Microbiol 26:845–851. 10.1046/j.1365-2958.1997.6432014.x. [DOI] [PubMed] [Google Scholar]
- 42.Leeds JA, Welch RA. 1996. RfaH enhances elongation of Escherichia coli hlyCABD mRNA. J Bacteriol 178:1850–1857. 10.1128/jb.178.7.1850-1857.1996. [DOI] [PMC free article] [PubMed] [Google Scholar]
- 43.Leeds JA, Welch RA. 1997. Enhancing transcription through the Escherichia coli hemolysin operon, hlyCABD: rfaH and upstream JUMPStart DNA sequences function together via a postinitiation mechanism. J Bacteriol 179:3519–3527. 10.1128/jb.179.11.3519-3527.1997. [DOI] [PMC free article] [PubMed] [Google Scholar]
- 44.Lemonnier M, Landraud L, Lemichez E. 2007. Rho GTPase-activating bacterial toxins: from bacterial virulence regulation to eukaryotic cell biology. FEMS Microbiol Rev 31:515–534. 10.1111/j.1574-6976.2007.00078.x. [DOI] [PubMed] [Google Scholar]
- 45.Thomas S, Holland IB, Schmitt L. 2014. The type 1 secretion pathway - the hemolysin system and beyond. Biochim Biophys Acta 1843:1629–1641. 10.1016/j.bbamcr.2013.09.017. [DOI] [PubMed] [Google Scholar]
- 46.Schnaitman CA, Klena JD. 1993. Genetics of lipopolysaccharide biosynthesis in enteric bacteria. Microbiol Rev 57:655–682. 10.1128/mr.57.3.655-682.1993. [DOI] [PMC free article] [PubMed] [Google Scholar]
- 47.Nicaud J-M, Mackman N, Gray L, Holland IB. 1985. Regulation of haemolysin synthesis in E. coli determined by HLY genes of human origin. Mol Gen Genet 199:111–116. 10.1007/BF00327519. [DOI] [PubMed] [Google Scholar]
- 48.Rassam P, Copeland NA, Birkholz O, Tóth C, Chavent M, Duncan AL, Cross SJ, Housden NG, Kaminska R, Seger U, Quinn DM, Garrod TJ, Sansom MSP, Piehler J, Baumann CG, Kleanthous C. 2015. Supramolecular assemblies underpin turnover of outer membrane proteins in bacteria. Nature 523:333–336. 10.1038/nature14461. [DOI] [PMC free article] [PubMed] [Google Scholar]
- 49.Zhang A, Rosner JL, Martin RG. 2008. Transcriptional activation by MarA, SoxS and Rob of two tolC promoters using one binding site: a complex promoter configuration for tolC in Escherichia coli. Mol Microbiol 69:1450–1455. 10.1111/j.1365-2958.2008.06371.x. [DOI] [PMC free article] [PubMed] [Google Scholar]
- 50.Masuda N, Church GM. 2003. Regulatory network of acid resistance genes in Escherichia coli. Mol Microbiol 48:699–712. 10.1046/j.1365-2958.2003.03477.x. [DOI] [PubMed] [Google Scholar]
- 51.Leblanc SKD, Oates CW, Raivio TL. 2011. Characterization of the induction and cellular role of the BaeSR two-component envelope stress response of Escherichia coli. J Bacteriol 193:3367–3375. 10.1128/JB.01534-10. [DOI] [PMC free article] [PubMed] [Google Scholar]
- 52.Bury-Moné S, Nomane Y, Reymond N, Barbet R, Jacquet E, Imbeaud S, Jacq A, Bouloc P. 2009. Global analysis of extracytoplasmic stress signaling in Escherichia coli. PLoS Genet 5:e1000651. 10.1371/journal.pgen.1000651. [DOI] [PMC free article] [PubMed] [Google Scholar]
- 53.Parker A, Gottesman S. 2016. Small RNA regulation of TolC, the outer membrane component of bacterial multidrug transporters. J Bacteriol 198:1101–1113. 10.1128/JB.00971-15. [DOI] [PMC free article] [PubMed] [Google Scholar]
- 54.Nichols RJ, Sen S, Choo YJ, Beltrao P, Zietek M, Chaba R, Lee S, Kazmierczak KM, Lee KJ, Wong A, Shales M, Lovett S, Winkler ME, Krogan NJ, Typas A, Gross CA. 2011. Phenotypic landscape of a bacterial cell. Cell 144:143–156. 10.1016/j.cell.2010.11.052. [DOI] [PMC free article] [PubMed] [Google Scholar]
- 55.Sulavik MC, Houseweart C, Cramer C, Jiwani N, Murgolo N, Greene J, DiDomenico B, Shaw KJ, Miller GH, Hare R, Shimer G. 2001. Antibiotic susceptibility profiles of Escherichia coli strains lacking multidrug efflux pump genes. Antimicrob Agents Chemother 45:1126–1136. 10.1128/AAC.45.4.1126-1136.2001. [DOI] [PMC free article] [PubMed] [Google Scholar]
- 56.Fitzpatrick AWP, Llabres S, Neuberger A, Blaza JN, Bai XC, Okada U, Murakami S, van Veen HW, Zachariae U, Scheres SHW, Luisi BF, Du D. 2017. Structure of the MacAB-TolC ABC-type tripartite multidrug efflux pump. Nat Microbiol 2:17070. 10.1038/nmicrobiol.2017.70. [DOI] [PMC free article] [PubMed] [Google Scholar]
- 57.Fralick JA. 1996. Evidence that TolC is required for functioning of the Mar/AcrAB efflux pump of Escherichia coli. J Bacteriol 178:5803–5805. 10.1128/jb.178.19.5803-5805.1996. [DOI] [PMC free article] [PubMed] [Google Scholar]
- 58.Shi X, Chen M, Yu Z, Bell JM, Wang H, Forrester I, Villarreal H, Jakana J, Du D, Luisi BF, Ludtke SJ, Wang Z. 2019. In situ structure and assembly of the multidrug efflux pump AcrAB-TolC. Nat Commun 10:2635. 10.1038/s41467-019-10512-6. [DOI] [PMC free article] [PubMed] [Google Scholar]
- 59.Krishnamoorthy G, Tikhonova EB, Dhamdhere G, Zgurskaya HI. 2013. On the role of TolC in multidrug efflux: the function and assembly of AcrAB-TolC tolerate significant depletion of intracellular TolC protein. Mol Microbiol 87:982–997. 10.1111/mmi.12143. [DOI] [PMC free article] [PubMed] [Google Scholar]
- 60.Kubori T, Matsushima Y, Nakamura D, Uralil J, Lara-Tejero M, Sukhan A, Galan JE, Aizawa SI. 1998. Supramolecular structure of the Salmonella typhimurium type III protein secretion system. Science 280:602–605. 10.1126/science.280.5363.602. [DOI] [PubMed] [Google Scholar]
- 61.Schlumberger MC, Muller AJ, Ehrbar K, Winnen B, Duss I, Stecher B, Hardt WD. 2005. Real-time imaging of type III secretion: Salmonella SipA injection into host cells. Proc Natl Acad Sci USA 102:12548–12553. 10.1073/pnas.0503407102. [DOI] [PMC free article] [PubMed] [Google Scholar]
- 62.Drew D, Fröderberg L, Baars L, De Gier J-WL. 2003. Assembly and overexpression of membrane proteins in Escherichia coli. Biochim Biophys Acta 1610:3–10. 10.1016/S0005-2736(02)00707-1. [DOI] [PubMed] [Google Scholar]
- 63.Matsuyama S-I, Fujita Y, Sagara K, Mizushima S. 1992. Overproduction, purification and characterization of SecD and SecF, integral membrane components of the protein translocation machinery of Escherichia coli. Biochim Biophys Acta 1122:77–84. 10.1016/0167-4838(92)90130-6. [DOI] [PubMed] [Google Scholar]
- 64.Moran U, Phillips R, Milo R. 2010. SnapShot: key numbers in biology. Cell 141:1262–1262.e1. 10.1016/j.cell.2010.06.019. [DOI] [PubMed] [Google Scholar]
- 65.Atmakuri K, Cascales E, Burton OT, Banta LM, Christie PJ. 2007. Agrobacterium ParA/MinD-like VirC1 spatially coordinates early conjugative DNA transfer reactions. EMBO J 26:2540–2551. 10.1038/sj.emboj.7601696. [DOI] [PMC free article] [PubMed] [Google Scholar]
- 66.Judd PK, Kumar RB, Das A. 2005. Spatial location and requirements for the assembly of the Agrobacterium tumefaciens type IV secretion apparatus. Proc Natl Acad Sci USA 102:11498–11503. 10.1073/pnas.0505290102. [DOI] [PMC free article] [PubMed] [Google Scholar]
- 67.Scott ME, Dossani ZY, Sandkvist M. 2001. Directed polar secretion of protease from single cells of Vibrio cholerae via the type II secretion pathway. Proc Natl Acad Sci USA 98:13978–13983. 10.1073/pnas.241411198. [DOI] [PMC free article] [PubMed] [Google Scholar]
- 68.Campo N, Tjalsma H, Buist G, Stepniak D, Meijer M, Veenhuis M, Westermann M, Muller JP, Bron S, Kok J, Kuipers OP, Jongbloed JD. 2004. Subcellular sites for bacterial protein export. Mol Microbiol 53:1583–1599. 10.1111/j.1365-2958.2004.04278.x. [DOI] [PubMed] [Google Scholar]
- 69.Meroueh SO, Bencze KZ, Hesek D, Lee M, Fisher JF, Stemmler TL, Mobashery S. 2006. Three-dimensional structure of the bacterial cell wall peptidoglycan. Proc Natl Acad Sci USA 103:4404–4409. 10.1073/pnas.0510182103. [DOI] [PMC free article] [PubMed] [Google Scholar]
- 70.Typas A, Banzhaf M, Gross CA, Vollmer W. 2011. From the regulation of peptidoglycan synthesis to bacterial growth and morphology. Nat Rev Microbiol 10:123–136. 10.1038/nrmicro2677. [DOI] [PMC free article] [PubMed] [Google Scholar]
- 71.Barlag B, Beutel O, Janning D, Czarniak F, Richter CP, Kommnick C, Göser V, Kurre R, Fabiani F, Erhardt M, Piehler J, Hensel M. 2016. Single molecule super-resolution imaging of proteins in living Salmonella enterica using self-labelling enzymes. Sci Rep 6:31601. 10.1038/srep31601. [DOI] [PMC free article] [PubMed] [Google Scholar]
- 72.Rassam P, Long KR, Kaminska R, Williams DJ, Papadakos G, Baumann CG, Kleanthous C. 2018. Intermembrane crosstalk drives inner-membrane protein organization in Escherichia coli. Nat Commun 9:1082. 10.1038/s41467-018-03521-4. [DOI] [PMC free article] [PubMed] [Google Scholar]
- 73.Hagan CL, Silhavy TJ, Kahne D. 2011. Beta-barrel membrane protein assembly by the Bam complex. Annu Rev Biochem 80:189–210. 10.1146/annurev-biochem-061408-144611. [DOI] [PubMed] [Google Scholar]
- 74.Bergmiller T, Andersson AMC, Tomasek K, Balleza E, Kiviet DJ, Hauschild R, Tkačik G, Guet CC. 2017. Biased partitioning of the multidrug efflux pump AcrAB-TolC underlies long-lived phenotypic heterogeneity. Science 356:311–315. 10.1126/science.aaf4762. [DOI] [PubMed] [Google Scholar]
- 75.Sennhauser G, Amstutz P, Briand C, Storchenegger O, Grutter MG. 2007. Drug export pathway of multidrug exporter AcrB revealed by DARPin inhibitors. PLoS Biol 5:e7. 10.1371/journal.pbio.0050007. [DOI] [PMC free article] [PubMed] [Google Scholar]
- 76.Bakkes PJ, Jenewein S, Smits SH, Holland IB, Schmitt L. 2010. The rate of folding dictates substrate secretion by the Escherichia coli hemolysin type 1 secretion system. J Biol Chem 285:40573–40580. 10.1074/jbc.M110.173658. [DOI] [PMC free article] [PubMed] [Google Scholar]
- 77.Mulvey MA, Schilling JD, Hultgren SJ. 2001. Establishment of a persistent Escherichia coli reservoir during the acute phase of a bladder infection. Infect Immun 69:4572–4579. 10.1128/IAI.69.7.4572-4579.2001. [DOI] [PMC free article] [PubMed] [Google Scholar]
- 78.Ducret A, Quardokus EM, Brun YV. 2016. MicrobeJ, a tool for high throughput bacterial cell detection and quantitative analysis. Nat Microbiol 1:16077. 10.1038/nmicrobiol.2016.77. [DOI] [PMC free article] [PubMed] [Google Scholar]
Associated Data
This section collects any data citations, data availability statements, or supplementary materials included in this article.
Supplementary Materials
Supplemental information/methods, Tables S1 to S3, Fig. S1 to S8, links to accessible files.. Download aem.01896-21-s0001.pdf, PDF file, 5.5 MB (5.5MB, pdf)