

Introduction
Across the marine landscape, from estuaries to the open ocean, biota take up silicon (Si) as monosilicic acid and deposit it into their tissues as biogenic silica (BSi). Along the coast, vegetated ecosystems, such as salt marshes and mangroves, sequester a significant amount of Si in their tissues and likely help regulate the availability of Si in surrounding waters (Carey & Fulweiler, 2014; Elizondo et al., 2021). Si is also accumulated by sponges, euglyphid amoebae, radiolarians, silicoflagellates, and choanoflagellates, as well as a few coccolithophores, Prasinophyceae, and picocyanobacteria (Raven & Giordano, 2009; Gadd & Raven, 2010; Baines et al., 2012). The dominant driver of coastal (and open ocean) Si cycling, however, is generally thought to be diatoms. These siliceous phytoplankton require Si on a 1 : 1 molar ratio with nitrogen (N). Diatoms are responsible for 40–50% of global marine primary production (Field et al., 1998; Rousseaux & Gregg, 2013) and form the base of the marine food web in many parts of the ocean, especially coastal temperate regions (Irigoien et al., 2002).
Macroalgae are also important primary producers, particularly in shallow coastal marine ecosystems, with global net primary production of 80–210 Tmol C yr−1 (Raven, 2018). Macroalgae act as a food source for grazers (Horne et al., 1994) and play a large role in altering the cycling of nutrients, such as N and phosphorus (P) (Hersh, 1995). Many estuaries have experienced a shift towards macroalgae as the dominant group of primary producers over the past several decades (Valiela et al., 1992; Hauxwell et al., 2001; Potter et al., 2021). This is due to the ability of macroalgae to thrive in nutrient-rich systems, displacing other primary producers by way of rapid uptake of N and P and shading of photosynthetic organisms below (e.g. the seagrass Zostera; Valiela et al., 1992, 1997; Peckol et al., 1994).
The role of macroalgae on Si availability, however, is largely unconstrained, with only a few published studies reporting BSi concentrations. Work on freshwater macrophytes found BSi concentrations ranged from 0.2% to 2.8% (by dry weight), and the percentage of BSi was positively correlated to water flow (Schoelynck et al., 2010, 2012). Research from four decades ago on freshwater macroalgae demonstrated more rapid growth in Cladophora glomerata when Si was added to the growth medium (Moore & Traquair, 1976). The stipe of Ecklonia cava was reported to contain BSi concentrations of 13.35 lg g−1 dry mass (0.0013% BSi), and the tissue of Delisea fimbriaia contained 1530 lg g−1 dry mass (0.15% BSi) (Fu et al., 2000). More recently, BSi concentrations of the sporophytes of kelp, Saccharian japonica, were found to vary by location on the blade (Mizuta & Yasui, 2012) and to increase when S. japonica experienced various stresses (Mizuta et al., 2021). Similarly, BSi concentrations of Pyropia yezoensis increased when exposed to increased temperature and reached a concentration of 30% BSi (Le et al., 2019).
We hypothesized that marine macroalgae may contain significant amounts of Si in their biomass and thus could impact the Si cycle of coastal ecosystems. To determine the extent to which marine macroalgae are a reservoir of Si, we quantified BSi concentrations from 12 macroalgae genera from two temperate estuaries (Narragansett Bay, Rhode Island, and Waquoit Bay, Massachusetts, USA), and from a subset of samples we measured macroalgae percentage carbon (C). Finally, from one of the estuaries, we used macroalgae d13C values, which can be used as a proxy for identifying CO2 or bicarbonate source in photosynthesis, to infer the presence/absence of C concentration mechanisms (Raven et al., 2002) and as an indicator of productivity (Oczkowski et al., 2010). We then examined the relationship between BSi concentrations and macroalgae d13C to better understand mechanisms driving BSi uptake.
Materials and Methods
Macroalgae sampling
We collected macroalgae samples from Waquoit Bay (MA, USA) from the surface water using a sampling net, or from the bottom water using a Ponar benthic grab (523 cm2). Three sites were sampled (Child’s River Estuary, Metoxit Point, and Sage Lot Pond) on four separate occasions (September 2015, October 2015, and twice in June 2016). We also collected macroalgae samples by hand from 19 sites in Narragansett Bay (RI, USA) on one occasion (September 2015). Narragansett Bay samples were collected from just below the water surface at the bases of lighthouses and rocky outcrops during low tide. All samples were stored in plastic containers and bags in the dark until return to the laboratory, where they were then frozen until analysis.
Biogenic silica, carbon : nitrogen, and d13C analysis
Before BSi analysis, the macroalgae samples were separated by genus and, where possible, to species. Next, they were rinsed with deionized water and gently brushed to remove any visible epiphytes. Samples were then placed in ethanol-cleaned aluminum tins, and dried at 60°C for a minimum of 72 h. Following drying, the sample was ground and homogenized using a Wig-L-Bug™ (Fisher Scientific, Waltham, MA, USA).
We quantified BSi concentrations in the ground macroalgae samples using the wet alkaline extraction technique in 1% sodium carbonate solution wet alkaline digestion method (DeMaster, 1981; Conley & Schelske, 2002). Briefly, 30 mg of ground sample (weighed to a precision of 0.1 mg) was processed in flat-bottomed polyethylene bottles. We used a Seal AA3 (Seal Analytical Ltd, Mequon, WI, USA) flow injection autoanalyzer to determine dissolved silica (SiO2) concentrations of the digestate using the molybdenum blue colorimetric method (Strickland & Parsons, 1968). We used sodium hexafluorosilicate as the Si standard (Strickland & Parsons, 1968) as well as Hach external standards, to ensure accuracy. All standards were within 4% of expected value, and minimum detection limits during analysis were 0.030 μmol l−1. We then converted dissolved SiO2 concentrations of the digestate back to macroalgae percentage BSi by mass (Conley & Schelske, 2002). Finally, when reporting molar ratios of C : Si, we converted our BSi values to Si by multiplying by 0.47, the mass fraction of Si in the SiO2 molecule (Elizondo et al., 2021).
A subset of the Waquoit Bay macroalgae samples were analyzed for percentage C and N using standard methods (Dalsgaard et al., 2000) and a Eurovector CHN elemental analyzer at the Boston University Stable Isotopes Lab (Boston, MA, USA). All of the Narragansett Bay samples were analyzed for percent C and N and d13C on a Carlo-Erba NA 1500 Series II elemental analyzer interfaced with a Micromass Optima mass spectrometer (Oczkowski et al., 2018).
Data analysis
All statistical analyses were conducted in R v.3.6.0 (R Development Team, 2014). We considered the results of statistical tests to be significant when P ≤ 0.05. Figures were made using ggplot2 (Wickham, 2016) and cowplot (Wilke, 2019). We determined data distributions using the fitdistrplus package (Marie et al., 2015) by comparing whether the data were best described by a normal, lognormal, or gamma distribution. Percentage BSi data were best described by a lognormal distribution, and C : Si best fit a gamma distribution. All measured d13C values were negative, so we mirrored them around zero to test their distribution, which we found to be normal.
To compare the relationship of macroalgae percentage BSi across phyla and genera, we used a generalized linear mixed model (GLMM) approach via the lme4 package (Bates et al., 2015). In each GLMM, we set phylum or genus as a fixed effect and the estuary as a random effect. The percentage BSi data were lognormally distributed, so we first applied a log transformation to the percentage BSi data before constructing the model, but the resulting models had heteroscedastic residuals. We remade the model using a gamma family with a log-link, after which the residual distribution improved (Zuur et al., 2009). Following model construction, we compared groups using pairwise least-square means tests using the emmeans package (Lenth, 2018). We tested for relationships between percentage C and BSi concentrations and between log-transformed BSi concentrations and d13C using linear regressions. We tested for correlations between percentage BSi or percentage C with latitude using Spearman correlation.
Results
Individual macroalgae samples varied widely in BSi concentration from a low of 0.13% in Laminaria to a high of 39.4% in Polysiphonia (Fig. 1). At the phylum level, Rhodophyta had significantly (P < 0.0001) higher BSi concentrations than Ochrophyta and Chlorophyta, and Chlorophyta had significantly (P < 0.0001) higher BSi concentrations than Ochrophyta. The high Rhodophyta BSi concentrations were primarily driven by the genera Cystoclonium and Polysiphonia, which exhibited BSi concentrations almost 10 times that of the other macroalgae samples, regardless of phylum (Table 1). Genera BSi concentrations within Chlorophyta and Ochrophyta were not significantly different from each other. Genera within Rhodophyta were statistically different from each other (Table 2).
Fig. 1.
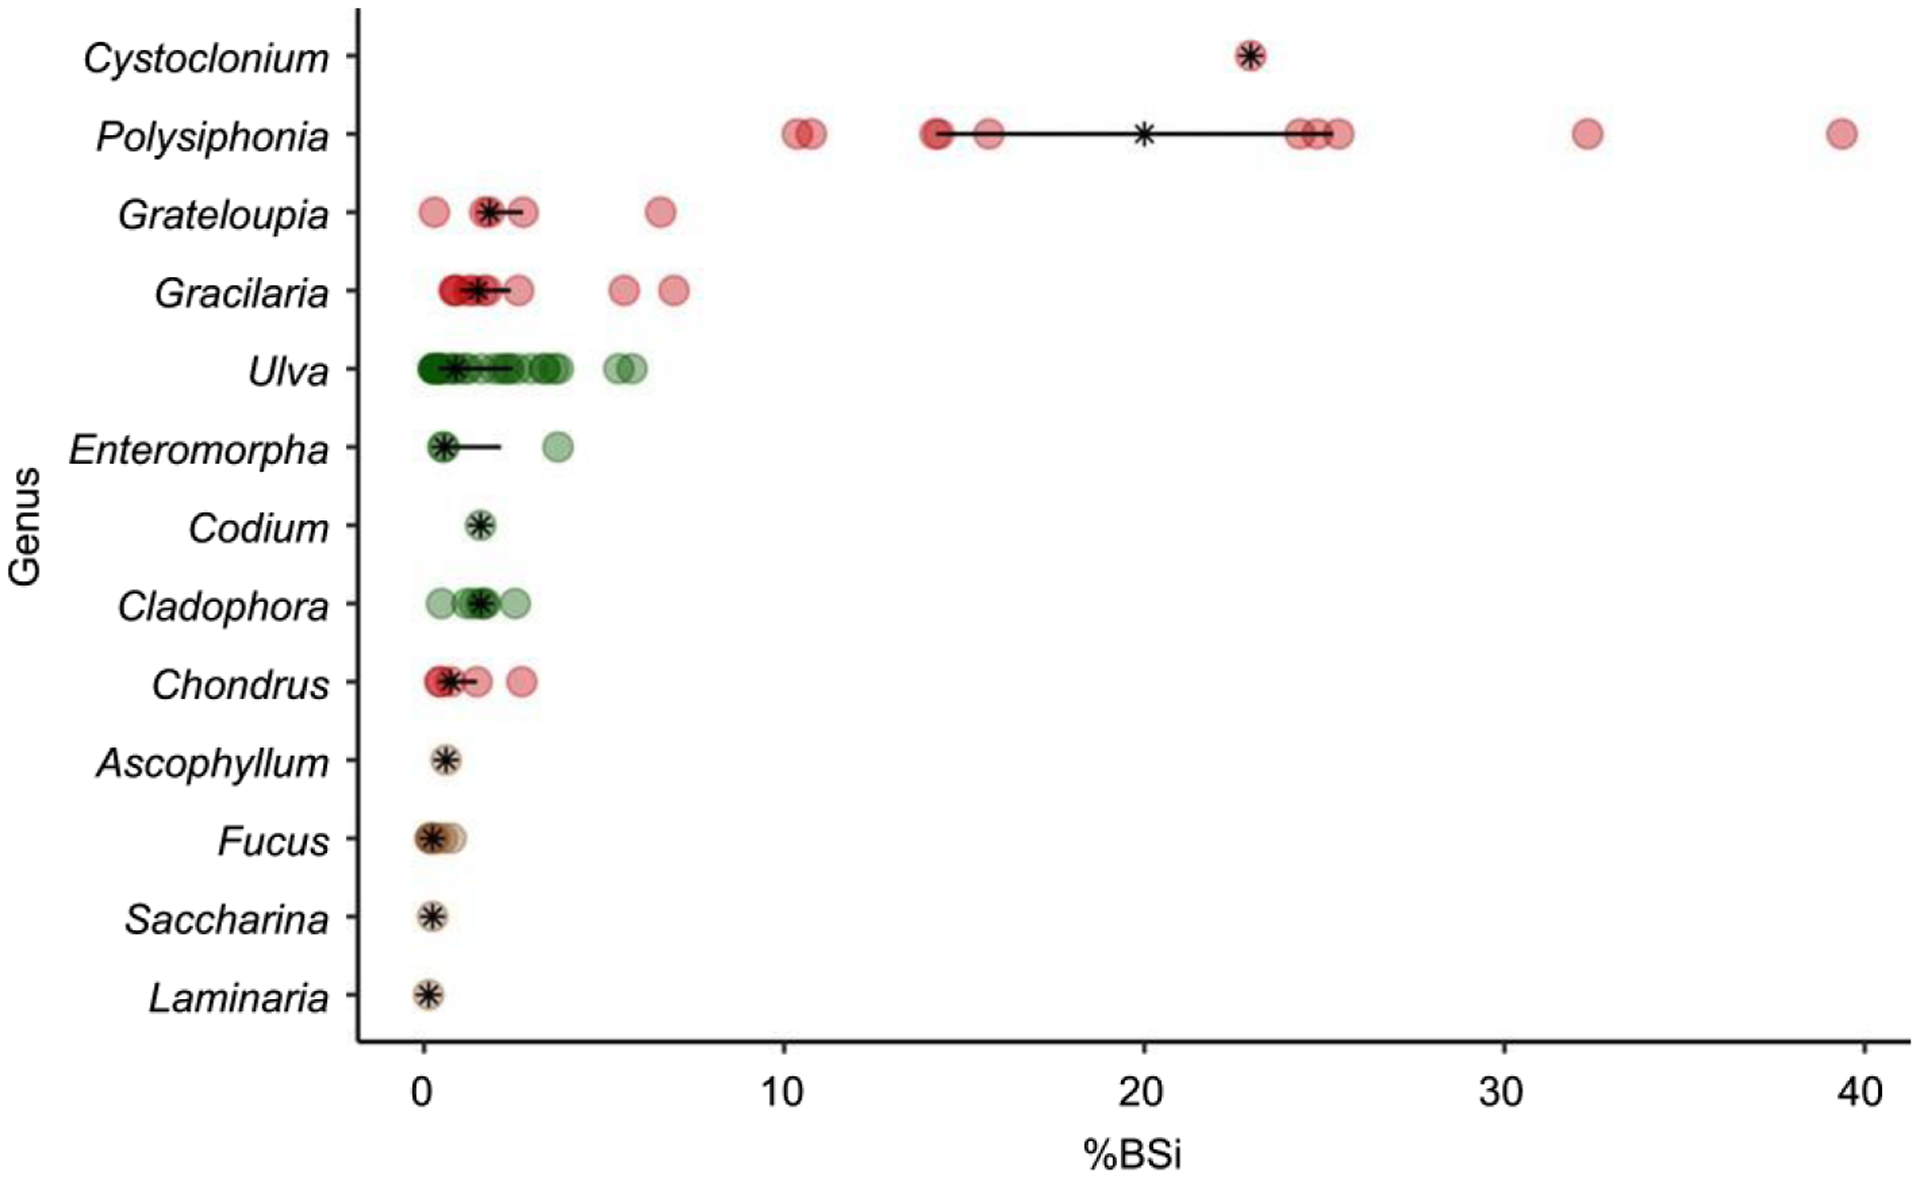
Median (black asterisk) and the interquartile range of biogenic silica (%BSi as SiO2 per DW) concentrations of macroalgae by genus. Individual sample values are also shown as circles color coded by phylum (Chlorophyta, green; Ochrophyta, brown; Rhodoyphta, red).
Table 1.
Mean (± SE) biogenic silica concentrations (%BSi as SiO2 DW) in macroalgae from Narragansett Bay (RI, USA) and Waquoit Bay (MA, USA).
| Phylum | Genus | n | %BSi |
|---|---|---|---|
| Chlorophyta | Cladophora | 7 | 1.50 ± 0.23 |
| Codium | 1 | 1.57 | |
| Enteromorpha | 3 | 1.60 ± 1.06 | |
| Ulva | 31 | 1.63 ± 0.28 | |
| Ochrophyta | Ascophyllum | 1 | 0.61 |
| Fucus | 7 | 0.34 ± 0.08 | |
| Laminaria | 1 | 0.13 | |
| Saccharina | 1 | 0.24 | |
| Rhodophyta | Chondrus | 5 | 1.16 ± 0.43 |
| Cystoclonium | 1 | 22.96 | |
| Gracilaria | 10 | 2.37 ± 0.68 | |
| Grateloupia | 5 | 2.62 ± 1.06 | |
| Polysiphonia | 10 | 21.15 ± 3.07 |
Table 2.
P-values from least square mean comparisons of biogenic silica (%BSi as SiO2 per dry wt) content of macroalgae genera.
| Chondrus | Cladophora | Codium | Cystoclonium | Enteromorpha | Fucus | Gracilaria | Grateloupia | Laminaria | Polysiphonia | Saccharina | Ulva | |
|---|---|---|---|---|---|---|---|---|---|---|---|---|
| Ascophyllum | 0.999 | 0.996 | 1.00 | 0.031 | 0.996 | 1.00 | 0.876 | 0.853 | 0.957 | <0.001 | 1.00 | 0.985 |
| Chondrus | 1.00 | 1.00 | 0.015 | 1.00 | 0.179 | 0.874 | 0.883 | 0.237 | <0.001 | 0.757 | 0.999 | |
| Cladophora | 1.00 | 0.033 | 1.00 | 0.011 | 0.990 | 0.988 | 0.089 | <0.001 | 0.492 | 1.00 | ||
| Codium | 0.336 | 1.00 | 0.773 | 1.00 | 1.00 | 0.444 | 0.045 | 0.847 | 1.00 | |||
| Cystoclonium | 0.090 | <0.001 | 0.151 | 0.268 | <0.001 | 1.00 | 0.001 | 0.027 | ||||
| Enteromorpha | 0.111 | 1.00 | 1.00 | 0.137 | <0.001 | 1.00 | 1.00 | |||||
| Fucus | <0.001 | <0.001 | 0.991 | <0.001 | 1.00 | <0.001 | ||||||
| Gracilaria | 1.00 | 0.011 | <0.001 | 0.135 | 0.978 | |||||||
| Grateloupia | 0.012 | <0.001 | 0.136 | 0.984 | ||||||||
| Laminaria | <0.001 | 1.00 | 0.039 | |||||||||
| Polysiphonia | <0.001 | <0.001 | ||||||||||
| Saccharina | 0.330 |
Significant differences (P ≤ 0.05) are bolded. See Table 1 for mean BSi concentrations.
BSi concentrations were significantly negatively related to percentage C (P < 0.0001, R2 = 0.48; Fig. 2a). There was also a significant negative relationship between log-transformed macroalgae BSi concentrations and d13C (P < 0.01, R2 = 0.42; Fig. 2b), where d13C was more depleted as BSi concentrations increased.
Fig. 2.

Relationship between (a) biogenic silica (%BSi as SiO2 per DW) and percentage carbon (%C) content and (b) biogenic silica and d13C in macroalgae samples collected from Narragansett Bay (RI, USA). Samples are color coded by phylum (Chlorophyta, green; Ochrophyta, brown; Rhodophyta, red). The shaded area around the regression line is the 95% confidence interval.
Discussion
BSi concentrations vary widely in Si-requiring marine biota. For example, even within a single diatom species, BSi concentrations can vary by an order of magnitude (Taylor, 1985; Claquin et al., 2002). Similarly, BSi concentrations in these macroalgae also varied widely across genera (Fig. 1). In general, the BSi concentrations (4.2 ± 0.84%, mean ± SE) in macroalgae exceeded or were on par with values reported for salt marsh grasses collected in Narragansett Bay and other nearby estuaries (Spartina patens: 0.63 ± 0.38% BSi by weight; Spartina alterniflora: 0.57 ± 0.24% BSi by weight; Carey & Fulweiler, 2014). These macroalgae BSi concentrations are also generally higher than those reported for leaves of seagrasses (e.g. 0.06–0.7%; Vonk et al., 2018). Overall, there was low variability within phylum, except for Rhodophyta, where BSi concentrations varied widely. The high variability of BSi concentrations may be driven by different responses of macroalgae to environmental conditions and/or stressors.
The siliceous wall in diatoms confers a range of benefits, including providing structural support for their large protoplast (Raven & Waite, 2004; Finkel & Kotrc, 2010), increasing nutrient uptake (Mitchell et al., 2013), aiding light harvest (Romann et al., 2015), protection from ultraviolet radiation (Aguirre et al., 2018), reducing herbivory (Panc̃i’c et al., 2019), and possibly limiting viral infection (Raven & Waite, 2004). The large variations in diatom Si concentrations are thought to be driven in part by environmental conditions, such as light and nutrient availability (Brzezinski, 1985) as well as grazing pressure (Panc̃i’c et al., 2019). A recent study by Panc̃i’c et al. (2019) reported that the cell wall of diatoms thickened under copepod grazing pressure, and that SiO2 deposition decreased with increasing diatom growth rates. Their results suggest diatoms use Si as a defense but that this defense comes at a cost. Macroalgae may also be taking up Si for similar reasons, and potentially they, too, may need to sacrifice growth for defense or vice versa – defense for growth.
We can examine some of these factors a bit more closely for the macroalgae samples from Narragansett Bay, which were collected from sites along a gradient of potential stressors. Narragansett Bay is orientated in a roughly north–south position with lower salinity, higher inorganic nutrient concentrations, including dissolved SiO2, and higher rates of primary production in the northern reaches of the bay, where light is also typically more limited (Oviatt et al., 2002; Smayda & Borkman, 2008; Nixon et al., 2009). Whereas macroalgae BSi concentrations did not vary by location within Narragansett Bay as a whole, BSi concentrations for Rhodophyta alone significantly decreased (r = −0.47, P = 0.034), whereas percentage C increased (r = 0.62, P = 0.008) along this north–south gradient. That is, the Rhodophyta samples collected in northern Narragansett Bay incorporated more Si into their biomass and less C. Overall, we found that BSi concentrations increase as macroalgae percentage C decreases, suggesting that macroalgae may substitute Si for C (Fig. 2a). This relationship was again driven by macroalgae in the phylum Rhodophyta, whereas samples for Chlorophyta and Ochrophyta tended to vary less in terms of BSi concentration and percentage C. An inverse relationship between C and BSi concentration has been reported for a variety of flowering plant species – for example, Phragmites australis (Schaller et al., 2012) and Triticum aestivum (Neu et al., 2017) – as well as for grassland ecosystems (Quigley et al., 2020). Additionally, Schoelynck et al. (2010) found a negative relationship between cellulose and BSi concentrations for freshwater macrophytes. Incorporating Si is an energetically cheaper mechanism for structural support (Raven, 1983) while also providing additional benefits. These findings suggest that certain macroalgae, primarily in the phylum Rhodophyta, may take up Si in response to in situ availability and/or environmental stressors, similar to what is observed for diatoms. The inverse relationship between BSi concentration and percentage C may also prove to be useful for scaling. That is, percentage C data are more widely available for macroalgae than BSi concentration. If this relationship holds for more species and more locations then we may be able to use the more abundant percentage C data to predict how much Si is taken up across space and time.
We also observed a negative relationship between d13C and BSi concentrations (Fig. 2b). These relationships described a substantial portion of the variance in d13C, which can be used to help understand macroalgae photosynthetic pathways (Giordano et al., 2005; Marconi et al., 2011; Lovelock et al., 2020) and environmental conditions influencing macroalgae growth (Dudley et al., 2010). The d13C values reported here (−12.60& to −23.54&) are well within the range reported for macroalgae (Maberly et al., 1992; Raven et al., 2005; Lovelock et al., 2020). These values also suggest that inorganic C entry is driven by a combination of CO2 diffusion directly to Rubisco and through the C-concentrating mechanisms. There is a clear pattern with phylum d13C and BSi concentrations (Fig. 2b). At this point we are uncertain what mechanism is driving the pattern between d13C and BSi concentration. Perhaps, it is simply a correlation with – as the well-worn phrase goes – no causation. Alternatively, it may provide insight into how and why macroalgae take up Si. The more negative d13C associated with higher BSi is consistent with a large fraction of the inorganic C being pumped into cells in the organism with C-concentrating mechanisms, or diffusive CO2 entry, allowing discrimination against d13C by Rubisco. All other things being equal, that may indicate lower growth rates and hint at the tradeoffs of incorporating Si. However, we cannot at this time connect the d13C directly to BSi concentrations as the factors driving d13C signatures are upstream of allocation of photosynthate to growth or Si uptake.
Finally, uptake of Si by macroalgae may help promote Si limitation in estuaries, especially if they are actively sequestering it, and therefore competing with diatoms for Si. We can estimate the amount of Si taken up by macroalgae by using the C : Si ratio measured here and values reported in the literature for global macroalgae primary productivity. Annually, global macroalgae net primary production (and C uptake) ranges from 80 to 210 Tmol C yr−1 (Raven, 2018). Scaling this by the mean macroalgae C : Si molar ratio measured in this study (295.6), we calculate an average global macroalgae uptake rate between 0.27 and 0.71 Tmol Si yr−1. The maximum value accounts for almost 10% of the Si entering the ocean from rivers and over 40% of the annual uptake of Si by sponges (Tr’eguer et al., 2021). This is likely a conservative estimate, as using the median C : Si molar ratio in this study (157.4) would increase global macroalgae uptake to between 0.5 and 1.33 Tmol Si yr−1. In this case, the maximum value would account for 16% of the Si entering the ocean from rivers and almost 80% of the annual uptake of Si by sponges. Potentially, these values could be higher. For example, a recent environmental DNA study reported that Rhodophyta, the genera with the highest BSi concentrations in this study, were the dominant genera of macroalgae found in the world’s oceans (Ortega et al., 2019). Of course, our calculations are a rough approximation based on temperate macroalgae only. We anticipate the BSi concentrations may vary by geographic location, seasonality, and exposure to stress. Regardless, this study suggests marine macroalgae are a potentially important, yet largely ignored, sink of Si in marine ecosystems. This sink may be particularly important in systems that are heavily fertilized with inorganic N and P, where macroalgae come to dominate. Perhaps macroalgae Si uptake contributes to Si limitation in coastal systems, thereby exacerbating the negative impacts of eutrophication.
Supplementary Material
Acknowledgements
This work was funded in part by a Woods Hole Sea Grant to a grant to RWF. This work was also funded through Boston University’s Undergraduate Research Opportunities Program through grant support to MRY. We thank the Waquoit Bay National Estuarine Research Reserve staff, particularly Jim Rassman, for their assistance in sampling in Waquoit Bay. Additionally, we thank Alia Al-Haj, Sarah Fabbricotti, Kristen Wroth, and Mac Marston for their assistance in sample analysis and processing. Finally, we thank Serdar Korur, whose code we adapted for Fig. 1. The University of Dundee is a registered Scottish charity, no. SC015096. The views expressed in this article are those of the authors and do not necessarily reflect the views or policies of the US Environmental Protection Agency (EPA). Any mention of trade name and products does not imply an endorsement by the US Government or the US EPA. The EPA does not endorse any commercial products, services, or enterprises.
Data availability
All data are available via https://doi.org/10.6084/m9.figshare.15113139.v1.
References
- Aguirre LE, Ouyang L, Elfwing A, Hedblom M, Wulff A, Inganäs O. 2018. Diatom frustules protect DNA from ultraviolet light. Scientific Reports 8: e5138. [DOI] [PMC free article] [PubMed] [Google Scholar]
- Baines SB, Twining BS, Brzezinski MA, Krause JW, Vogt S, Assael D, McDaniel H. 2012. Significant silicon accumulation by marine picocyanobacteria. Nature Geoscience 5: 886–891. [Google Scholar]
- Bates D, Maechler M, Bolker B, Walker S. 2015. Fitting linear mixed-effects models using lme4. Journal of Statistical Software 67: 1–48. [Google Scholar]
- Brzezinski MA. 1985. The Si : C : N ratio of marine diatoms: interspecific variability and the effect of some environmental variables. Journal of Phycology 21: 347–357. [Google Scholar]
- Carey JC, Fulweiler RW. 2014. Salt marsh tidal exchange increases residence time of silica in estuaries. Limnology and Oceanography 59: 1203–1212. [Google Scholar]
- Claquin P, Martin-J’ez’equel V, Kromkamp JC, Veldhuis MJW, Kraay GW. 2002. Uncoupling of silicon compared with carbon and nitrogen metabolisms and the role of the cell cycle in continuous cultures of Thalassiosira pseudonana (Bacillariophyceae) under light, nitrogen, and phosphorus control. Journal of Phycology 38: 922–930. [Google Scholar]
- Conley DJ, Schelske CL. 2002. Biogenic silica. In: Smol JP, Birks HJB, Last WM, Bradley RS, Alverson K, eds. Tracking environmental change using lake sediments. Developments in paleoenvironmental research, vol. 3. Dordrecht, the Netherlands: Springer, 281–293. [Google Scholar]
- Dalsgaard T, Nielsen LP, Brotas V, Viaroli P, Underwood G, Nedwell D, Sundbäck K, Rysgaard S, Miles A, Bartoli M et al. 2000. Protocol handbook for NICE-nitrogen cycling in estuaries: a project under the EU research programme: Marine Science and Technology (MAST III). Silkeborg, Denmark: Department of Lake and Estuarine Ecology, Ministry of Environment and Energy, National Environmental Research Institute, 1–62. [Google Scholar]
- Delignette-Muller ML, Dutang C. 2015. fitdistrplus: an R package for fitting distributions. Journal of Statistical Software 64: 1–34. [Google Scholar]
- DeMaster DJ. 1981. The supply and accumulation of silica in the marine environment. Geochimica et Cosmochimica Acta 45: 1715–1732. [Google Scholar]
- Dudley BD, Barr NG, Shima JS. 2010. Influence of light intensity and nutrient source on d13C and d15N signatures in Ulva pertusa. Aquatic Biology 9: 85–93. [Google Scholar]
- Elizondo EB, Carey JC, Al-Haj AN, Lugo AE, Fulweiler RW. 2021. High productivity makes mangroves potentially important players in the tropical silicon cycle. Frontiers in Marine Science 8: e450. [Google Scholar]
- Field CB, Behrenfeld MJ, Randerson JT, Falkowski P. 1998. Primary production of the biosphere: integrating terrestrial and oceanic components. Science 281: 237–240. [DOI] [PubMed] [Google Scholar]
- Finkel ZV, Kotrc B. 2010. Silica use through time: macroevolutionary change in the morphology of the diatom fustule. Geomicrobiology Journal 27: 596–608. [Google Scholar]
- Fu FF, Akagi T, Yabuki S, Iwaki M, Ogura N. 2000. Distribution of rare earth elements in seaweed: implication of two different sources of rare earth elements and silicon in seaweed. Journal of Phycology 36: 62–70. [Google Scholar]
- Gadd GM, Raven JA. 2010. Geomicrobiology of eukaryotic microorganisms. Geomicrobiology Journal 27: 491–519. [Google Scholar]
- Giordano M, Beardall J, Raven JA. 2005. CO2 concentrating mechanisms in algae: mechanisms, environmental modulation, and evolution. Annual Review of Plant Biology 56: 99–131. [DOI] [PubMed] [Google Scholar]
- Hauxwell J, Cebri’an J, Furlong C, Valiela I. 2001. Macroalgal canopies contribute to eelgrass (Zostera marina) decline in temperate estuarine ecosystems. Ecology 82: 1007–1022. [Google Scholar]
- Hersh DA. 1995. Effects of nutrient loading on species composition of vegetation in a New England coastal lagoon system and salt marsh. PhD dissertation, Boston University, Boston, MA, USA. [Google Scholar]
- Horne A, McClelland J, Valiela I. 1994. The growth and consumption of macroalgae in estuaries: the role of invertebrate grazers along a nutrient gradient in Waquoit Bay, Massachusetts. The Biological Bulletin 187: 279–280. [DOI] [PubMed] [Google Scholar]
- Irigoien X, Harris RP, Verheye HM, Joly P, Runge J, Starr M, Pond D, Campbell R, Shreeve R, Ward P et al. 2002. Copepod hatching success in marine ecosystems with high diatom concentrations. Nature 419: 387–389. [DOI] [PubMed] [Google Scholar]
- Le B, Nadeem M, Yang S-H, Shin J-A, Kang M-G, Chung G, Sun S. 2019. Effect of silicon in Pyropia yezoensis under temperature and irradiance stresses through antioxidant gene expression. Journal of Applied Phycology 31: 1297–1302. [Google Scholar]
- Lenth R 2018. EMMEANS: estimated marginal means, aka least-squares means. R package v.1.2.3. [WWW document] URL https://github.com/rvlenth/emmeans [accessed 1 October 2021].
- Lovelock CE, Reef R, Raven JA, Pandolfi JM. 2020. Regional variation in d13C of coral reef macroalgae. Limnology and Oceanography 65: 2291–2302. [Google Scholar]
- Maberly SC, Raven JA, Johnston AM. 1992. Discrimination between 12C and 13C by marine plants. Oecologia 91: 481–492. [DOI] [PubMed] [Google Scholar]
- Marconi M, Giordano M, Raven JA. 2011. Impact of taxonomy, geography, and depth on d13C and d15N variation in a large collection of macroalgae. Journal of Phycology 47: 1023–1035. [DOI] [PubMed] [Google Scholar]
- Mitchell JG, Seuront L, Doubell MJ, Losic D, Voelcker NH, Seymour J, Lal R. 2013. The role of diatom nanostructures in biasing diffusion to improve uptake in a patchy nutrient environment. PLoS ONE 8: e59548. [DOI] [PMC free article] [PubMed] [Google Scholar]
- Mizuta H, Uji T, Yasui H. 2021. Extracellular silicate uptake and deposition induced by oxidative burst in Saccharina japonica sporophytes (Phaeophyceae). Algal Research 58: e102369. [Google Scholar]
- Mizuta H, Yasui H. 2012. Protective function of silicon deposition in Saccharina japonica sporophytes (Phaeophyceae). Journal of Applied Phycology 24: 1177–1182. [DOI] [PMC free article] [PubMed] [Google Scholar]
- Moore LF, Traquair JA. 1976. Silicon, a required nutrient for Cladophora glomerata (L) Kütz. (Chlorophyta). Planta 128: 179–182. [DOI] [PubMed] [Google Scholar]
- Neu S, Schaller J, Dudel EG. 2017. Silicon availability modifies nutrient use efficiency and content, C : N : P stoichiometry, and productivity of winter wheat (Triticum aestivum L.). Scientific Reports 7: e40829. [DOI] [PMC free article] [PubMed] [Google Scholar]
- Nixon SW, Fulweiler RW, Buckley BA, Granger SL, Nowicki BL, Henry KM. 2009. The impact of changing climate on phenology, productivity, and benthic–pelagic coupling in Narragansett Bay. Estuarine, Coastal and Shelf Science 82: 1–18. [Google Scholar]
- Oczkowski AJ, Pilson MEQ, Nixon SW. 2010. A marked gradient in d13C values of clams Mercenaria mercenaria across a marine embayment may reflect variations in ecosystem metabolism. Marine Ecology Progress Series 414: 145–153. [Google Scholar]
- Oczkowski A, Schmidt C, Santos E, Miller K, Hanson A, Cobb D, Krumholz J, Pimenta A, Heffner L, Robinson S. 2018. How the distribution of anthropogenic nitrogen has changed in Narragansett Bay (RI, USA) following major reductions in nutrient loads. Estuaries and Coasts 41: 2260–2276. [DOI] [PMC free article] [PubMed] [Google Scholar]
- Ortega A, Geraldi NR, Alam I, Kamau AA, Acinas SG, Logares R, Gasol JM, Massana R, Krause-Jensen D, Duarte CM. 2019. Important contribution of macroalgae to oceanic carbon sequestration. Nature Geoscience 12: 748–754. [Google Scholar]
- Oviatt C, Keller A, Reed L. 2002. Annual primary production in Narragansett Bay with no bay-wide winter–spring phytoplankton bloom. Estuarine, Coastal and Shelf Science 54: 1013–1026. [Google Scholar]
- Panc̃i’c M, Torres RR, Almeda R, Kiørboe T. 2019. Silicified cell walls as a defensive trait in diatoms. Proceedings of the Royal Society B: Biological Sciences 286: e20190184. [DOI] [PMC free article] [PubMed] [Google Scholar]
- Peckol P, DeMeo-Anderson B, Rivers J, Valiela I, Maldonado M, Yates J. 1994. Growth, nutrient uptake capacities and tissue constituents of the macroalgae Cladophora vagabunda and Gracilaria tikvahiae related to site-specific nitrogen loading rates. Marine Biology 121: 175–185. [Google Scholar]
- Potter IC, Rose TH, Huisman JM, Hall NG, Denham A, Tweedley JR. 2021. Large variations in eutrophication among estuaries reflect massive differences in composition and biomass of macroalgal drift. Marine Pollution Bulletin 167: e112330. [DOI] [PubMed] [Google Scholar]
- Quigley KM, Griffith DM, Donati GL, Anderson TM. 2020. Soil nutrients and precipitation are major drivers of global patterns of grass leaf silicification. Ecology 101: e03006. [DOI] [PMC free article] [PubMed] [Google Scholar]
- Raven JA. 1983. The transport and function of silicon in plants. Biological Reviews 58: 179–207. [Google Scholar]
- Raven J 2018. Blue carbon: past, present and future, with emphasis on macroalgae. Biology Letters 14: e20180336. [DOI] [PMC free article] [PubMed] [Google Scholar]
- Raven JA, Ball LA, Beardall J, Giordano M, Maberly SC. 2005. Algae lacking carbon-concentrating mechanisms. Canadian Journal of Botany 83: 879–890. [Google Scholar]
- Raven JA, Giordano M. 2009. Biomineralization by photosynthetic organisms: evidence of coevolution of the organisms and their environment? Geobiology 7: 140–154. [DOI] [PubMed] [Google Scholar]
- Raven JA, Johnston AM, Kübler JE, Korb R, McInroy SG, Handley LL, Scrimgeour CM, Walker DI, Beardall J, Vanderklift M et al. 2002. Mechanistic interpretation of carbon isotope discrimination by marine macroalgae and seagrasses. Functional Plant Biology 29: 355–378. [DOI] [PubMed] [Google Scholar]
- Raven JA, Waite AM. 2004. The evolution of silicification in diatoms: inescapable sinking and sinking as escape? New Phytologist 162: 45–61. [Google Scholar]
- R Development Team. 2014. R: a language and environment for statistical computing. Vienna, Austria: R Foundation for Statistical Computing. [WWW document] URL https://www.r-project.org/ [accessed 5 May 2021]. [Google Scholar]
- Romann J, Valmalette J-C, Chauton MS, Tranell G, Einarsrud M-A, Vadstein O. 2015. Wavelength and orientation dependent capture of light by diatom frustule nanostructures. Scientific Reports 5: e17403. [DOI] [PMC free article] [PubMed] [Google Scholar]
- Rousseaux CS, Gregg WW. 2013. Interannual variation in phytoplankton primary production at a global scale. Remote Sensing 6: 1–19. [Google Scholar]
- Schaller J, Brackhage C, Gessner MO, Bäuker E, Gert DE. 2012. Silicon supply modifies C : N : P stoichiometry and growth of Phragmites australis. Plant Biology 14: 392–396. [DOI] [PubMed] [Google Scholar]
- Schoelynck J, Bal K, Backx H, Okruszko T, Meire P, Struyf E. 2010. Silica uptake in aquatic and wetland macrophytes: a strategic choice between silica, lignin and cellulose? New Phytologist 186: 385–391. [DOI] [PubMed] [Google Scholar]
- Schoelynck J, de Groote T, Bal K, Vandenbruwaene W, Meire P, Temmerman S. 2012. Self-organised patchiness and scale-dependent bio-geomorphic feedbacks in aquatic river vegetation. Ecography 35: 760–768. [Google Scholar]
- Smayda TJ, Borkman DG. 2008. Nutrient and plankton dynamics in Narragansett Bay. In: Desbonnet A, Costa-Pierce BA, eds. Science for ecosystem-based management. Springer series on environmental management. New York, NY, USA: Springer, 431–484. [Google Scholar]
- Strickland J, Parsons T. 1968. A practical handbook of seawater analysis. Ottawa, ON, Canada: Fisheries Research Board of Canada. [Google Scholar]
- Taylor NJ. 1985. Silica incorporation in the diatom Cosinodiscus granii as affected by light intensity. British Phycological Journal 20: 365–374. [Google Scholar]
- Tr’eguer PJ, Sutton JN, Brzezinski M, Charette MA, Devries T, Dutkiewicz S, Ehlert C, Hawkings J, Leynaert A, Liu SM et al. 2021. Reviews and syntheses: the biogeochemical cycle of silicon in the modern ocean. Biogeosciences 18: 1269–1289. [Google Scholar]
- Valiela I, Foreman K, LaMontagne M, Hersh D, Costa J, Peckol P, DeMeo-Andreson B, D’Avanzo C, Babione M, Sham C-H et al. 1992. Couplings of watersheds and coastal waters: sources and consequences of nutrient enrichment in Waquoit Bay, Massachusetts. Estuaries 15: 443–457. [Google Scholar]
- Valiela I, McClelland J, Hauxwell J, Behr PJ, Hersh D, Foreman K. 1997. Macroalgal blooms in shallow estuaries: controls and ecophysiological and ecosystem consequences. Limnology and Oceanography 42: 1105–1118. [Google Scholar]
- Vonk JA, Smulders FOH, Christianen MJA, Govers LL. 2018. Seagrass leaf element content: a global overview. Marine Pollution Bulletin 134: 123–133. [DOI] [PubMed] [Google Scholar]
- Wickham H 2016. ggplot2: elegant graphics for data analysis. New York, NY, USA: Springer-Verlag. [Google Scholar]
- Wilke C 2019. cowplot: streamlined plot theme and plot annotations for ‘ggplot2’. R package v.1.0.0. [WWW document] URL https://cran.r-project.org/package=cowplot [accessed 5 May 2021].
- Zuur A, Ieno EN, Walker N, Saveliev AA, Smith GM. 2009. Mixed effects models and extensions in ecology with R, vol. 574. New York, NY, USA: Springer. [Google Scholar]
Associated Data
This section collects any data citations, data availability statements, or supplementary materials included in this article.
Supplementary Materials
Data Availability Statement
All data are available via https://doi.org/10.6084/m9.figshare.15113139.v1.