

Abstract
Tissue-resident memory T (Trm) cells remain poised in the tissue and mediate robust protection from secondary infection. Trm cells within the intestine and other tissues are heterogenous in their phenotype and function; however, the contributions of these Trm subsets to secondary infection remain poorly defined. To address the plasticity of intestinal Trm subsets and their role in local and systemic immunity, we generated mice to fate map intestinal CD103+ Trm cells and track their location and function during secondary infection with Yersinia pseudotuberculosis. We found that CD103+ Trm cells remained lodged in the tissue and were poorly reactivated during secondary challenge. CD103− Trm cells were the primary responders to secondary infection and expanded within the tissue, with limited contribution from circulating memory T cells. The transcriptional profile of CD103− Trm cells demonstrated maintenance of a gene signature similar to circulating T cells along with increased cytokine production and migratory potential. CD103− Trm cells also expressed genes associated with TCR activation and displayed enhanced TCR-mediated reactivation both in vitro and in vivo compared to their CD103+ counterparts. These studies reveal the limited recall potential of CD103+ Trm subsets and the role of CD103− Trm cells as central memory-like T cells within peripheral tissues.
One sentence summary:
CD103− Trm cells display enhanced TCR-dependent reactivation, proliferation, and effector function when compared to CD103+ Trm cells.
INTRODUCTION
Memory T cells can be divided into two groups based on their location, those that can circulate throughout the body and those that are lodged within the peripheral tissues. These tissue-resident memory T (Trm) cells are maintained in the tissue and are not replenished by circulating cells after infection is resolved (1, 2). Protection from secondary infection correlates with Trm density in that tissue site and circulating T cells are often not sufficient to protect from secondary infection (3–6). Only a small number of microbes need to breach the barrier surfaces to initiate disease, and the ability of Trm cells to eliminate pathogens before they spread to other tissues is a necessary component of protective immunity.
There are several mechanisms by which Trm cells can support control of secondary infection and coordinate tissue immunity. TCR-dependent reactivation of Trm cells can lead to direct effector function and lysis of infected cells (7). Trm-derived cytokine production results in global changes to the tissue microenvironment and induction of a broad-spectrum antimicrobial response (8, 9), including improved resistance of epithelial cells to viral infection and activation of other tissue-resident immune cells including dendritic cells and NK cells (8). IFNγ also facilitates the access of circulating immunoglobulin to the tissue (10) and production of chemokines that support the non-specific recruitment of innate and adaptive immune cells (8, 11, 12). Bystander activation of Trm cells via IL-12 can stimulate TCR-independent IFNγ production, leading to neutrophil recruitment that results in protection from unrelated infections (13). As infection progresses, there are dynamic changes in T cell populations within the infected tissue, and local proliferation of Trm cells in the female reproductive tract and skin dominate the recall response in the context of infection or antigen application (6, 14). Both newly primed naïve T cells and memory T cells reactivated in the lymphoid tissue act as a source of new Trm cells during secondary infection (15, 16). There is also evidence that Trm cells can contribute to secondary memory outside their tissue of origin. Mobilization of Trm cells from certain tissues to the draining lymph nodes can occur in response to infection and potentially support systemic immune function (17–19). There have been significant challenges in trying to understand Trm cell dynamics during secondary infection of the intestinal tissue; however, it is clear that reactivation of intestinal Trm cells leads to enhanced migration (20), production cytokines that lead to the recruitment of monocytes and neutrophils (12), and reduced dissemination of pathogens from the intestine to deeper tissues (21).
Adding a layer of complexity to our understanding of Trm function in vivo is the heterogeneity observed within Trm populations within a variety of tissue compartments. CD103 and CD69 have been used to broadly define Trm subsets, and unique gene expression profiles define CD103+ and CD103− Trm subsets in tissues that sustain both these populations (19, 22–25). CD103− Trm cells display some distinct functional capabilities when compared to their CD103+ counterparts including localization to areas of infection and altered secondary responses (19, 25, 26). However, it is unclear whether these populations remain stable or demonstrate phenotypic and functional plasticity. More recently, single cell sequencing has been used to understand the heterogeneity in the intestinal Trm compartment after infection and uncovered several populations of cells that, while relatively uniform in their expression of CD103 and CD69, differ in their Trm differentiation, effector functions, and memory potential (27, 28). These findings suggest Trm heterogeneity analogous to what is observed in circulating T cell populations, with specialization in both recall and effector capabilities.
To address both the plasticity of intestinal Trm subsets and their unique contributions to tissue and systemic immunity, we have generated mice that allowed us to fate map CD103+ Trm cells after primary infection with Yersinia pseudotuberculosis and follow their location and functionality during secondary infection. We found that CD103+ Trm numbers remained stable, and that these cells did not exit the intestine. CD103− Trm subsets were preferentially expanded during secondary infection, and we demonstrated antigen-specific reactivation and proliferation of CD103− Trm cells within the intestinal tissue, with limited contribution from circulating memory cells. Transcriptional analysis confirmed CD103+ cells did not respond robustly to secondary infection on a population level, and CD103− Trm cells maintained a transcriptional profile with features of circulating T cells and displayed increased sensitivity to TCR stimulation and enhanced cytokine production. These studies identify CD103− Trm cells as first responders during secondary infection in the intestine and demonstrate that the degree of heterogeneity within Trm populations can lead to fundamentally different responses to secondary infection.
RESULTS
Cell fate mapping of CD103+ Trm cells
To understand the fate of CD103+ Trm cells during secondary infection, we generated mice with IRES-CreERT2 inserted between exon 31 and the 3’UTR of the aE subunit of CD103 (Itgae-CreERT2, Fig. 1A) and crossed them to Rosa26-LSL-tdTomato mice to generate iCD103-tdTomato mice. To examine the efficiency of Cre-mediated recombination in Trm cells, iCD103-tdTomato mice were treated with tamoxifen or vehicle for four consecutive days and one day later, tissues were harvested for analysis. Less than 1% of cells in vehicle treated control mice expressed tdTomato in any tissue examined (Fig. 1B). In tamoxifen treated mice, greater that 97% of CD103+ CD8+ T cells in the small intestinal epithelium (IE) expressed tdTomato and similar results were observed in lamina propria (LP) T cells, with approximately 93% of CD103+ cells co-expressing tdTomato. Expression was restricted to CD103+ cells, as few CD103− CD8+ Trm cells were tdTomato+ (Fig. 1B). A population of naïve CD8+ T cells express low levels of CD103, which is downregulated upon activation and then re-expressed upon entry into tissue and differentiation into Trm cells (29). CD103 expression in mesenteric lymph node (MLN) T cells was sufficient to result in tdTomato expression in a subset of cells, with 25–45% of T cells expressing tdTomato (Fig. 1, B and C). There were 2 distinct populations of tdTomato-expressing cells in all tissues examined, and these cells were slightly different in size but displayed no other changes in terms of Trm phenotype (Fig. S1). These data indicate iCD103-tdTomato mice efficiently mark CD103+ Trm cells in the intestinal tissue; however, a subset of CD8+ T cells within the lymphoid tissue also expresses sufficient levels of CD103 to result in tdTomato expression.
Fig. 1. Cell fate mapping of CD103+ Trm cells.
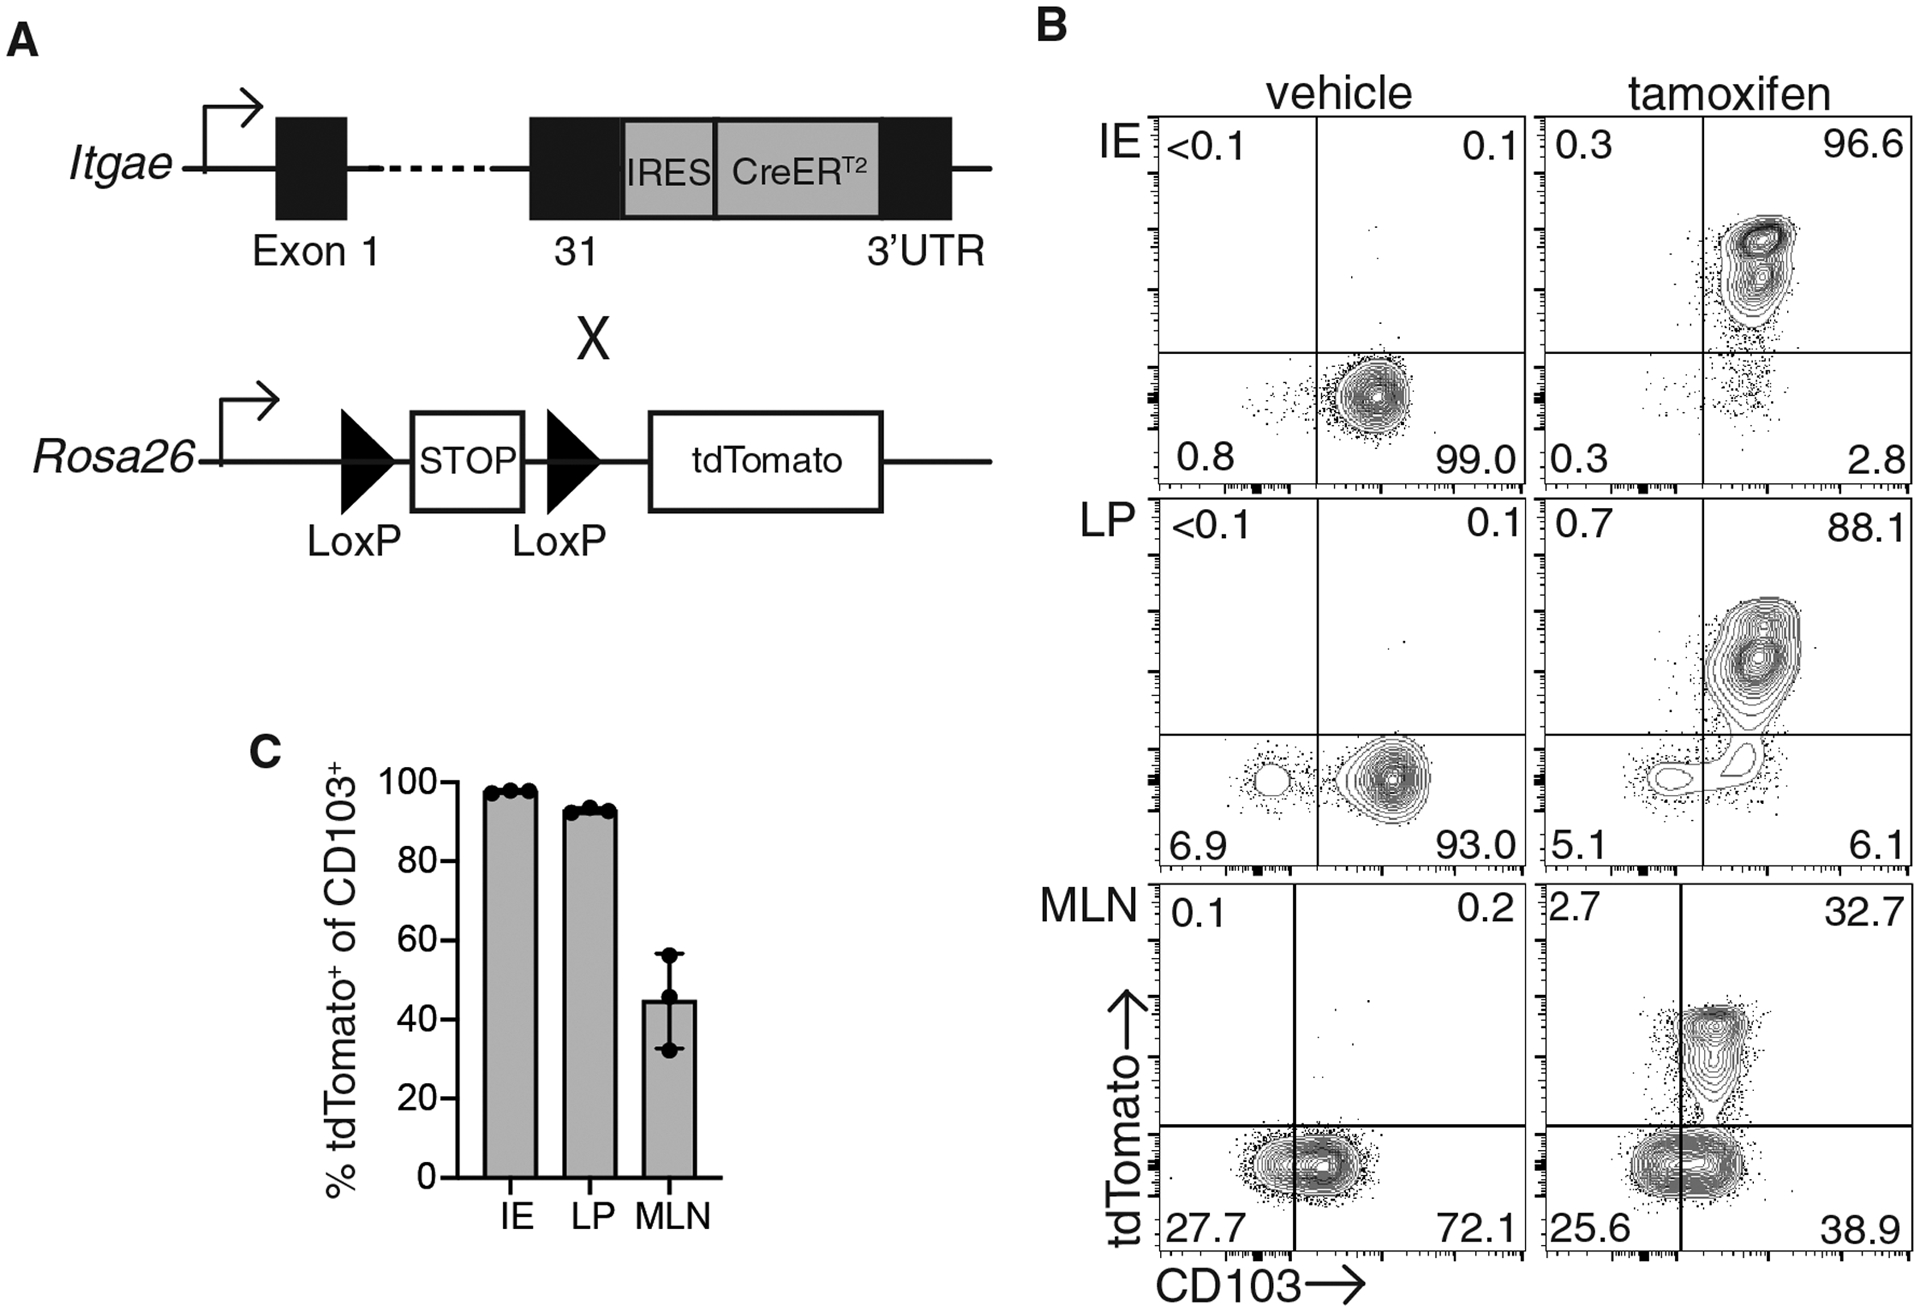
(A) Itgae-CreERT2 mice were generated by inserting IRES-CreERT2 into target site at the junction of Exon 31 and the 3’UTR. Itgae-CreERT2 mice were crossed to Rosa26-LSL-tdTomato mice to generate iCD103-tdTomato mice. (B-C) iCD103-tdTomato mice were administered with either tamoxifen or vehicle for 4 consecutive days and analyzed for tdTomato and CD103 expression. (B) Representative flow cytometry plots of CD8αβ+ CD69+ T cells from the intestinal epithelium (IE) and lamina propria (LP) or CD8αβ+ mesenteric lymph node cells (MLN). Numbers represent the percent of cells in each quadrant. (C) The percentage of tdTomato+ cells among CD103+ cells in each tissue. Data are representative of 2 independent experiments with 3 mice/group.
Trm cell dynamics during secondary infection.
To avoid the complication of naïve CD8+ T cells potentially expressing tdTomato and contributing to the Trm pool during secondary infection, we generated transgenic mice with T cells specific for the YopE69–77 epitope of Yersinia pseudotuberculosis (Yptb) to track CD8+ Trm responses (Fig. S2, A and B). To confirm YopE TCR transgenic T cells (YopE T cells) behaved in a manner similar to endogenous YopE-specific T cells, naïve CD45.1/2+ YopE T cells were transferred into CD45.1+ mice which were then infected with YopM-deficient (ΔyopM) Yptb. At 30 days post infection, transferred YopE T cells and endogenous YopE-specific T cells were present at similar numbers in the intestinal tissue and MLN (Fig. S2, C–E). Trm differentiation was also examined, and we found no difference in expression of CD69 and CD103 on YopE T cells when compared to endogenous T cells (Fig. S2G). YopE T cells recapitulated endogenous YopE-specific intestinal T cell responses; therefore, YopE TCR transgenic mice were crossed to iCD103-tdTomato mice for fate mapping studies. Naïve CD45.2+ iCD103-tdTomato YopE T cells were transferred into CD45.1+ recipient mice, and mice were then infected with attenuated ΔyopM Yptb. At 30 days post infection, Yptb-immune mice received tamoxifen for four consecutive days and intestinal tissues were harvested for analysis (Fig. 2A). The majority of intestinal Trm cells in both the IE and LP were CD103+ and tdTomato+ (Fig. 2B), consistent with what we observed in polyclonal Trm cells from naïve iCD103-tdTomato mice. To understand Trm dynamics during secondary infection, mice were rechallenged with virulent wild-type (WT) Yptb (Fig. 2A). At 4 days post-secondary infection, we observed an increase in the proportion of Trm cells that were tdTomato−CD103−, with a concomitant reduction of the tdTomato+CD103+ subset in the LP (Fig. 2B). There were very few CD103− Trm cells residing in the IE after primary infection; however, we did also see an increase in the CD103−tdTomato− cells in this compartment after secondary infection (Fig. 2B). Mice were also analyzed at day 14 post WT Yptb infection, after the bacteria are cleared. Surprisingly, we found that the CD103−tdTomato− population had contracted to a level that was not significantly different than was observed prior to secondary infection (Fig. 2B and C). There was limited plasticity of Trm subsets, with no increase in ex-CD103+ Trm cells that were tdTomato+ but were able to downregulate CD103 during infection and a modest increase in the CD103+tdTomato− population (Fig. S3, A and B). These data highlight the dynamic nature of intestinal Trm populations during secondary infection, with significant expansion of the CD103− Trm population relative to CD103+ Trm cells.
Fig. 2. Expansion of intestinal CD103− Trm cells during secondary infection.
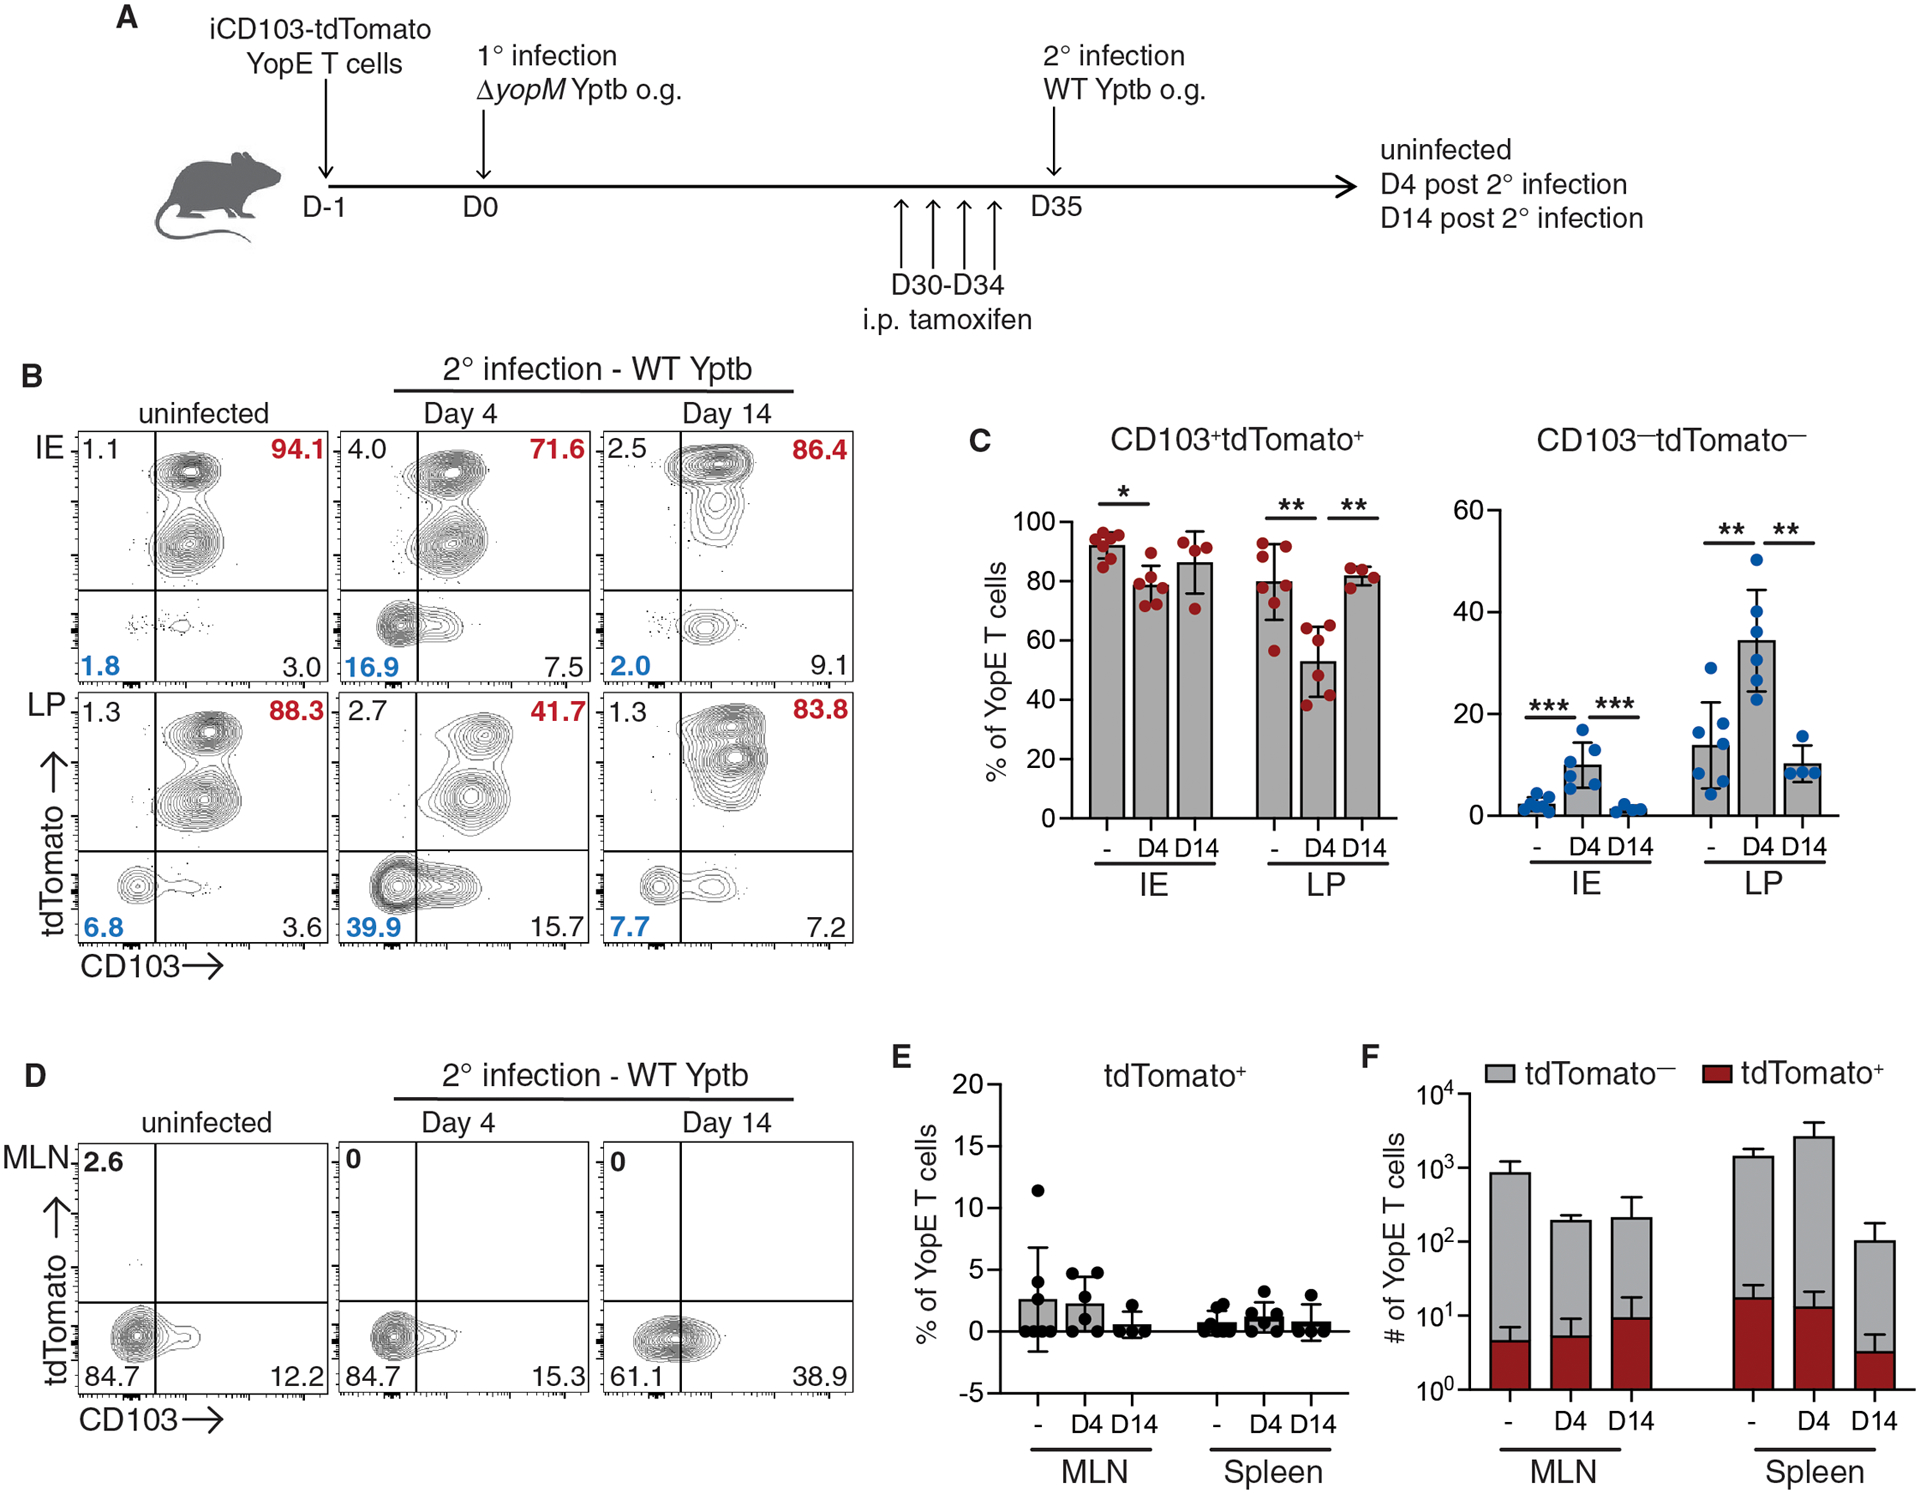
CD45.1+ mice received CD45.2+ iCD103-tdTomato YopE T cells before oral gavage with ΔyopM Yptb. At 30 days post-infection, immune mice were administered tamoxifen and then infected with wild-type (WT) Yptb. Small intestinal IE and LP, MLN, and spleen cells were isolated from ΔyopM Yptb-immunized mice and at 4 and 14 days post-secondary infection with WT Yptb. (A) Illustration of experimental design. (B) Representative flow cytometry plots of tdTomato and CD103 expression in i.v.CD8α−CD69+ CD45.2+ YopE Trm cells from uinfected and rechallenged mice. Numbers are percent of cells in each quadrant. (C) Quantification of both CD103+tdTomato+ and CD103−tdTomato− subsets as a percentage of YopE Trm cells. (D) Representative flow cytometry plots of tdTomato and CD103 expression by YopE T cells from the MLN in uinfected and rechallenged mice. Numbers are the percent of cells in each quadrant and (E) quantification of tdTomato+ cells as a percentage of YopE T cells in the MLN and spleen. (F) Number of tdTomato+ cells in the MLN and spleen of uninfected and rechallenged mice. Data are pooled from 2 independent experiments with 2–4 mice/group. Symbols represent individual mice and means and SDs are shown. P values were determined using one-way ANOVA with Tukey’s test in (C), *p<0.01, **p<0.005, ***p<0.001.
The ability of Trm cells to leave the skin, lung, and liver and contribute to secondary immune responses in the lymphoid tissue has been confirmed using several model systems (16–19). Intestinal Trm cells can expand within the secondary lymphoid organs after isolation from the tissue and introduction into the circulation (16, 30, 31); however, migration of Trm cells out of the intestinal tissue has been more difficult to assess. The reduction in the CD103+tdTomato+ Trm subset during secondary infection was potentially due to their preferential exit from the tissue. To address this, we examined the appearance of tdTomato+ cells in the secondary lymphoid organs over the course of infection. Prior to WT Yptb rechallenge, only a small percentage of YopE T cells in the MLN and spleen were tdTomato+, and this percentage did not increase significantly during secondary infection (Fig. 2, D and E). The number of tdTomato+ YopE T cells also remained stable in both the MLN and spleen after secondary infection (Fig. 2F). We also examined YopE T cells in the liver, as Trm cells that are reactivated in the secondary lymphoid organs have a propensity for returning to the tissues (16); however, there was no increase in the percentage of tdTomato+ YopE Trm cells in the liver after secondary infection (Fig. S3, C and D).
The robust immunity afforded by ΔyopM Yptb immunization could limit the severity of WT Yptb infection and impact both the expansion of CD103+tdTomato+ Trm cells and/or their mobilization and migration out of the tissue. To address this, we generated mice that only contained a Yptb-specific CD8+ T compartment by activating YopE T cells in vitro and injecting them into naïve mice. These mice were treated with tamoxifen and infected with WT Yptb as in Figure 2A. Again, there was expansion of the CD103−tdTomato− Trm cells in the intestinal tissue, and no increase in the percentage of tdTomato+ cells detected in the MLN or spleen (Fig. S4). These data indicated that intestinal CD103+ Trm cells do not leave the intestine or contribute significantly to the secondary memory T cell compartment, which may be a unique feature of intestinal Trm cells. These findings also suggested the increase in the CD103−tdTomato− Trm subset is due to preferential expansion of that population.
Due to the potential for loss of Trm cells during the isolation procedure and differences in the efficiency of isolating CD103+ and CD103− Trm cells (32), immunofluorescence microscopy was used to quantify the number of tdTomato+ and tdTomato− YopE Trm cells in the intestinal tissue. The limited plasticity of Trm subsets allowed us to use tdTomato expression as a surrogate marker of CD103, even after secondary infection. In the ileum of immune mice, 20% of YopE Trm cells were tdTomato− (Fig. 3, A and B), consistent with our flow cytometry data (Fig. 2, B and C). After primary infection, Trm cells were localized as previously described after the resolution of Yptb infection (24), with CD103+ and CD103− Trm cells evenly distributed throughout the tissue. On day 4 after secondary infection, there was a significant increase in the proportion of YopE T cells that were tdTomato− (Fig. 3B). Enumeration of the number of tdTomato+ and tdTomato− Trm cells within the tissue confirmed an increase in YopE T cells after infection (Fig. 3C). This was almost entirely due to an increase in the number of tdTomato− cells, with no significant increase in the tdTomato+ population (Fig. 3C). tdTomato− Trm cells were often clustered together in structures reminiscent of the lymphocyte clusters that are observed during primary infection of the intestine and many other tissues (Fig. 3A, right panel) (3, 33). tdTomato+ YopE Trm cells were not excluded from T cell clusters but were less abundant than the tdTomato− population (Fig. 3A, right panel). We examined the localization of other immune cells within YopE T cells and found CD4+ T cells and CD11c+ macrophages/DCs localized with YopE T cells (Fig. 3, D and E). These results indicated the tdTomato− Trm population is expanded during secondary infection and reformed memory lymphocyte clusters, while the tdTomato+ population remains stable in number and is less frequently recruited to lymphocyte clusters.
Fig. 3. tdTomato− Trm populations expand during secondary infection and form memory lymphocyte clusters.
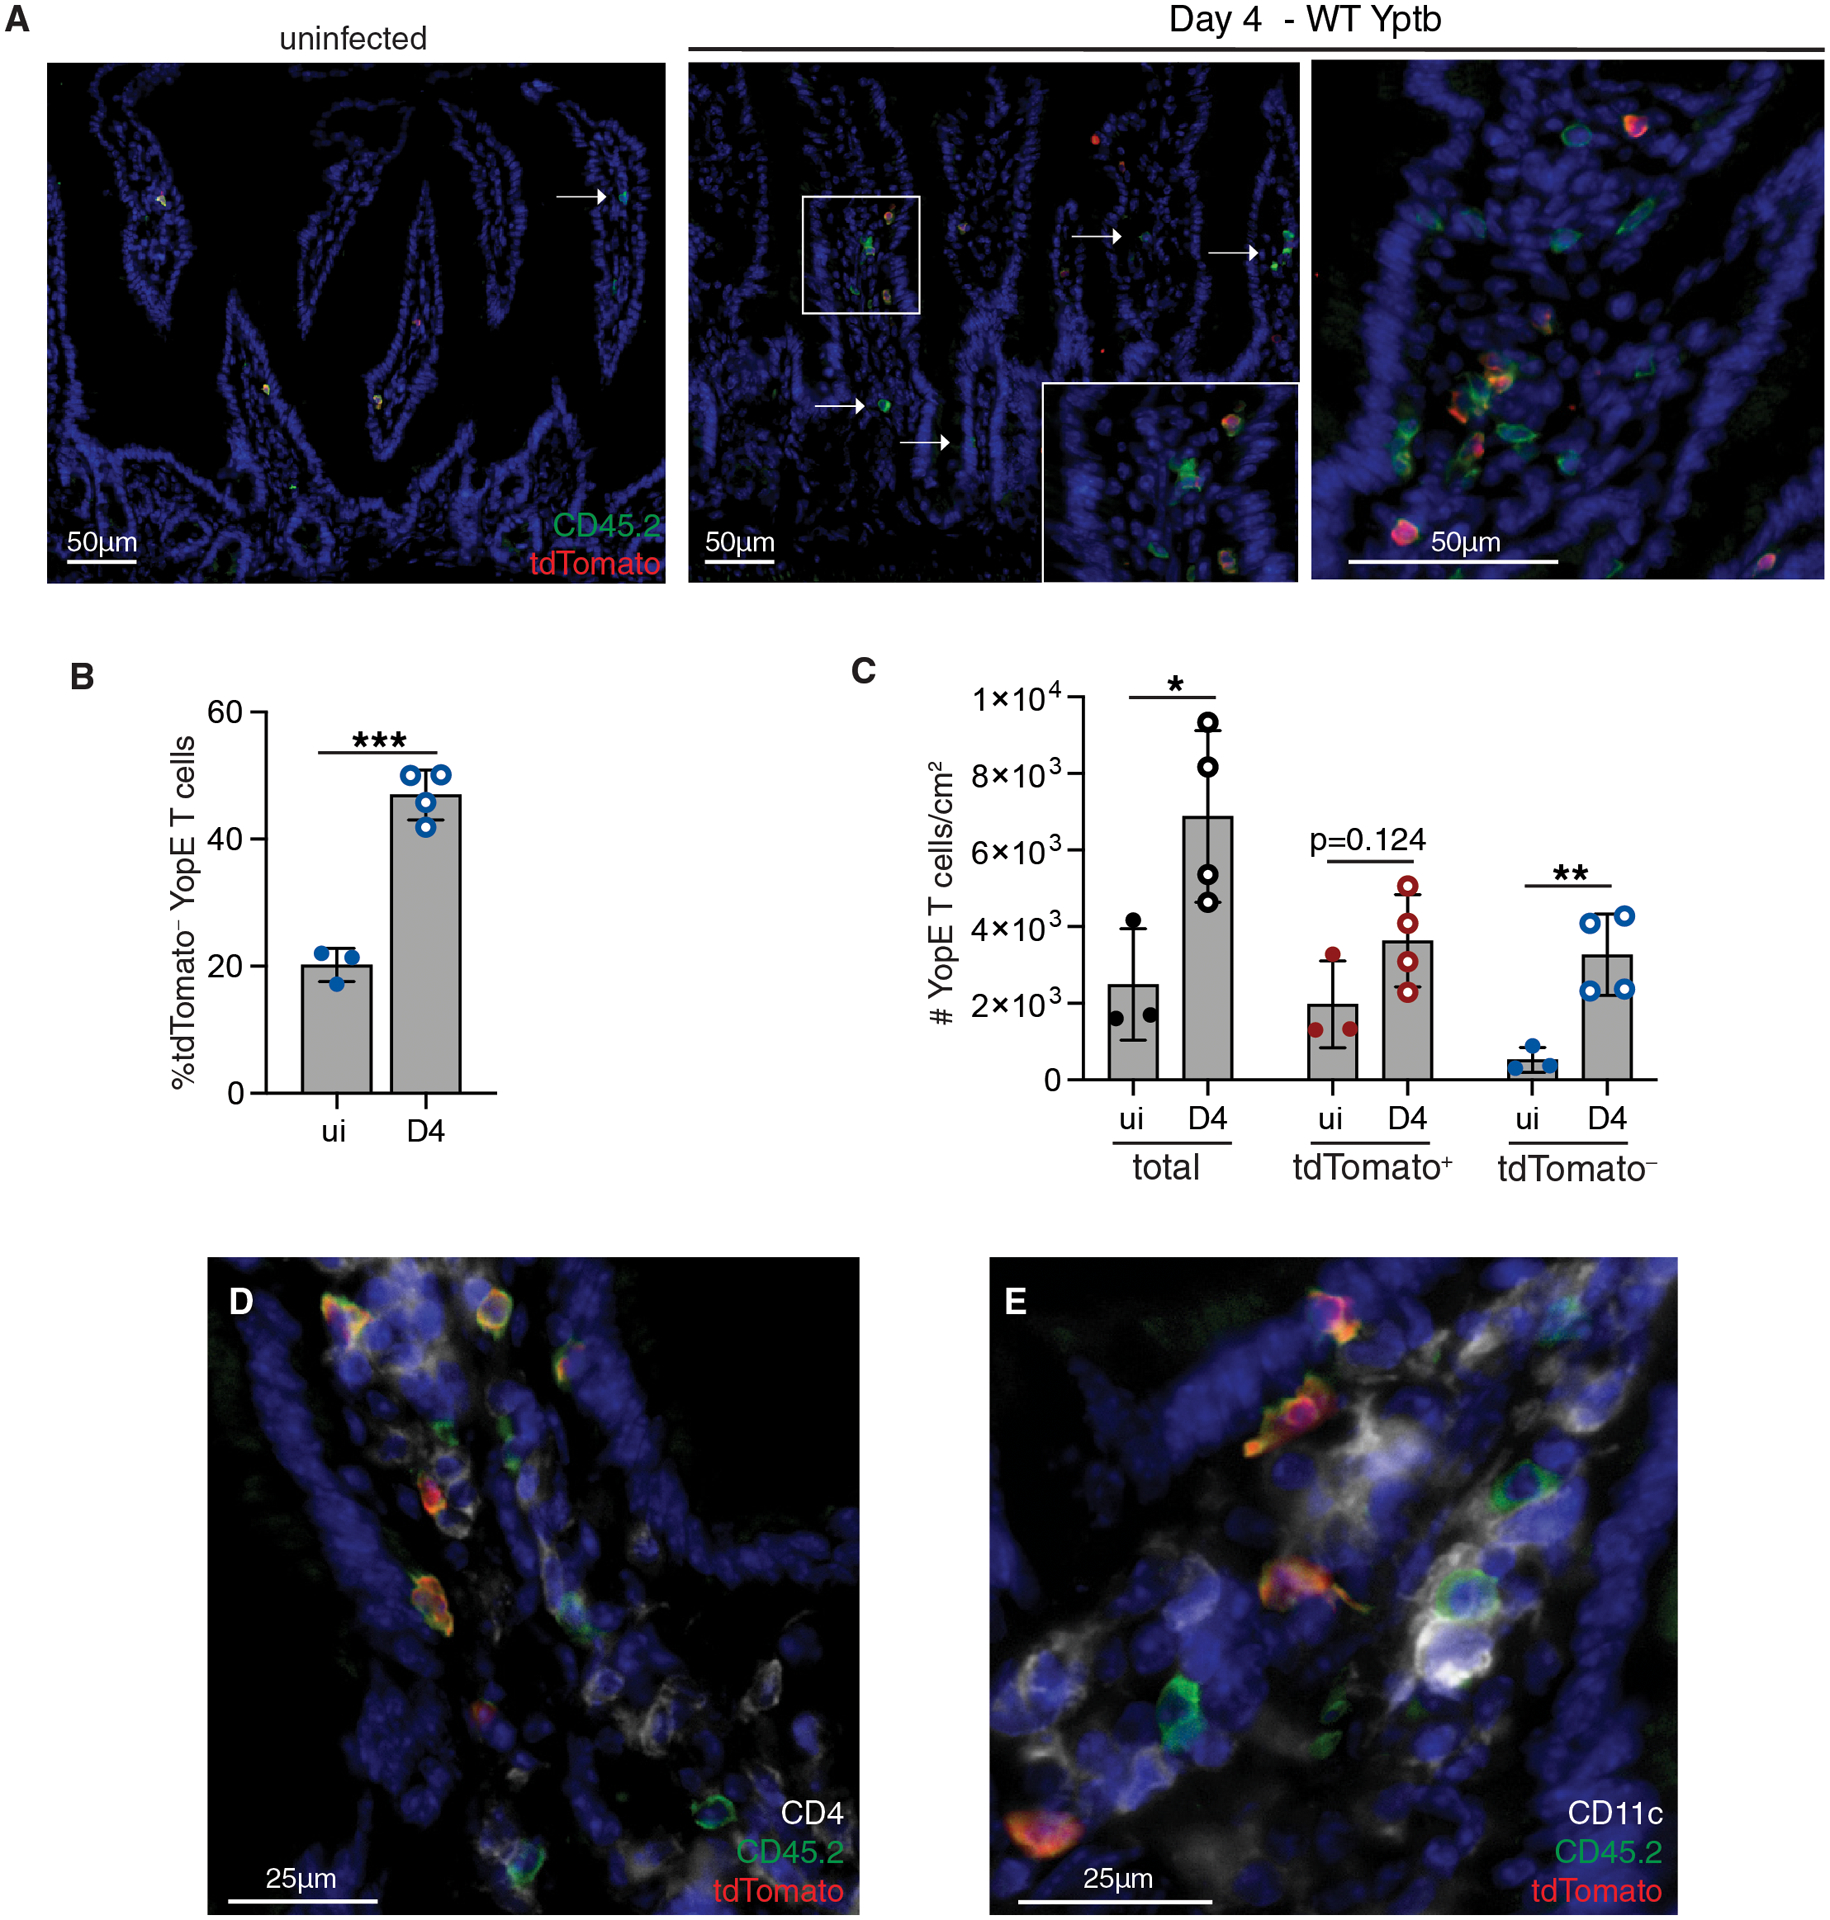
CD45.2+ YopE TCR transgenic iCD103-tdTomato cells were transferred into CD45.1+ mice prior to oral infection with ΔyopM Yptb. At day 30 post-infection, mice were administered tamoxifen and then rechallenged with WT Yptb. At 4 days post-secondary infection, the ileum was harvested for immunofluorescence microscopy. (A) Tissue sections were stained for CD45.2 (green), tdTomato (red), and the nuclei were stained with DAPI (blue). Representative images of tissue from immunized mice (left panel) and at day 4 post infection (right panels). Arrows indicate individual or cluster of tdTomato− YopE T cells (middle panel), with inset showing small cluster of CD45.2+ YopE T cells. Larger lymphocyte cluster (right panel). Scale bar, 50μm. (B) Quantification of percent tdTomato− YopE T cells of total CD45.2+ cells. (C) Quantification of total YopE T cells and the tdTomato+ and tdTomato− subsets per cm2. (D-E) Tissue sections were stained for CD45.2 (green), tdTomato (red), and (D) CD4 (white) or (E) CD11c (white). Nuclei were stained with DAPI (blue) and representative images of tissue from immunized mice are shown. Scale bar, 25μm. Data points represent individual mice and are representative of 2 independent experiments with 3–4 mice/group, means and SDs are shown. P values were determined by unpaired Student’s t-test in (B and C), *p<0.05, **p<0.01, ***p<0.005.
In situ proliferation of CD103−Tomato− intestinal Trm populations
The increased abundance of CD103− Trm cells could be occurring via several mechanisms including in situ reactivation and proliferation of CD103− Trm cells (6, 14, 26), trafficking of T cells after reactivation in the lymphoid organs (6, 15), or non-specific recruitment of circulating CD103− memory T cells (8, 34). To definitively address the contribution of YopE T cells from the periphery to the intestinal CD103− Trm pool during secondary infection, we generated mice with iCD103-tdTomato Trm cells as in Figure 2A and treated with anti-CD8α-depleting antibodies 1 day prior to secondary infection with WT Yptb. Four days after secondary infection, the intestinal tissue was harvested for immunofluorescence microscopy analysis. The administration of anti-CD8α-depleting antibodies reduced the percentage of CD8+ T cells in the MLN by greater than 95% compared to isotype control treated mice (Fig. S5, A and B); however, there was no impact on the expansion of tdTomato− Trm populations in the intestinal tissue during infection (Fig. 4, A and B). There was an increase in the both the percentage (Fig. 4A) and number (Fig. 4B) of tdTomato− Trm cells in the ileum of CD8-depleted mice in response to infection. In addition, there was no difference in the expansion of tdTomato− cells in CD8-depleted and isotype control treated mice after secondary infection (Fig. 4, A and B). To directly examine proliferation of Trm subsets, iCD103-tdTomato immune mice were generated, given tamoxifen, and infected as in Figure 2A. Mice were given EdU at 12 and 24 hours prior to harvest. In uninfected mice, there was a significantly higher percentage of EdU+ cells in the CD103−tdTomato− subset compared to CD103+tdTomato+ Trm cells in LP, suggesting higher levels of basal turnover (Fig. 4, C and D). After secondary infection with WT Yptb, we observed an increase in the percentage of EdU+ cells in both the CD103− and CD103+ subsets when compared to their counterparts from uninfected mice (Fig. 4, C and D). However, the CD103−tdTomato− Trm subset in both the epithelium and LP had significantly more EdU+ cells when compared to the CD103+tdTomato+ subset (Fig. 4D). We confirmed the proliferating CD103−tdTomato− cells observed during secondary infection were tissue-derived, as increased EdU incorporation by CD103− Trm cells compared to CD103+ Trm cells was also observed when circulating CD8 T cells were depleted (Fig. S5C). These data confirmed that during secondary challenge, CD103−tdTomato− Trm cells are expanding within the intestinal tissue, and that circulating YopE T cells are not contributing significantly to the observed increase in the CD103−tdTomato− Trm population.
Fig. 4. Local reactivation of CD103−tdTomato− Trm cells during secondary infection.
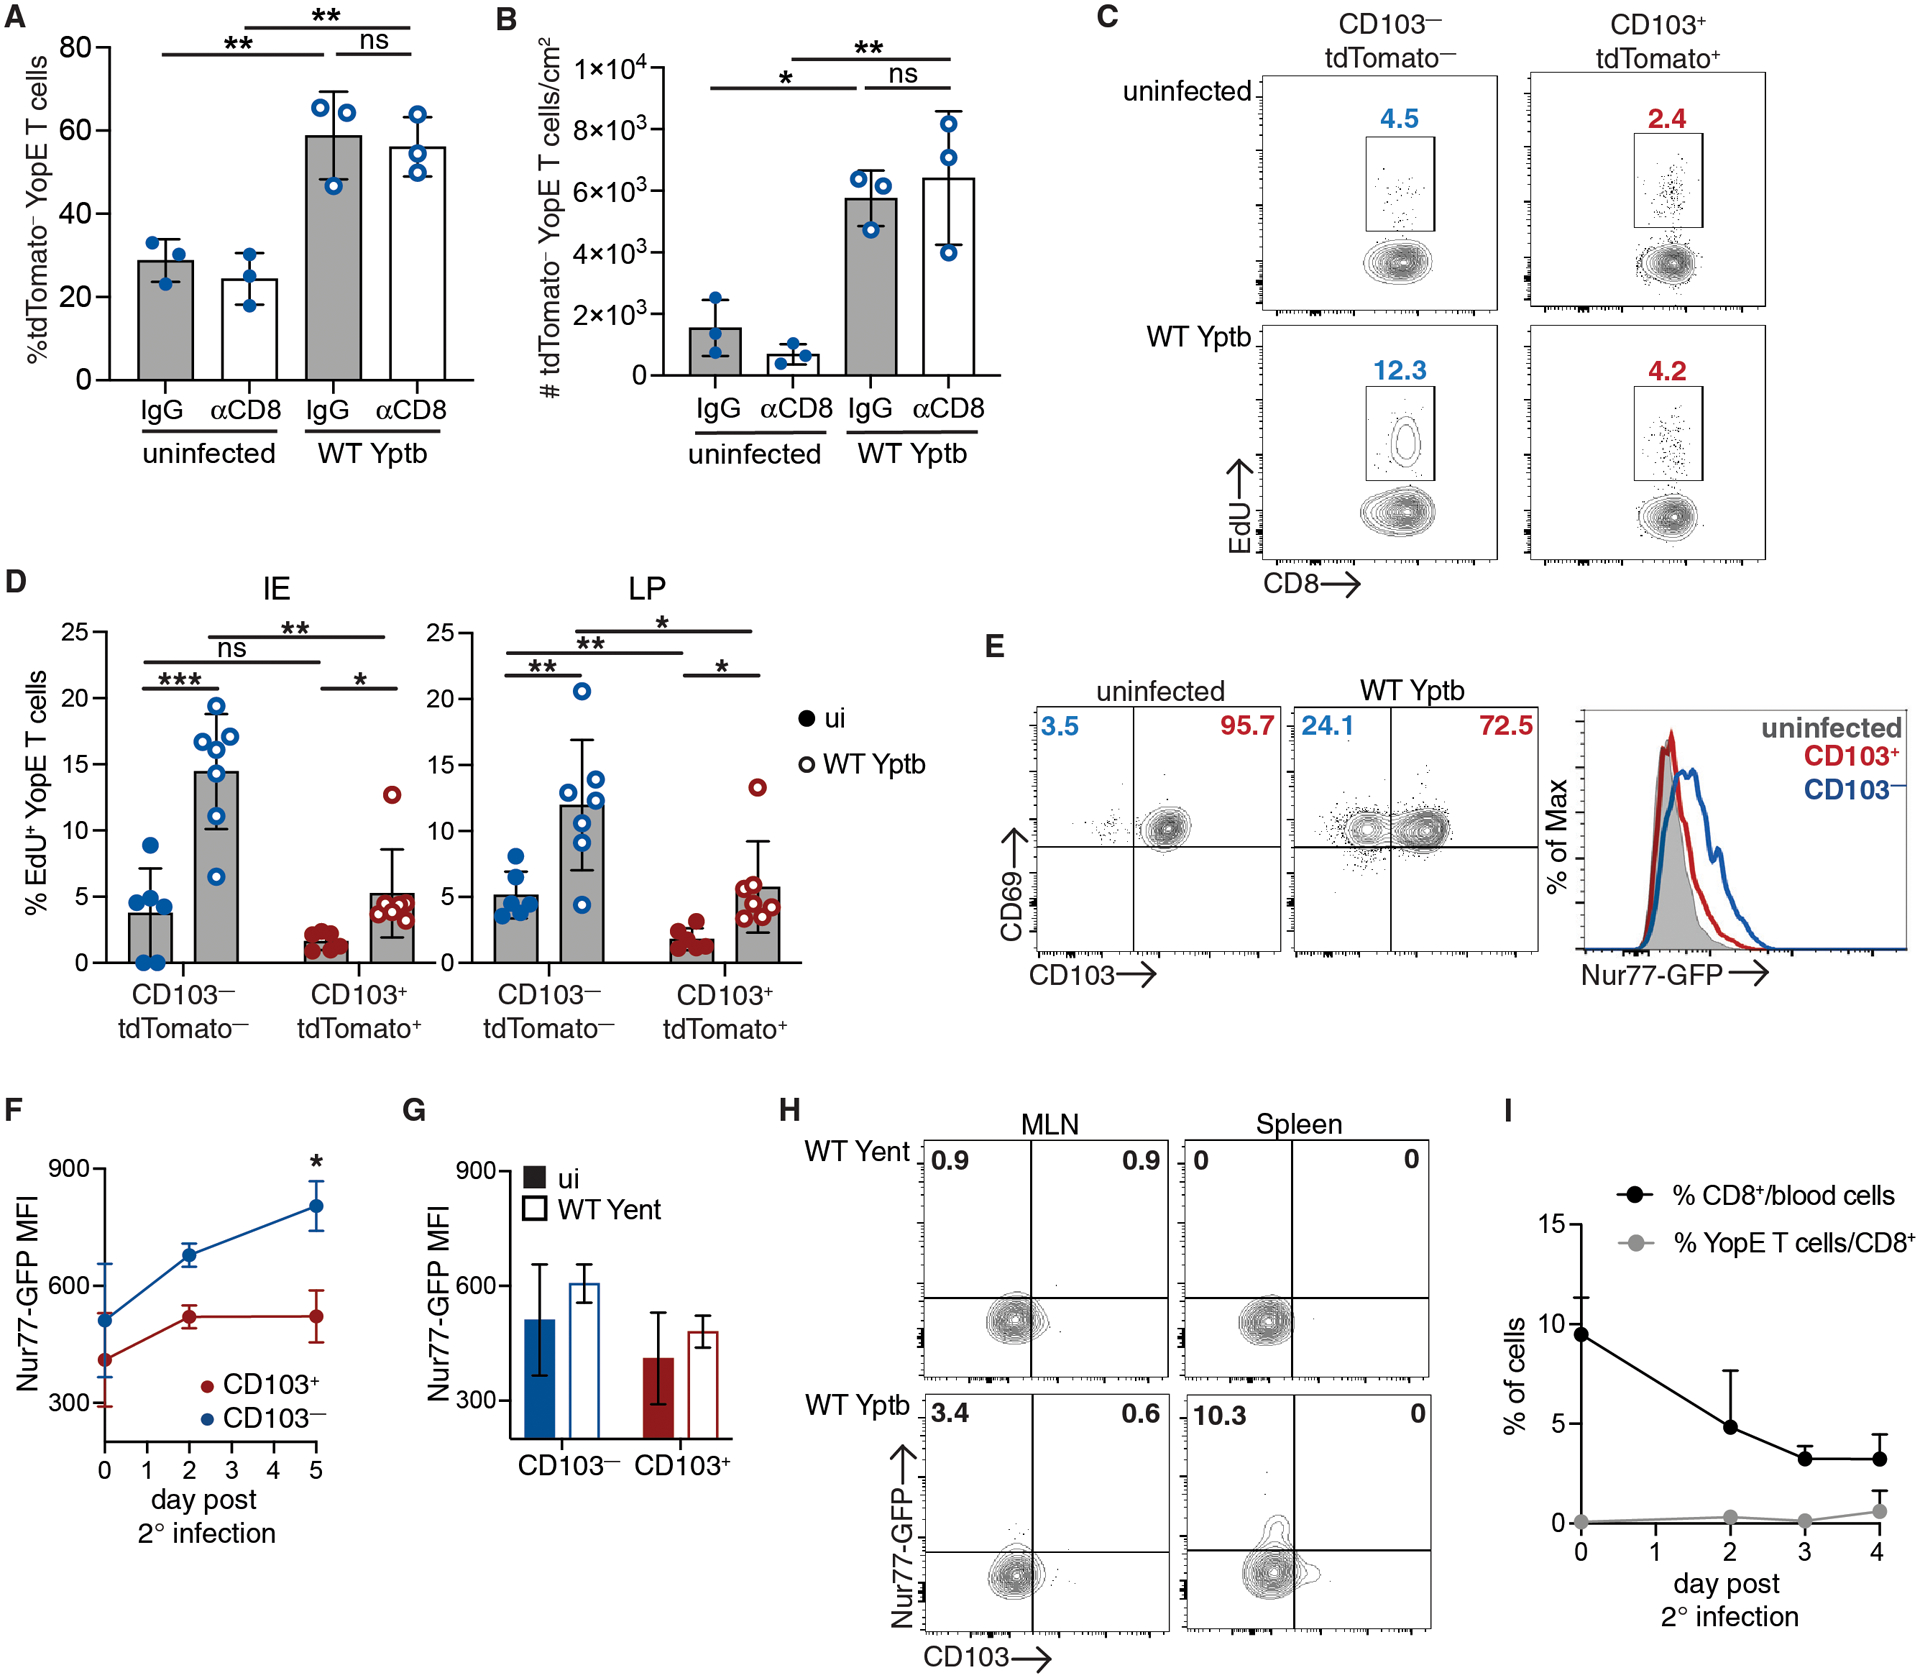
(A-C) CD45.1+ mice received CD45.2+ iCD103-tdTomato YopE T cells before oral gavage with ΔyopM Yptb. At 30 days post-infection, mice with iCD103-tdTomato YopE T cells were administered tamoxifen. (A-B) One day prior to infection with WT Yptb, mice were administered anti-CD8α depleting or IgG control antibodies. At 4 days post-secondary infection, the ileum was harvested for immunofluorescence microscopy and stained for CD45.2 and tdTomato expression. Quantification of the percent tdTomato− cells/total CD45.2+ iCD103-tdTomato YopE T cells (A) and number tdTomato− cells/cm2 (B) in the ileum. (C) Incorporation of EdU into tdTomato+CD103+CD69+ and tdTomato−CD103−CD69+ IE and LP Trm subsets from immune mice and at 4 days post-secondary infection. (D-G) CD45.2+ mice received CD45.1/2+ Nur77-GFP YopE T cells before oral gavage with ΔyopM Yptb. At greater than 30 days post-infection, mice were rechallenged with WT Yptb or Yent. (D) Representative plots of CD103 and CD69 expression by LP YopE Trm cells on day 5 post infection and representative histograms of Nur77-GFP expression in total LP Trm cells from Yptb immune mice and CD103+CD69+ and CD103−CD69+ LP Trm subsets after infection. Nur77-GFP MFI in LP Trm subsets after infection with Yptb (E) or Yent (F). (G) Representative plots of CD103 and Nur77-GFP expression by MLN and spleen YopE T cells 5 days post infection with Yent or WT Yptb. Numbers are percent of cells in each quadrant. (H) Percentage of CD8+ T cells of total blood cells and percentage of transferred YopE T cells of CD8+ T cells over the course of secondary infection. Data points represent mean (E, G, H) or individual mice (A-C) and are representative of 2–3 independent experiments (A,B,E) or pooled from 2–3 independent experiments (C,E) with 3–4 mice/group, means and SDs are shown. P values were determined by one-way ANOVA with Tukey’s test (A, B, E) or paired or unpaired Student’s t-test in (C, E, F), *p<0.05, **p<0.01, ***p<0.001.
Enhanced reactivation of CD103− Trm cells in the intestinal tissue
We utilized YopE T cells with a Nur77-GFP transgene, which reports the strength of TCR signaling (35), to determine whether the proliferative abilities of CD103+ and CD103− Trm cells are due to different levels of TCR stimulation. Naïve CD45.1+ Nur77-GFP YopE T cells were transferred into CD45.2+ recipient mice, and mice were then infected with ΔyopM Yptb. At 30 days post infection, mice were rechallenged with virulent WT Yptb and tissues were harvested at the indicated timepoints. After secondary infection, CD69+CD103− Trm cells were increased as a percentage of the total LP Trm population as observed in our previous experiments (Fig. 4E). As previously reported, we found that intestinal Trm cells had higher levels of Nur77-GFP at a resting state when compared to circulating cells (36) (Fig. S6A), but there was no significant difference in GFP expression observed between the CD103+ and CD103− Trm populations from the LP (Fig. 4F). When we compared Nur77-GFP expression in CD103+ and CD103− Trm subsets, we found that GFP expression only increased in LP CD103− Trm cells after infection while expression of GFP in the CD103+ Trm cells remained relatively stable (Fig. 4F). To confirm the role of antigen stimulation in the upregulation of Nur77-GFP in these experiments, we infected immunized mice with Y.enterocolitica (Yent). Yent YopE contains multiple amino acid substitutions in the YopE69–77 epitope and does not lead to activation of YopE T cells (37). There was no increase in Nur77-GFP expression in LP Trm cells in Yent-infected mice compared to cells from uninfected mice (Fig.4G). These experiments were also done using mice that received in vitro activated T cells, and TCR-dependent Nur77-GFP upregulation was restricted to the CD103− Trm subset (Fig. S6B). These data confirmed the increased TCR-dependent reactivation and proliferation of the CD103− subset compared to CD103+ Trm cells.
Surprisingly, circulating memory YopE T cells failed to traffic into the intestinal tissue during the first few days after secondary infection. We assessed Nur77-GFP expression to examine reactivation in the MLN and spleen following secondary infection. There was modest increase in GFP+ cells in both the MLN and spleen after Yptb infection compared to Yent-infected or uninfected mice (Fig. 4H). However, we also followed the appearance of YopE T cells in the blood after Yptb rechallenge, and there was no significant increase in the percentage of YopE T cells as a percentage of CD8 T cells or total blood cells (Fig. 4I). This suggest YopE T cells in the lymphoid organs are exposed to antigen, but this is not sufficient to mobilize them into the blood early after infection. The non-specific recruitment of memory T cells in response to Trm activation occurs in other tissues (8, 34), and this was analyzed by transferring polyclonal memory CD8+ T cells into immune mice prior to secondary infection. At 4 days post infection, we detected significant numbers of transferred memory T cells in the MLN but few if any cells in the IE or LP (Fig. S7). Overall, our data demonstrated increased antigen-dependent reactivation and proliferation of CD103− Trm cells compared to CD103+ cells in response to local infection and limited reactivation and mobilization of memory T cells from the lymphoid organs.
CD103−Tomato− Trm cells maintain a circulating memory T cell signature and unique functional capabilities
To understand the unique features of CD103− Trm cells that allow this population to respond more quickly to secondary infection and to understand the gene expression changes that accompany Trm reactivation, we performed RNA-sequencing on CD103+tdTomato+ and CD103−tdTomato− LP Trm cells sorted from immune mice and at 4 days after secondary infection with WT Yptb (Fig. S8). Principal component analysis confirmed CD103+tdTomato+ clustered separately from CD103−tdTomato− LP Trm cells (Fig. 5A). Prior to secondary infection, many of the genes that are normally downregulated in Trm cells compared to circulating T cells (Tcirc) remain elevated in CD103− Trm cells. Gene set enrichment analysis identified a significant enrichment in Tcirc signature genes (38, 39) in CD103−tdTomato− Trm cells compared to CD103+tdTomato+ cells, both prior to and after secondary challenge (Fig. 5B). Trm signature genes were expressed along with Tcirc genes in CD103−tdTomato− Trm cells, and many genes required for Trm differentiation were expressed at similar levels when comparing CD103+tdTomato+ and CD103−tdTomato− Trms (Fig. S9A). Further analysis of Hallmark gene sets that were enriched before and after secondary infection demonstrated that CD103− Trm cells expressed genes associated with inflammation and inflammatory cytokines (Fig. 5C). This is consistent with the exposure of CD103− Trm cells to inflammatory cytokines as part of their differentiation process and maintenance of this inflammatory response signature after infection is resolved (24, 25). Comparison of these populations from infected mice also demonstrated increases in gene signatures indicative of proliferation in CD103− Trm cells, including E2F targets, G2M checkpoint, and Myc target genes (Fig. 5D).
Fig. 5. RNAseq analysis of the CD103+tdTomato+ and CD103−tdTomato− LP Trm subsets reveal distinct functional capabilities.
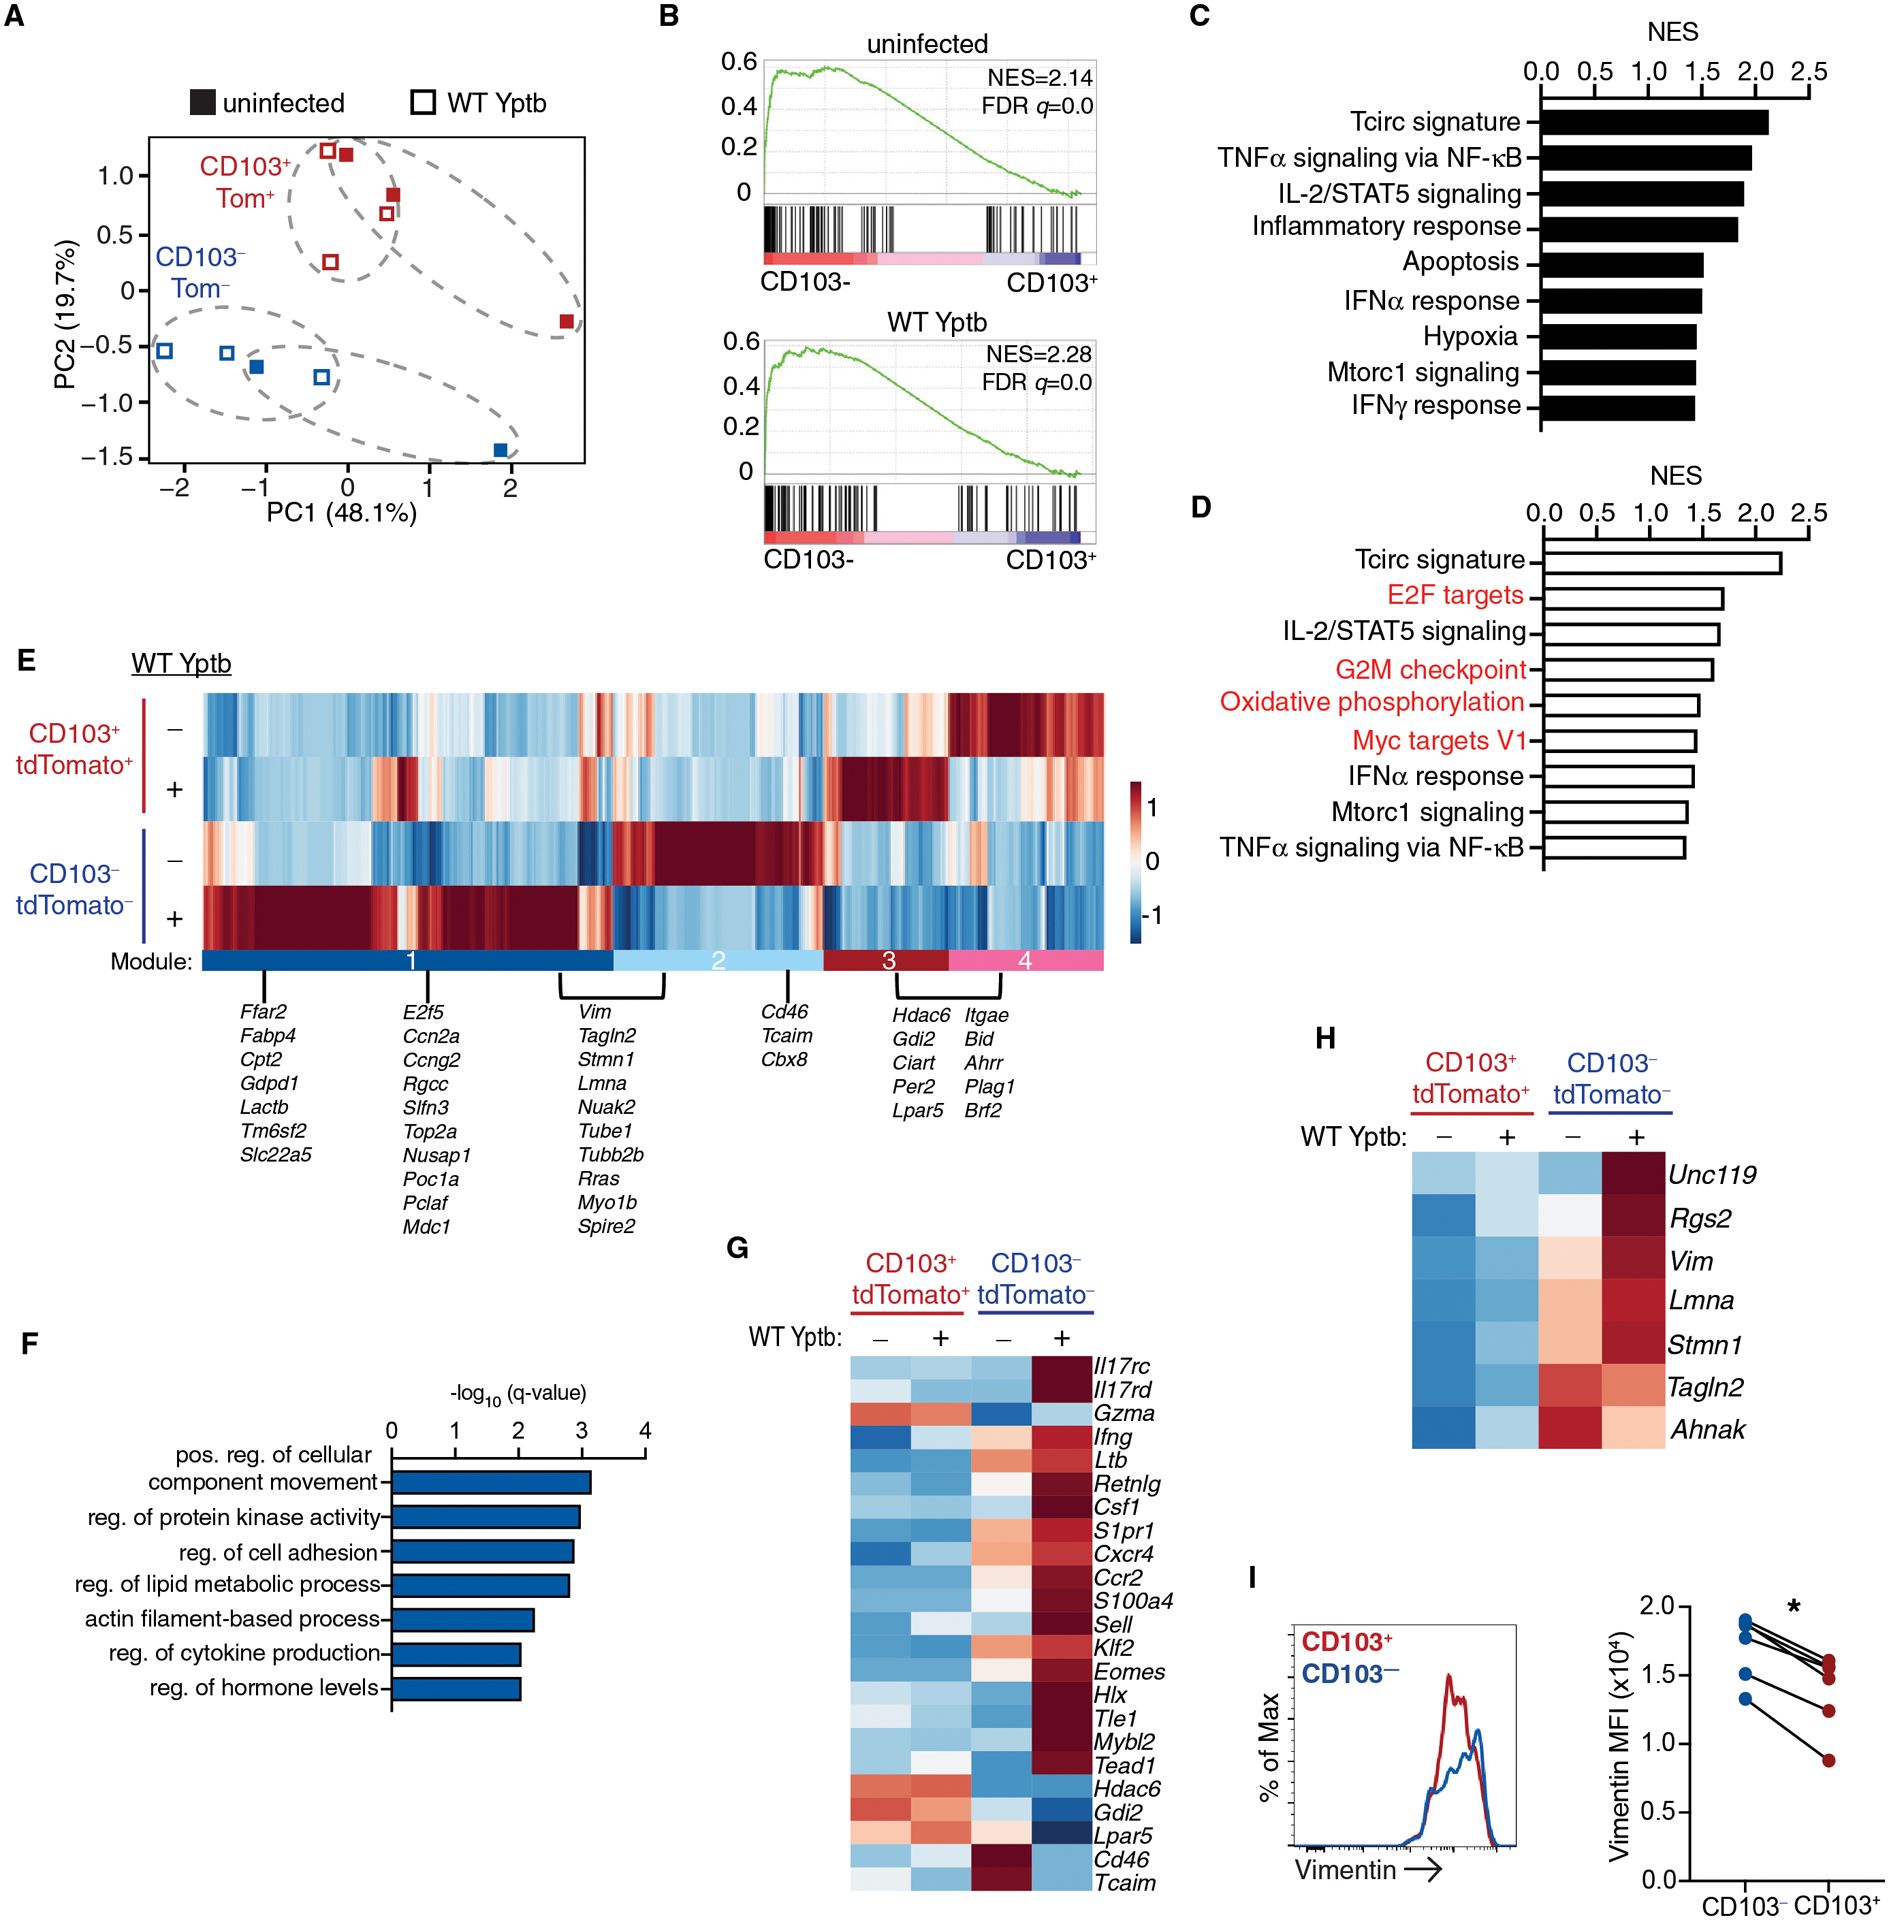
CD45.1+ mice received CD45.2+ iCD103-tdTomato YopE T cells before oral gavage with ΔyopM Yptb. At 30 days post-infection, immune mice were administered tamoxifen and then infected with WT Yptb and T cells were sorted from the LP 4 days later. (A) Principal component analysis of global gene expression, biological replicate samples from individual mice are indicated by dotted ellipses. (B-D) GSEA comparing the CD103− to the CD103+ subset in immune mice before and after secondary infection. (B) GSEA plot showing enrichment of circulating T cell signature (Tcirc) genes in immune mice (top panel) and after secondary infection (bottom panel). Normalized enrichment score (NES) and FDR q-value are shown. GSEA of select Hallmark Gene Sets in the CD103− Trm subsets before (C) and after (D) infection. NES is shown and all have an FDR-q value <0.05. (E) Heatmap of differentially expressed genes from pairwise comparisons of all groups. Modules are highlighted and a subset of genes from each module are listed. (F) GO pathway analysis of genes that are in module 1 and 2 using Metascape. (G-H) Heatmap of genes of interest selected from (C). (I) Expression of vimentin by CD103−tdTomato− and CD103+tdTomato+ LP cells from uninfected mice. Representive flow cytometry is shown, and connected data points represent individual mice and are pooled from 2 independent experiments (I). P values were determined by paired Student’s t-test, *p<0.001.
Differentially expressed genes among the groups were identified (FC>1.5, FDR adjusted P<0.05), and hierarchical clustering revealed 4 gene modules (Fig. 5E). Module 1 was expressed in CD103− Trm subset in response to infection and module 2 in the CD103− Trm subset from uninfected mice and down regulated after secondary infection. Expression of modules 3 and 4 were differentially regulated among the CD103+ subset in response to infection. Metascape analysis of the genes in modules 1 and 2 revealed a significant increase in genes involved in cellular movement, cell adhesion, and actin filament-based structure organization (Fig. 5F) and representative genes are listed (Fig. 5E). Lipid utilization is important for Trm maintenance (40), and genes associated with lipid metabolism (Ffar2, Fabp4, Cpt2) were also increased in module 1 (Fig. 5F). Genes involved in cell proliferation were also identified in module 1, consistent with GSEA (Fig 5D). Unique transcription factors were expressed in the CD103− Trm subset; Klf2 and Eomes were elevated in CD103− cells from immune mice and were further upregulated upon secondary infection (19, 24). Additional transcription factors that have not been previously identified as important for Trm function (Hlx, Tead1, Tle1) were induced in CD103− cells in response to secondary infection (Fig. 5G). CD103− Trm cells had increased effector function in terms of basal expression of cytokines (Ifng, Ltb, Csf1) and genes associated with enhanced migratory potential including S1pr1, Ccr2, Cxcr4, and S100a4. In addition, CD103+ Trm cells and resting CD103− Trm cells had elevated expression of genes that play an inhibitory role in T cell activation (Tcaim, Lpar5, Hdac6).
Of particular interest were a group of genes that elevated in CD103− when compared to CD103+ Trm cells before infection and remained high or were further increased after infection. Tagln2, Lmna, Stmn1, Unc119, Rgs2, Ahnak, and Vim were all elevated in the CD103− Trm subset and are required for proper T cell activation and/or recruitment of proteins to the immune synapse after T cell activation (41–46). Flow cytometric analysis confirmed increased expression of intermediate filament protein vimentin (Vim) in CD103− compared to CD103+ Trm cells from immune mice (Fig. 5 I). Our findings indicated CD103− Trm cells from the intestinal LP maintain a signature that includes genes characteristic of circulating memory T cells while maintaining long-term residence within the tissue (25) (Fig. S9B). In addition, CD103− Trm cells expressed genes indicating enhanced migratory capabilities and increased sensitivity to TCR-mediated reactivation, which may contribute to their increased recall potential.
CD103− Trm cells have enhanced reactivation and cytokine production potential
CD103− Trm cells may be more likely to encounter infected antigen presenting cells and undergo TCR-mediated reactivation; however, it is also possible that the biology of Yersinia infection results in selective reactivation this subset. To address this, we generated mice with Nur77-GFP reporter YopE Trm cells and reactivated cells with dilutions of YopE69–77 peptide one hour prior to T cell isolation (12). We found that CD103+ Trm cells were capable of Nur77 expression after direct peptide stimulation; however, an increased percentage of CD103− Trm cells were Nur77-GFPhi compared to CD103+ Trm cells when limiting peptide concentrations were used (Fig. 6A). CD103− Trm cells also displayed higher levels of Nur77-GFP expression than CD103+ Trm cells across all peptide concentrations (Fig. 6B), indicating CD103− Trm cells undergo more efficient TCR-mediated reactivation. We examined Trm effector function after in vivo peptide stimulation and observed a dose-dependent increase in IFNγ and TNFα production in CD103− Trm cells, while only 5% of CD103+ Trm cells produced IFNγ and TNFα, even at the highest peptide concentrations (Fig. 6, C and D). We also observed increased IL-2 production among the CD103− Trm subset when compared to their CD103+ counterparts (Fig. 6F). Consistent with our RNA-seq data, CD103+ LP Trm populations did express higher levels of Granzyme A than CD103− Trm cells, and this was unaltered by peptide stimulation (Fig. 6G). These data confirm CD103+ Trm cells can undergo TCR-mediated reactivation under settings with increased antigen availability; however, CD103+ Trm cells remain less efficient at upregulating Nur77 and have drastically reduced cytokine production compared to CD103− Trm cells.
Fig. 6. Superior TCR-mediated reactivation and cytokine production by CD103−tdTomato− LP Trm in vivo and ex vivo.
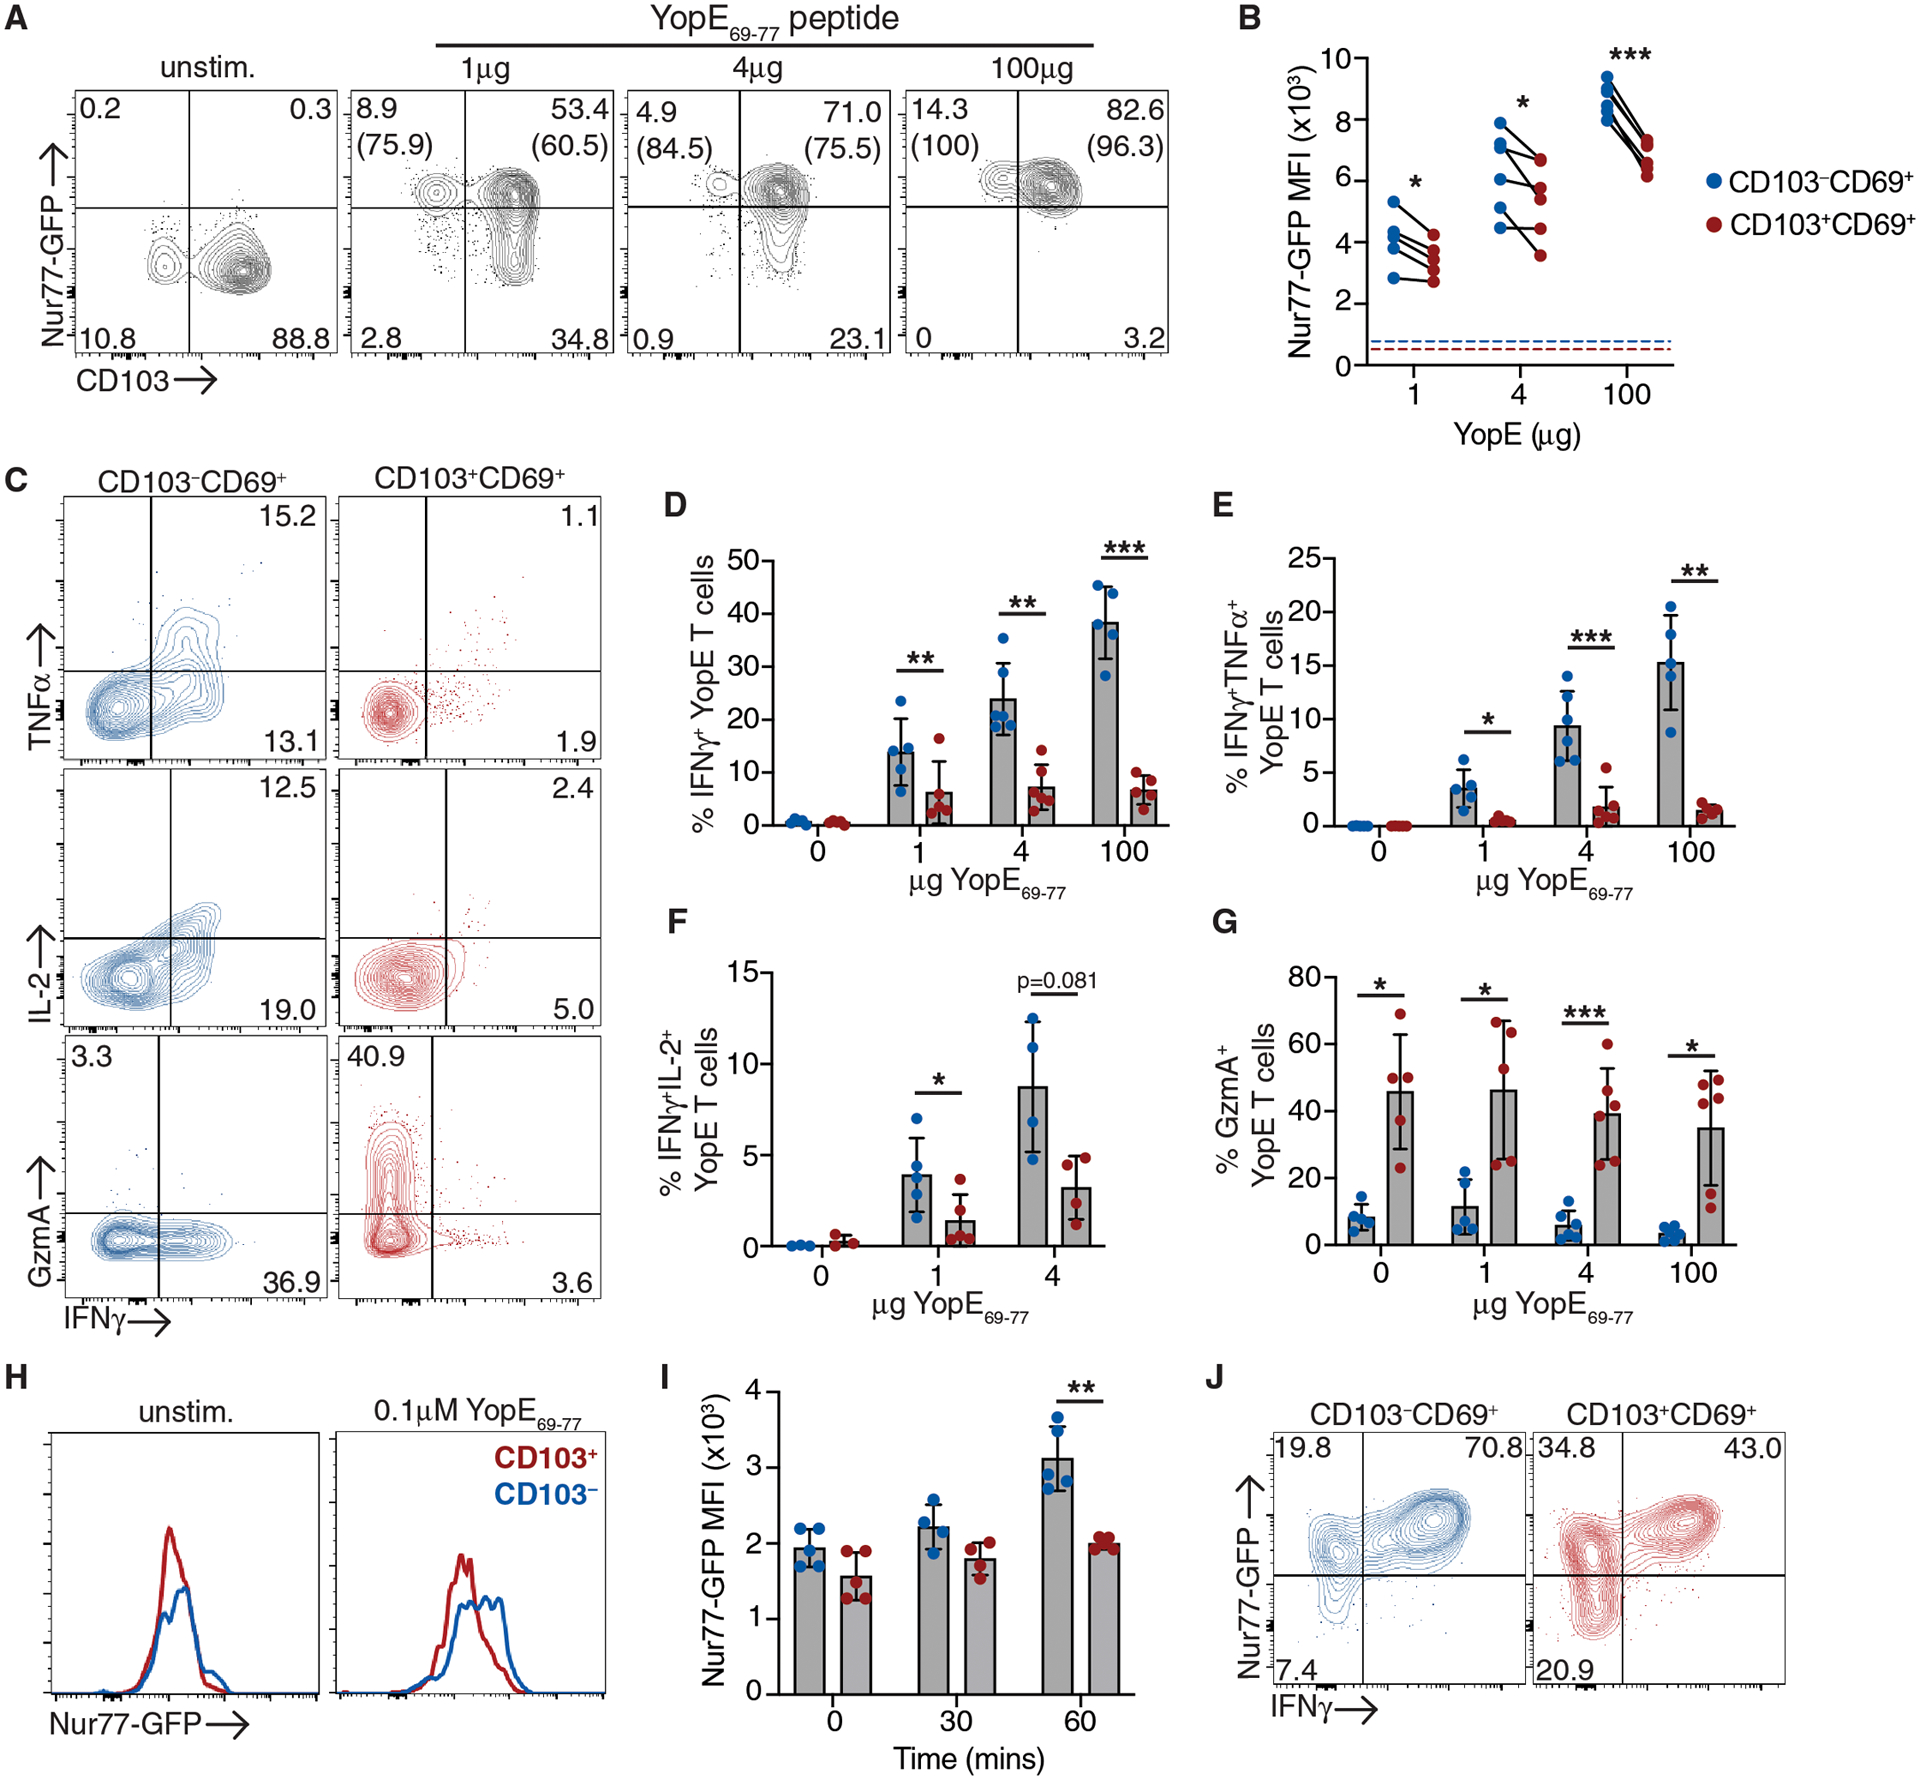
CD45.2+ mice received CD45.1+ Nur77-GFP YopE T cells before oral gavage with ΔyopM Yptb. (A-G) At 30 days post-infection, mice were administered 1–100μg YopE69–77 peptide or vehicle control i.p. and tissue was harvested 1 hour later. (A) Representative flow cytometry plots of Nur77-GFP and CD103 expression by CD69+ YopE T cells from the LP. Numbers represent the percentage of cells in each quadrant, and numbers in parenthesis are the percentage of Nur77-GFPhi cells of the CD103−/+ subsets. (B) MFI of Nur77-GFP of CD103−/+ subsets, data points are individual mice with lines connected samples from the same mouse. Dashed lines represent MFI of Nur77-GFP in unstimulated control YopE T cells. (C) Representative flow cytometry plots of IFNγ, TNFα, IL-2, and granzyme A expression in CD103+CD69+ and CD103−CD69+ YopE Trm subsets from the LP. Quantification of the percent of IFNg+ (D), IFNγ+TNFα+ (E), IFNγ+IL-2+ (F), and GranzymeA+ (G) cells from each subset. (H-J) LP cells were isolated and stimulated with 0.1μM YopE69–77 ex vivo. Representative histograms of Nur77-GFP expression by unstimulated CD103−/+ subsets and 30 or 60 minutes after YopE69–77 stimulation (H) and Nur77-GFP MFI at indicated timepoints (I). (J) Representative plots of Nur77-GFP and INFγ expression by CD103−/+ subsets after 4 hours of peptide stimulation. Gates were determined using unstimulated samples from the same mice. Data points represent individual mice and are pooled from 2–3 independent experiments, means and SDs are shown. P values were determined by paired Student’s t-test, *p<0.05, **p<0.01, ***p<0.005.
Differential localization of CD103− Trm cells within the tissue could contribute to improved reactivation potential, and CD11c+ cells were more frequently in contact with tdTomato− Trm cells than with tdTomato+ cells in immune mice and after secondary infection (Fig. S10). To disrupt these interactions, Nur77-GFP cells were isolated from the LP and restimulated with YopE69–77 peptide in vitro. CD103− Trm cells underwent more rapid upregulation of Nur77-GFP, which was evident at 60 minutes post stimulation (Fig. 6, H and I). After longer periods of stimulation both subsets were able to respond to peptide stimulation; however, fewer CD103+ Trm cells upregulated Nur77-GFP and produced IFNγ when compared to CD103− Trm cells (Fig. 6J). Overall, these data indicate CD103− Trm cells have enhanced reactivation and cytokine production potential both in vitro and in vivo.
DISCUSSION
Trm cell populations display significant phenotypic heterogeneity across multiple tissues and whether this influences secondary Trm responses is not well understood. Our studies have identified the importance of the CD103− Trm population in providing a local source of first responders to pathogen reinfection and have demonstrated the limited reactivation potential of CD103+ LP Trm cells. We have also shown that the plasticity of Trm cells was somewhat limited, and the exit of the CD103+ Trm subset from the intestinal tissue did not occur. CD103− Trm cells maintained a gene expression signature with features of circulating T cells, with increased migratory and TCR signaling potential. Direct measurement of TCR stimulation in vivo demonstrated improved reactivation of CD103− Trm cells and distinct effector functions of individual Trm subsets. Overall, our data indicated that there is a division of labor between Trm subsets in the intestinal tissue that is broadly defined by CD103 expression, and generation of CD103− Trm subset during primary infection and immunization may govern the magnitude of secondary Trm responses in the intestinal tissue.
A hallmark of memory T cells is their ability to re-expand during subsequent encounter with the same antigen, with circulating memory T cell subsets having distinct TCR signaling, effector, and proliferative potential (47–50). Tissue-autonomous re-expansion of Trm cells is observed in several tissues, including the skin, lung, and female reproductive tract (6, 14, 26). We have shown that in the intestinal tissue, which contains both CD103+ and CD103− Trm populations, CD103− Trm cells were superior in their recall potential. This is consistent with previously published studies that show early expansion of CD103− Trm cells in the lung after secondary challenge (26). Here, we definitively demonstrated that intestinal CD103− Trm cells were expanding in situ and our fate-mapping strategy confirmed these cells were not derived from CD103+ Trm cells. Surprisingly, there was only modest reactivation and proliferation of CD103+ Trm cells under these infection conditions. TGF-β-mediated signaling is linked to poor recall and limited plasticity of CD103+ Trm cells (19), potentially through the TGF-β-dependent expression of inhibitory receptors like PD-1 and TIM-3 (19). We did not detect differential expression of these inhibitory receptors by intestinal Trm subsets in our studies; however, elevated levels Hdac6, Lpar5, and other genes with the potential to inhibit CD8 T cell function were observed in CD103+ Trm cells (51, 52). The contribution of individual inhibitory molecules to the observed disparity in recall potential requires further investigation. TGF-β signaling also results in downregulation of circulating T cell signature genes (19); however, the exposure of CD103− Trm cells to inflammatory cytokines during priming/differentiation may inhibit some regulatory effects of TGF-β (24) and allow maintenance of critical circulating memory T cell signature genes. Inflammation is associated with improved TCR signal transduction (53), which could further contribute to improved reactivation of CD103− Trm cells in the context of limited antigen availability during Yersinia infection. Maintenance of a circulating T cell signature and reduced expression of inhibitors of T cell activation likely confers a distinct advantage to CD103− Trm cells in their ability to proliferate and reestablish antimicrobial lymphocyte clusters upon secondary infection.
Trm subset-specific interactions with other cells within the tissue could also support enhanced reactivation of CD103− Trm cells during infection in vivo. Our data indicated CD103− Trm cells were more frequently in contact with CD11c+ macrophages/dendritic cells, and CD11c+ dendritic cells support Trm recall responses and protection from secondary infection in some tissues (57, 58). Analysis of TCR signaling during secondary infection of the lung indicates multiple cell types can drive Trm reactivation under certain infection conditions (59). The nature of the antigen presenting cell also plays an important role in dictating the functional capabilities of responding lung Trm cells, with non-hematopoietic cells driving proliferation and hematopoietic cells stimulating cytokine and chemokine production (59). CD4 T cells localized with Trm cells in lymphocyte clusters and are important for CD8 Trm differentiation and maintenance (60, 61) and recall responses (62) and may play a role CD103− Trm reactivation as well. The increased migratory potential of CD103− Trm cells may promote their recruitment to areas of infection and access to rare antigen presenting cells and CD4 T cell help. While binding of CD103 on Trm cells to epithelial E-cadherin facilitates Trm retention within many tissues (21, 54–56), it may negatively impact Trm reactivation by limiting the frequency of CD103+ Trm contacts with other cell types that support reactivation. CD103+ and CD103− Trm subsets interactions with distinct cell populations within the tissue, along with cell intrinsic differences, could further impact their reactivation potential and effector function.
Overall, our data highlight the importance of the CD103− Trm subset in providing a source of expandable T cells during secondary infection. Our data is complemented by a companion manuscript by von Hoesslin et. al., which demonstrates that CD103+ Trm cells undergo bystander activation and limited expansion, even when circulating and resident CD103− Trm cells are deleted (63). Together our studies indicate that much like the diversity among circulating T cell memory populations, there is diversity among Trm cells, with CD103+ Trm cells having features consistent with terminal differentiation and CD103− Trm cells displaying classical memory functions. The CD103− Trm population is present in many tissues but is often overlooked, as it is a relatively minor population compared to the CD103+ Trm subset. However, these studies demonstrate that even modest populations of CD103− Trm cells can contribute significantly to the secondary Trm pool. In addition to the number of Trm cells dictating tissue protection, maintaining diversity within Trm populations is likely required for maximizing immune protection upon secondary challenge.
MATERIALS AND METHODS
Study Design
The goal of this study was to understand the contributions of intestinal CD103+ and CD103− Trm subsets to tissue immunity. To this end, we generated a mouse model to fate map CD103+ Trm cells and used flow cytometry, immunofluorescence microscopy, and RNA-seq to examine plasticity and function of Trm subsets during secondary infection. For all experiments, male and female mice were used. Experiments were performed 2–3 times, all data points represent biological replicates, and statistical analyses are reported in each figure legend.
Animals
Recipient C57BL/6 and B6.SJL-Ptprca, B6.Cg-Gt(ROSA)26Sortm14(CAG-tdTomato)Hze/J, and C57BL/6-Tg(Nr4a1-EGFP/cre)820Khog/J mice were purchased from Jackson Laboratories. Itgae-creERT2 mice (developed by Biocytogen) were generated by inserting IRES-CreERT2 into the target site at the junction of Exon 31 and the 3’UTR using CRISPR/Cas9-mediated gene targeting. YopE TCR transgenic mice were generated in house with the assistance of the Rutgers Genome Editing Core. Mice were immunized with YopE69–77 peptide (SVIGFIQRM; Genemed Synthesis) pulsed dendritic cells, and splenocytes were isolated from immunized mice and stimulated with 1μM YopE peptide and 20U/ml IL-2 (Peprotech) before fusion with BWZ.36/CD8 lymphoma cells (64). Individual YopE-specific hybridomas were isolated by single cell sorting. YopE specificity of isolated clones was analyzed by YopE-tetramer staining and production of IL-2 after stimulation with YopE pulsed splenocytes. The TCRα and TCRβ sequences from selected YopE hybridomas were determined by 5’-RACE and were separately cloned into an expression vector under the control of the human CD2 promoter (65). Linearized TCRα and TCRβ vectors were used for microinjection of C57BL/6 zygotes. Insertion of the transgenes were confirmed by PCR amplification of the TCRα and TCRβ sequences, H2-Kb YopE69–77-tetramer staining, and proliferation in response to YopE peptide stimulation (Fig. S2, A and B). All mice were housed and maintained under specific pathogen free conditions at Rutgers Cancer Institute of New Jersey animal facilities. All experiments were performed in accordance with the Institutional Animal Care and Use Committee of Rutgers New Jersey Medical School Comparative Medicine Resources.
Y.pseudotuberculosis infection
Bacteria were routinely cultured on LB agar and grown shaking in LB media at 26°C overnight prior to infection. For primary infections, mice received 2×10⁸ CFUs of YopM-deficient Yersinia pseudotuberculosis YPIII (ΔyopM Yptb) (66) in 200μL PBS. Mice were rechallenged with 1×10⁹ CFUs of wild-type Yersinia pseudotuberculosis YPIII (WT Yptb) or wild-type Yersinia enterocolitica (strain 8081, Yent).
T cell enrichment
Naïve Itgae-CreERT2 × Rosa26 LSL-tdTomato (iCD103-tdTomato) or Nur77-GFP YopE TCR transgenic cells were enriched from the spleen and lymph nodes by negative selection using a CD8α+ T cell isolation kit (Miltenyi) with the addition of biotinylated anti-CD44 antibody to deplete memory T cells (eBioscience).
Characterization of YopE T cells
For in vitro studies, naïve YopE T cells were isolated, labeled with 4μM CFSE and stimulated for 3 days with splenocytes pulsed with a range of YopE peptide concentrations. For tetramer pulldowns, CD45.1+ mice received 105 CD45.1/2+ naïve YopE T cells, and one day later spleen and all lymph nodes were isolated for tetramer enrichment as described (67). Briefly, T cells were labelled with YopE-tetramer-PE (NIH tetramer core) and isolated using anti-PE microbeads and a magnetic column (Miltenyi). Naïve YopE-specific T cells were identified as MHCII−B220−CD4−CD44−CD8β+tetramer+ cells. The number of naïve endogenous YopE-specific T cells identified in wild-type mice was consistent with previously published reports (68). For in vivo studies, CD45.1+ mice received 105 CD45.1/2+ marked naïve YopE T cells and infected with ΔyopM Yptb one day later. Tissues were harvested at 30 days post infection for analysis of transferred and endogenous YopE-specific T cells. Immunized mice with or without YopE T cells were rechallenged with 1×10⁹ CFUs of WT Yptb and their weight was determined every 2 days.
Fate mapping
CD45.1+ mice received 105 CD45.2+ iCD103-tdTomato YopE T cells the day before oral gavage with ΔyopM Yptb. Thirty days after infection, immune mice received tamoxifen in 100μL of corn oil (Sigma-Aldrich) at 75mg/kg of body weight by intraperitoneal injection for 4 consecutive days. Mice were left uninfected or rechallenged with WT Yptb the day after the last tamoxifen injection. Tissues were harvested from infected mice at 4 and 14 days post-secondary infection. To examine T cell proliferation in these mice, 0.5mg of EdU was administered intraperitoneally at 12 and 24 hours prior to tissue harvest. For labeling of endogenous T cells in naive iCD103-tdTomato mice, tamoxifen was administered in 100μL of corn oil (Sigma-Aldrich) at 75mg/kg of body weight by intraperitoneal injection for 4 consecutive days and tissues were harvested one day later.
T cell depletion
For circulating CD8 depletion experiments, mice received 10μg of anti-CD8α (2.43, BioXCell) or isotype control (anti-KLH, LTF-2, BioXCell) intraperitoneally one day prior to secondary infection. For long term CD8 depletion, antibodies were administered every 5 days for up to 2 weeks.
Nur77-GFP reporter
CD45.2+ mice received 105 CD45.1+ iCD103-tdTomato YopE T cells the day before oral gavage with ΔyopM Yptb. Thirty days after infection, mice were left uninfected or rechallenged with WT Yptb or Yent. Tissues were harvested from infected mice at 2 and 5 days post-secondary infection. For in vivo peptide stimulations, mice were administered 1–100μg of YopE peptide or vehicle control intraperitoneally one hour before harvest.
In vitro T cell activation and transfer
Splenocytes from iCD103-tdTomato or Nur77-GFP YopE TCR transgenic mice were stimulated with 1μM YopE peptide and supplemented with 20U/mL of IL-2 for 3 days at 37°C and 7% CO2. Histopaque-1083 (Sigma-Aldrich) was used for purification of viable cells, and 3×10⁶ in vitro activated YopE T cells were injected per mouse. At 17 to 50 days post transfer, immunized mice containing iCD103-tdTomato YopE T cells received tamoxifen in 100μL of corn oil (Sigma-Aldrich) at 75mg/kg of body weight by intraperitoneal injection for 4 consecutive days. Mice were rechallenged with WT Yptb or Yent and tissue was harvested at 4 days post-secondary infection.
Non-specific recruitment of memory T cells
CD45.1+ mice received naïve CD45.2+ YopE T cells before oral gavage with ΔyopM Yptb. At 30 days post-infection, immune mice were given 2×10⁶ CD45.2+ CD44hi polyclonal T cells labelled with 4μM Cell Trace Violet (CTV+, Thermo Fisher Scientific). One day later, mice were infected with WT Yptb, and tissues were harvested at day 4 post infection for analysis.
Isolation of Cells
To discriminate between intravascular circulating CD8+ T cells and tissue-resident CD8+ T cells, 3μg of anti-CD8α-APC, -PE, or -AF700 was administered intravenously 10 minutes before mice were sacrificed. For isolation of intestinal epithelium and lamina propria cells, Peyer’s patches were removed, the intestine was cut open longitudinally, and intestinal contents and mucus were removed by gentle scraping. The intestine was cut into 1 cm pieces and incubated in HBSS buffer containing 1 mM dithiothreitol and 10% FBS at 37°C with stirring for 20 min to isolate IELs. Intestinal tissue was transferred to HBSS containing 1.3 mM EDTA and stirred at 37°C for 20 min to remove the epithelium. Intestinal pieces were then incubated in HBSS containing 5% FBS and 150 U/ml collagenase type 2 (Worthington Biochemical) at 37 °C with stirring for 45–60 minutes to isolate lamina propria cells. IEL and lamina propria cells were further purified by gradient centrifugation with 44% and 67% Percoll. For isolation of liver lymphocytes, the gall bladder was removed, and the liver was homogenized and incubated with 50mg Collagenase Type B (Worthington Biochemical) and 2.9mg DNAse (Roche) in RPMI with 10% FBS at 37°C for 45 mins with vortexing every 10–15 minutes. Liver lymphocytes were further purified by gradient centrifugation with 44% and 56% Percoll, and red blood cells were lysed prior to analysis. Spleen and MLN cells were isolated by mechanical disruption through a 100μm filter and red blood cells were lysed to generate single cell suspensions.
Flow Cytometry
Single cell suspensions were blocked for non-specific staining using anti-Fc receptor (2.4G2; BioXCell) and surface markers were stained with the following antibodies: CD8β (H35–17.2), CD45.1 (A20), CD45.2 (104), CD69 (H1.2F3), CD103 (M290), CD8α (53–6.7) (from Thermo Fisher Scientific) and LIVE/DEAD Fixable Near-IR stain (Thermo Fisher Scientific). For intracellular staining, cells were fixed in 2% paraformaldehyde before permeabilization with the BD Cytofix/Cytoperm kit (BD Biosciences) and staining with the following antibodies: Granzyme A (3G8.5; Biolegend), TNFα (MP6-XT22), Vimentin (PA5–27231), Transgelin-2 (10234–2-AP), IFNγ (XMG1.2), IL-2 (JES6–5H4) and anti-rabbit-AF647 (A-21244) (all from Thermo Fisher Scientific). To measure EdU incorporation, cells were stained for surface markers and fixed in 2% paraformaldehyde before permeabilization and EdU staining as detailed in the Click-iT EdU Flow Cytometry Assay Kit protocol (Thermo Fisher Scientific). For in vitro peptide stimulations, cells were stimulated with 0.1μM YopE peptide for 0.5–4 hours in the presence of GolgiStop (BD Biosciences)..Cells were analyzed on a FACS LSRFortessa X-20 (BD Biosciences) or an Attune Nxt (Thermo Fisher Scientific) flow cytometer and analyzed with FlowJo software (BD Biosciences).
Immunofluorescence staining and microscopy
Ileum was harvested, fixed in 2% paraformaldehyde (Electron Microscopy Services), rehydrated in 20% sucrose in PBS, washed in PBS and flash frozen in OCT media (Sakura Finetek). Tissue sections were cut at a thickness of 7–8μm and fixed in ice cold acetone before storage at −80°C. Tissue sections were treated with avidin-biotin blocking reagents (Vector Laboratories) and stained with the following reagents: anti-CD45.2-biotin (104) from BioLegend; rabbit anti-RFP (42896, Rockland Immunochemicals); anti-CD4 (RM4–5) from BD Biosciences; and anti-CD11c (N418), anti-CD11b (M1/70), Streptavidin-AF647 and -AF488, anti-rabbit-AF555 (A27039), and 1μg/mL DAPI (Thermo Fisher Scientific), and mounted with Prolong Gold antifade reagent (Thermo Fisher Scientific). Stained slides were imaged using a Keyence fluorescence BZ-X series microscope or a Nikon A1R spectral confocal microscope and analyzed using Adobe Photoshop software. For enumeration of cells in tissue, at least 5 different tissue sections/mouse were imaged and >300 cells were counted in control mice and >750 cells for infected mice. Area of the tissue was determined using Adobe photoshop software and the number of cells per cm2 was calculated. For CD11c-T cell interactions, any region of contact between CD45.2+ and CD11c+ cells was scored as positive.
RNA-sequencing and analysis
YopE TCR transgenic Trm cells were sorted from the lamina propria at greater than 30 days post primary infection with ΔyopM Yptb or 4 days after secondary infection with WT Yptb, and sequenced samples were from individual mice. To discriminate between intravascular circulating CD8+ T cells and tissue resident T cells, 3μg of anti-CD8α-APC was administered intravenously 10 minutes before mice were sacrificed. Live CD8α−CD8β+CD45.1−CD45.2+CD69+CD103+tdTomato+ and CD103−tdTomato− LP Trm cells were sorted using a FACSAriaII (BD Biosciences). RNA was extracted from our sorted cells via Trizol (T9424, Sigma-Aldrich) using the Arcturus PicoPure RNA Isolation kit. RNA sequencing was performed with assisted analysis from the Rutgers Molecular Resource Facility/Genomics Core. The quality of RNA first checked for integrity on an Agilent TapeStation using high sensitivity RNA kit (Agilent Technologies). Samples with RNA integrity number (RIN) >7.0 were considered to have sufficient quality for subsequent processing. Illumina compatible cDNA libraries generated for polyA enriched mRNA using NEBNext low input protocol (New England Biolabs). The cDNA libraries were purified using AmpureXP beads (Beckman Coulter) and analyzed on an Agilent Bioanalyzer (Agilent technologies Inc, CA) to estimate the size of the library and quantitated using Qubit 4 Fluorometer (Thermo Fisher Scientific). Equimolar amounts of barcoded libraries pooled together and sequenced on Illumina NovaSeq 6000 Instrument (Illumina, San Diego, CA) using SP flow cells with 1×100 cycles configuration.
Raw transcriptome reads were assessed for quality control (FASTQC v0.11.8) and trimmed for quality and adapter contaminant (Cutadapt v 2.5). Trimmed reads were aligned to the mouse genome (GRCm38) using STAR (v2.6.1), followed by transcript abundance calculation and hit count extraction with StringTie (v2.0) and featureCounts (v1.6.4) respectively. Hit count normalization and differential gene expression group cross-comparisons were performed using DESeq2 (v1.26.0). Z score analysis was used to identify potential outliers, and none were found. Significant differentially expressed gene thresholds were set at FDR adjusted P<0.05. Genes were excluded if the average expression level was <10 hit counts or 0 hit counts in greater than 50% of the samples being compared. Gene ontology analysis was performed using Metascape (69). GSEA was done using selected Hallmark gene sets and previously identified Tcirc signature (38, 39), and gene sets with FDR q-value less that 0.05 are shown.
Statistical Analysis
Statistical significance was determined with GraphPad Prism software using a paired/unpaired two-tailed Student’s t-test or one-way ANOVA. P values less than 0.5 were considered significant. Corrections for multiple tests were performed with Tukey or Bonferroni tests as appropriate.
Supplementary Material
Acknowledgements:
We thank Dr. Derek Sant’Angelo for reagents and assistance generating TCR transgenic mice. Products in support of the research were generated by Rutgers Cancer Institute of New Jersey (Genome Editing) Shared Resource P30CA072720-5922 with the assistance of Dr. Peter Romanienko. Flow cytometry and cell sorting was performed in the Rutgers NJMS Flow Cytometry Core with the assistance of Dr. Sukhwinder Singh and Tammy Mui-Galenkamp. Luke Fritzky in the Rutgers Cellular Imaging and Histology Core provided protocols and assistance with microscopy.
Funding:
This work was supported by the Feldstein Medical Foundation Grant, New Jersey Consortium on Cancer Research Bridge Grant, and National Institutes of Health (NIH) grants R01AI153096 and R21AI148900 (to T.B., H.Y.F., M.T.).
Footnotes
Competing interests: None
Data and materials availability:
Raw and analyzed RNAseq data have been uploaded to the Genome Expression Omnibus with accession GSE185541. All mice are commercially available or available under a material transfer agreement. Direct requests to the corresponding author (Tessa Bergsbaken, t.bergsbaken@rutgers.edu.).
References and Notes:
- 1.Masopust D, Soerens AG, Tissue-Resident T Cells and Other Resident Leukocytes. Annu Rev Immunol. 37, 1–26 (2019). [DOI] [PMC free article] [PubMed] [Google Scholar]
- 2.Mueller SN, Mackay LK, Tissue-resident memory T cells: local specialists in immune defence. Nat Rev Immunol. 16, 79–89 (2016). [DOI] [PubMed] [Google Scholar]
- 3.Iijima N, Iwasaki A, A local macrophage chemokine network sustains protective tissue-resident memory CD4 T cells. Science. 346, 93–98 (2014). [DOI] [PMC free article] [PubMed] [Google Scholar]
- 4.Jiang X, Clark RA, Liu L, Wagers AJ, Fuhlbrigge RC, Kupper TS, Skin infection generates non-migratory memory CD8+ TRM cells providing global skin immunity. Nature. 483, 227–231 (2012). [DOI] [PMC free article] [PubMed] [Google Scholar]
- 5.Gebhardt T, Wakim LM, Eidsmo L, Reading PC, Heath WR, Carbone FR, Memory T cells in nonlymphoid tissue that provide enhanced local immunity during infection with herpes simplex virus. Nat Immunol. 10, 524–530 (2009). [DOI] [PubMed] [Google Scholar]
- 6.Park SL, Zaid A, Hor JL, Christo SN, Prier JE, Davies B, Alexandre YO, Gregory JL, Russell TA, Gebhardt T, Carbone FR, Tscharke DC, Heath WR, Mueller SN, Mackay LK, Local proliferation maintains a stable pool of tissue-resident memory T cells after antiviral recall responses. Nat Immunol. 19, 183–191 (2018). [DOI] [PubMed] [Google Scholar]
- 7.Steinbach K, Vincenti I, Kreutzfeldt M, Page N, Muschaweckh A, Wagner I, Drexler I, Pinschewer D, Korn T, Merkler D, Brain-resident memory T cells represent an autonomous cytotoxic barrier to viral infection. J Exp Med. 213, 1571–1587 (2016). [DOI] [PMC free article] [PubMed] [Google Scholar]
- 8.Schenkel JM, Fraser KA, Beura LK, Pauken KE, Vezys V, Masopust D, Resident memory CD8 T cells trigger protective innate and adaptive immune responses. Science. 346, 98–101 (2014). [DOI] [PMC free article] [PubMed] [Google Scholar]
- 9.Ariotti S, Hogenbirk MA, Dijkgraaf FE, Visser LL, Hoekstra ME, Song J-Y, Jacobs H, Haanen JB, Schumacher TN, Skin-resident memory CD8+ T cells trigger a state of tissue-wide pathogen alert. Science. 346, 101–105 (2014). [DOI] [PubMed] [Google Scholar]
- 10.Iijima N, Iwasaki A, Access of protective antiviral antibody to neuronal tissues requires CD4 T-cell help. Nature. 533, 552–556 (2016). [DOI] [PMC free article] [PubMed] [Google Scholar]
- 11.Oh JE, Iijima N, Song E, Lu P, Klein J, Jiang R, Kleinstein SH, Iwasaki A, Migrant memory B cells secrete luminal antibody in the vagina. Nature. 571, 122–126 (2019). [DOI] [PMC free article] [PubMed] [Google Scholar]
- 12.Han S-J, Zaretsky AG, Andrade-Oliveira V, Collins N, Dzutsev A, Shaik J, da Fonseca DM, Harrison OJ, Tamoutounour S, Byrd AL, Smelkinson M, Bouladoux N, Bliska JB, Brenchley JM, Brodsky IE, Belkaid Y, White Adipose Tissue Is a Reservoir for Memory T Cells and Promotes Protective Memory Responses to Infection. Immunity. 47, 1154–1168.e6 (2017). [DOI] [PMC free article] [PubMed] [Google Scholar]
- 13.Ge C, Monk IR, Pizzolla A, Wang N, Bedford JG, Stinear TP, Westall GP, Wakim LM, Bystander Activation of Pulmonary Trm Cells Attenuates the Severity of Bacterial Pneumonia by Enhancing Neutrophil Recruitment. Cell Reports. 29, 4236–4244.e3 (2019). [DOI] [PubMed] [Google Scholar]
- 14.Beura LK, Mitchell JS, Thompson EA, Schenkel JM, Mohammed J, Wijeyesinghe S, Fonseca R, Burbach BJ, Hickman HD, Vezys V, Fife BT, Masopust D, Intravital mucosal imaging of CD8+ resident memory T cells shows tissue-autonomous recall responses that amplify secondary memory. Nat Immunol. 19, 173–182 (2018). [DOI] [PMC free article] [PubMed] [Google Scholar]
- 15.Behr FM, Beumer‐Chuwonpad A, Kragten NAM, Wesselink TH, Stark R, Gisbergen KPJM, Circulating memory CD8+ T cells are limited in forming CD103+ tissue‐resident memory T cells at mucosal sites after reinfection. Eur J Immunol. 51, 151–166 (2021). [DOI] [PubMed] [Google Scholar]
- 16.Fonseca R, Beura LK, Quarnstrom CF, Ghoneim HE, Fan Y, Zebley CC, Scott MC, Fares-Frederickson NJ, Wijeyesinghe S, Thompson EA, da Silva HB, Vezys V, Youngblood B, Masopust D, Developmental plasticity allows outside-in immune responses by resident memory T cells. Nat Immunol. 21, 412–421 (2020). [DOI] [PMC free article] [PubMed] [Google Scholar]
- 17.Beura LK, Wijeyesinghe S, Thompson EA, Macchietto MG, Rosato PC, Pierson MJ, Schenkel JM, Mitchell JS, Vezys V, Fife BT, Shen S, Masopust D, T Cells in Nonlymphoid Tissues Give Rise to Lymph-Node-Resident Memory T Cells. Immunity. 48, 327–338.e5 (2018). [DOI] [PMC free article] [PubMed] [Google Scholar]
- 18.Stolley JM, Johnston TS, Soerens AG, Beura LK, Rosato PC, Joag V, Wijeyesinghe SP, Langlois RA, Osum KC, Mitchell JS, Masopust D, Retrograde migration supplies resident memory T cells to lung-draining LN after influenza infection. J Exp Med. 217, e20192197 (2020). [DOI] [PMC free article] [PubMed] [Google Scholar]
- 19.Christo SN, Evrard M, Park SL, Gandolfo LC, Burn TN, Fonseca R, Newman DM, Alexandre YO, Collins N, Zamudio NM, Souza-Fonseca-Guimaraes F, Pellicci DG, Chisanga D, Shi W, Bartholin L, Belz GT, Huntington ND, Lucas A, Lucas M, Mueller SN, Heath WR, Ginhoux F, Speed TP, Carbone FR, Kallies A, Mackay LK, Discrete tissue microenvironments instruct diversity in resident memory T cell function and plasticity. Nat Immunol. 22, 1140–1151 (2021). [DOI] [PubMed] [Google Scholar]
- 20.Thompson EA, Mitchell JS, Beura LK, Torres DJ, Mrass P, Pierson MJ, Cannon JL, Masopust D, Fife BT, Vezys V, Interstitial Migration of CD8αβ T Cells in the Small Intestine Is Dynamic and Is Dictated by Environmental Cues. Cell Reports. 26, 2859–2867.e4 (2019). [DOI] [PMC free article] [PubMed] [Google Scholar]
- 21.Sheridan BS, Pham Q-M, Lee Y-T, Cauley LS, Puddington L, Lefrançois L, Oral Infection Drives a Distinct Population of Intestinal Resident Memory CD8+ T Cells with Enhanced Protective Function. Immunity. 40, 747–757 (2014). [DOI] [PMC free article] [PubMed] [Google Scholar]
- 22.FitzPatrick MEB, Provine NM, Garner LC, Powell K, Amini A, Irwin SL, Ferry H, Ambrose T, Friend P, Vrakas G, Reddy S, Soilleux E, Klenerman P, Allan PJ, Human intestinal tissue-resident memory T cells comprise transcriptionally and functionally distinct subsets. Cell Reports. 34, 108661 (2021). [DOI] [PMC free article] [PubMed] [Google Scholar]
- 23.Wakim LM, Woodward-Davis A, Liu R, Hu Y, Villadangos J, Smyth G, Bevan MJ, The Molecular Signature of Tissue Resident Memory CD8 T Cells Isolated from the Brain. J Immunol. 189, 3462–3471 (2012). [DOI] [PMC free article] [PubMed] [Google Scholar]
- 24.Bergsbaken T, Bevan MJ, Fink PJ, Local Inflammatory Cues Regulate Differentiation and Persistence of CD8+ Tissue-Resident Memory T Cells. Cell Reports. 19, 114–124 (2017). [DOI] [PMC free article] [PubMed] [Google Scholar]
- 25.Bergsbaken T, Bevan MJ, Proinflammatory microenvironments within the intestine regulate the differentiation of tissue-resident CD8+ T cells responding to infection. Nat Immunol. 16, 406–414 (2015). [DOI] [PMC free article] [PubMed] [Google Scholar]
- 26.Paik DH, Farber DL, Influenza infection fortifies local lymph nodes to promote lung-resident heterosubtypic immunity. J Exp Med. 218, e20200218 (2020). [DOI] [PMC free article] [PubMed] [Google Scholar]
- 27.Milner JJ, Toma C, He Z, Kurd NS, Nguyen QP, McDonald B, Quezada L, Widjaja CE, Witherden DA, Crowl JT, Shaw LA, Yeo GW, Chang JT, Omilusik KD, Goldrath AW, Heterogenous Populations of Tissue-Resident CD8+ T Cells Are Generated in Response to Infection and Malignancy. Immunity. 52, 808–824.e7 (2020). [DOI] [PMC free article] [PubMed] [Google Scholar]
- 28.Kurd NS, He Z, Louis TL, Milner JJ, Omilusik KD, Jin W, Tsai MS, Widjaja CE, Kanbar JN, Olvera JG, Tysl T, Quezada LK, Boland BS, Huang WJ, Murre C, Goldrath AW, Yeo GW, Chang JT, Early precursors and molecular determinants of tissue-resident memory CD8+ T lymphocytes revealed by single-cell RNA sequencing. Sci Immunol. 5, eaaz6894 (2020). [DOI] [PMC free article] [PubMed] [Google Scholar]
- 29.Mani V, Bromley SK, Äijö T, Mora-Buch R, Carrizosa E, Warner RD, Hamze M, Sen DR, Chasse AY, Lorant A, Griffith JW, Rahimi RA, McEntee CP, Jeffrey KL, Marangoni F, Travis MA, Lacy-Hulbert A, Luster AD, Mempel TR, Migratory DCs activate TGF-β to precondition naïve CD8+ T cells for tissue-resident memory fate. Science. 366, eaav5728 (2019). [DOI] [PMC free article] [PubMed] [Google Scholar]
- 30.Behr FM, Parga-Vidal L, Kragten NAM, van Dam TJP, Wesselink TH, Sheridan BS, Arens R, van Lier RAW, Stark R, van Gisbergen KPJM, Tissue-resident memory CD8+ T cells shape local and systemic secondary T cell responses. Nat Immunol. 21, 1070–1081 (2020). [DOI] [PubMed] [Google Scholar]
- 31.Masopust D, Vezys V, Wherry EJ, Barber DL, Ahmed R, Cutting Edge: Gut Microenvironment Promotes Differentiation of a Unique Memory CD8 T Cell Population. J Immunol. 176, 2079–2083 (2006). [DOI] [PubMed] [Google Scholar]
- 32.Steinert EM, Schenkel JM, Fraser KA, Beura LK, Manlove LS, Igyártó BZ, Southern PJ, Masopust D, Quantifying Memory CD8 T Cells Reveals Regionalization of Immunosurveillance. Cell. 161, 737–749 (2015). [DOI] [PMC free article] [PubMed] [Google Scholar]
- 33.Bergsbaken T, Bevan MJ, Proinflammatory microenvironments within the intestine regulate the differentiation of tissue-resident CD8+ T cells responding to infection. Nat Immunol. 16, 406–414 (2015). [DOI] [PMC free article] [PubMed] [Google Scholar]
- 34.Schenkel JM, Fraser KA, Vezys V, Masopust D, Sensing and alarm function of resident memory CD8+ T cells. Nat Immunol. 14, 509–513 (2013). [DOI] [PMC free article] [PubMed] [Google Scholar]
- 35.Moran AE, Holzapfel KL, Xing Y, Cunningham NR, Maltzman JS, Punt J, Hogquist KA, T cell receptor signal strength in Treg and iNKT cell development demonstrated by a novel fluorescent reporter mouse. J Exp Medicine. 208, 1279–1289 (2011). [DOI] [PMC free article] [PubMed] [Google Scholar]
- 36.Skon CN, Lee J-Y, Anderson KG, Masopust D, Hogquist KA, Jameson SC, Transcriptional downregulation of S1pr1 is required for the establishment of resident memory CD8+ T cells. Nat Immunol. 14, 1285–1293 (2013). [DOI] [PMC free article] [PubMed] [Google Scholar]
- 37.Lin J-S, Szaba FM, Kummer LW, Chromy BA, Smiley ST, Yersinia pestis YopE Contains a Dominant CD8 T Cell Epitope that Confers Protection in a Mouse Model of Pneumonic Plague. J Immunol. 187, 897–904 (2011). [DOI] [PMC free article] [PubMed] [Google Scholar]
- 38.Milner JJ, Toma C, Yu B, Zhang K, Omilusik K, Phan AT, Wang D, Getzler AJ, Nguyen T, Crotty S, Wang W, Pipkin ME, Goldrath AW, Runx3 programs CD8+ T cell residency in non-lymphoid tissues and tumours. Nature. 552, 253–257 (2017). [DOI] [PMC free article] [PubMed] [Google Scholar]
- 39.Nath AP, Braun A, Ritchie SC, Carbone FR, Mackay LK, Gebhardt T, Inouye M, Comparative analysis reveals a role for TGF-β in shaping the residency-related transcriptional signature in tissue-resident memory CD8+ T cells. Plos One. 14, e0210495 (2019). [DOI] [PMC free article] [PubMed] [Google Scholar]
- 40.Pan Y, Tian T, Park CO, Lofftus SY, Mei S, Liu X, Luo C, O’Malley JT, Gehad A, Teague JE, Divito SJ, Fuhlbrigge R, Puigserver P, Krueger JG, Hotamisligil GS, Clark RA, Kupper TS, Survival of tissue-resident memory T cells requires exogenous lipid uptake and metabolism. Nature. 543, 252–256 (2017). [DOI] [PMC free article] [PubMed] [Google Scholar]
- 41.Na B-R, Kim H-R, Piragyte I, Oh H-M, Kwon M-S, Akber U, Lee H-S, Park D-S, Song WK, Park Z-Y, Im S-H, Rho M-C, Hyun Y-M, Kim M, Jun C-D, TAGLN2 regulates T cell activation by stabilizing the actin cytoskeleton at the immunological synapse. J Cell Biol. 209, 143–162 (2015). [DOI] [PMC free article] [PubMed] [Google Scholar]
- 42.Matza D, Badou A, Kobayashi KS, Goldsmith-Pestana K, Masuda Y, Komuro A, McMahon-Pratt D, Marchesi VT, Flavell RA, A Scaffold Protein, AHNAK1, Is Required for Calcium Signaling during T Cell Activation. Immunity. 28, 64–74 (2008). [DOI] [PMC free article] [PubMed] [Google Scholar]
- 43.Filbert EL, Borgne ML, Lin J, Heuser JE, Shaw AS, Stathmin Regulates Microtubule Dynamics and Microtubule Organizing Center Polarization in Activated T Cells. J Immunol. 188, 5421–5427 (2012). [DOI] [PMC free article] [PubMed] [Google Scholar]
- 44.González-Granado JM, Silvestre-Roig C, Rocha-Perugini V, Trigueros-Motos L, Cibrián D, Morlino G, Blanco-Berrocal M, Osorio FG, Freije JMP, López-Otín C, Sánchez-Madrid F, Andrés V, Nuclear Envelope Lamin-A Couples Actin Dynamics with Immunological Synapse Architecture and T Cell Activation. Sci Signal. 7, ra37–ra37 (2014). [DOI] [PMC free article] [PubMed] [Google Scholar]
- 45.Oliveira-dos-Santos AJ, Matsumoto G, Snow BE, Bai D, Houston FP, Whishaw IQ, Mariathasan S, Sasaki T, Wakeham A, Ohashi PS, Roder JC, Barnes CA, Siderovski DP, Penninger JM, Regulation of T cell activation, anxiety, and male aggression by RGS2. Proc National Acad Sci. 97, 12272–12277 (2000). [DOI] [PMC free article] [PubMed] [Google Scholar]
- 46.Gorska MM, Stafford SJ, Cen O, Sur S, Alam R, Unc119, a Novel Activator of Lck/Fyn, Is Essential for T Cell Activation. J Exp Medicine. 199, 369–379 (2004). [DOI] [PMC free article] [PubMed] [Google Scholar]
- 47.Sallusto F, Lenig D, Förster R, Lipp M, Lanzavecchia A, Two subsets of memory T lymphocytes with distinct homing potentials and effector functions. Nature. 401, 708–712 (1999). [DOI] [PubMed] [Google Scholar]
- 48.Wherry EJ, Teichgräber V, Becker TC, Masopust D, Kaech SM, Antia R, von Andrian UH, Ahmed R, Lineage relationship and protective immunity of memory CD8 T cell subsets. Nat Immunol. 4, 225–234 (2003). [DOI] [PubMed] [Google Scholar]
- 49.Kersh EN, Kaech SM, Onami TM, Moran M, Wherry EJ, Miceli MC, Ahmed R, TCR Signal Transduction in Antigen-Specific Memory CD8 T Cells. J Immunol. 170, 5455–5463 (2003). [DOI] [PubMed] [Google Scholar]
- 50.Kaech SM, Tan JT, Wherry EJ, Konieczny BT, Surh CD, Ahmed R, Selective expression of the interleukin 7 receptor identifies effector CD8 T cells that give rise to long-lived memory cells. Nat Immunol. 4, 1191–1198 (2003). [DOI] [PubMed] [Google Scholar]
- 51.Mathew D, Kremer KN, Strauch P, Tigyi G, Pelanda R, Torres RM, LPA5 Is an Inhibitory Receptor That Suppresses CD8 T-Cell Cytotoxic Function via Disruption of Early TCR Signaling. Front Immunol. 10, 1159 (2019). [DOI] [PMC free article] [PubMed] [Google Scholar]
- 52.Núñez-Andrade N, Iborra S, Trullo A, Moreno-Gonzalo O, Calvo E, Catalán E, Menasche G, Sancho D, Vázquez J, Yao T-P, Martín-Cófreces NB, Sánchez-Madrid F, HDAC6 regulates the dynamics of lytic granules in cytotoxic T lymphocytes. J Cell Sci. 129, 1305–1311 (2016). [DOI] [PMC free article] [PubMed] [Google Scholar]
- 53.Richer MJ, Nolz JC, Harty JT, Pathogen-Specific Inflammatory Milieux Tune the Antigen Sensitivity of CD8+ T Cells by Enhancing T Cell Receptor Signaling. Immunity. 38, 140–152 (2013). [DOI] [PMC free article] [PubMed] [Google Scholar]
- 54.Mackay LK, Rahimpour A, Ma JZ, Collins N, Stock AT, Hafon M-L, Vega-Ramos J, Lauzurica P, Mueller SN, Stefanovic T, Tscharke DC, Heath WR, Inouye M, Carbone FR, Gebhardt T, The developmental pathway for CD103+CD8+ tissue-resident memory T cells of skin. Nat Immunol. 14, 1294–1301 (2013). [DOI] [PubMed] [Google Scholar]
- 55.Zhang N, Bevan MJ, Transforming Growth Factor-β Signaling Controls the Formation and Maintenance of Gut-Resident Memory T Cells by Regulating Migration and Retention. Immunity. 39, 687–696 (2013). [DOI] [PMC free article] [PubMed] [Google Scholar]
- 56.Wakim LM, Woodward-Davis A, Bevan MJ, Memory T cells persisting within the brain after local infection show functional adaptations to their tissue of residence. Proc National Acad Sci. 107, 17872–17879 (2010). [DOI] [PMC free article] [PubMed] [Google Scholar]
- 57.Wakim LM, Waithman J, van Rooijen N, Heath WR, Carbone FR, Dendritic Cell-Induced Memory T Cell Activation in Nonlymphoid Tissues. Science. 319, 198–202 (2008). [DOI] [PubMed] [Google Scholar]
- 58.Shin H, Kumamoto Y, Gopinath S, Iwasaki A, CD301b+ dendritic cells stimulate tissue-resident memory CD8+ T cells to protect against genital HSV-2. Nat Commun. 7, 13346 (2016). [DOI] [PMC free article] [PubMed] [Google Scholar]
- 59.Low JS, Farsakoglu Y, Vesely MCA, Sefik E, Kelly JB, Harman CCD, Jackson R, Shyer JA, Jiang X, Cauley LS, Flavell RA, Kaech SM, Tissue-resident memory T cell reactivation by diverse antigen-presenting cells imparts distinct functional responses. J Exp Med. 217, e20192291 (2020). [DOI] [PMC free article] [PubMed] [Google Scholar]
- 60.Son YM, Cheon IS, Wu Y, Li C, Wang Z, Gao X, Chen Y, Takahashi Y, Fu Y-X, Dent AL, Kaplan MH, Taylor JJ, Cui W, Sun J, Tissue-resident CD4+ T helper cells assist the development of protective respiratory B and CD8+ T cell memory responses. Sci Immunol. 6, eabb6852 (2021). [DOI] [PMC free article] [PubMed] [Google Scholar]
- 61.Laidlaw BJ, Zhang N, Marshall HD, Staron MM, Guan T, Hu Y, Cauley LS, Craft J, Kaech SM, CD4+ T Cell Help Guides Formation of CD103+ Lung-Resident Memory CD8+ T Cells during Influenza Viral Infection. Immunity. 41, 633–645 (2014). [DOI] [PMC free article] [PubMed] [Google Scholar]
- 62.Wakim LM, Waithman J, van Rooijen N, Heath WR, Carbone FR, Dendritic Cell-Induced Memory T Cell Activation in Nonlymphoid Tissues. Science. 319, 198–202 (2008). [DOI] [PubMed] [Google Scholar]
- 63.von Hoesslin M, Kuhlmann M, de Almeida GP, Kanev K, Wurmser C, Gerullis AK, Roelli P, Berner J, Zehn D, Sci. Immunol 7, eabp9553 (2022). [DOI] [PubMed] [Google Scholar]
- 64.Sanderson S, Shastri N, LacZ inducible, antigen/MHC-specific T cell hybrids. Int Immunol 6, 369–376 (1994). [DOI] [PubMed] [Google Scholar]
- 65.Zhumabekov T, Corbella P, Tolaini M, Kioussis D, Improved version of a human CD2 minigene based vector for T cell-specific expression in transgenic mice. J Immunol Methods 185, 133–140 (1995). [DOI] [PubMed] [Google Scholar]
- 66.LaRock CN, Cookson BT, The Yersinia Virulence Effector YopM Binds Caspase-1 to Arrest Inflammasome Assembly and Processing. Cell Host Microbe. 12, 799–805 (2012). [DOI] [PMC free article] [PubMed] [Google Scholar]
- 67.Legoux FP, Moon JJ, Peptide:MHC Tetramer-based Enrichment of Epitope-specific T cells. J Vis Exp (2012).doi: 10.3791/4420 [DOI] [PMC free article] [PubMed] [Google Scholar]
- 68.Zhang Y, Qiu Z, Sheridan BS, Bliska JB, Precursor Abundance Influences Divergent Antigen-Specific CD8+ T Cell Responses after Yersinia pseudotuberculosis Foodborne Infection. Infect Immun 89, e00265–21 (2021). [DOI] [PMC free article] [PubMed] [Google Scholar]
- 69.Zhou Y, Zhou B, Pache L, Chang M, Khodabakhshi AH, Tanaseichuk O, Benner C, Chanda SK, Metascape provides a biologist-oriented resource for the analysis of systems-level datasets. Nat Commun. 10, 1523 (2019). [DOI] [PMC free article] [PubMed] [Google Scholar]
Associated Data
This section collects any data citations, data availability statements, or supplementary materials included in this article.
Supplementary Materials
Data Availability Statement
Raw and analyzed RNAseq data have been uploaded to the Genome Expression Omnibus with accession GSE185541. All mice are commercially available or available under a material transfer agreement. Direct requests to the corresponding author (Tessa Bergsbaken, t.bergsbaken@rutgers.edu.).