

Abstract
Background and Aim:
Growing evidence has linked gut microbiota with regulation of adiposity. We aimed to examine whether the genetically determined relative abundance of gut microbial taxa was associated with long-term changes in adiposity and body composition among individuals who were overweight or obese in weight-loss diet interventions.
Methods:
The study included 692 participants with overweight or obese from the POUNDS Lost trial. We created a genetic risk score (GRS) for the relevant abundance of gut microbial taxa using 20 single nucleotide polymorphisms identified from a recent genome-wide association study. Body composition was assessed using dual-energy X-ray absorptiometry.
Results:
Higher GRS for the relative abundance of gut microbial taxa was significantly associated with greater reductions in waist circumference, total fat mass (FM), whole-body total percentage of fat mass (FM%), and percentage of trunk fat (TF%) at 2 years (p=0.022, 0.034, 0.023, 0.023, respectively). In addition, dietary protein significantly modified the association between GRS for gut microbial abundance and changes in total FM, FM%, and TF% (p-interactions=0.04, 0.013, and 0.006, respectively) at 6-month, when the maximum weight loss was achieved, even though such interactions were attenuated at 2 years. In the average-protein diet group, a higher microbial abundance GRS was associated with greater reductions in total FM (p=0.007), FM% (p=0.002), and TF% (p<0.001) at 6 months, while no associations were found in the high-protein diet group (p>0.05).
Conclusion:
Our results suggest that the higher genetically determined relative abundance of gut microbial taxa may be related to long-term improvement of whole-body and central fatness and body composition in response to low-calorie diet interventions.
Keywords: Gut microbiome, central adiposity, body composition, diet intervention
Introduction
Emerging evidence has implicated gut microbiota in human energy metabolism and the development of obesity and its related metabolic conditions [1–6]. Microbiota abundance has been considered as a marker for the microbial imbalance in the gut [7,8]. For example, previous studies revealed that obesity was associated with an imbalanced taxa abundance of gut microbiota. Although there are some inconsistencies due to environmental factors[9], numerous studies have reported that individuals with obesity had a relatively higher abundance of Firmicutes [10–13], a phylum involved in harvesting dietary energy [13–17]. The abundance of other species has also been linked to obesity [9,18–20]. Indeed, compelling evidence has implicated gut microbiota metabolism in regulation of the energy balance and body fat storage and distribution [21–23].
Evidence has also shown that gut microbiota are partially determined by host genetic variations [24–27]. A recent large-scale, genome-wide meta-analysis identified several common genetic variants associated with the relative abundance of microbial taxa, offering valuable tools to examine the relationship between gut microbiota and adiposity at the genetic level [28]. Diet plays a pivotal role in shaping the composition of gut microbiota [29,30], and weight-loss was found to modulate the microbial abundance [11]. However, little is known about whether the genetically determined gut microbial abundance is associated with changes in adiposity and body composition in response to dietary weight-loss.
In the present study, we calculated a genetic risk score (GRS) for the relative abundance of gut microbial taxa based on the 20 distinct genetic loci identified from the recent gut microbiota GWAS [28]. We investigated the associations between the GRS for gut microbial taxa abundance and changes in central adiposity and body composition in response to a 2-year dietary intervention in the Preventing Overweight Using Novel Dietary Strategies (POUNDS Lost) trial [31]. We also tested the interaction between the GRS for the relative abundance of gut microbial taxa and diets varying in macronutrients on the changes in central adiposity and body composition.
Research Design and Methods
Study design and participants
The POUNDS Lost trial was a 2-year randomized clinical trial comparing the effects of 4 energy-reduced diets varying in macronutrient compositions of fat, protein, and carbohydrate on weight loss [31]. The study was conducted at two sites: the Harvard T.H. Chan School of Public Health and Brigham and Women’s Hospital (BWH) in Boston, MA, and the Pennington Biomedical Research Center (PBRC) of the Lousiana State University System in Baton Rouge, LA from October 2004 to December 2007. The primary outcome was the change in body weight after 2 years, and the secondary outcome was the change in waist circumference [31]. Briefly, 811 participants who were overweight or obese and aged 30–70 years old were randomly assigned to one of four diets. The target percentage of energy from fat, protein, and carbohydrate were: 1) 20%, 15%, and 65%; 2) 20%, 25%, and 55%; 3) 40%, 15%, and 45%; and 4) 40%, 25%, and 35%. Two diets were low-fat (20%), and the other two diets were high-fat (40%); two diets were average-protein (15%), and the other two diets were high-protein (25%), constituting a 2-by-2 factorial design. A random sample of ~50% of the total participants were selected to undergo the dual-energy X-ray absorptiometry (DEXA) scans for body composition. Among the 811 participants, 714 (88%) were followed up at 6 months, and a total of 645 participants (80%) completed the trial after 2 years. More details have been described elsewhere [31]. All participants provided written informed consent. The study was approved by the human subjects committee at each institution and by the data and safety monitoring board appointed by the National Heart, Lung, and Blood Institute.
In the current analysis, we included 692 participants (mean age 51 [SD 9] years) with genotyping data at baseline. Similar to the entire trial population, 84% of them were White and 61% were women. Waist circumference data were available for 622 participants at 6 months and 528 at 2 years. Of the 692 participants included, DEXA-measured body composition was available among 370 participants at baseline, 296 at 6 months, and 213 at 2 years.
Measurements
Body weight and waist circumference were measured in the morning before breakfast on two days at baseline, and at 6, 12, 18, and 24 months. Height was measured at the baseline examination. Body mass index (BMI) was calculated as weight in kilograms divided by the square of height in meters (kg/m2). DEXA scans were performed on a Hologic QDR 4500A bone densitometer (Hologic Inc) after an overnight fast at baseline, 6 months, and 2 years [32]. Total fat mass (FM), total fat-free mass (FFM), whole-body total percentage of fat mass (FM%), and percentage of trunk fat (TF%) were measured with participants in the supine position wearing a hospital gown. To evaluate the adherence to assigned diets, dietary intake was assessed in a random sample of 50% of the total participant by a 5-day diet record at baseline and by 24-h dietary recall on 3 nonconsecutive days at 6 months and 2 years. Biomarkers of nutrient intake were used to validate the self-reported adherence to macronutrient targets as follows: urinary nitrogen excretion for protein and respiratory quotient for fat [31].
Genotyping and genetic risk score calculation
Blood samples were collected in a fasting state and stored at −80℃. DNA was extracted from the buffy coat fraction of centrifuged blood using the QIAamp Blood Kit (Qiagen). Study samples were genotyped and analyzed using an Illumina Infinium OmniExpress-24 kit (Illumina, San Diego, CA). Imputation was conducted by Michigan Imputation Server (https://imputationserver.sph.umich.edu/index.html) on chromosomes 1 to 22 in 583 Whites and 109 Blacks, using 1000G Phase 3 v5 as the reference panel. The genotype success rate was 99%. Replicated quality control samples (10%) were included and had a greater than 99% concordance [33]. The genotype frequencies in all participants or White participants were in Hardy-Weinberg equilibrium (p>0.05).
A total of 20 independent single nucleotide polymorphisms (SNPs) associated with the relevant abundance of gut microbial taxa were identified from a recent large-scale, multi-ancestry, genome-wide meta-analysis of the associations between autosomal human genetic variants and the gut microbiome [28]. We created the GRS using the 20 SNPs to represent the overall genetic variation of the relevant abundance of gut microbial taxa. The GRS was calculated by summing the number of risk alleles and weighted by the corresponding effect size (β-coefficients) derived from the genome-wide association meta-analysis (Supplemental Table 1), which has been widely used and validated in previous studies.[34–36] The following equation was applied: GRS= (β1×SNP1+ β2×SNP2+…+ β20×SNP20) × (20/sum of the β-coefficients). Each point of the weighted GRS corresponds to 1 risk allele. The GRS for the relevant abundance of gut microbial taxa ranges from 9.0 to 25.4 in the current analysis. A higher score indicates a higher genetically determined gut microbial abundance.
Statistical analysis
The primary outcomes include central adiposity represented by waist circumference and body composition measured by DEXA (FM, FFM, FM%, and TF%). General linear models for continuous variables and Chi-square tests for categorical variables were performed to compare the difference in baseline characteristics across the tertile categories of the GRS for the relevant abundance of gut microbial taxa. General linear regression models were applied to test the association between the GRS and changes in central adiposity and body composition across 2 years, after adjustment for age, race, sex, diet intervention group, and baseline values of respective outcome traits (model 1). We further adjusted for baseline BMI in model 2. Because dietary fiber plays an important role in the regulation of gut microbiota composition and a subsequent impact on host metabolism [37], we additionally adjusted for dietary fiber intake in model 3. To test potential gene-diet interactions, a GRS-diet group product term was included in the above models. Given that 14 out of the 20 SNPs were related to species that belong to the Firmicutes phylum, we also created a Firmicutes-specific abundance GRS and tested its main association with adiposity and body composition, as well as the interaction with dietary fat intake in the sensitivity analyses. We used linear mixed models with variance component structure to test the genotype effect on the trajectory of changes in the outcomes according to diet by including a time × GRS interaction term. We restricted the analysis to the White population in the sensitivity analysis to test the robustness. All statistical analyses were performed using SAS version 9.4 (SAS Institute). All p-values were 2-sided, and a p-value < 0.05 was considered statistically significant.
Results
Baseline characteristics of the study participants according to the tertile categories of the GRS for the relative abundance of gut microbial taxa are shown in Table 1. There was no significant difference in age, BMI, body weight, waist circumference, body composition, or body fat distribution across the tertiles of the gut microbial abundance GRS at baseline. Dietary intakes of macronutrients and biomarkers of adherence were not related to the GRS. Participants with higher genetically determined gut microbial abundance (high GRS) were more likely to be female and less likely to be White. The mean (SD) weight loss of the study population was also similar to that of the entire POUNDS Lost trial participants: −6.5 (5.7) kg at 6 months, and −4.0 (7.4) kg at 2 years.
Table 1.
Baseline characteristics of the POUNDS Lost participants according to tertiles of gut microbiome abundance genetic risk score
| T1 N=230 |
T2 N=231 |
T3 N=231 |
p-value | |
|---|---|---|---|---|
| Age | 51.9 (9.1) | 51.9 (8.4) | 50.5 (9.5) | 0.81 |
| Female, % | 127 (55.2) | 143 (61.9) | 153 (66.2) | 0.05 |
| White, % | 224 (97.4) | 206 (89.2) | 153 (66.2) | <.001 |
| BMI | 32.7 (4) | 32.3 (3.9) | 33.2 (3.8) | 0.15 |
| Body weight | 95 (16.8) | 91.8 (15.3) | 93.8 (14.3) | 0.14 |
| Waist circumference | 105 (13.6) | 102.6 (13) | 103.8 (12.6) | 0.24 |
| Physical activity score* | 1.6 (0.1) | 1.6 (0.1) | 1.6 (0.1) | 0.99 |
| Current smoker | 9 (3.9) | 11 (4.8) | 8 (3.5) | 0.37 |
| Diet groups | ||||
| High fat diet, % | 124 (53.9) | 118 (51.1) | 106 (45.9) | 0.22 |
| High protein diet, % | 110 (47.8) | 108 (46.8) | 124 (53.4) | 0.28 |
| Body composition | ||||
| FM, kg | 34.7 (7.9) | 34.9 (8.5) | 35.9 (7.6) | 0.79 |
| FM % | 36.1 (6.7) | 37.1 (7.2) | 37.8 (6.7) | 0.39 |
| FFM | 62.0 (13.9) | 59.5 (12.7) | 59.7 (12.3) | 0.33 |
| TF % | 37.5 (6.1) | 37.8 (6.2) | 38.7 (6.1) | 0.52 |
| Body fat distribution | ||||
| VAT | 5.8 (2.7) | 4.9 (2.2) | 5.7 (2.6) | 0.52 |
| SAT | 11.1 (2.9) | 10.8 (2.3) | 11.5 (2.8) | 0.28 |
| dSAT | 6.0 (2.0) | 5.5 (1.2) | 5.9 (1.8) | 0.42 |
| TAT | 16.9 (4.6) | 15.8 (3.4) | 17.3 (3.8) | 0.24 |
| Dietary intake per day | ||||
| Energy, kcal | 2022.3 (541.6) | 1940.5 (552.1) | 1883.7 (549) | 0.77 |
| Protein, % | 44.7 (7.1) | 44.4 (7.8) | 44.8 (8) | 0.24 |
| Fat, % | 36.6 (5.2) | 36.8 (6.3) | 37.5 (6.4) | 0.22 |
| Carbohydrate, % | 18 (3.2) | 18.6 (3.7) | 18 (3.3) | 0.70 |
| Alcohol, g | 7.0 (9.2) | 5.8 (8.0) | 4.5 (11.0) | 0.46 |
| Biomarkers of adherence | ||||
| Respiratory quotient | 0.84 (0.04) | 0.84 (0.04) | 0.84 (0.04) | 0.56 |
| Urinary nitrogen (mg/day) | 12.7 (4.6) | 11.8 (3.8) | 12.0 (4.9) | 0.19 |
Data are mean (SD) or N (%); p-values were adjusted for age, race, and sex.
Physical activity score was estimated by the Baecke questionnaire.
Data on body composition are available for 130, 119, and 121 participants in T1, T2, and T3, respectively.
Data on body fat distribution are available for 64, 52, and 52 participants in T1, T2, and T3, respectively.
Data on dietary intake are available for 124, 119, and 121 participants in T1, T2, and T3, respectively.
The nutrient intake and biomarkers of adherence are shown in Table 2. In accordance with the entire POUNDS Lost trial, the reported dietary intakes of total energy, macronutrient intake, and biomarkers of adherence (urinary nitrogen and respiratory quotient) confirmed that participants adjusted their diets in the direction of the diet intervention, although the dietary targets were not fully achieved [31]. There was no significant difference in nutrient intakes or biomarkers of adherence across the tertiles of the gut microbial abundance GRS at 6 months or 2 years (all p-values >0.05; Table 2).
Table 2.
Nutrient intake and biomarkers of adherence according to tertiles of gut microbiome abundance GRS during the intervention
| At 6 months | At 24 months | |||||||
|---|---|---|---|---|---|---|---|---|
| T1 | T2 | T3 | p | T1 | T2 | T3 | p | |
| Dietary intake per daya | ||||||||
| Energy, kcal | 1666 (491) | 1552 (459) | 1622 (594) | 0.20 | 1529 (514) | 1589 (461) | 1452 (474) | 0.74 |
| Carbohydrate, % | 48.9 (9.7) | 50.2 (10.6) | 52.4 (10.5) | 0.20 | 48 (9.4) | 47.8 (9.4) | 52.1 (12.1) | 0.18 |
| Fat, % | 30.9 (8.2) | 30.7 (8.1) | 29.1 (8.4) | 0.46 | 31.6 (8.9) | 31.1 (8) | 29.6 (9) | 0.58 |
| Protein, % | 20.3 (4.3) | 19.8 (4.3) | 20.2 (5.2) | 0.74 | 20.1 (4.5) | 21.1 (4.2) | 19.5 (5.1) | 0.27 |
| Biomarkers of adherence | ||||||||
| Urinary nitrogenb | 11.7 (4.2) | 11.2 (4.7) | 11.7 (4.8) | 0.51 | 12.1 (4.8) | 11.6 (4.2) | 11.9 (4.5) | 0.67 |
| Respiratory quotientc | 0.84 (0.04) | 0.84 (0.05) | 0.84 (0.04) | 0.67 | 0.83 (0.04) | 0.84 (0.04) | 0.83 (0.04) | 0.25 |
Data are mean (SD).
P value was calculated by an F test after adjusting for age, race, and sex.
Sample size at 6 months: T1, n = 113; T2, n = 106; T3, n = 98. Sample size at 2 years: T1, n = 56; T2, n = 54; T3, n = 53.
Sample size at 6 months: T1, n = 173; T2, n = 174; T3, n = 165. Sample size at 2 years: T1, n = 116; T2, n = 123; T3, n = 117.
Sample size at 6 months: T1, n = 190; T2, n = 186; T3, n = 187. Sample size at 2 years: T1, n = 147; T2, n = 155; T3, n = 138.
We found that a higher GRS for gut microbial abundance was associated with greater reductions in waist circumference, FM, FM%, FFM, and TF% at 2 years (Table 3). After adjustment for age, race, sex, diet interventions, BMI at baseline, and variable of interest at baseline, each score increase in the gut microbial abundance GRS was associated with reductions in waist circumference (β [SE] −0.31 [0.13], p=0.021), FM (β [SE] −0.32 [0.15], p=0.03), FM% (β [SE] −0.21 [0.09], p=0.02), and TF% (β [SE] −0.27 [0.12], p=0.02) at 2 years (Table 3, model 2). Further adjustment for dietary fiber intake at baseline did not change the relationship materially (Table 3, model 3, and Figure 1). When the analyses were performed among White participants only, the associations between the gut microbiome abundance GRS and changes in adiposity traits remain robust, with even stronger magnitudes observed (Supplementary Table 2). Sensitivity analyses using the Firmicutes-specific abundance GRS showed similar associations with body composition (Supplementary Table 3).
Table 3.
Associations between gut microbiome abundance genetic risk score and changes in adiposity measurements at 2 years of diet intervention.
| Model 1 | Model 2 | Model 3 | ||||
|---|---|---|---|---|---|---|
| β (SE) | P-value | β (SE) | p-value | β (SE) | p-value | |
| ΔBody weight, kg | −0.20 (0.12) | 0.10 | −0.19 (0.12) | 0.11 | −0.21 (0.12) | 0.08 |
| ΔWC, cm | −0.31 (0.13) | 0.018 | −0.31 (0.13) | 0.021 | −0.31 (0.13) | 0.017 |
| ΔFM, kg | −0.33 (0.15) | 0.027 | −0.32 (0.15) | 0.03 | −0.33 (0.15) | 0.027 |
| ΔFM% | −0.22 (0.09) | 0.016 | −0.21 (0.09) | 0.02 | −0.22 (0.09) | 0.017 |
| ΔFFM, kg | −0.06 (0.08) | 0.41 | −0.06 (0.08) | 0.45 | −0.07 (0.08) | 0.36 |
| ΔTF% | −0.28 (0.12) | 0.016 | −0.27 (0.12) | 0.02 | 0.22 (0.09) | 0.017 |
β represents changes in outcomes for 1 score increase in the gut microbial abundance GRS. Model 1 was adjusted for age, race, sex, diet interventions, and variables of interest at baseline.
Model 2: model 1 + BMI at baseline.
Model 3: model 2 + dietary fiber intake, alcohol intake, smoking status, and physical activity. WC, waist circumference, FM, fat mass; FM%, whole body total percentage of fat mass; FFM, total fat-free mass; TF%, percentage of trunk fat.
Figure 1.
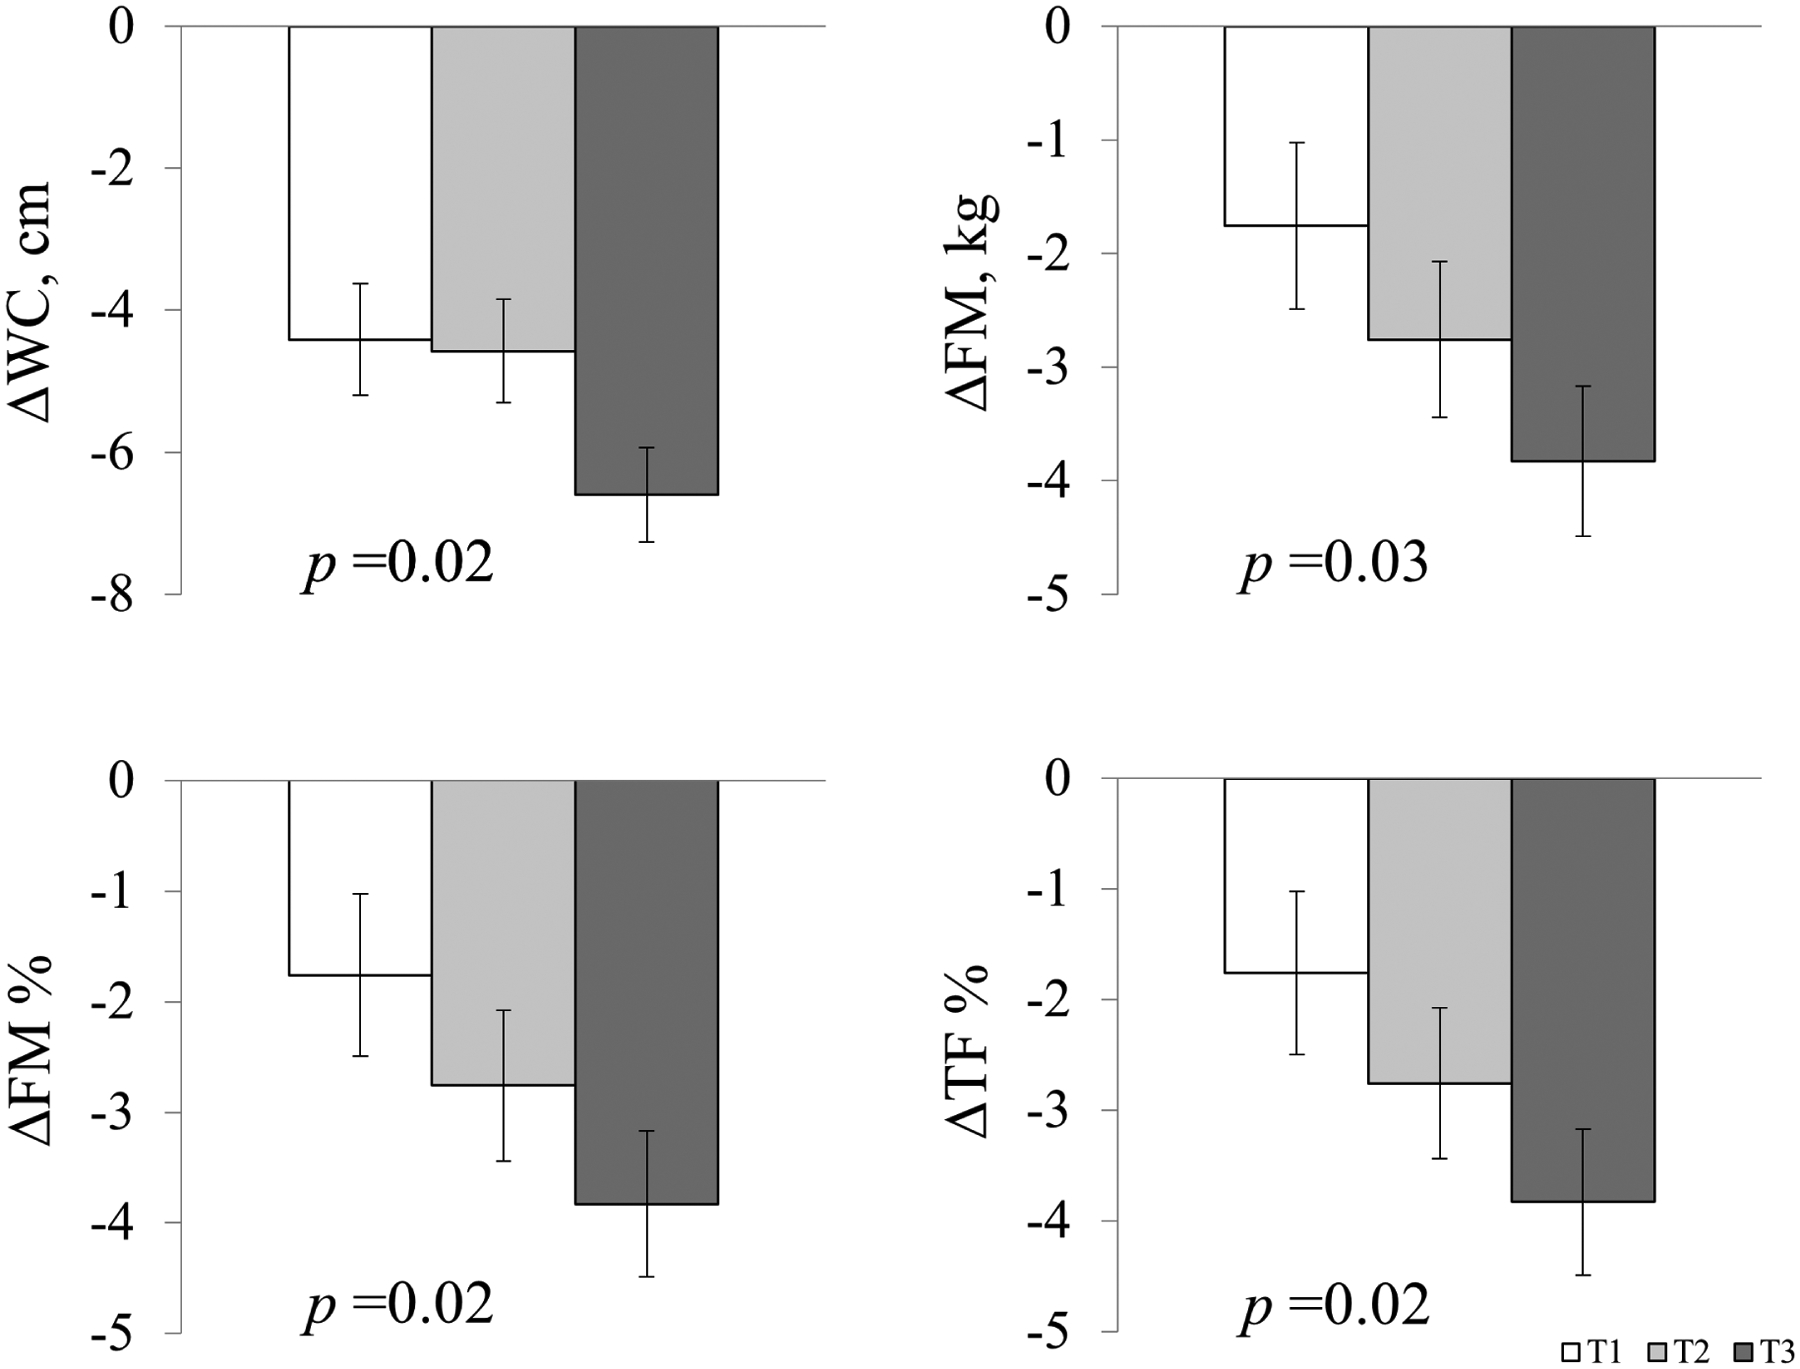
Two-year changes in central adiposity and body composition according to tertiles of gut microbiome abundance genetic risk score.
Data are means ± SE values after adjustment for age, race, sex, diet interventions, BMI, dietary fiber intake, and respective values of outcome traits at baseline. T3 is the highest tertile of the gut microbial abundance GRS. Abbreviations: WC, waist circumference; FM, total fat mass; FM%, whole body total percentage of fat mass; TF%, percentage of trunk fat.
We further tested the interactions between dietary fat intake and the gut microbial abundance GRS on changes in adiposity and body composition but did not find any significant interactions at 2 years. However, we did find that dietary protein intake significantly modified the association between the gut microbial abundance GRS and changes in FM (p-interaction =0.04), FM% (p-interaction =0.013), and TF% (p-interaction =0.006) from baseline to 6 months, when the maximum weight loss was achieved, after adjusting for age, race, sex, baseline BMI, dietary fiber intake, and baseline value for the respective outcome (Figure 2). Among participants consuming an average-protein diet, the higher gut microbial abundance GRS was associated with a greater reduction in FM, FM%, and TF% from baseline to 6 months, whereas no significant associations were observed in the high-protein group. There was no significant interaction between the gut microbial abundance GRS and dietary protein on changes in body composition at 2 years, presumably due to the decline in the adherence to the dietary interventions (p-interaction >0.05, data not shown). Sensitivity analyses using the Firmicutes-specific abundance GRS showed similar interaction patterns with dietary fat intake on 6-month changes in FM, FM%, and TF% (Supplementary Figure 1).
Figure 2.
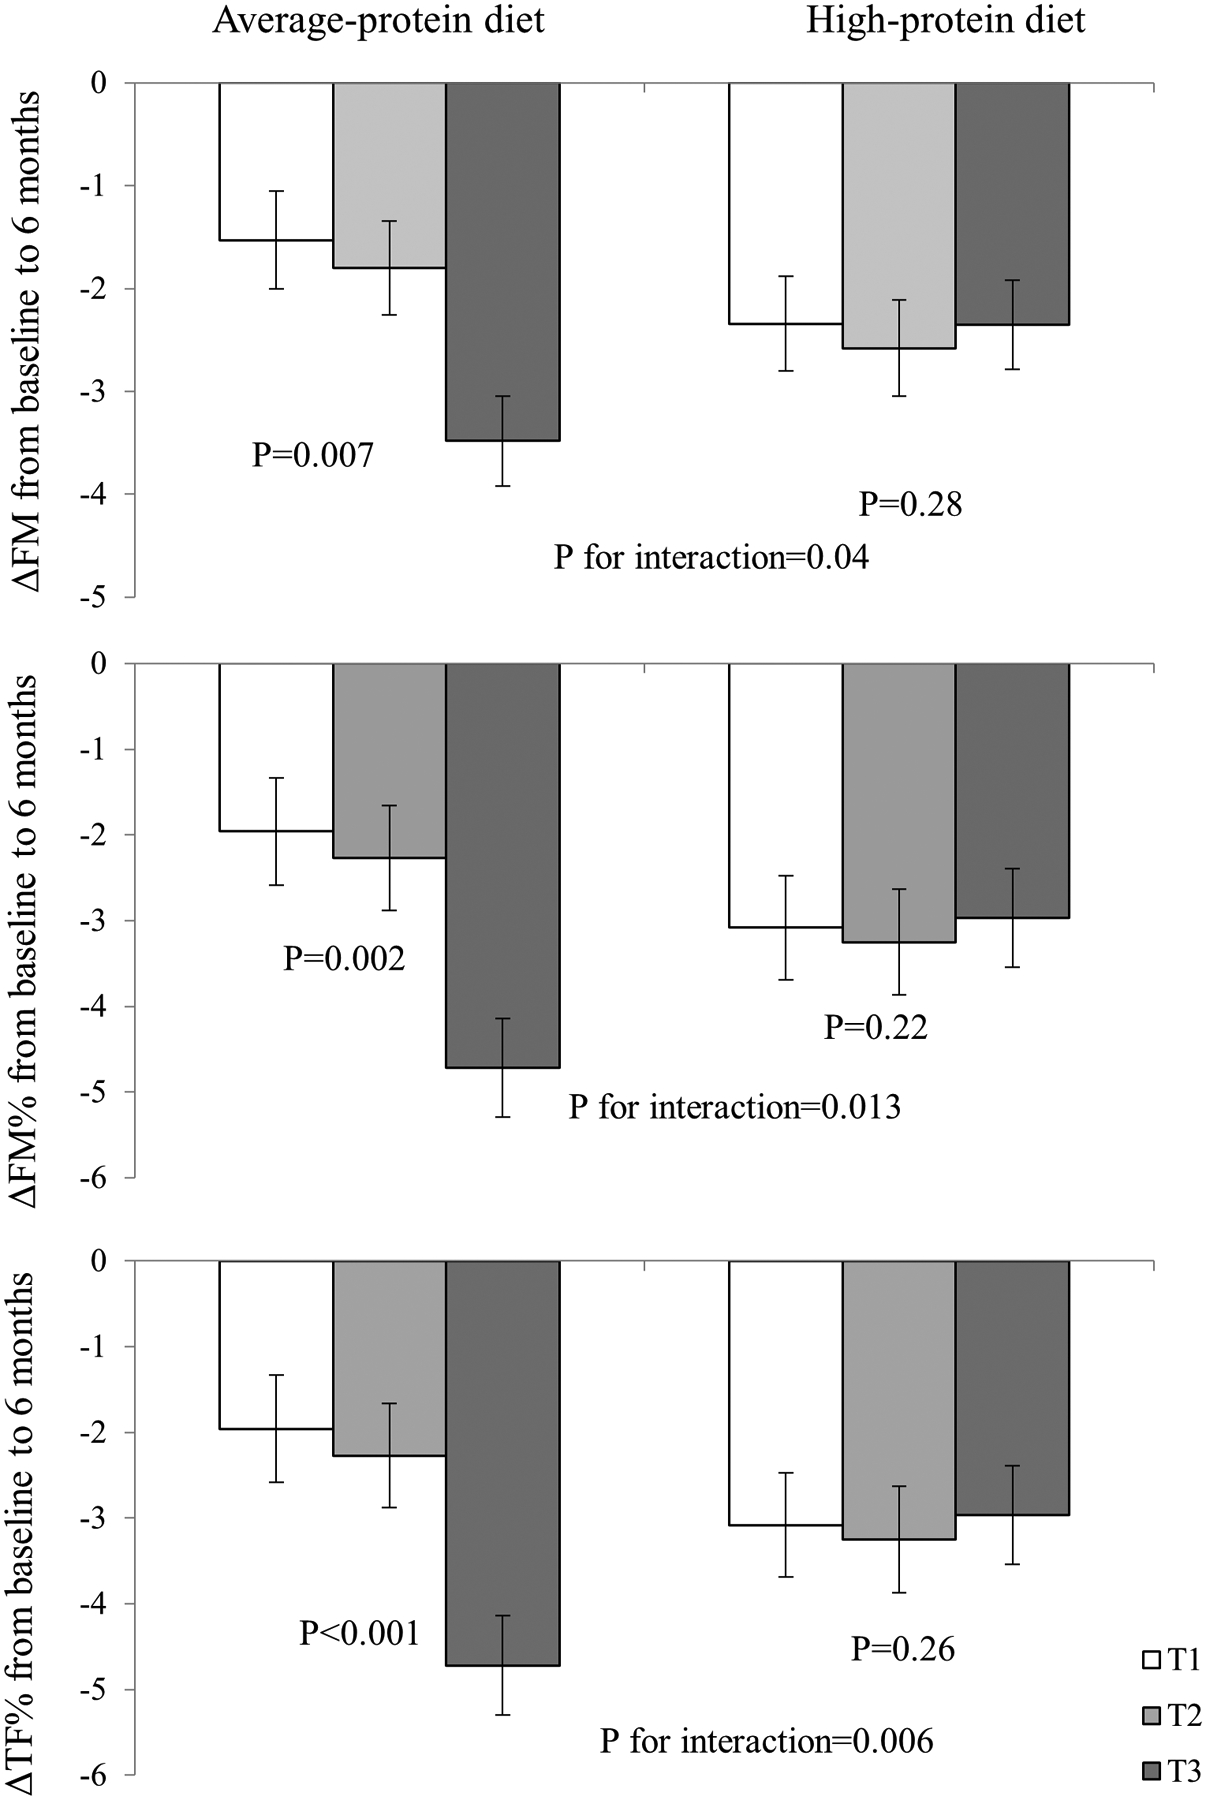
Changes in body composition according to gut microbiome genetic risk score and average- or high-protein diet at 6 months.
Models were adjusted for age, race, sex, BMI, dietary fiber intake, and respective values of outcome traits at baseline, according to average-/high-protein diet. T3 is the highest tertile of the gut microbial abundance GRS. Abbreviations: FM, total fat mass; FM%, whole body total percentage of fat mass; TF%, percentage of trunk fat.
We also used linear mixed models integrating the data at 3 time points (baseline, 6 months, and 2 years) to assess the trajectory of genetic associations with the outcomes in average- and high-protein diet groups separately (Figure 3). The genetic effect did not significantly differ by time during the intervention in the average-protein diet (p GRS-time-interaction>0.05). In the average-protein diet group, participants with the highest microbial abundance GRS had significantly greater reductions in waist circumference, FM, FM%, and TF% from baseline to 6 months, and continued the trend from 6 months to 2 years (although not statistically significant at 2 years), compared to those in the lower tertiles of the gut microbial abundance GRS. In the high-protein diet group, we found significant interactions between the intervention time and the GRS on the trajectories of changes in FM, FM%, and TF% (p GRS-time-interaction=0.02, 0.02, and 0.019, respectively), where the reductions were more evident at 6 months but were attenuated significantly from 6 months to 2 years.
Figure 3.
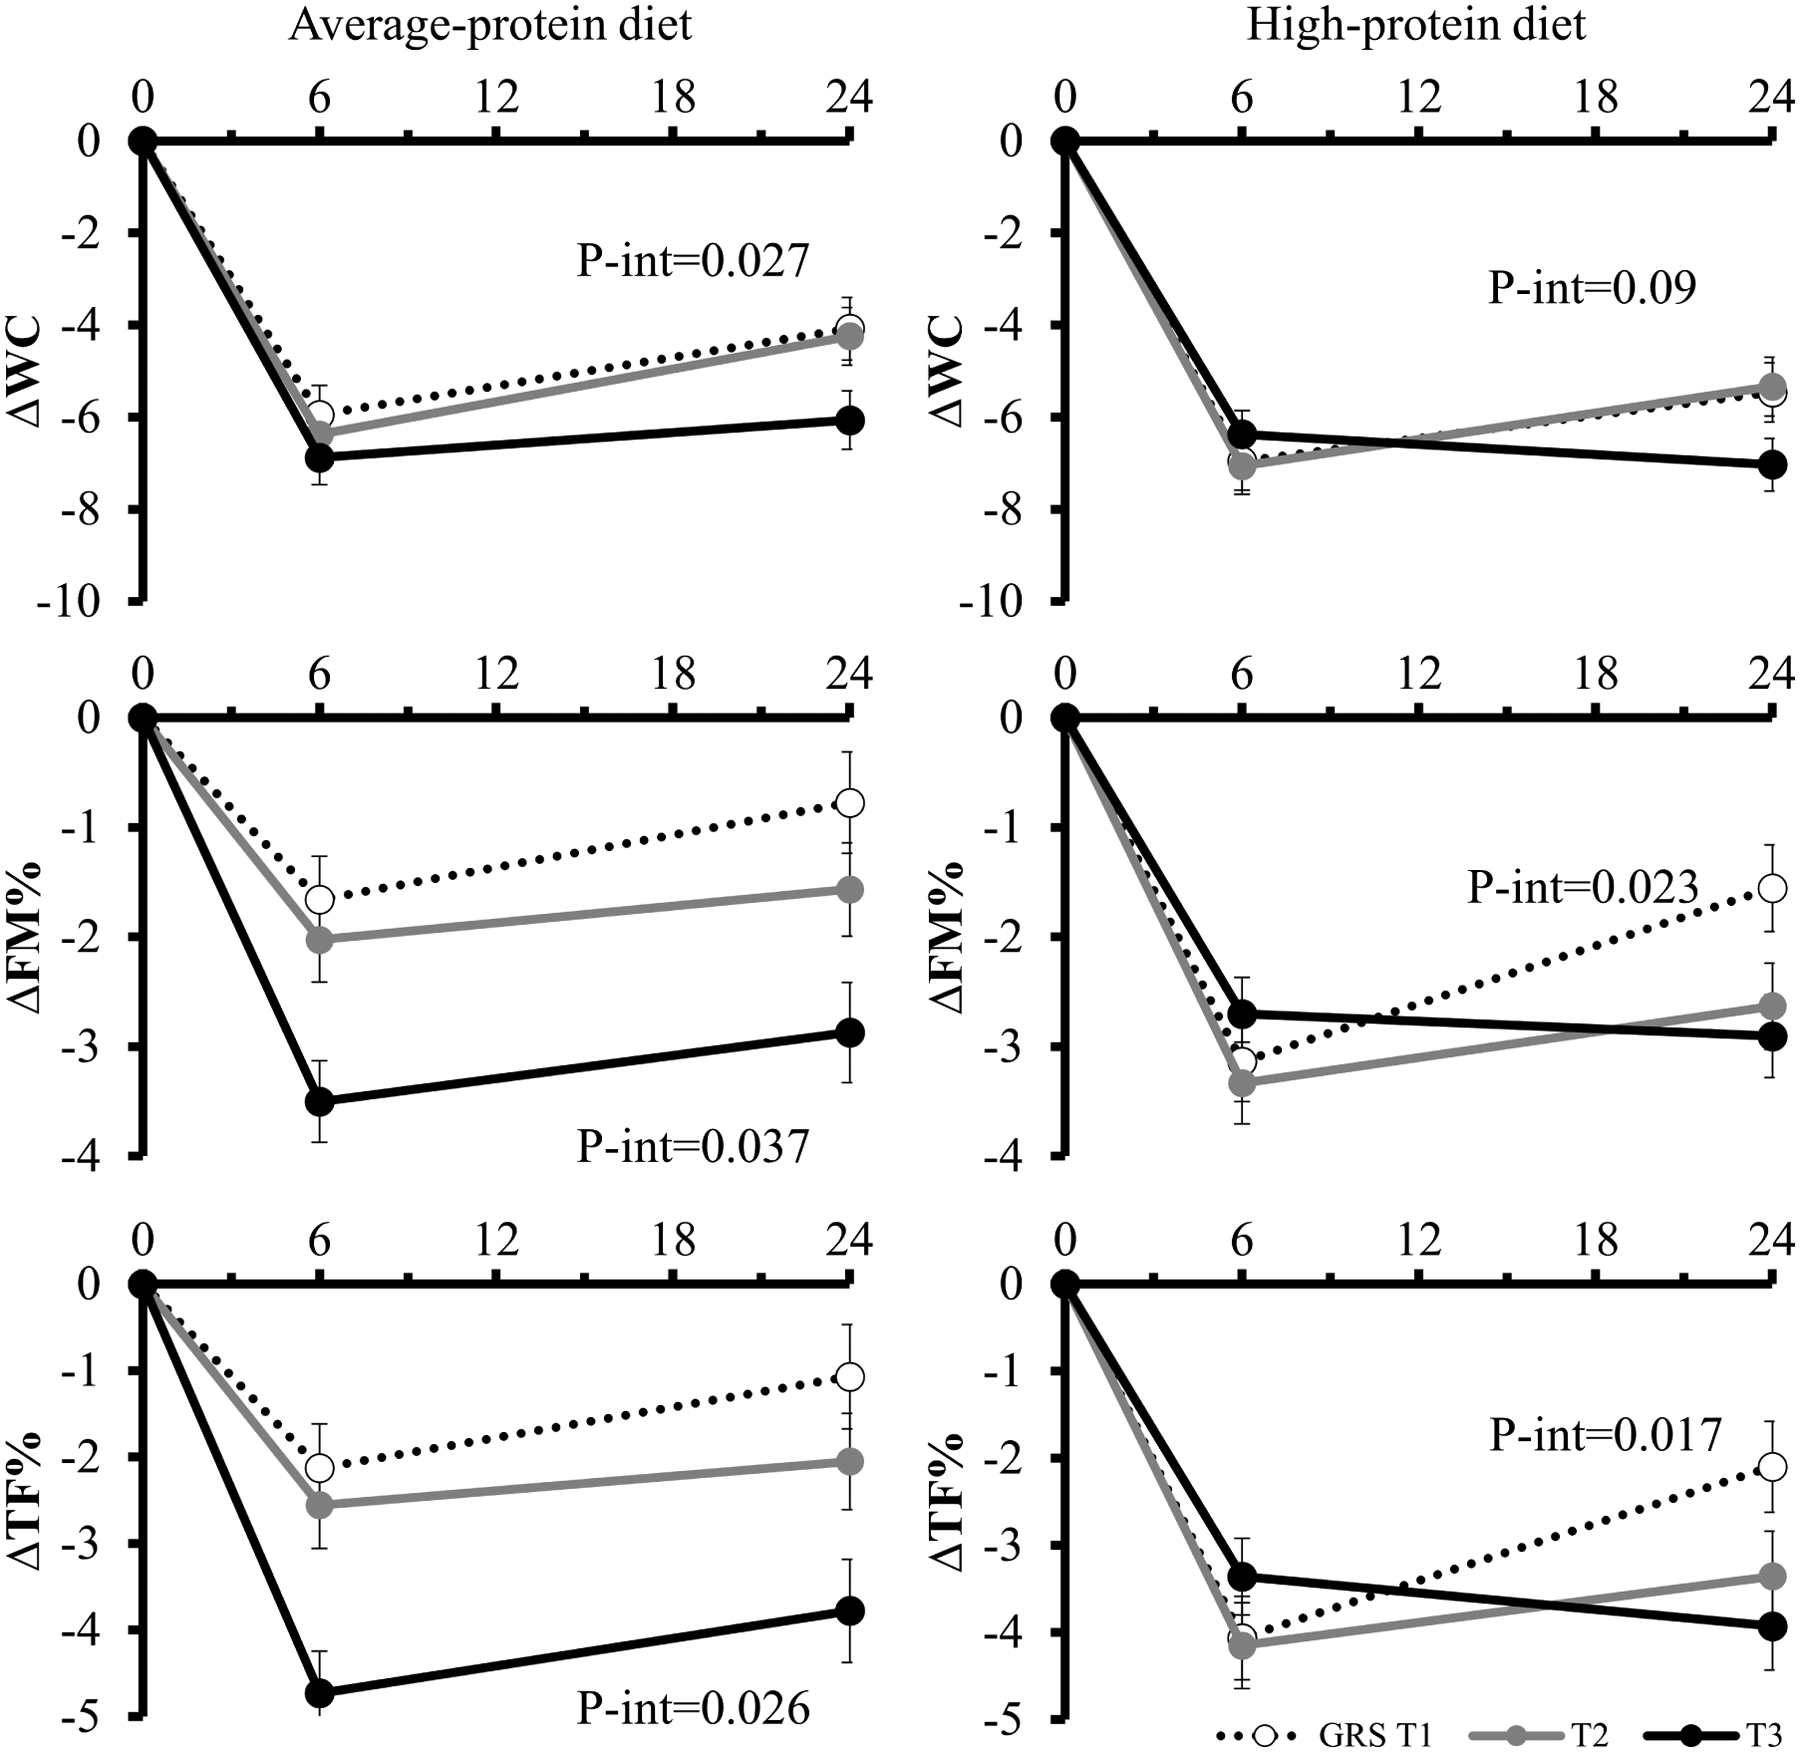
Trajectory of changes in central adiposity and body composition during 2 years in the average- and high-protein diet group.
Values are means ± standard error after adjustment for age, sex, race, BMI, dietary fiber intake, and baseline value of the respective outcome trait. Linear mixed models (PROC MIXED) were used to test the genetic effect on the trajectory of changes in waist circumference, FM, FM%, and TF%. WC: waist circumference; FM%: whole body total percentage of fat mass; TF%: percentage of trunk fat.
Discussion
In this large dietary intervention trial, we found that a higher GRS for gut microbial relative abundance was significantly associated with 2-year reductions in waist circumference and body composition, including FM, FM%, and TF%. In addition, the relations of the gut microbial abundance GRS with changes in FM, FM%, and TF% were significantly modified by the dietary protein intake at 6 months. In response to the average-protein diet, individuals with a higher gut microbial abundance GRS exhibited greater reductions in FM, FM%, and TF%, while no such associations were observed in the high-protein diet group.
Previous evidence has consistently shown an increased relative abundance of gut microbiota, such as Firmicutes, among individuals with obesity compared to the lean controls [10–13]. In contrast, the relative abundance of Firmicutes significantly decreased in response to weight-loss intervention [11]. In our analysis, of the 20 SNPs constituting the GRS for the relevant abundance of gut microbial taxa, 14 of them were related to species that belong to the Firmicutes phylum. The relatively higher abundance of Firmicutes promotes more efficient energy harvesting and storage from food [1,11]. The association between higher gut microbial abundance GRS and reductions in FM, FM%, and TF% is also consistent with previous evidence. For example, a randomized clinical trial found that a prebiotic supplement, which increased the abundance of several bacterial species was associated with significantly reduced FM% and TF%, but not with FFM [38]. Our results indicate that individuals with a genetic predisposition to a higher abundance of gut microbial taxa, predominantly constituted by SNPs related to the Firmicutes phylum, are more responsive to a weight-loss diet, particularly in reductions of central obesity and body composition. Taken together, these data support an important role of gut microbiota abundance in the regulation of adiposity. Individuals with a higher abundance of gut microbiota may benefit more in reducing central obesity, FM, FM%, and TF% from weight-loss diet interventions.
Intriguingly, we found that the dietary protein intake significantly modified the associations between the gut microbiome abundance GRS and changes in body composition at 6 months, when the largest weight loss was achieved. We found that the association between gut microbial abundance GRS and body composition was more evident among participants with an average-protein diet than those with a high-protein diet. While the mechanism underlying this observation is not clear, our results are in line with previous findings [23,39–41]. Dietary factors could modulate the gut microbiota [30]. Although a low-calorie high-protein diet is effective in reducing body weight, it has also been associated with potential negative health effects, particularly for gut health [39,42–44]. High protein diets were found to induce protein fermentation by gut microbiota and synthesis of byproducts that have been implicated in the development of obesity [45–47] Evidence from human and mouse models has shown that a high-protein diet could reduce the abundance of presumed beneficial bacteria [39,42,48–50]. For example, in a previous intervention trial, 19 participants with obesity were assigned to three diets: a maintenance diet (13% protein), a high-protein (30% protein)/low carbohydrate diet, and a high-protein/medium carbohydrate diet [39]. Comparing the two high-protein diets to the maintenance diet with average protein, several bacteria that have butyrate as the main fermentation product showed a substantial decrease [39]. Butyrate has been associated with multiple metabolic benefits, including prevention of obesity and promotion of energy expenditure [51]. Therefore, it is possible that the beneficial association between the gut microbiota abundance GRS and changes of FM, FM%, and TF% were offset by high protein in the high-protein group. The interaction attenuated at 2 years, presumably due to the decline in adherence to the dietary intervention and relatively small sample size. Collectively, these data suggest a high-protein diet might lead to a deleterious gut environment and may interact with the host genome on regulation of adiposity.
In the current analysis, we investigated the associations between genetically determined gut microbial abundance and long-term changes in central obesity and body composition in response to weight-loss diets. Our findings lend further support to the role of relative abundance of microbial taxa on the regulation of adiposity and body composition. Our study has several strengths. First, the POUNDS Lost trial is among the largest and longest weight-loss diet intervention trials. Second, we have repeated measurements of body composition using DEXA across the 2-year intervention, allowing us to test for long-term changes. We also acknowledge several limitations. First, we did not have direct measurements of gut microbiota before and after the intervention, but only analyzed the effect of related genetic factors, which limits our ability to investigate the interplay of the host genome, microbiota, and adiposity traits. Second, genetic factors only explain less than 10% of the variation in gut microbiota abundance. Indeed, such magnitude in phenotypical difference in gut microbiota composition may exert clinical meaningful impacts on health outcomes. Third, the measurements of body composition by DEXA were only available in a random 50% of the total participants. Fourth, most of the study population are White, and participants were overweight or obese. Thus, whether our findings are applicable to the general population needs further investigation. Lastly, we tested several outcomes, which may raise issues of multiple comparison. However, the Bonferroni correction assumes all the multiple tests are independent [52,53]; while the outcomes (central adiposity and body composition) in our study are highly correlated. Therefore, correcting multiple comparisons would raise the type II error and reduce the power to detect the significant differences.
In conclusion, our findings suggest that a higher genetic predisposition to gut microbial relative abundance is associated with greater reductions in central adiposity and body composition in response to weight-loss diet interventions. In addition, improvement in body composition may be modified by dietary protein. Overweight and obese individuals with a higher genetically determined gut microbial abundance may benefit more in improving adiposity and body composition by consuming a low-calorie, weight-loss diet, particularly an average-protein diet.
Supplementary Material
Acknowledgments
The authors thank all the POUNDS Lost participants for their dedication and contribution to the research.
Funding sources:
The study was supported by grants from the National Heart, Lung, and Blood Institute (HL071981, HL034594, HL126024), the National Institute of Diabetes and Digestive and Kidney Diseases (DK115679, DK091718, DK100383), the Fogarty International Center (TW010790), and Tulane Research Centers of Excellence Awards. Xiang Li was the recipient of the American Heart Association Predoctoral Fellowship Award (19PRE34380036).
Footnotes
Publisher's Disclaimer: This is a PDF file of an unedited manuscript that has been accepted for publication. As a service to our customers we are providing this early version of the manuscript. The manuscript will undergo copyediting, typesetting, and review of the resulting proof before it is published in its final form. Please note that during the production process errors may be discovered which could affect the content, and all legal disclaimers that apply to the journal pertain.
Conflict of interest statement:
All authors declare no conflict of interest.
References:
- [1].Turnbaugh PJ, Ley RE, Mahowald MA, Magrini V, Mardis ER, Gordon JI. An obesity-associated gut microbiome with increased capacity for energy harvest. Nature 2006;444:1027–31. 10.1038/nature05414. [DOI] [PubMed] [Google Scholar]
- [2].Nieuwdorp M, Gilijamse PW, Pai N, Kaplan LM. Role of the microbiome in energy regulation and metabolism. Gastroenterology 2014;146:1525–33. 10.1053/j.gastro.2014.02.008. [DOI] [PubMed] [Google Scholar]
- [3].Jumpertz R, Le DS, Turnbaugh PJ, Trinidad C, Bogardus C, Gordon JI, et al. Energy-balance studies reveal associations between gut microbes, caloric load, and nutrient absorption in humans. Am J Clin Nutr 2011;94:58–65. [DOI] [PMC free article] [PubMed] [Google Scholar]
- [4].GC L, WT L. The gut microbiota at the intersection of diet and human health. Science (80- ) 2018;362:776–80. 10.1126/science.aau5812. [DOI] [PubMed] [Google Scholar]
- [5].Clemente JC, Ursell LK, Parfrey LW, Knight R. The Impact of the Gut Microbiota on Human Health: An Integrative View. Cell 2012;148:1258–70. https://doi.org/ 10.1016/j.cell.2012.01.035. [DOI] [PMC free article] [PubMed] [Google Scholar]
- [6].Tremaroli V, Bäckhed F. Functional interactions between the gut microbiota and host metabolism. Nature 2012;489:242–9. 10.1038/nature11552. [DOI] [PubMed] [Google Scholar]
- [7].Valdes AM, Walter J, Segal E, Spector TD. Role of the gut microbiota in nutrition and health. BMJ 2018;361:k2179. 10.1136/bmj.k2179. [DOI] [PMC free article] [PubMed] [Google Scholar]
- [8].Patterson E, Ryan PM, Cryan JF, Dinan TG, Ross RP, Fitzgerald GF, et al. Gut microbiota, obesity and diabetes. Postgrad Med J 2016;92:286–300. 10.1136/postgradmedj-2015-133285. [DOI] [PubMed] [Google Scholar]
- [9].Zhang H, DiBaise JK, Zuccolo A, Kudrna D, Braidotti M, Yu Y, et al. Human gut microbiota in obesity and after gastric bypass. Proc Natl Acad Sci 2009;106:2365–70. [DOI] [PMC free article] [PubMed] [Google Scholar]
- [10].Turnbaugh PJ, Hamady M, Yatsunenko T, Cantarel BL, Duncan A, Ley RE, et al. A core gut microbiome in obese and lean twins. Nature 2009;457:480–4. 10.1038/nature07540. [DOI] [PMC free article] [PubMed] [Google Scholar]
- [11].Ley RE, Turnbaugh PJ, Klein S, Gordon JI. Microbial ecology: human gut microbes associated with obesity. Nature 2006;444:1022–3. 10.1038/4441022a. [DOI] [PubMed] [Google Scholar]
- [12].Palmas V, Pisanu S, Madau V, Casula E, Deledda A, Cusano R, et al. Gut microbiota markers associated with obesity and overweight in Italian adults. Sci Rep 2021;11:5532. 10.1038/s41598-021-84928-w. [DOI] [PMC free article] [PubMed] [Google Scholar]
- [13].Ley RE, Bäckhed F, Turnbaugh P, Lozupone CA, Knight RD, Gordon JI. Obesity alters gut microbial ecology. Proc Natl Acad Sci U S A 2005;102:11070 LP – 11075. 10.1073/pnas.0504978102. [DOI] [PMC free article] [PubMed] [Google Scholar]
- [14].Turnbaugh PJ, Gordon JI. The core gut microbiome, energy balance and obesity. J Physiol 2009;587:4153–8. https://doi.org/ 10.1113/jphysiol.2009.174136. [DOI] [PMC free article] [PubMed] [Google Scholar]
- [15].Komaroff AL. The Microbiome and Risk for Obesity and Diabetes. JAMA 2017;317:355–6. 10.1001/jama.2016.20099. [DOI] [PubMed] [Google Scholar]
- [16].Chakraborti CK. New-found link between microbiota and obesity. World J Gastrointest Pathophysiol 2015;6:110–9. 10.4291/wjgp.v6.i4.110. [DOI] [PMC free article] [PubMed] [Google Scholar]
- [17].Bäckhed F, Ding H, Wang T, Hooper LV, Koh GY, Nagy A, et al. The gut microbiota as an environmental factor that regulates fat storage. Proc Natl Acad Sci 2004;101:15718–23. [DOI] [PMC free article] [PubMed] [Google Scholar]
- [18].Patil DP, Dhotre DP, Chavan SG, Sultan A, Jain DS, Lanjekar VB, et al. Molecular analysis of gut microbiota in obesity among Indian individuals. J Biosci 2012;37:647–57. [DOI] [PubMed] [Google Scholar]
- [19].Patrone V, Vajana E, Minuti A, Callegari ML, Federico A, Loguercio C, et al. Postoperative changes in fecal bacterial communities and fermentation products in obese patients undergoing bilio-intestinal bypass. Front Microbiol 2016;7:200. [DOI] [PMC free article] [PubMed] [Google Scholar]
- [20].Murphy R, Tsai P, Jüllig M, Liu A, Plank L, Booth M. Differential changes in gut microbiota after gastric bypass and sleeve gastrectomy bariatric surgery vary according to diabetes remission. Obes Surg 2017;27:917–25. [DOI] [PubMed] [Google Scholar]
- [21].Kim KN, Yao Y, Ju SY. Short Chain Fatty Acids and Fecal Microbiota Abundance in Humans with Obesity: A Systematic Review and Meta-Analysis. Nutrients 2019;11:2512. 10.3390/nu11102512. [DOI] [PMC free article] [PubMed] [Google Scholar]
- [22].EJTAHED H-S, ANGOORANI P, SOROUSH A-R, HASANI-RANJBAR S, SIADAT S-D, LARIJANI B. Gut microbiota-derived metabolites in obesity: a systematic review. Biosci Microbiota, Food Heal 2020;39:65–76. 10.12938/bmfh.2019-026. [DOI] [PMC free article] [PubMed] [Google Scholar]
- [23].Nyangale EP, Mottram DS, Gibson GR. Gut microbial activity, implications for health and disease: the potential role of metabolite analysis. J Proteome Res 2012;11:5573–85. [DOI] [PubMed] [Google Scholar]
- [24].Goodrich JK, Waters JL, Poole AC, Sutter JL, Koren O, Blekhman R, et al. Human genetics shape the gut microbiome. Cell 2014;159:789–99. 10.1016/j.cell.2014.09.053. [DOI] [PMC free article] [PubMed] [Google Scholar]
- [25].Turpin W, Espin-Garcia O, Xu W, Silverberg MS, Kevans D, Smith MI, et al. Association of host genome with intestinal microbial composition in a large healthy cohort. Nat Genet 2016;48:1413–7. 10.1038/ng.3693. [DOI] [PubMed] [Google Scholar]
- [26].Bonder MJ, Kurilshikov A, Tigchelaar EF, Mujagic Z, Imhann F, Vila AV, et al. The effect of host genetics on the gut microbiome. Nat Genet 2016;48:1407–12. 10.1038/ng.3663. [DOI] [PubMed] [Google Scholar]
- [27].Wang J, Thingholm LB, Skiecevičie J, Rausch P, Kummen M, Hov JR, et al. Genome-wide association analysis identifies variation in Vitamin D receptor and other host factors influencing the gut microbiota. Nat Genet 2016;48:1396–406. 10.1038/ng.3695. [DOI] [PMC free article] [PubMed] [Google Scholar]
- [28].Kurilshikov A, Medina-Gomez C, Bacigalupe R, Radjabzadeh D, Wang J, Demirkan A, et al. Large-scale association analyses identify host factors influencing human gut microbiome composition. Nat Genet 2021;53:156–65. 10.1038/s41588-020-00763-1. [DOI] [PMC free article] [PubMed] [Google Scholar]
- [29].Zhernakova A, Kurilshikov A, Bonder MJ, Tigchelaar EF, Schirmer M, Vatanen T, et al. Population-based metagenomics analysis reveals markers for gut microbiome composition and diversity. Science 2016;352:565–9. 10.1126/science.aad3369. [DOI] [PMC free article] [PubMed] [Google Scholar]
- [30].Rothschild D, Weissbrod O, Barkan E, Kurilshikov A, Korem T, Zeevi D, et al. Environment dominates over host genetics in shaping human gut microbiota. Nature 2018;555:210–5. 10.1038/nature25973. [DOI] [PubMed] [Google Scholar]
- [31].Sacks FM, Bray GA, Carey VJ, Smith SR, Ryan DH, Anton SD, et al. Comparison of weight-loss diets with different compositions of fat, protein, and carbohydrates. N Engl J Med 2009;360:859–73. 10.1056/NEJMoa0804748. [DOI] [PMC free article] [PubMed] [Google Scholar]
- [32].de Souza RJ, Bray GA, Carey VJ, Hall KD, LeBoff MS, Loria CM, et al. Effects of 4 weight-loss diets differing in fat, protein, and carbohydrate on fat mass, lean mass, visceral adipose tissue, and hepatic fat: results from the POUNDS LOST trial. Am J Clin Nutr 2012;95:614–25. 10.3945/ajcn.111.026328. [DOI] [PMC free article] [PubMed] [Google Scholar]
- [33].Qi Q, Bray GA, Smith SR, Hu FB, Sacks FM, Qi L. Insulin receptor substrate 1 gene variation modifies insulin resistance response to weight-loss diets in a 2-year randomized trial: the Preventing Overweight Using Novel Dietary Strategies (POUNDS LOST) trial. Circulation 2011;124:563–71. 10.1161/CIRCULATIONAHA.111.025767. [DOI] [PMC free article] [PubMed] [Google Scholar]
- [34].Zhou T, Sun D, Li X, Heianza Y, LeBoff MS, Bray GA, et al. Genetically determined SCFA concentration modifies the association of dietary fiber intake with changes in bone mineral density during weight loss: The Preventing Overweight Using Novel Dietary Strategies (POUNDS LOST) trial. Am J Clin Nutr 2021;114:42–8. 10.1093/ajcn/nqab037. [DOI] [PMC free article] [PubMed] [Google Scholar]
- [35].Qi Q, Chu AY, Kang JH, Jensen MK, Curhan GC, Pasquale LR, et al. Sugar-sweetened beverages and genetic risk of obesity. N Engl J Med 2012;367:1387–96. 10.1056/NEJMoa1203039. [DOI] [PMC free article] [PubMed] [Google Scholar]
- [36].Lewis CM, Vassos E. Polygenic risk scores: from research tools to clinical instruments. Genome Med 2020;12:44. 10.1186/s13073-020-00742-5. [DOI] [PMC free article] [PubMed] [Google Scholar]
- [37].Cronin P, Joyce SA, O’Toole PW, O’Connor EM. Dietary Fibre Modulates the Gut Microbiota. Nutr 2021;13. 10.3390/nu13051655. [DOI] [PMC free article] [PubMed] [Google Scholar]
- [38].Nicolucci AC, Hume MP, Martínez I, Mayengbam S, Walter J, Reimer RA. Prebiotics Reduce Body Fat and Alter Intestinal Microbiota in Children Who Are Overweight or With Obesity. Gastroenterology 2017;153:711–22. https://doi.org/ 10.1053/j.gastro.2017.05.055. [DOI] [PubMed] [Google Scholar]
- [39].Duncan SH, Belenguer A, Holtrop G, Johnstone AM, Flint HJ, Lobley GE. Reduced dietary intake of carbohydrates by obese subjects results in decreased concentrations of butyrate and butyrate-producing bacteria in feces. Appl Environ Microbiol 2007;73:1073–8. [DOI] [PMC free article] [PubMed] [Google Scholar]
- [40].Shi J, Zhao D, Song S, Zhang M, Zamaratskaia G, Xu X, et al. High-Meat-Protein High-Fat Diet Induced Dysbiosis of Gut Microbiota and Tryptophan Metabolism in Wistar Rats. J Agric Food Chem 2020;68:6333–46. 10.1021/acs.jafc.0c00245. [DOI] [PubMed] [Google Scholar]
- [41].Madsen L, Myrmel LS, Fjære E, Liaset B, Kristiansen K. Links between Dietary Protein Sources, the Gut Microbiota, and Obesity. Front Physiol 2017;8. 10.3389/fphys.2017.01047. [DOI] [PMC free article] [PubMed] [Google Scholar]
- [42].Russell WR, Gratz SW, Duncan SH, Holtrop G, Ince J, Scobbie L, et al. High-protein, reduced-carbohydrate weight-loss diets promote metabolite profiles likely to be detrimental to colonic health. Am J Clin Nutr 2011;93:1062–72. [DOI] [PubMed] [Google Scholar]
- [43].Brinkworth GD, Noakes M, Clifton PM, Bird AR. Comparative effects of very low-carbohydrate, high-fat and high-carbohydrate, low-fat weight-loss diets on bowel habit and faecal short-chain fatty acids and bacterial populations. Br J Nutr 2009;101:1493–502. [DOI] [PubMed] [Google Scholar]
- [44].Sergeev IN, Aljutaily T, Walton G, Huarte E. Effects of Synbiotic Supplement on Human Gut Microbiota, Body Composition and Weight Loss in Obesity. Nutr 2020;12. 10.3390/nu12010222. [DOI] [PMC free article] [PubMed] [Google Scholar]
- [45].Singh RK, Chang H-W, Yan DI, Lee KM, Ucmak D, Wong K, et al. Influence of diet on the gut microbiome and implications for human health. J Transl Med 2017;15:1–17. [DOI] [PMC free article] [PubMed] [Google Scholar]
- [46].Lopez-Legarrea P, Fuller NR, Martinez JA, Caterson ID, Zulet MA. The influence of Mediterranean, carbohydrate and high protein diets on gut microbiota composition in the treatment of obesity and associated inflammatory state. Asia Pac J Clin Nutr 2014;23:360–8. [DOI] [PubMed] [Google Scholar]
- [47].Blachier F, Beaumont M, Portune KJ, Steuer N, Lan A, Audebert M, et al. High-protein diets for weight management: Interactions with the intestinal microbiota and consequences for gut health. A position paper by the my new gut study group. Clin Nutr 2019;38:1012–22. [DOI] [PubMed] [Google Scholar]
- [48].Kim E, Kim D-B, Park J-Y. Changes of Mouse Gut Microbiota Diversity and Composition by Modulating Dietary Protein and Carbohydrate Contents: A Pilot Study. Prev Nutr Food Sci 2016;21:57–61. 10.3746/pnf.2016.21.1.57. [DOI] [PMC free article] [PubMed] [Google Scholar]
- [49].Walker AW, Ince J, Duncan SH, Webster LM, Holtrop G, Ze X, et al. Dominant and diet-responsive groups of bacteria within the human colonic microbiota. ISME J 2011;5:220–30. [DOI] [PMC free article] [PubMed] [Google Scholar]
- [50].Salonen A, Lahti L, Salojärvi J, Holtrop G, Korpela K, Duncan SH, et al. Impact of diet and individual variation on intestinal microbiota composition and fermentation products in obese men. ISME J 2014;8:2218–30. [DOI] [PMC free article] [PubMed] [Google Scholar]
- [51].Coppola S, Avagliano C, Calignano A, Berni Canani R. The Protective Role of Butyrate against Obesity and Obesity-Related Diseases. Mol 2021;26. 10.3390/molecules26030682. [DOI] [PMC free article] [PubMed] [Google Scholar]
- [52].Perneger TV What’s wrong with Bonferroni adjustments. BMJ 1998;316:1236–8. [DOI] [PMC free article] [PubMed] [Google Scholar]
- [53].Rothman KJ. No Adjustments Are Needed for Multiple Comparisons. Epidemiology 1990;1:43–6. [PubMed] [Google Scholar]
Associated Data
This section collects any data citations, data availability statements, or supplementary materials included in this article.