

Abstract
Eukaryotic genomes are pervasively transcribed by RNA polymerase II. Yet, the molecular and biological implications of such a phenomenon are still largely puzzling. Here, we describe noncoding RNA transcription upstream of the Arabidopsis thaliana DOG1 gene, which governs salt stress responses and is a key regulator of seed dormancy. We find that expression of the DOG1 gene is induced by salt stress, thereby causing a delay in seed germination. We uncover extensive transcriptional activity on the promoter of the DOG1 gene, which produces a variety of lncRNAs. These lncRNAs, named PUPPIES, are co‐directionally transcribed and extend into the DOG1 coding region. We show that PUPPIES RNAs respond to salt stress and boost DOG1 expression, resulting in delayed germination. This positive role of pervasive PUPPIES transcription on DOG1 gene expression is associated with augmented pausing of RNA polymerase II, slower transcription and higher transcriptional burst size. These findings highlight the positive role of upstream co‐directional transcription in controlling transcriptional dynamics of downstream genes.
Keywords: long noncoding RNAs, RNA polymerase II pausing, salt stress, transcriptional dynamics
Subject Categories: Chromatin, Transcription & Genomics; Plant Biology
PUPPIES lncRNAs transcription from the promoter of seed dormancy regulator DOG1 augments pausing of RNA polymerase II and delays germination.

Introduction
Seed germination is a major phase transition in the plant's development. It is influenced by seed dormancy, which is the ability of seeds to postpone germination when under favourable conditions. Seed dormancy contributes to the natural variability of germination timing and bet‐hedging (Finch‐Savage & Footitt, 2017). Delay of germination 1 (DOG1) gene is a QTL for seed dormancy (Alonso‐Blanco et al, 2003; Bentsink et al, 2006). DOG1 gene expression is induced during seed maturation and accumulated DOG1 protein results in the dormancy of mature dry seeds (Nakabayashi et al, 2012).
DOG1 expression is regulated at the transcriptional level by multiple mechanisms, including alternative polyadenylation (APA) generating short DOG1 (shDOG1) and long DOG1 (lgDOG1) isoforms (Cyrek et al, 2015), as well as repressed by the antisense long noncoding RNA (lncRNA) 1GOD (Fedak et al, 2016; Kowalczyk et al, 2017).
In plants, antisense lncRNAs are typically transcribed from promoters within the 3′ or downstream gene regions. Besides 1GOD, antisense lncRNAs have been described to control important physiological responses (Swiezewski et al, 2009; Kindgren et al, 2018; Zhao et al, 2018). Upstream of genes, another class of noncoding transcription, gives rise to promoter upstream transcripts (PROMPTS). PROMPTS are frequently transcribed in the antisense orientation and quickly degraded by the exosome (Lloret‐Llinares et al, 2016; Thieffry et al, 2020). Additionally, promoter regions are also a source of stable lncRNA transcribed as independent transcriptional units including APOLO and COLDWRAP, with a repressive impact on the nearby genes (Ariel et al, 2014; Kim & Sung, 2017). Furthermore, promoter regions can also be transcribed as a result of readthrough from the upstream gene or an upstream transcription start site (TSS) of the same gene. In the yeast model S. cerevisiae, pervasive transcription from the upstream gene over the downstream was observed in one‐quarter of all tandem genes (Pelechano et al, 2013). A similar abundance of such events was also observed in human cells (Vilborg et al, 2015; Vilborg & Steitz, 2017). In Arabidopsis, the readthrough of upstream transcripts over downstream genes was shown to be limited by the activity of nuclear exoribonucleases (Crisp et al, 2018; Krzyszton et al, 2018) and BORDER proteins (Yu et al, 2019).
Here, we uncover the role of DOG1 in controlling the timing of germination of seeds under salt stress. In response to this stress, the DOG1 gene promoter is extensively transcribed, generating a variety of lncRNAs, that we name PUPPIES. We show that PUPPIES pervasive transcription, induced in response to salt stress, stimulates DOG1 expression to delay germination. Our results indicate that PUPPIES induce DOG1 expression by altering Pol II dynamics on the gene. PUPPIES boost the number of Pol II molecules loaded per DOG1 transcriptional burst. Interestingly, the enhanced DOG1 transcription is accompanied by augmented Pol II pausing, slower transcription through nucleosome‐containing but not nucleosome‐depleted regions of DOG1, together with more efficient splicing.
Results
DOG1 gene regulates the speed of seed germination upon salt stress
Understanding seed dormancy is crucial for agriculture as farmers strive for rapid and uniform germination that synchronizes plant development and reduces costs. Seeds rarely face optimal germination conditions, and salt stress is known to delay seed germination in various plant species (Abel & MacKenzie, 1964; Ungar, 1978; Jones, 1986), including Arabidopsis (Quesada et al, 2002; Vallejo et al, 2010). In agreement, we show that the delay of germination of wild‐type (WT) seeds is proportional to the increasing concentrations of NaCl (Appendix Fig S1A and B). Given the key role of the DOG1 gene in seed dormancy‐mediated control of germination time, we tested whether DOG1 also takes part in delaying seedling establishment under salt stress.
We show that DOG1 knockout (dog1‐3) and upregulation (dog1‐5) mutants (Cyrek et al, 2015; Fedak et al, 2016) display, respectively, weaker and stronger inhibition of germination by various concentrations of NaCl (Fig 1A). Analysis of the germination time curve in the presence of 100 mM NaCl (Fig 1B) suggests that dog1‐3 and dog1‐5 mutants have, respectively, faster and slower germination under salt stress. As reported during seed maturation (Fedak et al, 2016), we confirm that in seeds imbibed in 100 mM NaCl, dog1‐3 and dog1‐5 mutants have, respectively, lower and higher DOG1 expression relative to WT (Fig 1C). These results suggest that DOG1 gene is involved in the physiological response of seeds to salt stress. In our experiments, we applied salt stress during stratification, which releases seed dormancy and leads to no visible differences in germination speed between WT and dog1 mutants in the absence of salt (Fig 1A). This suggests that the role of the DOG1 gene in the salt‐induced delay of germination is independent of its function in primary dormancy.
Figure 1. Seed phenotypic and transcriptomic response to salt stress depends on DOG1 .
-
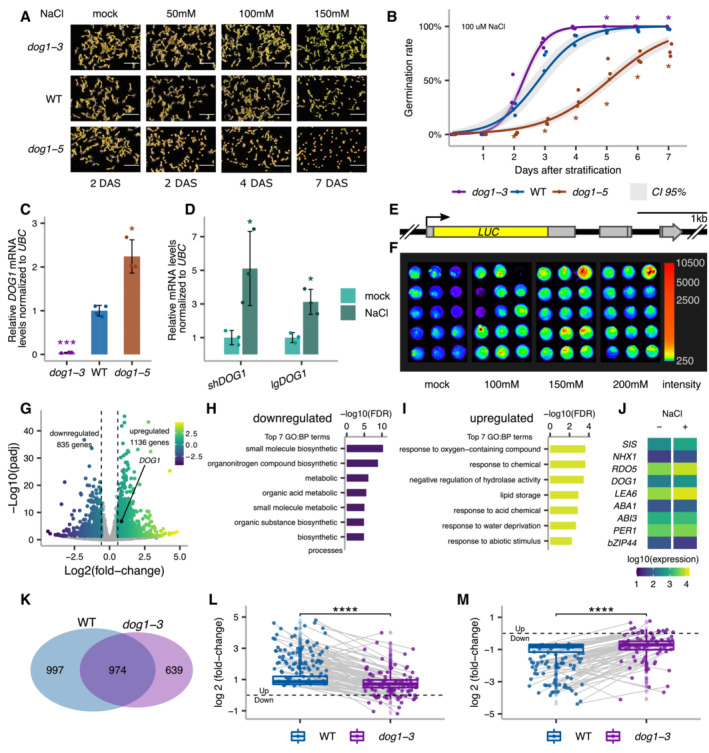
AGermination of dog1‐3 (knockout), WT and dog1‐5 (DOG1 upregulation) seeds in media supplemented with NaCl for the indicated number of days after stratification (DAS). Scale bar represents 5 mm.
-
BGermination rate in 100 mM NaCl measured during 7 days after stratification for seeds of different genotypes. Lines represent the fitted curves with a 95% confidence interval (grey area). *P‐value < 0.05 from two‐tailed Student's t‐test. Data for WT are the same as plotted in Fig 3C.
-
CshDOG1 expression levels normalized to UBC21 (AT5G25760) in dog1‐3 and dog1‐5 relative to WT.
-
DshDOG1 and lgDOG1 expression levels normalized to UBC21 in seeds treated with 100 mM NaCl relative to mock.
-
ESchematics of the pDOG1‐LUC::DOG1 construct with LUC reporter inserted after DOG1 ATG, including complete intergenic regions upstream and downstream of the DOG1 gene (Fedak et al, 2016).
-
FLuciferase reporter activity in seeds in different concentrations of NaCl or mock. The colour bar shows the luminescence in counts per second on a logarithmic scale.
-
GVolcano plot shows DEGs as coloured points (DESeq2; |log2fold‐change| > log2(1.5), FDR < 0.05). The colour scale shows log2fold‐change. DOG1 gene is highlighted in black. The number of downregulated and upregulated genes is provided on the plot.
-
H, ITop 7 nonredundant Gene Ontology terms for biological process (GO:BP) for down‐ (H) and upregulated genes (I).
-
JMean absolute expression levels from 3'RNA‐seq of selected genes known to be involved in salt stress response and/or seed germination. Data from mock (−) and 100 mM NaCl (+).
-
KVenn diagram shows the overlap between genes affected by salt treatment in WT and dog1‐3 (DESeq2; |log2fold‐change| > log2(1.5), FDR < 0.05).
-
L, MBox plots represent the behaviour of genes upregulated (L) and downregulated (M) by salt in WT. Points show genes for which expression is more than two times higher or lower in dog1‐3 compared with WT. Grey lines connect the same genes. The box plot's central band marks the median, boxes mark the first and third quartiles, and whiskers extend the boxes to the largest value no further than 1.5 times the interquartile range. For the comparison of transcriptomic responses, the Wilcoxon rank‐sum test was applied using each gene (DEG in WT) as a biological replicate. Sample size n = 1,136 for both WT and dog1‐3 (L) and n = 835 for both WT and dog1‐3 (M) ****P‐value < 0.0001.
Data information: (C, D) Bars and error bars represent the mean ± SD. Points represent biological replicates. *P‐value < 0.05, ***P‐value < 0.001 from two‐tailed Student's t‐test.
RT–qPCR reveals that after 3 days of imbibition in the presence of NaCl, DOG1 expression is significantly induced relative to mock (Fig 1D and Appendix Fig S1C). We confirmed this using transgenic lines with a luciferase (LUC) reporter inserted after the start codon in DOG1 genomic sequence (pDOG1‐LUC::DOG1; Fedak et al, 2016; Fig 1E and F). Three independent lines show increased luminescence when exposed to NaCl (Appendix Fig S1D), confirming that DOG1 expression is induced by salt. Salt stress imposes a combination of augmented osmotic stress and ionic toxicity. Interestingly, the pDOG1‐LUC::DOG1 signal was induced by NaCl (Fig 1F and Appendix Fig S1D) and KCl (Appendix Fig S2A) but not by PEG or mannitol (Appendix Fig S2B and C). These results suggest that DOG1 expression is induced by ionic stress but not osmotic stress. In summary, our results indicate that DOG1 apart from its well‐known function in seed dormancy is induced in seeds in response to ionic imbalance and plays a role in controlling the speed of germination under salt stress.
Transcriptomic response to salt stress in seeds depends on DOG1 expression
In order to investigate the underlying genome‐wide salt stress response and its dependence on DOG1, we performed 3'RNA‐seq in imbibed seeds from WT and DOG1 knockout dog1‐3 in the presence and absence of 100 mM NaCl. Salt treatment of WT seeds results in 835 downregulated and 1,136 upregulated genes (FDR < 0.05 and |log2FC| > log2(1.5); Fig 1G and Dataset EV1). Downregulated genes are overrepresented for nonredundant gene ontology (GO) terms associated with biosynthetic and metabolic processes (Fig 1H and Dataset EV2). Upregulated genes are overrepresented for nonredundant GO terms associated with stress responses, including water deprivation (Fig 1I and Dataset EV2). These results are consistent with published transcriptomic data from salt stress (Sun et al, 2019; Dorone et al, 2021; Wang et al, 2021; Butt et al, 2022) and provide a baseline for further studies of stress response in seeds. Additionally, we observe that DOG1 and multiple other regulators of seed germination are differentially expressed upon salt treatment (Fig 1J). This explains the changes in germination under the stress and suggests it does not solely depend on DOG1 but a combination of multiple regulators.
Interestingly, only 49% of differentially expressed genes (DEGs) identified in salt‐treated WT seeds are differentially expressed in dog1‐3 upon salt treatment (Fig 1K). Notably, we observe that genes induced by salt in WT are generally induced to a lesser extent in the dog1‐3 mutant, many of those being over two times less upregulated or even downregulated (Fig 1L). Similarly, genes repressed in salt‐treated WT seeds are less down or even upregulated in the dog1‐3 mutant (Fig 1M). These results show that the dog1‐3 mutant has an altered transcriptomic response to salt stress.
DOG1 gene promoter is pervasively transcribed
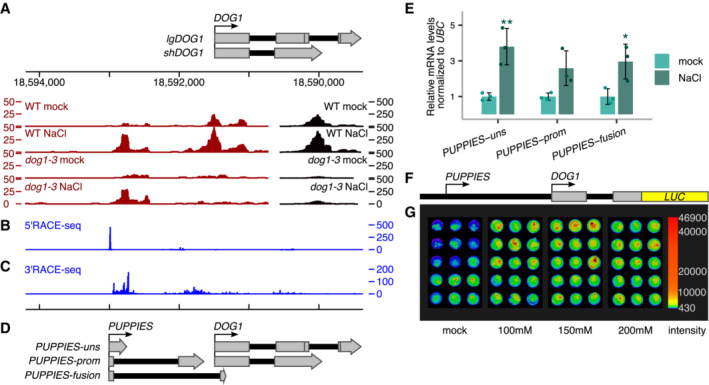
Inspection of 3'RNA‐seq reveals a surprisingly high coverage of reads mapped to the DOG1 promoter and part of exon 1 in salt conditions (Fig 2A), suggesting the existence of previously unannotated sense transcripts in the DOG1 promoter. Of note, reads over this region are also detected in a publicly available RNA‐seq dataset from Arabidopsis seeds (Narsai et al, 2017; Appendix Fig S3A). Using a nanoCAGE‐ and nanoPARE‐based (Salimullah et al, 2011; Schon et al, 2018) 5'RACE‐seq, we confirm transcription of DOG1 promoter originating from a well‐defined TSS around 1.5‐Kb upstream of DOG1 TSS (Fig 2B). 3'RACE‐seq shows that in contrast to the 5′ end, the 3′ ends of this lncRNA are not well defined, giving rise to multiple transcript isoforms (Fig 2C). We named these transcripts PUPPIES due to their proximity to the DOG1 gene. PUPPIES can terminate shortly after their TSS generating unspliced transcripts around 260 bp long (PUPPIES‐uns); PUPPIES can also be spliced into and terminate over a broad region on the DOG1 promoter (PUPPIES‐prom) or can be spliced into the DOG1 coding region terminating inside DOG1 exons 1 and 2 (PUPPIES‐fusion; Fig 2D and Appendix Fig S3B–D). The splicing events were confirmed by PCR followed by Sanger sequencing (Appendix Fig S3E and F). Additionally, as 3'RNA‐seq is based on oligo(dT) priming, at least some PUPPIES isoforms are likely to be polyadenylated. The coding/noncoding potential of PUPPIES transcripts was assessed using Coding Potential Calculator 2.0 (CPC 2.0; Kang et al, 2017) and Coding‐NonCoding Identifying Tool (CNIT; Guo et al, 2019). Both tools classify all tested PUPPIES isoforms as noncoding in contrast to the coding control UBC21 (Appendix Fig S4A and B).
Figure 2. Transcriptional activity of salt‐sensing element on DOG1 promoter.
-
A3'RNA‐seq read coverage on DOG1 locus. Black colour is used for coverage within the scale on the right‐hand side (0–500), and red is used for coverage within the scale on the left‐hand side (0–50). Above is a schematic representation of the annotated transcripts from the DOG1 locus and the chromosome coordinates.
-
B5'RACE‐seq from a primer within the DOG1 promoter reveals a transcription start site (TSS) upstream of the DOG1 gene.
-
C3'RACE‐seq results show novel transcription termination sites (TTS) along the DOG1 promoter and gene body.
-
DSchematics of newly annotated PUPPIES isoforms, co‐directionally transcribed upstream of DOG1.
-
ERT–qPCR with primers specific for PUPPIES‐uns, PUPPIES‐prom, and PUPPIES‐fusion isoforms. Expression levels normalized to UBC21 for 100 mM NaCl‐treated seeds and relative to mock. Bars and error bars represent the mean ± SD. Points represent biological replicates. *P‐value < 0.05, **P‐value < 0.01 from two‐tailed Student's t‐test.
-
FSchematics of psDOG1::LUC construct with Luciferase reporter sequence inserted at the end of DOG1 exon 2 (Fedak et al, 2016).
-
GLuciferase activity in seeds in different concentrations of NaCl or mock. The colour bar shows the luminescence in counts per second on a logarithmic scale.
Here, we show that in seeds imbibed under salt stress, the DOG1 promoter region is extensively transcribed generating lncRNAs named PUPPIES. PUPPIES are a collection of diverse isoforms generated by alternative splicing and termination. Besides, PUPPIES are co‐directionally transcribed and invasive to the DOG1 promoter and gene body.
PUPPIES transcription is responsive to salt stress
Our RNA‐seq data suggest that PUPPIES are induced by salt stress (Fig 2A). To confirm these results, we performed RT–qPCR in seeds imbibed in the absence or presence of NaCl using primers specific for three PUPPIES isoforms: PUPPIES‐uns, PUPPIES‐prom and PUPPIES‐fusion (Fig 2D). We show that salt stress not only induces DOG1 but also all tested PUPPIES isoforms (Figs 2E and EV1A), confirming the initial observation from 3'RNA‐seq.
Figure EV1. PUPPIES response to salt stress.
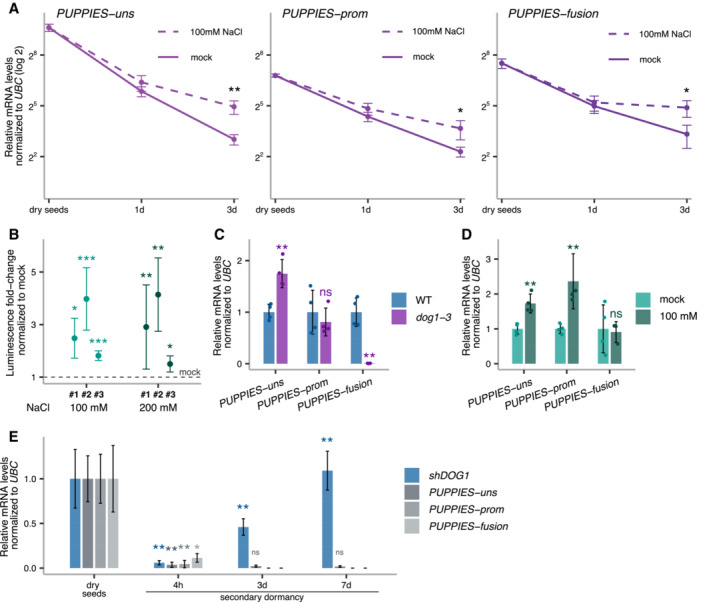
- Relative quantification of PUPPIES‐uns, PUPPIES‐prom and PUPPIES‐fusion (from left to right) normalized to UBC21 in dry seeds and seeds imbibed for 1 and 3 days in mock versus 100 mM NaCl. RT–qPCR points and error bars represent the mean ± SD. *P‐value < 0.05, **P‐value < 0.01 from two‐tailed Student's t‐test.
- Luciferase reporter assay. Plots represent the luminescence fold‐change of seeds under 100 or 200 mM NaCl normalized to mock (horizontal dashed line) for three independent transgenic lines (#1, #2, #3) carrying the reporter construct psDOG1::LUC. Error bars represent the mean ± SD. *P‐value < 0.05, **P‐value < 0.01, ***P‐value < 0.001 from paired Student's t‐test comparing the raw luminescence levels in counts per second between mock and NaCl‐treated samples.
- RT–qPCR for PUPPIES‐uns, PUPPIES‐prom and PUPPIES‐fusion. Expression in seeds treated with 100 mM NaCl in dog1‐3 relative to WT.
- Expression in dog1‐3 mutant seeds treated with 100 mM NaCl relative to mock.
- RT–qPCR for shDOG1, PUPPIES‐uns, PUPPIES‐prom and PUPPIES‐fusion during heat stress induction of secondary dormancy of WT seeds. Bars and error bars represent the mean ± SD with n = 3. Expression levels normalized to UBC21. Expression levels of PUPPIES‐prom and PUPPIES‐fusion at 3 and 7 days were undetectable. Asterisks show the statistical significance for each transcript from the two‐tailed Student's t‐test for the comparison of each timepoint to its previous timepoint. ns P‐value > 0.05, *P‐value < 0.05, **P‐value < 0.01.
Data information: (C, D) Expression levels normalized to UBC21. Bars and error bars represent the mean ± SD. Points represent biological replicates. ns P‐value > 0.05, **P‐value < 0.01 from two‐tailed Student's t‐test.
Next, we used a published transgenic line (Fedak et al, 2016) with the DOG1 promoter region (containing PUPPIES) followed by the DOG1 exon1, intron1 and exon2 region fused to luciferase reporter (Fig 2F). This construct lacks the 3′ end of the DOG1 gene which contains a previously characterized antisense transcript 1GOD (Fedak et al, 2016) as well as DOG1 exon 3 of the lgDOG1 isoforms (Cyrek et al, 2015). Using three independent transgenic lines, we show that this truncated DOG1 construct is still induced by salt (Figs 2G and EV1B). This suggests that the important regulatory elements located at the 3′ end of DOG1 are not required for the induction of DOG1 by salt stress.
PUPPIES are positive regulators of DOG1 expression in response to salt stress
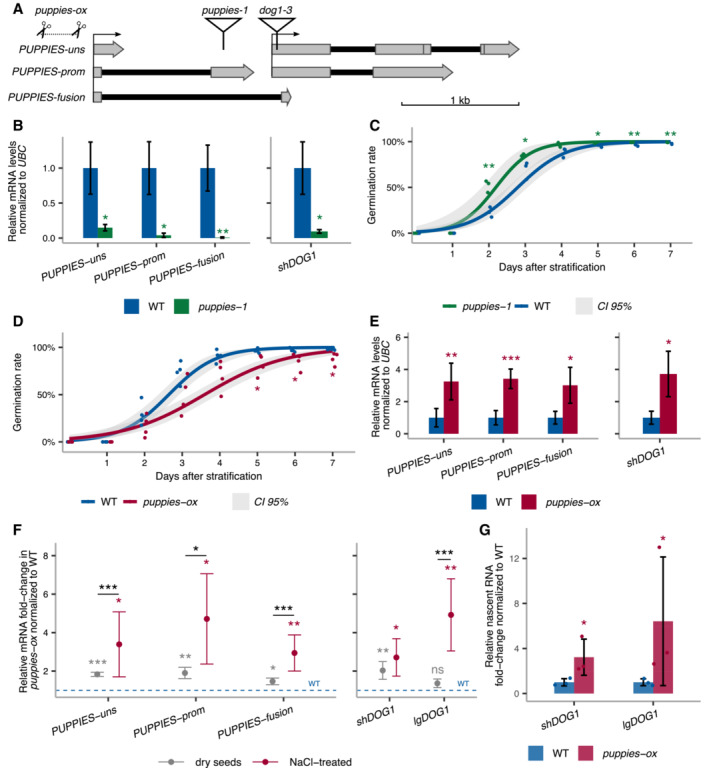
We observe that both PUPPIES and DOG1 are induced by salt. To understand the causative relationship between them, we first tested whether PUPPIES control DOG1 expression. We used a T‐DNA mutant (puppies‐1) with the insertion around 400‐bp upstream of DOG1 TSS (Fig 3A). RT–qPCR shows that all PUPPIES isoforms are significantly downregulated in puppies‐1 (Fig 3B). Notably, in puppies‐1, we also observe a strong downregulation of DOG1 expression (Fig 3B). Consistent with low DOG1 expression, puppies‐1 mutants display a weaker inhibition of seed germination upon salt stress (Fig 3C). These results suggest a positive impact of PUPPIES on DOG1 expression and delay of germination.
Figure 3. PUPPIES‐mediated changes in DOG1 gene expression and salt stress response.
-
ASchematics of DOG1 locus with PUPPIES and DOG1 TSS indicated by black arrows. The T‐DNA insertions in puppies‐1 and dog1‐3 mutants, and CRISPR‐Cas9 deletion in puppies‐ox are shown.
-
BRT–qPCR with primers specific for PUPPIES‐uns, PUPPIES‐prom, PUPPIES‐fusion and shDOG1. Expression levels normalized to UBC21 in seeds treated with 100 mM NaCl in the puppies‐1 mutant relative to WT.
-
C, DGermination time‐course in 100 mM NaCl after stratification for puppies‐1 (C) and puppies‐ox (D) relative to WT. Lines represent fitted curves with a 95% confidence interval (grey area), dots represent data points, *P‐value < 0.05 from the two‐tailed Student's t‐test. (C) Data for WT are the same as plotted in Fig 1B.
-
ERT–qPCR (same as in B) in puppies‐ox relative to WT.
-
FRT–qPCR fold‐change induction of PUPPIES‐uns, PUPPIES‐prom, PUPPIES‐fusion, shDOG1 and lgDOG1 in puppies‐ox relative to WT (blue dashed line), in dry (light grey) and imbibed seeds in the presence of 100 mM NaCl (red). Significance from the two‐tailed Student's t‐test for comparing dry seeds of WT and puppies‐ox is represented with light grey asterisks, and salt‐imbibed seeds of WT and puppies‐ox are represented with red asterisks. Black asterisks represent significance from two‐way ANOVA with Tukey's multiple comparisons test for dry seeds versus imbibed seeds. ns P‐value > 0.05, *P‐value < 0.05, **P‐value < 0.01, ***P‐value < 0.001. Error bars represent the mean ± SD. n = 4 biological replicates.
-
GRT–qPCR with primers for shDOG1 and lgDOG1 on nascent RNA from seeds imbibed in 100 mM NaCl from puppies‐ox relative to WT. Nascent RNA levels were normalized to UBC21. Bars and error bars represent the mean ± SD. Points represent biological replicates. Statistical significance from two‐tailed Student's t‐test. *P‐value < 0.05.
Data information: (B, E) Bars and error bars represent the mean ± SD. Statistical significance from two‐tailed Student's t‐test. *P‐value < 0.05, **P‐value < 0.01, ***P‐value < 0.001.
Importantly, RT–qPCR on dog1‐3 shows that DOG1 knockout does not result in downregulation of PUPPIES, except for the isoform in which transcription is directly blocked by the T‐DNA insertion in this mutant (Fig EV1C). We speculate that the loss of PUPPIES‐fusion caused by the T‐DNA insertion on dog1‐3 leads to a compensating increase in the levels of unspliced PUPPIES (PUPPIES‐uns; Fig EV1C). Additionally, we show that PUPPIES expression is still induced by salt in the dog1‐3 background (Fig EV1D). The same could be observed in the 3'RNA‐seq data for the dog1‐3 mutant (Fig 2A). In short, PUPPIES knock‐down is associated with a strong DOG1 downregulation, yet DOG1 knockout does not downregulate PUPPIES nor affect PUPPIES responsiveness to salt. Moreover, DOG1 gene expression is known to be induced in seeds during imbibition under prolonged heat stress causing a re‐induction of seed dormancy, called secondary seed dormancy (Argyris et al, 2008, Leymarie et al, 2008). In agreement with published data (Krzyszton et al, 2022), DOG1 expression is strongly induced during secondary dormancy induction. By contrast, PUPPIES expression is not induced but rather shut down (Fig EV1E). This supports the idea that PUPPIES regulation differs from that of DOG1 and that PUPPIES are induced by only some of the DOG1‐inducing signals.
In contrast to secondary dormancy, during seed maturation, PUPPIES expression has the same dynamics as DOG1 (Appendix Fig S5A). In agreement, puppies‐1 displays weaker primary seed dormancy (Appendix Fig S5B), a result consistent with the idea that PUPPIES induce DOG1 expression not only in response to salt but also during primary seed dormancy establishment. We propose that PUPPIES are partially independent of DOG1 and that upon salt stress PUPPIES act upstream of, and as a positive regulator of DOG1 expression to control seed germination.
Next, we used CRISPR‐Cas9 aiming to create deletions in the PUPPIES region. We obtained a mutant with slower seed germination under salt stress (Fig 3D). Sanger sequencing reveals a deletion (from −186 to −449) upstream of PUPPIES TSS (Fig 3A, and Appendix Fig S5C and D). This leads us to hypothesize that the deletion may remove a negative regulatory element on the PUPPIES promoter resulting in PUPPIES overexpression, which would explain the phenotype. RT–qPCR confirms PUPPIES upregulation in the deletion mutant (puppies‐ox; Fig 3E) and induction of DOG1 expression in seeds under salt stress (Fig 3E). Additionally, we show that puppies‐ox seeds display stronger primary dormancy (Appendix Fig S5E) and higher expression of PUPPIES and DOG1 compared with WT at late stages of seed maturation (Appendix Fig S5F).
Additionally, we used a dCas9 system to interfere with PUPPIES transcription without changing the genomic sequence, which could alter DOG1 expression. This was achieved using transgenes carrying one of three different pairs of sgRNAs together with a constitutively expressed catalytically inactive or “dead” Cas9 (dCas9) protein which is thought to bind but not to cleave DNA and therefore has been used as a roadblock for transcription (Bikard et al, 2013; Qi et al, 2013; Piatek et al, 2015). We show that guiding dCas9 to three different regions of PUPPIES (Fig EV2A) causes faster germination of seeds under salt stress (Fig EV2B). We selected four independent transgenic lines from one construct for gene expression analysis. As expected, PUPPIES expression is significantly downregulated in the dCas9 lines, importantly consistent with faster germination (Fig EV2B) we observe downregulation of DOG1 expression (Fig EV2C). These results support the idea that PUPPIES affect the expression of DOG1 independently of changes in its genomic sequence.
Figure EV2. Blocking PUPPIES with dCas9.
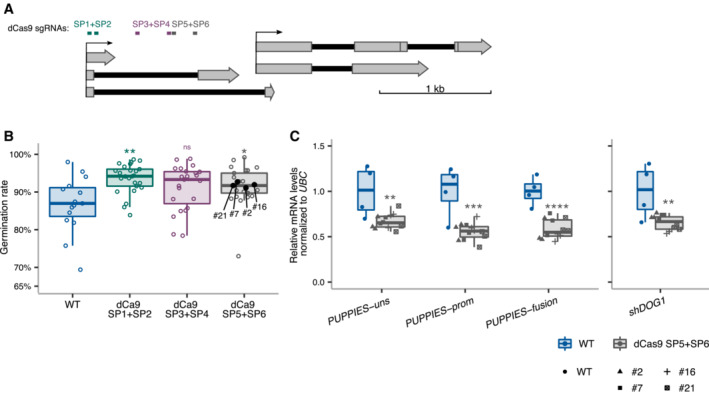
- Schematics of DOG1 locus with PUPPIES and DOG1 TSS indicated by black arrows. Two sgRNAs per construct were introduced in WT targeting a ubiquitously expressed “dead” Cas9 protein (dCas9) to block PUPPIES transcription. The sgRNA positions are: SP1 + SP2 (in green), SP3 + SP4 (in purple), SP5 + SP6 (in grey).
- Box plots showing the percentage of germination in 150 mM NaCl at 4 days after stratification for WT (blue) and T2 seeds from selected transformants carrying dCas9 and the sgRNA pairs SP1 + SP2 (green), SP3 + SP4 (purple), SP5 + SP6 (grey). Points show the germination of seeds from each individual transgenic plant. Four independent SP5 + SP6 plants (#2, #7, #16, #21, represented by black points) with germination closest to the median were propagated and gene expression analyses (C) were carried out in the T3 seeds imbibed in the presence of 100 mM NaCl. Points represent biological replicates.
- Box plots show the expression levels measured by RT–qPCR of PUPPIES‐uns, PUPPIES‐prom, PUPPIES‐fusion and shDOG1 normalized to UBC21 in the four different transgenic lines of SP5 + SP6 dCas9 (grey) relative to WT (blue). Points represent biological replicates.
Data information: (B, C) The box plot's central band marks the median, boxes mark the first and third quartiles, and whiskers extend the boxes to the largest value no further than 1.5 times the interquartile range. Statistical significance from two‐tailed Student's t‐test. ns P‐value > 0.05, *P‐value < 0.05, **P‐value < 0.01, ***P‐value < 0.001, ****P‐value < 0.0001.
Based on a series of PUPPIES mutants and the correlation of expression patterns during seed maturation and salt stress, we suggest that PUPPIES lncRNAs act as positive regulators of DOG1 expression. Additionally, PUPPIES seem to be important for DOG1 regulation in seeds under salt stress in contrast to heat stress.
PUPPIES induce DOG1 in cis
To understand whether PUPPIES work in cis or in trans, we expressed PUPPIES from a different allele to that expressing DOG1. For that, we crossed the PUPPIES knock‐down mutant puppies‐1 with the DOG1 knockout dog1‐3. We then asked whether PUPPIES, expressed from the dog1‐3 allele, are able to induce DOG1 expression from the puppies‐1 allele in the heterozygous F1 generation (Fig EV3A). In seeds imbibed in the presence of NaCl, RT–qPCR shows higher levels of PUPPIES in the heterozygous F1 relative to homozygous puppies‐1 F1 (Fig EV3B), consistent with PUPPIES transcription from the dog1‐3 allele. By contrast, we do not detect higher levels of DOG1 expression in the heterozygous F1 seeds (Fig EV3B). These results suggest that PUPPIES are unable to activate DOG1 expression in trans. We further tested this hypothesis by crossing either WT or puppies‐ox with two independent psDOG1::LUC reporter lines (Fig EV3C). In the heterozygous F1 generation, we measured DOG1 expression from the psDOG1::LUC allele using primers specific to DOG1‐LUC transcripts to test whether the higher expression of PUPPIES from the puppies‐ox allele leads to the activation of the DOG1 reporter. RT–qPCR in F1 seeds imbibed in the presence of NaCl show no changes in DOG1‐linked reporter in any of the crosses (Fig EV3D), suggesting that changes in PUPPIES expression originating from puppies‐ox allele does not affect DOG1 expression from the transgene. Based on these results, we hypothesize that PUPPIES lncRNAs induce DOG1 expression in cis but not in trans.
Figure EV3. PUPPIES do not activate DOG1 expression in trans .
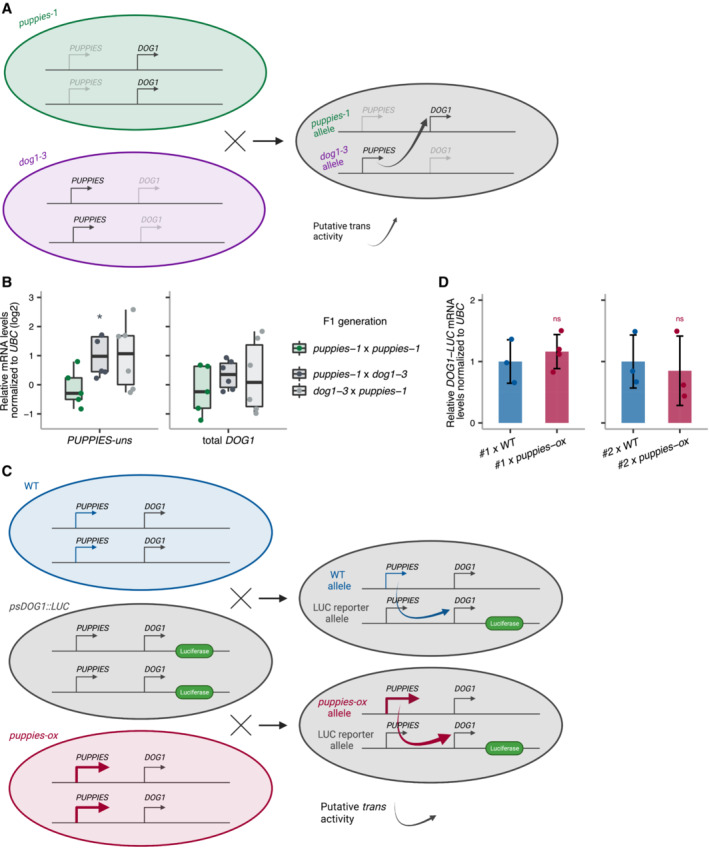
- Schematic representation of the cross between both diploid homozygous puppies‐1 and dog1‐3 mutants. The heterozygous F1 is used to test if supplying PUPPIES expression (from the dog1‐3 allele) induces DOG1 expression (from the puppies‐1 allele) compared with the homozygous puppies‐1.
- RT–qPCR for PUPPIES‐uns and total DOG1 normalized to UBC21 in F1 seeds imbibed in the presence of 100 mM NaCl. y‐axis in logarithmic scale. Points represent biological replicates. The box plot's central band marks the median, boxes mark the first and third quartiles, and whiskers extend the boxes to the largest value no further than 1.5 times the interquartile range. Statistical significance from two‐tailed Student's t‐test. *P‐value < 0.05.
- Schematic representation of the crosses between psDOG1::LUC and either WT or puppies‐ox. The heterozygous F1 from psDOG1::LUC crossed with puppies‐ox is used to test if supplying PUPPIES expression (from the puppies‐ox allele) induces DOG1‐LUC expression (from the reporter allele) relative to the levels of DOG1‐LUC in the psDOG1::LUC crossed with WT.
- RT–qPCR with primers specific for DOG1‐LUC in F1 seeds of two independent psDOG1::LUC lines (#1 and #2) crossed with either WT or puppies‐ox imbibed in the presence of 100 mM NaCl. Expression was normalized to UBC21. Bars and error bars represent the mean ± SD. Points represent biological replicates. ns P‐value > 0.05 from two‐tailed Student's t‐test.
PUPPIES regulate DOG1 transcription
As shown previously, maturing seeds of the puppies‐ox mutant have higher expression of DOG1 and PUPPIES when compared to WT. Therefore, the observed high levels of DOG1 and PUPPIES in puppies‐ox seeds imbibed in salt could be a consequence of persistently high levels of mRNA accumulated during seed maturation in this mutant. Contrary to this idea, when compared to WT, the puppies‐ox mutant shows a higher fold induction of PUPPIES and DOG1 in seeds under salt stress than the fold induction observed in dry seeds (Fig 3F). This suggests that in response to salt, the high levels of PUPPIES and DOG1 in puppies‐ox are a result of de novo transcription after imbibition, and not pre‐existing high mRNA levels in dry seeds.
Upstream pervasive transcription has been demonstrated to silence downstream genes (Nguyen et al, 2014). Surprisingly, PUPPIES positively regulate the levels of DOG1 steady‐state mRNA. To test PUPPIES effect on DOG1 expression at the transcriptional level, we employed a procedure to isolate nascent RNAs attached to the chromatin (chrRNA). RT–qPCR on chrRNA shows higher levels of DOG1 nascent RNA in puppies‐ox (Fig 3G). This suggests that PUPPIES act by activating DOG1 at the transcriptional level.
smFISH reveals changes in DOG1 transcription dynamics
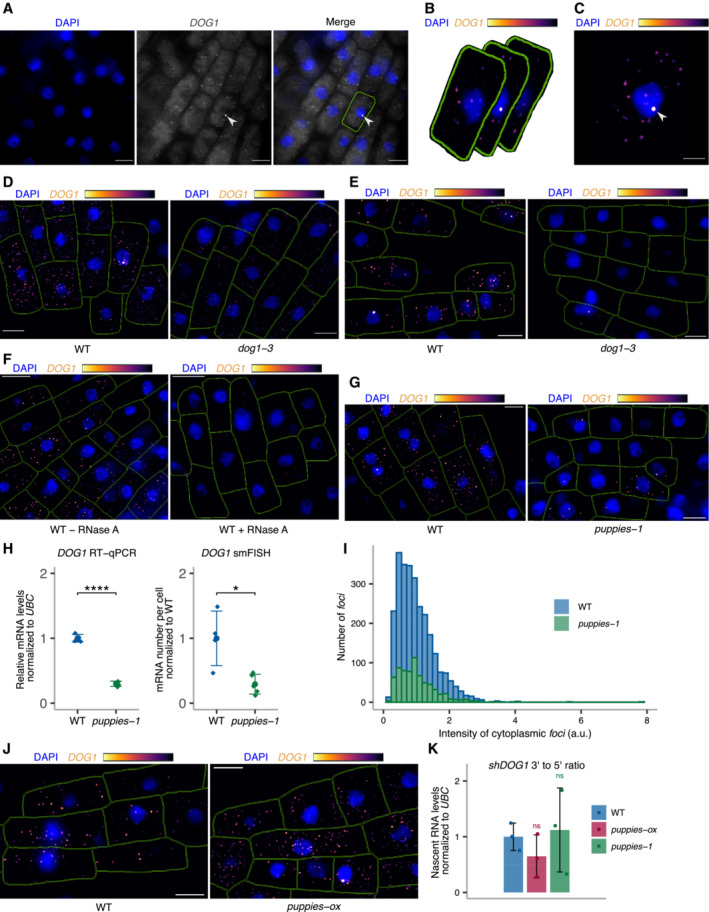
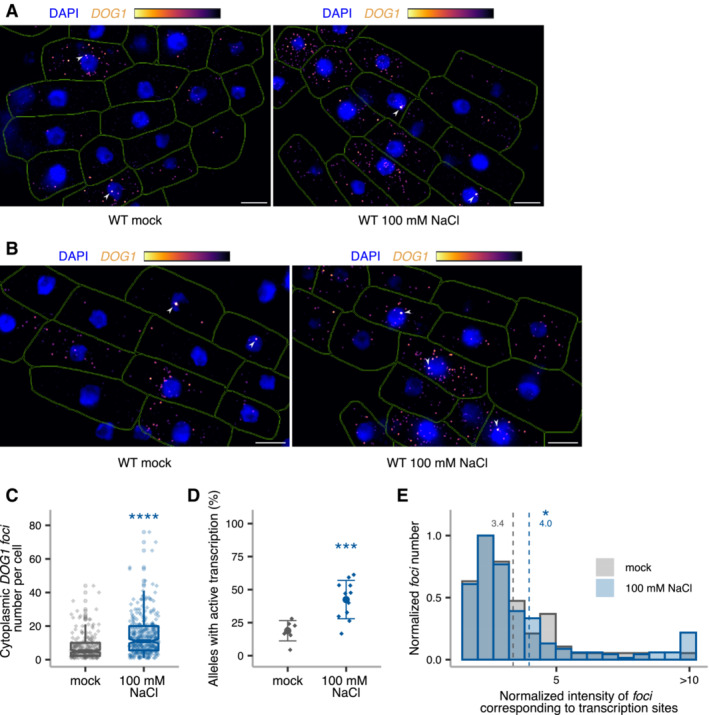
Single‐molecule RNA fluorescence in situ hybridization (smFISH) is a technique used to image single RNA transcripts, thus allowing the examination of transcriptional features of gene expression regulation (Femino et al, 1998; Raj et al, 2006, 2008). In plants, this method was previously used for the roots of young seedlings to describe multiple aspects of transcriptional regulation of the FLC gene (Rosa et al, 2016; Duncan & Rosa, 2017; Ietswaart et al, 2017). Here, we adapted this method to image DOG1 transcripts in Arabidopsis embryos. DOG1 smFISH reveals multiple foci distributed in the cytoplasm and nucleus of the embryo cells from seeds under salt stress (Figs 4A and EV4A–C), which were absent in dog1‐3 (Fig EV4D and E), and sensitive to RNase A treatment (Fig EV4F). A fraction of cells shows one or two brighter foci that can be interpreted as genomic loci with active transcription (transcription sites; Figs 4A, and EV4A and C) containing multiple nascent transcripts as reported before (Mueller et al, 2013; Gómez‐Schiavon et al, 2017). We detect on average 20 foci (DOG1 transcripts) per cell (Fig 4B). Importantly, smFISH shows a drastic reduction of cytoplasmic foci (DOG1 mRNA) in puppies‐1 compared with WT (Figs 4C and D, and EV4G), consistent with RT–qPCR (Fig EV4H). The distribution of intensities of cytoplasmic foci in puppies‐1 is not significantly changed compared with WT (Fig EV4I). Notably, we observe a significant reduction in intensities for the brightest nuclear foci that we assume to correspond to DOG1 transcription sites (TS; Fig 4C and E). This suggests that puppies‐1 has a lower number of nascent or chromatin‐attached DOG1 transcripts per round of transcription. Additionally, we detect a lower fraction of cells with TS foci in puppies‐1 (Fig 4F).
Figure 4. DOG1 transcriptional regulation by PUPPIES revealed by single‐molecule RNA FISH.
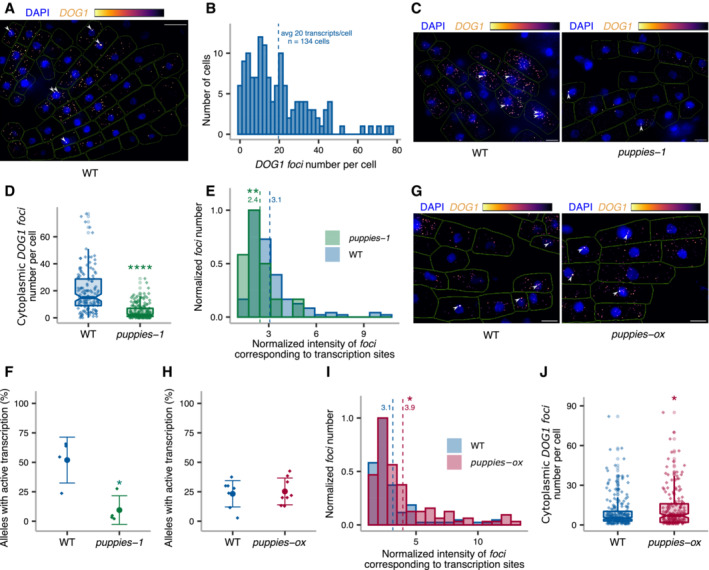
- z‐stack max‐projection image of smFISH for DOG1 RNA. The “Inferno” colour scale is used for the intensity of fluorescence from Quasar670 fluorophore (DOG1). The blue colour shows fluorescence from DAPI (nuclei staining). Arrowheads point to foci corresponding to transcription sites (TS). The scale bar is 20 μm.
- Distribution of cytoplasmic DOG1 foci per cell in WT. The blue vertical dashed line indicates the average.
- z‐stack max‐projection images of DOG1 smFISH in seeds imbibed in 100 mM NaCl of WT (left) versus puppies‐1 (right). Arrowheads point to foci corresponding to TS. The scale bar is 5 μm.
- Notched box plots showing the cytoplasmic DOG1 foci number per cell in WT and puppies‐1. Diamond‐shaped points represent each cell, n = 134 cells from WT and n = 182 cells from puppies‐1.
- Distribution of intensities of foci corresponding to DOG1 transcription sites in WT and puppies‐1. In the x‐axis is the fluorescence intensity fold‐change of foci classified as TS to the average intensity of nuclear foci. In the y‐axis is the number of foci normalized to their maximum value. Vertical dashed lines indicate the average fluorescence fold‐change for WT (3.1) and puppies‐1 (2.4). n = 135 foci from WT, n = 29 foci from puppies‐1.
- Plot showing the frequency of alleles with detected foci corresponding to DOG1 TS for WT and puppies‐1. Points and error bars represent the mean ± SD. Diamond‐shaped points represent single embryos.
- z‐stack max‐projection images from seeds imbibed in 100 mM NaCl of WT (left) versus puppies‐ox (right). Arrowheads point to foci corresponding to TS. The scale bar is 5 μm.
- Same as (F), for WT and puppies‐ox.
- Same as in (E), in WT and puppies‐ox. Vertical dashed lines indicate the average fluorescence fold‐change for WT (3.1) and puppies‐ox (3.9). n = 107 foci from WT and n = 105 foci from puppies‐ox.
- Notched box plot, same as (D), in WT and puppies‐ox. n = 212 cells from WT, n = 179 cells from puppies‐ox.
Data information: (D–F, H–J) Statistical significance from two‐tailed Student's t‐test. *P‐value < 0.05, **P‐value < 0.01, ****P‐value < 0.0001. (D and J) The box plot's central band marks the median, lower and upper box limits mark the first and third quartiles, whiskers extend the boxes to the largest value no further than 1.5 times the interquartile range, and the notches extend to 1.58 times the interquartile range divided by sqrt (n).
Figure EV4. DOG1 single‐molecule RNA FISH.
-
ASingle z‐section image of smFISH for DOG1 in embryo cells from imbibed seeds. Separate DAPI (blue) and DOG1 (grey) channels are shown on the left and middle images. A merged image is shown on the right. Manual segmentation (green outline) of the cells is performed based on a certain level of background fluorescence visible on the DOG1 channel. Arrowhead points to the focus corresponding to the transcription site (TS). For each cell, the segmented area is projected to the z‐sections above and below corresponding, respectively, to the top and bottom edges of the cell. Scale bar is 5 μm.
-
BAfter the projection of the cell segmentation across the z‐stack, the image is denoised in each z‐section. A maximum projection of the denoised z‐stack is then performed to obtain a representative 2D image (C). The denoised z‐stack is also used for the reconstruction of the cell and foci detection in 3D (see Materials and Methods section).
-
CArrowhead points to the focus corresponding to the TS. Scale bar is 2 μm.
-
D, Ez‐stack max‐projection images of DOG1 smFISH in seeds imbibed in 100 mM NaCl of WT (left) versus dog1‐3 (right). The scale bar is 5 μm. Please note that WT picture in panel E is the same representative picture as used in Fig 4G.
-
Fz‐stack max‐projection images of DOG1 smFISH in WT without (left) versus with (right) RNase A treatment before hybridization. The scale bar is 5 μm.
-
Gz‐stack max‐projection images of DOG1 smFISH in seeds imbibed in 100 mM NaCl of WT (left) versus puppies‐1 (right). The scale bar is 5 μm.
-
HComparison of fold‐change of DOG1 expression from RT–qPCR (left) with cytoplasmic DOG1 foci number per cell from smFISH (right; replotted data shown in Fig 4E) in puppies‐1 relative to WT. Points and error bars represent the mean ± SD. Diamond‐shaped points in the RT–qPCR plot represent a pool of seeds collected from five plants, and diamond‐shaped points in the smFISH plot represent a single embryo. Statistical significance from two‐tailed Student's t‐test. *P‐value < 0.05, ****P‐value < 0.0001.
-
IDistribution of intensities of cytoplasmic DOG1 foci in WT and puppies‐1 in arbitrary units (a.u.).
-
Jz‐stack max‐projection images of DOG1 smFISH in seeds imbibed in 100 mM NaCl of WT (left) versus puppies‐ox (right). The scale bar is 5 μm.
-
KRT–qPCR quantification of 3′ end and 5' end of shDOG1 on nascent RNA from seeds imbibed in 100 mM NaCl from WT, puppies‐ox and puppies‐1. The plot shows the ratio of 3′ end to 5′ end relative to WT. Nascent RNA levels were normalized to UBC21. Bars and error bars represent the mean ± SD. Statistical significance from two‐tailed Student's t‐test. ns P‐value > 0.05.
By contrast, puppies‐ox shows no significant difference in the frequency of the cells with active DOG1 transcription, compared with WT (Fig 4G and H). One possibility is that the frequency of active transcription is intrinsic to the T‐DNA insertion. On the contrary, the observed changes may be a consequence of lower intensity of TS containing only a few transcribing polymerases, which will become indistinguishable from the intensity of one full‐length transcript, and will therefore not be counted in our analysis as a DOG1 TS but as an mRNA.
Yet, in agreement with changes in puppies‐1, we do observe a higher intensity of TS in puppies‐ox (Fig 4G and I), suggesting a higher number of nascent or chromatin‐attached DOG1, consistent with RT–qPCR from chrRNA (Fig 3G). The release of Pol II from promoters often happens in bursts with the transcription by several Pol II enzymes followed by a period of absence of initiation events, a phenomenon called transcriptional bursting. The number of Pol II per burst of transcription is defined as transcriptional burst size (Raj et al, 2006; Cai et al, 2008; Zenklusen et al, 2008; Suter et al, 2011). Our results could suggest that PUPPIES affect DOG1 burst size. However, the smFISH intensity signal of TS is also affected by the length of the transcripts, as longer nascent transcripts allow the binding of a higher number of fluorescently labelled probes. Therefore, we isolated chrRNA and calculated the ratio of 3′ to 5′ ends for DOG1, so that a higher 3′ to 5′ ends ratio would reflect increased abundance of longer transcripts.
Our analysis shows no significant changes in the ratio between 3′ and 5′ ends of chrRNA in the PUPPIES mutants compared with WT, which suggests that PUPPIES do not change the length of DOG1 nascent transcripts attached to chromatin, but rather the number of Pol II molecules per round of DOG1 transcription (burst size). Consistent with that, we also observe an increase in the number of cytoplasmic DOG1 mRNA in the puppies‐ox mutant (Fig 4J).
The smFISH experiments reveal changes in mRNA number and transcriptional bursting in the PUPPIES mutant's seeds under salt stress. In agreement, smFISH analysis on WT embryos from mock and NaCl‐treated seeds shows that salt stress induces the number of DOG1 mRNA per cell (Fig EV5A–C). A result that is consistent with our previous data (Figs 1D and F, 2A and G, and Appendix Fig S1C). Additionally, we observe a higher frequency of cells with active DOG1 transcription (Fig EV5D) and higher intensity of DOG1 TS (Fig EV5E).
Figure EV5. DOG1 single‐molecule RNA FISH in response to salt stress.
-
A, Bz‐stack max‐projection images of DOG1 smFISH in WT embryos from imbibed seeds in mock (left) versus 100 mM NaCl (right). Arrowheads point to foci corresponding to the transcription sites (TS). The scale bar is 5 μm.
-
CNotched box plots showing the cytoplasmic DOG1 foci number per cell in mock versus salt treatment. Diamond‐shaped points represent each cell, n = 208 cells from mock and n = 309 cells from NaCl‐treated. The box plot's central band marks the median, lower and upper box limits mark the first and third quartiles, whiskers extend the boxes to the largest value no further than 1.5 times the interquartile range, and the notches extend to 1.58 times the interquartile range divided by sqrt (n).
-
DPlot showing the frequency of alleles with detected foci corresponding to DOG1 transcription sites for mock versus NaCl‐treated. Points and error bars represent the mean ± SD. Diamond‐shaped points represent single embryos.
-
EDistribution of intensities of foci corresponding to DOG1 TS in mock and NaCl‐treated. In the x‐axis is the fluorescence intensity fold‐change of foci classified as TS to the average intensity of nuclear foci. In the y‐axis is the number of foci normalized to their maximum value. Vertical dashed lines indicate the average fluorescence fold‐change for mock in green (3.4) and NaCl‐treated in blue (4.0). n = 47 foci from mock and n = 159 foci from NaCl‐treated.
Data information: (C–E) Statistical significance from two‐tailed Student's t‐test. *P‐value < 0.05, ***P‐value < 0.001, ****P‐value < 0.0001.
Our results suggest that PUPPIES modulate features of DOG1 transcriptional bursting such as burst size and are consistent with a recent work showing the involvement of cis‐acting lncRNAs in controlling transcriptional burst size or frequency of the nearby genes (Johnsson et al, 2022).
PUPPIES regulate DOG1 transcription pausing and processivity
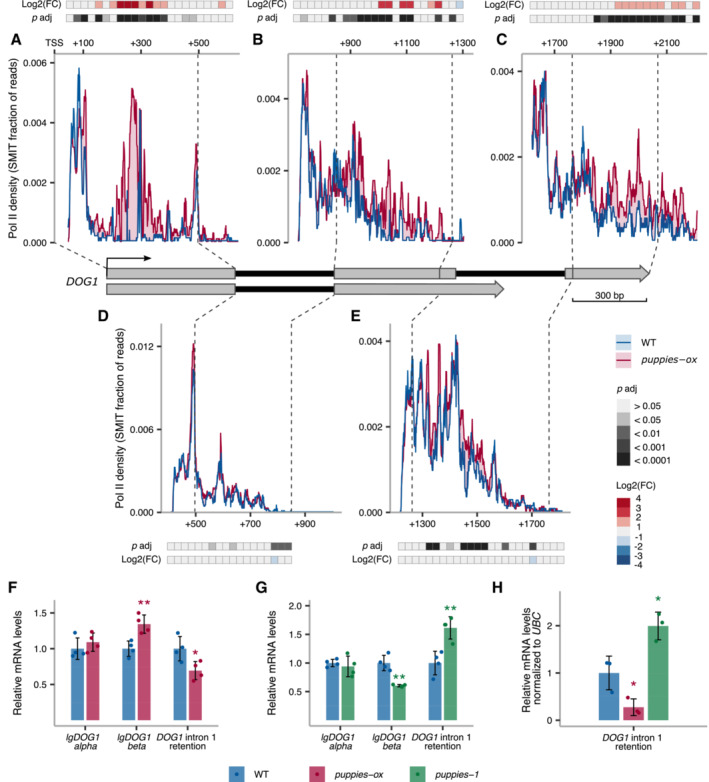
Given the observed changes in Pol II burst size, we speculate that PUPPIES could affect DOG1 Pol II processivity. We, therefore, used a modified version of targeted nascent RNA analysis (Oesterreich et al, 2016; Herz et al, 2019) referred to as targeted NET‐seq (Native Elongating Transcript sequencing) hereafter. Briefly, chrRNA was purified from seeds imbibed under salt stress, adapters ligated at 3′ ends, followed by library preparation using primers spanning the entire DOG1 gene, and next‐generation sequencing. After UMI‐based PCR duplicates removal and filtering reads mapped to DOG1, we ended up with around 19,000 unique reads per each biological replicate of WT and puppies‐ox. For each primer, we plotted 3′ ends of reads, giving us a single nucleotide resolution map of Pol II position along the DOG1 transcriptional unit.
Strikingly, we observe a drastic increase of Pol II density in puppies‐ox mutant around 300‐bp downstream of DOG1 TSS, where a pause site is revealed by a sharp peak in WT (Fig 5A). These results suggest that PUPPIES overexpression causes Pol II to strongly accumulate at this DOG1 promoter‐proximal pause site. Since the total unspliced PUPPIES attached to the chromatin (including those that may contain DOG1 exon 1) constitutes only 2.9% of the total chrRNA containing DOG1 exon 1 (Appendix Fig S6A), the strong NET‐seq peak is unlikely to reflect PUPPIES‐transcribing Pol II density over this region. Moreover, targeted NET‐seq shows that in puppies‐ox, Pol II travels slower through exons (Fig 5A–C) but not through introns (Fig 5D and E). The enhanced promoter‐proximal pausing together with slower transcription over exons but not introns suggest an augmented difficulty in Pol II transcribing through nucleosomes. We overlapped our targeted NET‐seq signal with the mapping of nucleosome occupancy on the DOG1 locus from public MNase‐seq data (Data ref: Luo et al, 2020b; Appendix Fig S6B) and nucleosome occupancy prediction based on DNA sequence (van der Heijden et al, 2012; Appendix Fig S6C). Notably, we detect a nucleosome at or immediately downstream of nearly all regions with enhanced pausing in the puppies‐ox mutant, including the promoter‐proximal pausing site (Appendix Fig S6D and E). This observation supports the hypothesis that PUPPIES enhance DOG1 expression by modulating DOG1 transcriptional dynamics through nucleosomes.
Figure 5. DOG1 transcription pausing and processivity dependent on PUPPIES .
-
A–EThe profile of Pol II during DOG1 transcription. Plots show the fraction of unique reads from targeted NET‐Seq using rolling median (11 nt). Targeted libraries for sequencing of DOG1 locus were obtained by usage of five primers across the gene. Pol II dynamics are analysed separately for each region sequenced in exon 1 (A), exon 2 (B), exon 3 (C), intron 1 (D) and intron 2 (E). The x‐axis shows the distance in bp from DOG1. A light red colour fill highlights the regions where Pol II density is higher in puppies‐ox. A light blue colour fill highlights the regions where Pol II density is higher in WT. For each plot, coloured tiles represent the fold‐change (puppies‐ox/WT) on a logarithmic scale. Greyscale tiles represent the result of a statistical test for the difference between genotypes from the two‐tailed Student's t‐test after Bonferroni correction. Tiles correspond to a 25 bp bin each. Vertical dashed lines connect the exon boundaries on the plots with the schematics of the DOG1 gene with grey boxes representing exons and black lines representing introns.
-
F, GRT–qPCR measurement of alternative splicing of lgDOG1 alpha and beta isoforms and unspliced intron 1 DOG1 isoforms levels in puppies‐ox, and puppies‐1 relative to WT, in seeds treated with 100 mM NaCl.
-
HRT–qPCR quantification of DOG1 intron 1 retention on nascent RNA from seeds imbibed in 100 mM NaCl from puppies‐ox and puppies‐1 relative to WT. Nascent RNA levels were normalized to UBC21.
Data information: (F–H) Bar and error bars represent the mean ± SD, and points represent biological replicates. *P‐value < 0.05, **P‐value < 0.01 from two‐tailed Student's t‐test.
In summary, our extensive transcriptional analyses reveal that PUPPIES induce DOG1 transcription. Surprisingly, the positive impact of PUPPIES on DOG1 transcription is associated with an augmented promoter‐proximal pausing and slower transcription through exonic regions, possibly by quelling Pol II ability to pass through nucleosomes. We hypothesize that at the same time these changes allow the loading of a higher number of Pol II molecules per round of transcription as revealed by smFISH.
PUPPIES modulation of DOG1 transcription feeds back on the splicing outcome
Slower transcription processivity was shown to enhance splicing efficiency and remodel alternative splicing events (Neugebauer, 2002; Naftelberg et al, 2015; Saldi et al, 2016). In plants, transcription elongation rate was shown before to contribute to alternative splicing and gene expression regulation, including DOG1 (Dolata et al, 2015; Herz et al, 2019). Since in puppies‐ox we observe changes consistent with slower transcription of DOG1 exons, we postulate that PUPPIES also affect DOG1 splicing. Indeed, puppies‐ox displays enhanced DOG1 splicing efficiency revealed by lower DOG1 intron 1 retention levels and changes in DOG1 intron 2 alternative splicing (Fig 5F). In agreement, we observe lower splicing efficiency and opposite DOG1 alternative splicing changes in puppies‐1 (Fig 5G). Furthermore, we tested whether the splicing changes observed in steady‐state mRNA were also detected in nascent RNAs. RT–qPCR on chrRNA showed higher and lower splicing efficiency in puppies‐ox and puppies‐1, respectively (Fig 5H), consistent with the previous results (Fig 5F and G).
If the differences in transcription dynamics observed by targeted NET‐seq in puppies‐ox were a consequence of splicing, we would expect those to be observed during/after the transcription of introns. Instead, we observe the most striking difference in Pol II pausing at the beginning of the gene. This suggests that splicing of DOG1 is rather a consequence, and not a cause of Pol II processivity.
Discussion
Based on our results, we propose a model in which the DOG1 promoter region generates multiple lncRNAs, named PUPPIES. PUPPIES are induced by salt stress and their pervasive transcription induces DOG1 expression (Fig 6). Surprisingly, on the DOG1 locus, PUPPIES invasive transcription does not result in a negative interference with gene expression but in the induction of DOG1 expression. This causes a delay in seed germination under salt stress. The positive effect of PUPPIES on DOG1 is associated with changes in Pol II transcriptional dynamics. Particularly, PUPPIES induce stronger Pol II promoter‐proximal pausing on the DOG1 gene, slower transcription through exons, and loading of a higher number of Pol II complexes per DOG1 transcriptional burst. Ultimately, PUPPIES‐mediated changes in DOG1 transcription enhance splicing efficiency and affect alternative splice‐site selection.
Figure 6. Model for molecular regulation of DOG1 gene expression mediated by PUPPIES in seeds under salt stress.
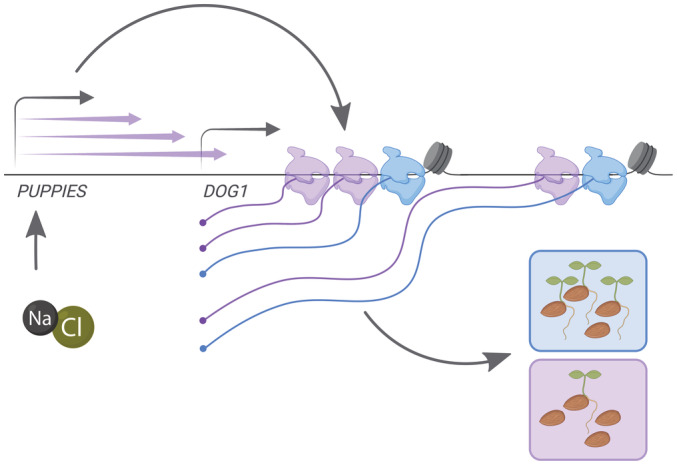
Schematic representation of a model in which PUPPIES control DOG1 expression upon salt stress during seed imbibition. The blue colour is used to represent a WT state with low levels of DOG1 transcription after imbibition and fast seed germination. The purple colour is used to represent a state in which PUPPIES pervasive transcription on DOG1 (purple arrows) is induced upon salt stress. The induction of PUPPIES causes the DOG1 gene to be transcribed by additional (purple) Pol II molecules (higher transcriptional burst size). This state also includes enhanced promoter‐proximal pausing, and slower transcription over exonic regions represented by a nucleosome. This results in a higher DOG1 mRNA production and consequently a delay in seed germination. The TSS of PUPPIES and DOG1 is indicated with grey arrows above the gene name. Additional grey arrows represent effects. This figure was created with BioRender.com.
DOG1 gene is a well‐known regulator of primary dormancy strength that regulates germination timing in fresh seeds (Alonso‐Blanco et al, 2003; Bentsink et al, 2006; Nakabayashi et al, 2012). Here, we identify a function of the DOG1 gene in controlling the speed of germination under salt stress (Fig 1). We show that ionic imbalance induces DOG1 expression (Fig 1D–F and Appendix Fig S2A), which results in a delay in germination. By contrast, osmotic stress caused by PEG results in the downregulation of DOG1 (Appendix Fig S2B). We note that PEG is used to prime seeds for germination (Heydecker et al, 1973; Waqas et al, 2019); therefore, it seems possible that DOG1 downregulation by PEG may contribute to this process.
Very little is known about the response of seeds to salt. Our 3'RNA‐seq shows that in response to salt stress, seeds overexpress genes involved in salt tolerance in vegetative tissues (Fig 1J), including positive regulators of salt tolerance, such as NA +/H + exchanger 1 (NHX1, Apse et al, 1999; Zhang & Blumwald, 2001; Zhang et al, 2001) and Salt‐induced serine rich (SIS, Brinker et al, 2010). Additionally, salt stress promotes the expression of several negative regulators of seed germination (Fig 1J), including DOG1. This suggests that the salt‐induced delay of germination is not uniquely dependent on DOG1 but possibly on a combination of several players. Interestingly among them, reduced dormancy 5 (RDO5; Xiang et al, 2014) and Abscisic acid insensitive 3 (ABI3, Giraudat et al, 1992) were previously identified as candidate genes underlying QTLs for natural variation to salt tolerance (Quesada et al, 2002). Others include ABA deficient 1 (ABA1/ZEP) shown to promote tolerance to osmotic stress (Koornneef et al, 1982; Barrero et al, 2005; Park et al, 2008), late embryogenesis abundant 6 (LEA6/ATEM6) known to contribute to desiccation tolerance in seeds (Manfre et al, 2009) and 1‐cysteine peroxiredoxin 1 (PER1) a seed‐specific peroxiredoxin responsible for eliminating reactive oxygen species (ROS) and repression of germination by suppressing ABA catabolism and GA biosynthesis (Haslekås et al, 1998; Chen et al, 2020).
The ability of seeds to germinate rapidly and uniformly under suboptimal conditions is a valuable agronomical trait, especially in the light of current threats such as climate change and the loss of fertile soil. Our results reveal that under suboptimal conditions imposed by NaCl, seeds overexpress a selection of key regulators of seed germination, including DOG1. Misregulation of DOG1 expression compromises the transcriptomic response to salt and alters the speed of germination upon salt stress. This supports a previously uncharacterized role of the DOG1 gene in the salt‐induced delay of germination.
Based on a series of 3'RNA‐seq, 5′ and 3'RACE‐seq and Sanger sequencing, we characterize PUPPIES lncRNAs, co‐directionally transcribed from a TSS located ~1.5‐Kb upstream of the DOG1 gene (Fig 2A and B). PUPPIES are a result of pervasive transcription over the DOG1 promoter and gene body and are extensively spliced (Fig 2A and D, and Appendix Fig S3). We show that PUPPIES are induced both during seed maturation and during salt stress in seeds concomitant with induction of DOG1 expression (Fig EV1A and Appendix Fig S5A). Downregulation of PUPPIES expression caused by T‐DNA insertion or upregulation of PUPPIES expression by CRISPR‐Cas9 deletion in PUPPIES promoter leads to down and upregulation of DOG1 expression, respectively (Fig 3A–E). These results are consistent with the positive role of PUPPIES on DOG1. The two regions of PUPPIES altered in the mutants are fairly distant from each other. Yet, as PUPPIES genomic sequence coincides with the DOG1 promoter region, it is possible that the sequence alterations in the mutants would impact DOG1 directly. Importantly, the dCas9 transcription‐blocking system (Bikard et al, 2013; Qi et al, 2013; Piatek et al, 2015), which downregulates PUPPIES expression without altering its underlying genomic sequence also reduces DOG1 expression (Fig EV2). It is, however, possible that the binding of dCas9 to its target sequence on the DOG1 promoter occludes the binding of transcription factors. To reduce the influence of such an undesired secondary effect, we targeted dCas9 to three different regions along the DOG1 promoter. Transgenic plants carrying the different constructs consistently display faster seed germination under salt stress. These results suggest that changes in PUPPIES expression affect DOG1 gene expression independently of changes in the DNA sequence.
PUPPIES expression is positively correlated with DOG1 expression in response to salt and during seed maturation. Yet, DOG1 knockout does not downregulate PUPPIES (Fig EV1C) nor affects PUPPIES responsiveness to salt stress (Fig EV1D). Moreover, during secondary dormancy induction with heat stress, the strong DOG1 induction is not followed by induction of PUPPIES, instead PUPPIES expression seems to be shut down (Fig EV1E). These results suggest that while some cross regulation between PUPPIES and DOG1 possibly exists, PUPPIES regulation is partially independent of DOG1. Analyses of different heterozygous plant combinations allowed us to test the influence of PUPPIES from one allele on DOG1 expression from a different allele as well as from a transgene (Fig EV3A and C). Our results suggest that PUPPIES are only able to induce DOG1 expression in cis (Fig EV3B and D).
Consistent with a cis‐mode of action, we speculated that PUPPIES would locally impact DOG1 transcription. To study DOG1 transcriptional dynamics, we performed smFISH in embryos of seeds under salt stress from the PUPPIES mutants. We observe changes in the fluorescence intensity of foci corresponding to transcription sites, consistent with PUPPIES inducing a higher number of Pol II that transcribe DOG1 during each burst (Figs 4 and EV4). Cotranscriptional RNA processing is an important feature of gene expression in plants (Marquardt et al, 2022). Therefore, the higher intensity of TS could also reflect changes in chromatin‐attached DOG1 RNA length. A result of differential distribution of Pol II or mRNA retention at the site of transcription. To test this possibility, we measured the 3′ to 5′ ratio of DOG1 chrRNA by RT–qPCR. No changes in 3′/5′ ratio are observed in PUPPIES mutants compared with WT (Fig EV4K) Furthermore, the levels of DOG1 intron 1 in chrRNA are lower in puppies‐ox and higher in puppies‐1 (Fig 5H), opposite to the smFISH intensity of TS.
Therefore, the smFISH signal of TS is unlikely to be explained by changes in cotranscriptional splicing efficiency, mRNA release or Pol II distribution on DOG1, and is more likely to reflect differences in the number of transcribing Pol II (burst size). Moreover, salt stress also induces DOG1 transcriptional burst size and the frequency of active transcription (Fig EV5).
In contrast to PUPPIES, most lncRNAs acting on neighbouring genes have been shown to repress their transcription by locally inducing a repressive chromatin environment (Swiezewski et al, 2009; Heo & Sung, 2011; Kim et al, 2012; Ariel et al, 2014; Kim & Sung, 2017). Alternatively, pervasive transcription can cause what is called transcriptional interference (Shearwin et al, 2005; Villa et al, 2022). In plants, transcription interference was shown to occur upon overlapping convergent transcription possibly through Pol II collisions (Kindgren et al, 2018). Besides, pervasive transcription from T‐DNA‐derived transcripts was shown to repress gene promoters (Nielsen et al, 2019). Different laboratories have contributed to the idea that upstream transcription has a negative impact on tandem downstream gene expression (Martens et al, 2004; Kim et al, 2012; Nguyen et al, 2014; Nielsen et al, 2019). In this study, we propose a contrasting model in which pervasive transcription induces downstream co‐directional gene expression.
The model proposed in this study shares similarities with what was observed in RNA decay‐deficient mutants. Many laboratories have shown that defective transcription termination leads to readthrough into downstream genes (Greger & Proudfoot, 1998; Vilborg et al, 2015; Baejen et al, 2017). Remarkably, in plants, readthroughs in the Rat1/Xrn2 homologue XRN3 mutant lead to the activation of downstream tandem genes. Notably, this was associated with enhanced Pol II occupancy and higher levels of H3K4me3 and H3K36me3 histone marks on the activated downstream genes (Krzyszton et al, 2018). An independent study confirmed this model by showing that the knockout of the upstream gene abolishes the positive effect of the readthrough on the downstream gene (Crisp et al, 2018). Moreover, the authors showed that the fold induction of the downstream gene was higher than the fold induction of the readthrough transcripts in the intergenic regions (Crisp et al, 2018). These works support the notion that upstream pervasive transcription enhances promoter‐proximal pausing on the downstream gene. Here, we also observe higher Pol II density at the beginning of the DOG1 gene as a result of PUPPIES overexpression (Fig 5A). We interpret this as stronger pausing of Pol II transcribing DOG1 and unlikely to reflect PUPPIES transcription or termination over that region. This is because the primer used in targeted NET‐seq for DOG1 exon 1 is located before the 3'ss of PUPPIES‐fusion, therefore not detecting this spliced isoform. In addition, when analysed in the chromatin fraction, unspliced PUPPIES constitute only a very small portion of the transcripts containing DOG1 exon 1, suggesting that increased pausing at DOG1 exon 1 cannot be attributed to PUPPIES‐transcribing polymerases but rather represent the effect of PUPPIES on DOG1‐transcribing polymerases kinetics (Appendix Fig S6A).
It is known that tandem genes have a high degree of co‐expression (Hurst et al, 2004; Williams & Bowles, 2004; Chen et al, 2010). However, only recently the crosstalk between genes in co‐directional gene pairs was explored at the transcriptional level. Nissani & Ulitsky, 2022, performed a computational analysis with gene expression datasets from the ENCODE project (Dunham et al, 2012; Luo et al, 2020a). The authors detected a strong accumulation of Pol II at the 5′ of downstream co‐expressed tandem genes, as observed by us and Krzyszton et al, 2018. Strikingly, they found that treatment with splicing inhibitor Pladienolide B abolishes Pol II pausing on the downstream genes (Nissani & Ulitsky, 2022), suggesting the role of splicing in the readthrough‐mediated activation of downstream gene expression. Fiszbein et al (2019) showed that splicing activates transcription from a TSS upstream of the 3'ss and induces Pol II accumulation shortly after the TSS. PUPPIES are spliced to a 3'ss immediately downstream of DOG1 TSS. We speculate that splicing could be the factor driving the positive influence of PUPPIES on DOG1 transcription and discriminate between the positive and negative effects of co‐directional pervasive transcription globally. In future, it will be important to test the requirement of splicing for PUPPIES‐mediated regulation of DOG1 gene expression and to address whether the changes in transcriptional dynamics of the DOG1 gene are driven by altered features of Pol II or chromatin.
Materials and Methods
Reagents and Tools table
| Reagent/Resource | Reference or Source | Identifier or Catalog Number |
|---|---|---|
| Experimental Models | ||
| Arabidopsis thaliana dog1‐3 | Nottingham Arabidopsis Stock Centre (NASC) | SALK_000867 |
| Arabidopsis thaliana dog1‐5 | Nottingham Arabidopsis Stock Centre (NASC) | SALK_022748 |
| Arabidopsis thaliana puppies‐1 | Nottingham Arabidopsis Stock Centre (NASC) | SALK_139540C |
| pDOG1‐LUC::DOG1 | Fedak et al (2016) | N/A |
| psDOG1::LUC | Fedak et al (2016) | N/A |
| Oligonucleotides and sequence‐based reagents | ||
| Oligonucleotides | This study | Table EV3 |
| Recombinant DNA | ||
| pHEE2E‐TRI | Jin & Marquardt (2020) | Addgene Plasmid #71288 |
| pKI1.1R | Jin & Marquardt (2020) | Addgene Plasmid #85808 |
| pMOD_A0402 | Čermák et al (2017) | Addgene Plasmid #91009 |
| pMOD_B2303 | Čermák et al (2017) | Addgene Plasmid #91068 |
| pMOD_C3001 | Čermák et al (2017) | Addgene Plasmid #91094 |
| pTRANS_230 | Čermák et al (2017) | Addgene Plasmid #91118 |
| Chemicals, enzymes and other reagents | ||
| Acidic phenol‐chloroform‐isoamyl alcohol 125:24:1 pH 4.5 | ThermoFisher | AM9720 |
| AGAROSE | BioShop | AGA001.1 |
| Agencourt AMPure XP | Beckman Coulter | A63881 |
| Agencourt AMPure XP magnetic beads | Beckman Coulter | A63881 |
| All oligonucleotides (except stated otherwise) | Sigma‐Aldrich | N/A |
| Beetle luciferin potassium salt | Promega | E1605 |
| Beta‐mercaptoethanol | Sigma‐Aldrich | M6250‐100ML |
| Betaine 5M | Sigma‐Aldrich | B0300‐1VL |
| Chloroform | POCH | 234431116 |
| CloneJET PCR Cloning Kit | ThermoFisher | K1232 |
| COmplete protease inhibitors | Roche | 5056489001 |
| DAPI | Sigma‐Aldrich | D9564‐10MG |
| Dextran T40 | Sigma‐Aldrich | 31389‐500G |
| dNTP Mix 10 mM | ThermoFisher | R0192 |
| DTT | ThermoFisher | DTT001.10 |
| E. coli DNA Ligase | New England Biolabs | M0205L |
| E. coli DNA polymerase | New England Biolabs | M0209L |
| EDTA Sterile Solution 0.5 M pH 8.0 | BioShop | EDT111.500 |
| Empigen | Sigma‐Aldrich | 30326‐50ML |
| Ethanol 96 % | POCH | 396420113 |
| Ficoll 400 | BioShop | FIC400.100 |
| Formaldehyde | Sigma‐Aldrich | F8775‐4x25ML |
| Formamide | POCH | 432200116 |
| Glufosinate ammonium | Sigma‐Aldrich | 45520‐100MG |
| Glycerol | Chempur | 114433204 |
| HEPES | ACROS | FSBP31010 |
| Hygromycin | BioShop | HYG002 |
| Isopropanol | POCH | 751500111 |
| KCl | POCH | 739740114 |
| KH2PO4 | Sigma‐Aldrich | P5655‐100G |
| Mannitol | BioShop | MAN509.500 |
| Methanol | Chempur | 603‐001‐00‐X |
| MgCl2 | ThermoFisher | F 530‐S |
| Miracloth | Sigma‐Aldrich | 475855‐1R |
| Murashige and Skoog (MS) medium | Sigma‐Aldrich | M0404‐10L |
| Murine RNase inhibitors | New England Biolabs | M0314L |
| N,N‐Dimethylformamide | Sigma‐Aldrich | 227056‐250ML |
| Na2HPO4·7H2O | Sigma‐Aldrich | 30413‐500G |
| NaCl | POCH | 794121116 |
| NEBNext Second Strand Synthesis (dNTP‐free) Reaction Buffer | New England Biolabs | B6117S |
| NP‐40 | BioShop | NON505.100 |
| Oligo(dT) | Sigma‐Aldrich | N/A |
| PEG 6000 | Sigma‐Aldrich | 8.07491.1000 |
| PEG 8000 50% | New England Biolabs | M0242S |
| Percoll | Sigma‐Aldrich | P1644 |
| Phenol equilibrated stabilized | Applichem | A1153,0100 |
| Phusion High‐Fidelity DNA Polymerase | ThermoFisher | F 530‐S |
| Phusion High‐Fidelity HF Buffer | ThermoFisher | F 530‐S |
| Plant Agar | Duchefa | P1001.1000 |
| PMSF | Sigma‐Aldrich | 93482‐50ML‐F |
| Q5 Hot Start High‐Fidelity 2X Master Mix | New England Biolabs | M0049S |
| Qubit dsDNA HS | LifeTechnololies | Q32854 |
| Random hexamers | ThermoFisher | N8080127 |
| RiboLock 40 U/μl | ThermoFisher | EO0381 |
| RNase H | New England Biolabs | M0297‐S |
| SDS | BDH Prolabo | 444464T |
| Sodium acetate | POCH | 805640115 |
| Spectinomycin | BioShop | SPE201.5 |
| Sucrose | CHEMPUR | 117720907 |
| SuperScript II | ThermoFisher | 18064014 |
| SuperScript III | ThermoFisher | 18064014 |
| SYBR Green mix | Roche | 4887352001 |
| T4 RNA ligase 2 Truncated 200 U/μl | New England Biolabs | M0242S |
| TRIS 1 M pH 7.5 | Bioshop | TRS111 |
| TRIS 1 M pH 8.0 | Bioshop | TRS222 |
| TRIS 1 M pH 8.5 | Bioshop | TRS333 |
| Triton X‐100 | BioShop | TRX777.500 |
| TSO oligo | FUTURE Synthesis | N/A |
| TURBO DNase kit | Ambion | AM1907 |
| Urea | BioShop | URE001.500 |
| Software | ||
| PartSeg | Bokota et al (2021) | N/A |
| Olympus xCellence Software | Olympus | N/A |
| Napari | Sofroniew et al (2022) | N/A |
| ImageJ | https://imagej.nih.gov/ij/download.html | N/A |
Methods and Protocols
Materials
Materials used in this study, including reagents, plasmids and software, are listed in Table EV1. Oligonucleotides are listed in Table EV2.
Plant material
Arabidopsis thaliana Col‐0 was used as a WT for all experiments. Plants were grown in soil in a greenhouse under a long‐day photoperiod (16 h light/8 h dark, 22°C/18°C). Seeds were harvested and stored in paper bags at room temperature. The dog1‐3 (SALK_000867), dog1‐5 (SALK_022748) and puppies‐1 (SALK_139540C) T‐DNA insertion mutants were purchased from the Nottingham Arabidopsis Stock Centre (NASC). The sequences of the DOG1 gene can be found in The Arabidopsis Information Resource (TAIR) database under the accession number AT5G45830. The DOG1‐LUC reporter lines pDOG1‐LUC::DOG1 and psDOG1::LUC were generated before (Fedak et al, 2016).
For salt stress, freshly harvested seeds were sown on agar plates supplemented with different concentrations of NaCl, ranging from 50 to 200 mM. Plates were wrapped in aluminium foil and kept for 3 days at 4°C for cold stratification. After that, the material was collected or moved to a growth chamber under a long‐day photoperiod for germination. Material collected for molecular analysis was obtained by flash‐freezing the biological samples in liquid nitrogen and kept at −80°C.
Germination tests
Primary dormancy tests were performed for WT and mutants by sowing seeds on different days after harvest. Seeds were sown on half‐strength MS agar plates and germinated under a long‐day photoperiod. Pictures were taken each day using a high‐resolution camera, and the appearance of root protrusion was used to count germination. Germination under salt stress was assessed by counting germinated seeds every day after cold stratification. Secondary dormancy treatment was performed as in Krzyszton et al (2022). Briefly, seeds were sown on plates with water‐soaked blue paper and the plates were sealed with parafilm and incubated in the dark at 30°C for 4 h, 3 or 7 days before collecting material for expression analysis.
Quantification of luciferase activity
Quantification of LUC reporter expression was performed as in Kowalczyk et al (2017) with the following modifications. About 100 freshly harvested seeds of reporter lines were placed in wells of a white 96‐well qPCR plate (Roche). Sixty microliter of water (mock) or water supplemented with different concentrations of NaCl, KCl, mannitol or PEG (treatment) was added to each well. Different concentrations of KCl, mannitol or PEG were used to induce osmotic potentials of −0.43, −0.64 and −0.86 MPa corresponding to 100, 150 and 200 mM of NaCl, respectively. Plates were covered with aluminium foil and kept for 2 days at 4°C. Then, the media were replaced by mock or treatment media supplemented with 1 mM beetle luciferin potassium salt. Plates were covered with aluminium foil and kept for one more day at 4°C. Before measuring the signal, 40 μl of excess media was discarded from the wells. The luminescence was measured using a NightSHADE camera (Berthold), with exposure times ranging from 20 to 30 min.
CRISPR‐Cas9 mutant generation
The generation of the CRISPR‐Cas9 mutant puppies‐ox was performed following the protocol described by Jin & Marquardt (2020). Primers used for cloning are listed in Table EV2. T2 plants were confirmed to be Cas9‐free by lack of RFP fluorescence and PCRs targeting the Cas9 and HygR genes on the transgene. The deletion range was determined by Sanger sequencing.
dCas9 mutant generation
The generation of the dCas9 transgenic plants was performed according to the detailed protocols 3B and 5 described by Čermák et al (2017). Two different sgRNAs were cloned in each construct. Three constructs were used for the transformation of WT plants. Primers used for cloning are listed in Table EV2. T1 transformant plants were selected by resistance to glufosinate ammonium. The seeds from the selected T1 plants were used for phenotypic analysis. Based on their phenotype, four independent transgenic lines were selected and propagated, and seeds from transgenic T2 plants were imbibed under 100 mM NaCl and used for expression analysis.
RNA extraction
RNA was extracted using the phenol–chloroform protocol. Seeds were ground to a fine powder while frozen using a plastic pellet pestle fitted in an electric drill. Seed material was mixed with 0.6 ml of RNA extraction buffer (100 mM Tris pH 8.5, 5 mM EDTA, 100 mM NaCl, 0.5% SDS, 1% beta‐mercaptoethanol). Then, 0.6 ml of chloroform was added and samples were vortexed and centrifuged for 10 min at 14,000 g at 4°C. The supernatant was transferred to new tubes and 0.3 ml of phenol (pH 7.5–8.0) was added and samples were vortexed. Then, 0.3 ml of chloroform was added and samples were vortexed and centrifuged for 10 min at 14,000 g at 4°C. 0.5 ml of supernatant was transferred to new tubes and mixed with 0.5 ml of acidic phenol–chloroform–isoamyl alcohol 125:24:1 pH 4.5; samples were vortexed and centrifuged for 10 min at 14,000 g at 4°C. The last step was repeated once more. Then, the supernatant was mixed with 0.5 ml of chloroform and samples were vortexed and centrifuged for 10 min at 14,000 g at 4°C. Finally, the supernatant was mixed with 10% of the volume of 3 M sodium acetate (pH 5.2) and 80% of the volume of pure isopropanol and incubated for 20 min at −80°C. The RNA was pelleted by centrifuging for 30 min at 14,000 g at 4°C; the pellet was washed with 80% ethanol, dried and resuspended in Milli‐Q water. DNase treatment of RNA samples was performed following the rigorous treatment from TURBO DNase protocol (ThermoFisher) with the following modifications: after adding DNase buffer to the RNA, the samples were mixed by pipetting up and down 10 times and centrifuged at 10,000 g for 2 min; and DNase incubation at 37°C was 30 + 20 min. RNA quality was assessed using agarose gel electrophoresis, Nanodrop 2000 spectrophotometer and PCR to test for genomic DNA contamination.
RT–qPCR
Reverse transcription (RT) was performed with SuperScript III according to the manufacturer's protocol using a mixture (1:1) of random hexamers and oligo(dT). qPCR was performed using a LightCycler 480 real‐time system (Roche) with SYBR Green mix with primers listed in Table EV2. RT–qPCR results were normalized against the expression level of the housekeeping gene UBC21 (AT5G25760; Czechowski et al, 2005). For absolute quantification, the target was PCR amplified and the amplicon was cloned in the pJet vector following the manufacturer's protocol (CloneJET PCR Cloning Kit). A series of 10‐fold dilutions was used for qPCR to obtain standard curves for each primer.
3'RNA‐seq
3'RNA‐seq was performed as described by Krzyszton et al (2022) using 500 ng of total RNA. Libraries were sequenced with Illumina NovaSeq 6000 in the Genomics Core Facility (Centre of New Technologies, University of Warsaw, Poland).
DEGs are defined as |log2fold‐change| > log2(1.5) and FDR < 0.05 and are listed in Dataset EV1. GO analysis was performed using g:Profiler (https://biit.cs.ut.ee/gprofiler, Raudvere et al, 2019). Removal of redundant GO terms was done using the web server REVIGO (http://revigo.irb.hr, Supek et al, 2011). The full list of GO terms is provided in Dataset EV2.
5'RACE‐seq (rapid amplification of 5′ cDNA ends with high‐throughput sequencing)
5'RACE‐seq library preparation was based on nanoCAGE (Salimullah et al, 2011) and nanoPARE (Schon et al, 2018) procedures using template‐switching RT. Five hundred nanogram of total RNA was mixed with 1 μl dNTP Mix 10 mM and 1 μl 6N_RT_TSO 50 μM and incubated at 72°C for 3 min and then put on ice. Then, the following reagents were added: 2 μl 5× First‐Strand SuperScript II Buffer, 0.25 μl DTT 0.1 M, 1.8 μl MgCl2 50 mM, 2 μl Betaine 5 M, 0.5 μl TSO oligo 100 μM, 0.25 μl RiboLock 40 U/μl and 0.5 μl SuperSript II. The reaction was performed as follows: 25°C 5 min + 42°C 90 min + 10 cycles (50°C 2 min + 42°C 2 min) + 70°C 15 min + 4°C hold. Then, cDNA was purified using Agencourt AMPure XP magnetic beads and amplified in PCR (98°C 30 s + 10 cycles (98°C 10 s + 67°C 15 s + 72°C 1.5 min) + 72°C 10 min + 4°C hold) with Phusion using the TSO_n1 primer. The PCR product was purified using Agencourt AMPure XP and used as a template for second PCR (98°C 30 s + 30 cycles (98°C 10 s + 61°C 15 s + 72°C 30 s) + 72°C 10 min + 4°C hold) with Phusion using the TSO_n2 and PUPPIES_5RACE primers. The PCR product was purified using Agencourt AMPure XP and used as a template for third PCR (10 cycles) with Phusion using Illumina indexed primers. Concentration was checked by Qubit dsDNA HS (ThermoFisher). The libraries were pooled in equal amounts and sequenced with Illumina MiSeq in the Oligo facility (https://oligo.ibb.waw.pl). Reads were mapped to the genome using STAR (v2.7.8a; Dobin et al, 2013) and filtered based on UMIs using UMI‐tools (v1.1.0; Smith et al, 2017). The position of the last 5′ nucleotide was extracted using bedtools (v2.30.0; Quinlan & Hall, 2010) and used for the pileup graphs.
3'RACE‐seq (rapid amplification of 3′ cDNA ends with high‐throughput sequencing)
3'RACE‐seq was performed based on the procedure described by Warkocki et al (2018). RA3_15N oligos were ligated to 3′ ends of RNA. One microgram of total RNA was denatured at 72°C for 3 min and put on ice. Then, the following reagents were added: 1.5 μl T4 ligation buffer 10×, 3 μl RA3_15N oligo 25 μM, 3.6 μl PEG 8000 50%, 0.3 μl RiboLock 40 U/μl and 1 μl T4 RNA ligase 2 Truncated 200 U/μl in 15 μl final volume. The ligation reaction was performed by incubating the samples for 1 h at 25 + 17°C overnight. RT was performed as follows: 15 μl ligation reaction was mixed with 3 μl RTP primer 20 μM, and 2 μl dNTP Mix 10 mM. Samples were incubated for 5 min at 65°C and then 10 min at 4°C. Then, 6 μl 5× First‐Strand SuperScript III Buffer, 3 μl DTT 0.1 M, 0.5 μl RiboLock 40 U/μl, 1 μl SuperSript III was added and samples incubated for 45 min at 52°C and then 15 min at 70°C. cDNA was purified using Agencourt AMPure XP and used for 1st PCR (98°C 30 s + 15 cycles (98°C 10 s + 63°C 15 s + 72°C 35 s) + 72°C 10 min + 4°C hold) with Phusion using the PUPPIES_3RACE and mRTPXT primers. The PCR product was purified using Agencourt AMPure XP and used as a template for second PCR (98°C 30 s + 12 cycles (98°C 10 s + 61°C 15 s + 72°C 30 s) + 72°C 10 min + 4°C hold) with Phusion using the mXTf and mXTr primers. The PCR product was purified using Agencourt AMPure XP and used as a template for third PCR (10 cycles) with Phusion using Illumina indexing primers. Concentration was checked by Qubit dsDNA HS (ThermoFisher). The libraries were pooled in equal amounts and sequenced with Illumina MiSeq in the Oligo facility (https://oligo.ibb.waw.pl). Reads were mapped to the genome using STAR (v2.7.8a; Dobin et al, 2013) and filtered based on UMIs using UMI‐tools (v1.1.0; Smith et al, 2017). The position of the last 3′ nucleotide was extracted using bedtools (v2.30.0; Quinlan & Hall, 2010) and used for the pileup graphs.
Extraction of chrRNA
One hundred milligram of seeds was grounded to a fine powder in liquid nitrogen and mixed with 20 ml of Honda Buffer (0.44 M sucrose, 20 mM HEPES‐KOH pH 7.4, 1.25% Ficoll, 2.5% Dextran T40, 10 mM MgCl2, 5 mM DTT, 0.5% Triton X‐100, 1 mM PMSF, 10 mM beta‐mercaptoethanol and 1 tablet/250 ml cOmplete protease inhibitors) for 10 min at 4°C. The homogenate was filtered through a double layer of Miracloth (Sigma). The flow‐through was centrifuged at 2,000 g for 15 min at 4°C. The nuclei pellet was washed once with 1.5 ml of Honda Buffer supplemented with 15 U murine RNase inhibitors. The pellet was resuspended in 600 μl of Honda buffer and further purified on a Percoll density gradient as follows: On a 2 ml tube, 600 μl 40% Percoll in Honda buffer was gently placed on top of 600 μL of 75% Percoll in Honda buffer. The resuspended nuclei pellet was then placed on top of the Percoll gradient. Tubes were centrifuged at 10,000 g for 20 min at 4°C. Purified nuclei were obtained from the interface between the layers containing 40 and 75% Percoll. The nuclei were washed once more with Honda buffer. The pellet was then resuspended in 500 μl of cold glycerol buffer (50% glycerol, 20 mM Tris–HCl pH 8, 75 mM NaCl, 0.5 mM EDTA, 0.85 mM DTT, 1% Empigen, 10 mM beta‐mercaptoethanol, 0.125 mM PMSF, 1 tablet/250 ml cOmplete protease inhibitor and 5 U murine RNase inhibitors) and overlaid on top of 500 μl of urea lysis buffer (10 mM HEPES‐KOH pH 7.4, 7.5 mM MgCl2, 0.2 mM EDTA, 300 mM NaCl, 1 M Urea, 1% NP‐40, 10 mM beta‐mercaptoethanol, 0.5 mM PMSF, 1 tablet/250 ml cOmplete protease inhibitor and 5 U murine RNase inhibitors). The samples were gently vortexed two times for 2 s, incubated on ice for 5 min and then centrifuged at 20,000 g for 2 min at 4°C. The chromatin pellet was washed twice with 600 μl of urea lysis buffer for 30 min at 4°C at 12 rpm in Rotator SB3 (Stuart). The washed chromatin pellet was then resuspended in 300 μl of RNA isolation buffer, and chrRNA was isolated with phenol–chloroform, followed by DNase treatment with TURBO DNase was performed as described previously.
Targeted NET‐seq
The targeted NET‐seq procedure is based on the SMIT assay (Oesterreich et al, 2016; Herz et al, 2019). Five hundred nanogram of chrRNA was used for 3′ end adapter ligation with RA3_15N oligos. Adapter ligation and RT were performed as described previously for 3'RACE‐seq. cDNA was purified using Agencourt AMPure XP (1.6× the volume of the sample). Purified cDNA was used in the 1st PCR (15 cycles, 63°C annealing temperature and 30‐s extension) using the primer RTP and primers spanning the DOG1 gene listed in Table EV2. 1st PCR products were purified with Agencourt AMPure XP (1.8× the volume of the sample). The purified PCR products were used in the second PCR (10 cycles, 61°C annealing temperature and 30‐s extension) using the primers RTP_XT and primers spanning the DOG1 gene with XT overhangs listed in Table EV2. The second PCR products were purified with Agencourt AMPure XP (1.4× the volume of the sample). The purified PCR products were used in the third PCR (10 cycles) using Illumina indexing primers. Libraries were purified with Agencourt AMPure XP (1.2× the volume of the sample). All PCRs were done using Phusion. Separate PCR reactions were performed for each primer. The concentration of final PCR products was checked by Qubit dsDNA HS (ThermoFisher). The libraries were pooled in equal amounts and sequenced with Illumina in the Oligo facility (https://oligo.ibb.waw.pl). FastQC was used for the initial quality‐control analysis. Removal of adapter sequences and reads shorter than 30 nt was performed using cutadapt (v1.18; Martin, 2011). Reads were mapped to the genome using STAR (v2.7.8a; Dobin et al, 2013) and filtered based on UMIs using UMI‐tools (v1.1.0; Smith et al, 2017). The position of the last 3′ nucleotide was extracted using bedtools (v2.30.0; Quinlan & Hall, 2010).
The nucleotide sequenced immediately after the adapter sequence corresponds to the 3′ end of the nascent RNA, which is the Pol II active site and therefore can be used to infer the position of a transcribing Pol II (Churchman & Weissman, 2011). However, the method also detects the 3′ ends of RNAs associated with the transcriptional machinery but not physically linked to Pol II such as intermediates of splicing after 5'ss cleavage (Prudêncio et al, 2020). Therefore, we removed reads in which the end position mapped precisely to a 5'ss of DOG1. Reads were also filtered to the genomic DOG1 locus and to reads which end is within 600 nt after the last nt of the sequencing primer. A table containing the number of reads with the same Pol II position and the corresponding genomic position was obtained. Pseudocounts were added, replacing the nt positions without any reads by the value 0.1. Then, we computed for each nt position, the ratio of the number of reads to the total number of reads from the same DOG1 sequencing primer, for each biological replicate from WT and mutant. This normalization enables the interpretation of Pol II density regardless of the total number of transcribing Pol II so that a higher ratio of reads means that Pol II is observed more frequently at a certain position/region (interpreted as Pol II pausing or slowing down) rather than a generally higher number of transcribing Pol II. Then, data smoothing was performed using a rolling median of 11 nt. Followed by averaging the biological replicates for each region sequenced by the same DOG1 primer. For statistical analysis, the data for each replicate were binned in 25 nt, and for each bin, a two‐tailed t‐test followed by Bonferroni correction was performed. The fold‐change (puppies‐ox/WT) was also calculated for 25 nt bins. All the codes for data processing and plotting are available on GitHub.
smFISH
The set of smFISH probes was designed to target the full shDOG1 sequence, including intron 1 using Stellaris Probe Designer version 4.2 (Biosearch Technologies). Including probes targeting DOG1 intron enhances the chances of detecting signals from nascent DOG1 RNA. Detection of only nascent DOG1 RNA is probably impossible due to the short length and poor nt composition of the intron sequence. Each probe was labelled with the Quasar670 fluorophore. Probes sequences are listed in Table EV3. smFISH method is based on the procedure described by Duncan et al (2016) and adapted to Arabidopsis embryos with the following modifications. Seeds were imbibed for 3 days under salt stress as described previously. The seed coat was dissected under a binocular, and the embryo was isolated from the seed and quickly placed onto a drop of 4% formaldehyde on a microscope glass slide. Embryos were fixed for 30 min and then washed three times in 1× PBS. Permeabilization was achieved by air‐drying the slides at room temperature for 1 h and then immersing them at 4°C in 70% ethanol overnight, followed by 2 h in pure methanol, and overnight in 70% ethanol.
The smFISH slides were imaged using a widefield inverted fluorescence microscope Olympus IX81 (Olympus), with a 100X UPLANSAPO oil‐immersion objective (1.4 NA) and a Hamamatsu Orca‐R2 (C10600) CCD camera. DAPI signal was acquired using a 387/11 excitation filter and 20 ms exposure time. The signal from DOG1 probes labelled with Quasar670 was acquired using a 650/13 excitation and 1 s exposure time. 3D imaging was done by acquiring multiple optical slices spanning the entire cell. 25–40 z‐slices were recorded with a 0.3 μm step size. For image acquisition, the xCellence software (Olympus) was used. For representative images shown in the figures, a maximum projection of the z‐stack was obtained using ImageJ. The attribution of colours and cell segmentation on the maximum projection images was performed in Napari (Sofroniew et al, 2022).
We have limited our analysis to cells from the meristematic zone of the root because their shape, size and spatial architecture allow easy recognition and cell segmentation, and preservation of the tissue integrity in the squashed material. For image analyses, we used PartSeg, a novel computational tool for image processing, and segmentation described by Bokota et al (2021). Cells were segmented manually on one z‐slice and projected to the z‐slices above and below corresponding to the top and bottom edges of the cell. To each cell, a segmentation component is attributed, becoming a cell identifier. The area segmented as part of one cell cannot be part of a different cell, so no foci can be counted more than once. Nuclei segmentation was done using DAPI staining and give rise to three subcellular locations: nucleus, nuclear periphery and cytoplasm. Then, we developed the smFISH PartSeg plugin to identify, count and classify foci based on which cell component they belong to. The basis for foci segmentation in 3D was taken from FISH‐quant v2 (Imbert et al, 2022) and adapted to the high background noise values in the embryo cells. Moreover, this plugin provides GUI and 2D/3D segmentation preview. First, we denoised image channels. Second, we normalized stack brightness based on the standard deviation of the denoised signal. And third, we applied a threshold‐based identification algorithm to assign the foci to the segmentation components (cytoplasm, periphery and nucleus). Finally, a table is retrieved from the software with information relative to each of the identified foci regarding the genotype, embryo, cell and subcellular compartment they belong to and their fluorescence intensity.
For analysis of transcriptional burst size, we filtered foci present in the nucleus and nuclear periphery and discard the two brightest foci per cell, since up to two foci can correspond to transcription sites (TS) in diploid cells. From the remaining foci, we compute the average fluorescence intensity as a proxy for the intensity of one DOG1 transcript. This was not done from cytoplasmic foci due to different background fluorescence in the nucleus and cytoplasm. Then, for all foci in the nucleus and nuclear periphery (including the two brightest foci), we compute the fold‐change intensity to the computed average. Foci in which the fold‐change was higher than or equal to 1.6 times the average were considered to be TS. This threshold was selected based on the observations that the majority of the cells would have 1 or 2 TS. For cells with more than two foci with fold‐change above the threshold, we considered the two brightest foci to be the two active TS. One limitation of this pipeline is that TS identification is only possible for cells with more than three nuclear foci. For analysis of active transcription, we divide the number of identified TS by the total number of alleles (two times the total number of cells).
In silico analysis
The coding/noncoding potential of PUPPIES transcripts was analysed using two different web tools, Coding Potential Calculator 2.0 (CPC 2.0) http://cpc2.cbi.pku.edu.cn (Kang et al, 2017) and Coding‐NonCoding Identifying Tool (CNIT) http://cnit.noncode.org/CNIT/ (Guo et al, 2019). Both analyses were performed using the sequences of PUPPIES‐uns, PUPPIES‐prom with the inclusion of short alternative exon, PUPPIES‐prom, the full genomic region of DOG1 promoter, and UBC21 as protein‐coding gene control.
Prediction of nucleosome occupancy for DOG1 locus was performed based on DOG1 genomic DNA sequence using the web server http://bio.physics.leidenuniv.nl/~noort/cgi‐bin/nup3_st.py (van der Heijden et al, 2012).
MNase‐seq data from (Data ref: Luo et al, 2020b) were used to map the nucleosome occupancy on the DOG1 locus.
All statistical analyses were performed using the R environment version 3.6.3. Sample sizes are mentioned in figure legends and/or displayed in plots as individual data points.
Statistical analysis
Statistical analyses were performed in RStudio. Sample sizes were not prespecified. The number of independent biological replicates (n) is mentioned in figure legends or displayed in the figures as data points. Information regarding the statistical test applied to each data is mentioned in the corresponding figure legend. Significant differences were accepted at P‐values < 0.05.
Author contributions
Miguel Montez: Conceptualization; data curation; supervision; funding acquisition; investigation; methodology; writing – original draft; writing – review and editing. Maria Majchrowska: Investigation. Michal Krzyszton: Data curation; investigation. Grzegorz Bokota: Software. Sebastian Sacharowski: Investigation. Magdalena Wrona: Investigation. Ruslan Yatusevich: Investigation. Ferran Massana: Investigation. Dariusz Plewczynski: Software; supervision. Szymon Swiezewski: Supervision; funding acquisition; writing – original draft; writing – review and editing.
Disclosure and competing interests statement
The authors declare that they have no conflict of interest.
Supporting information
Appendix
Expanded View Figures PDF
Table EV1
Table EV2
Table EV3
Dataset EV1
Dataset EV2
PDF+
Acknowledgements
We thank Stefanie Rosa and Svenja Reeck for the help with the initial smFISH experiments, Lukasz Borowski and Aleksander Chlebowski for the assistance using the microscope facility, Tomasz W. Turowski for the support with NET‐Seq analysis, Sebastian Marquardt for sharing vectors and protocols for CRISPR‐Cas9 mutant generation, and Magdalena Boguta, Andrzej Jerzmanowski and Lien Brzezniak for the critical comments on the manuscript. We also thank all the members of our laboratory for the fruitful discussions throughout the entire duration of this work. This work was funded by the Foundation for Polish Science (FNP TEAM POIR.04.04.00‐00‐3C97/16) and by the Polish National Science Centre (NCN SONATA BIS UMO‐2018/30/E/NZ1/00354) awarded to S.S. Miguel M. was supported by the Portuguese Fundação para a Ciência e a Tecnologia (FCT SFRH/BD/145264/2019) and the European Cooperation in Science and Technology (COST) short‐term scientific mission (Action CA16212 INDEPTH). M. K. was supported by the Polish National Science Centre (NCN OPUS UMO‐2021/41/B/NZ3/02605). D.P. research was funded by Warsaw University of Technology within the Excellence Initiative: Research University (IDUB) programme. D.P. and G.B. work was co‐supported by the Polish National Science Centre (NCN 2019/35/O/ST6/02484 and 2020/37/B/NZ2/03757).
The EMBO Journal (2023) 42: e112443
Contributor Information
Miguel Montez, Email: miguel-coelho@hotmail.com.
Szymon Swiezewski, Email: sswiez@ibb.waw.pl.
Data availability
All the codes for targeted NET‐seq (https://github.com/Miguel‐Montez/Targeted‐NET‐seq_analysis.git) and smFISH (https://github.com/Miguel‐Montez/smFISH‐data‐analysis.git) data processing and plotting are publicly available on GitHub. The MNase‐seq data used in this study were published previously (Data ref: Luo et al, 2020b) and can be found in the GEO database under the accession code GSE139465, https://www.ncbi.nlm.nih.gov/geo/query/acc.cgi?acc=GSE139465 (GSM4916341, https://www.ncbi.nlm.nih.gov/geo/query/acc.cgi?acc=GSM4916341). The 3'RNA‐seq data generated for this study have been deposited at the Gene Expression Omnibus (GEO) under the accession code GSE208755 (https://www.ncbi.nlm.nih.gov/geo/query/acc.cgi?acc=GSE208755).
References
- Abel GH, MacKenzie AJ (1964) Salt tolerance of soybean varieties (Glycine max L. Merrill) during germination and later growth. Crop Sci 4: 157–161 [Google Scholar]
- Alonso‐Blanco C, Bentsink L, Hanhart CJ, Blankestijn‐de Vries H, Koornneef M (2003) Analysis of natural allelic variation at seed dormancy loci of Arabidopsis thaliana . Genetics 164: 711–729 [DOI] [PMC free article] [PubMed] [Google Scholar]
- Apse MP, Aharon GS, Snedden WA, Blumwald E (1999) Salt tolerance conferred by overexpression of a vacuolar Na+/H+ Antiport in Arabidopsis . Science 285: 1256–1258 [DOI] [PubMed] [Google Scholar]
- Argyris J, Dahal P, Hayashi E, Still DW, Bradford KJ (2008) Genetic variation for lettuce seed Thermoinhibition is associated with temperature‐sensitive expression of Abscisic acid, gibberellin, and ethylene biosynthesis, metabolism, and response genes. Plant Physiol 148: 926–947 [DOI] [PMC free article] [PubMed] [Google Scholar]
- Ariel F, Jegu T, Latrasse D, Romero‐Barrios N, Christ A, Benhamed M, Crespi M (2014) Noncoding transcription by alternative RNA polymerases dynamically regulates an auxin‐driven chromatin loop. Mol Cell 55: 383–396 [DOI] [PubMed] [Google Scholar]
- Baejen C, Andreani J, Torkler P, Battaglia S, Schwalb B, Lidschreiber M, Maier KC, Boltendahl A, Rus P, Esslinger S et al (2017) Genome‐wide analysis of RNA polymerase II termination at protein‐coding genes. Mol Cell 66: 38–49 [DOI] [PubMed] [Google Scholar]
- Barrero JM, Piqueras P, González‐Guzmán M, Serrano R, Rodríguez PL, Ponce MR, Micol JL (2005) A mutational analysis of the ABA1 gene of Arabidopsis thaliana highlights the involvement of ABA in vegetative development. J Exp Bot 56: 2071–2083 [DOI] [PubMed] [Google Scholar]
- Bentsink L, Jowett J, Hanhart CJ, Koornneef M (2006) Cloning of DOG1, a quantitative trait locus controlling seed dormancy in Arabidopsis . Proc Natl Acad Sci USA 103: 17042–17047 [DOI] [PMC free article] [PubMed] [Google Scholar]
- Bikard D, Jiang W, Samai P, Hochschild A, Zhang F, Marraffini LA (2013) Programmable repression and activation of bacterial gene expression using an engineered CRISPR‐Cas system. Nucleic Acids Res 41: 7429–7437 [DOI] [PMC free article] [PubMed] [Google Scholar]
- Bokota G, Sroka J, Basu S, Das N, Trzaskoma P, Yushkevich Y, Grabowska A, Magalska A, Plewczynski D (2021) PartSeg: a tool for quantitative feature extraction from 3D microscopy images for dummies. BMC Bioinformatics 22: 1–15 [DOI] [PMC free article] [PubMed] [Google Scholar]
- Brinker M, Brosché M, Vinocur B, Abo‐Ogiala A, Fayyaz P, Janz D, Ottow EA, Cullmann AD, Saborowski J, Kangasjärvi J et al (2010) Linking the salt transcriptome with physiological responses of a salt‐resistant Populus species as a strategy to identify genes important for stress acclimation. Plant Physiol 154: 1697–1709 [DOI] [PMC free article] [PubMed] [Google Scholar]
- Butt H, Bazin J, Prasad KVSK, Awad N, Crespi M, Reddy ASN, Mahfouz MM (2022) The Rice Serine/arginine splicing factor RS33 regulates pre‐mRNA splicing during abiotic stress responses. Cell 11: 1796 [DOI] [PMC free article] [PubMed] [Google Scholar]
- Cai L, Dalal CK, Elowitz MB (2008) Frequency‐modulated nuclear localization bursts coordinate gene regulation. Nature 455: 485–490 [DOI] [PMC free article] [PubMed] [Google Scholar]
- Čermák T, Curtin SJ, Gil‐Humanes J, Čegan R, Kono TJY, Konečná E, Belanto JJ, Starker CG, Mathre JW, Greenstein RL et al (2017) A multipurpose toolkit to enable advanced genome engineering in plants. Plant Cell 29: 1196–1217 [DOI] [PMC free article] [PubMed] [Google Scholar]
- Chen WH, de Meaux J, Lercher MJ (2010) Co‐expression of neighbouring genes in Arabidopsis: separating chromatin effects from direct interactions. BMC Genomics 11: 1–8 [DOI] [PMC free article] [PubMed] [Google Scholar]
- Chen H, Ruan J, Chu P, Fu W, Liang Z, Li Y, Tong J, Xiao L, Liu J, Li C et al (2020) AtPER1 enhances primary seed dormancy and reduces seed germination by suppressing the ABA catabolism and GA biosynthesis in Arabidopsis seeds. Plant J 101: 310–323 [DOI] [PubMed] [Google Scholar]
- Churchman LS, Weissman JS (2011) Nascent transcript sequencing visualizes transcription at nucleotide resolution. Nature 469: 368–373 [DOI] [PMC free article] [PubMed] [Google Scholar]
- Crisp PA, Smith AB, Ganguly DR, Murray KD, Eichten SR, Millar AA, Pogson BJ (2018) RNA polymerase II read‐through promotes expression of neighboring genes in SAL1‐PAP‐XRN retrograde signaling. Plant Physiol 178: 1614–1630 [DOI] [PMC free article] [PubMed] [Google Scholar]
- Cyrek M, Fedak H, Ciesielski A, Guo Y, Sliwa A, Brzezniak L, Krzyczmonik K, Pietras Z, Kaczanowski S, Liu F et al (2015) Seed dormancy in Arabidopsis is controlled by alternative polyadenylation of DOG1. Plant Physiol 170: 947–955 [DOI] [PMC free article] [PubMed] [Google Scholar]
- Czechowski T, Stitt M, Altmann T, Udvardi MK, Scheible WR (2005) Genome‐wide identification and testing of superior reference genes for transcript normalization in Arabidopsis . Plant Physiol 139: 5–17 [DOI] [PMC free article] [PubMed] [Google Scholar]
- Dobin A, Davis CA, Schlesinger F, Drenkow J, Zaleski C, Jha S, Batut P, Chaisson M, Gingeras TR (2013) STAR: ultrafast universal RNA‐seq aligner. Bioinformatics 29: 15–21 [DOI] [PMC free article] [PubMed] [Google Scholar]
- Dolata J, Guo Y, Kolowerzo A, Smolinski D, Brzyzek G, Jarmolowski A, Swiezewski S (2015) NTR1 is required for transcription elongation checkpoints at alternative exons in Arabidopsis . EMBO J 34: 544–558 [DOI] [PMC free article] [PubMed] [Google Scholar]
- Dorone Y, Boeynaems S, Flores E, Jin B, Hateley S, Bossi F, Lazarus E, Pennington JG, Michiels E, de Decker M et al (2021) A prion‐like protein regulator of seed germination undergoes hydration‐dependent phase separation. Cell 184: 4284–4298 [DOI] [PMC free article] [PubMed] [Google Scholar]
- Duncan S, Rosa S (2017) Gaining insight into plant gene transcription using smFISH. Transcription 9: 166–170 [DOI] [PMC free article] [PubMed] [Google Scholar]
- Duncan S, Olsson TSG, Hartley M, Dean C, Rosa S (2016) A method for detecting single mRNA molecules in Arabidopsis thaliana . Plant Methods 12: 13 [DOI] [PMC free article] [PubMed] [Google Scholar]
- Dunham I, Kundaje A, Aldred SF, Collins PJ, Davis CA, Doyle F, Epstein CB, Frietze S, Harrow J, Kaul R et al (2012) An integrated encyclopedia of DNA elements in the human genome. Nature 489: 57–74 [DOI] [PMC free article] [PubMed] [Google Scholar]
- Fedak H, Palusinska M, Krzyczmonik K, Brzezniak L, Yatusevich R, Pietras Z, Kaczanowski S, Swiezewski S (2016) Control of seed dormancy in Arabidopsis by a cis‐acting noncoding antisense transcript. Proc Natl Acad Sci USA 113: E7846–E7855 [DOI] [PMC free article] [PubMed] [Google Scholar]
- Femino AM, Fay FS, Fogarty K, Singer RH (1998) Visualization of single RNA transcripts in situ. Science 280: 585–590 [DOI] [PubMed] [Google Scholar]
- Finch‐Savage WE, Footitt S (2017) Seed dormancy cycling and the regulation of dormancy mechanisms to time germination in variable field environments. J Exp Bot 68: 843–856 [DOI] [PubMed] [Google Scholar]
- Fiszbein A, Krick KS, Begg BE, Burge CB (2019) Exon‐mediated activation of transcription starts. Cell 179: 1551–1565 [DOI] [PMC free article] [PubMed] [Google Scholar]
- Giraudat J, Hauge BM, Valon C, Smalle J, Parcy F, Goodman HM (1992) Isolation of the Arabidopsis ABI3 gene by positional cloning. Plant Cell 4: 1251–1261 [DOI] [PMC free article] [PubMed] [Google Scholar]
- Gómez‐Schiavon M, Chen LF, West AE, Buchler NE (2017) BayFish: Bayesian inference of transcription dynamics from population snapshots of single‐molecule RNA FISH in single cells. Genome Biol 18: 164 [DOI] [PMC free article] [PubMed] [Google Scholar]
- Greger IH, Proudfoot NJ (1998) Poly(a) signals control both transcriptional termination and initiation between the tandem GAL10 and GAL7 genes of Saccharomyces cerevisiae . EMBO J 17: 4771–4779 [DOI] [PMC free article] [PubMed] [Google Scholar]
- Guo JC, Fang SS, Wu Y, Zhang JH, Chen Y, Liu J, Wu B, Wu JR, Li EM, Xu LY et al (2019) CNIT: a fast and accurate web tool for identifying protein‐coding and long non‐coding transcripts based on intrinsic sequence composition. Nucleic Acids Res 47: W516–W522 [DOI] [PMC free article] [PubMed] [Google Scholar]
- Haslekås C, Stacy RAP, Nygaard V, Culiáñez‐Macià FA, Aalen RB (1998) The expression of a peroxiredoxin antioxidant gene, AtPer1, in Arabidopsis thaliana is seed‐specific and related to dormancy. Plant Mol Biol 36: 833–845 [DOI] [PubMed] [Google Scholar]
- Heo JB, Sung S (2011) Vernalization‐mediated epigenetic silencing by a long intronic noncoding RNA. Science 331: 76–79 [DOI] [PubMed] [Google Scholar]
- Herz MAG, Kubaczka MG, Brzyżek G, Servi L, Krzyszton M, Simpson C, Brown J, Swiezewski S, Petrillo E, Kornblihtt AR (2019) Light regulates plant alternative splicing through the control of transcriptional elongation. Mol Cell 73: 1066–1074 [DOI] [PubMed] [Google Scholar]
- Heydecker W, Higgins J, Gulliver RL (1973) Accelerated germination by osmotic seed treatment. Nature 246: 42–44 [Google Scholar]
- Hurst LD, Pál C, Lercher MJ (2004) The evolutionary dynamics of eukaryotic gene order. Nat Rev Genet 5: 299–310 [DOI] [PubMed] [Google Scholar]
- Ietswaart R, Rosa S, Wu Z, Dean C, Howard M (2017) Cell‐size‐dependent transcription of FLC and its antisense long non‐coding RNA COOLAIR explain cell‐to‐cell expression variation. Cell Syst 4: 622–635 [DOI] [PMC free article] [PubMed] [Google Scholar]
- Imbert A, Ouyang W, Safieddine A, Coleno E, Zimmer C, Bertrand E, Walter T, Mueller F (2022) FISH‐quant v2: a scalable and modular tool for smFISH image analysis. RNA 28: 786–795 [DOI] [PMC free article] [PubMed] [Google Scholar]
- Jin Y, Marquardt S (2020) Dual sgRNA‐based targeted deletion of large genomic regions and isolation of heritable Cas9‐free mutants in Arabidopsis . Bio Protoc 10: e3796 [DOI] [PMC free article] [PubMed] [Google Scholar]
- Johnsson P, Ziegenhain C, Hartmanis L, Hendriks GJ, Hagemann‐Jensen M, Reinius B, Sandberg R (2022) Transcriptional kinetics and molecular functions of long noncoding RNAs. Nat Genet 54: 306–317 [DOI] [PMC free article] [PubMed] [Google Scholar]
- Jones RA (1986) High salt tolerance potential in Lycopersicon species during germination. Euphytica 35: 575–582 [Google Scholar]
- Kang YJ, Yang DC, Kong L, Hou M, Meng YQ, Wei L, Gao G (2017) CPC2: a fast and accurate coding potential calculator based on sequence intrinsic features. Nucleic Acids Res 45: W12–W16 [DOI] [PMC free article] [PubMed] [Google Scholar]
- Kim DH, Sung S (2017) Vernalization‐triggered intragenic chromatin loop formation by long noncoding RNAs. Dev Cell 40: 302–312 [DOI] [PMC free article] [PubMed] [Google Scholar]
- Kim T, Xu Z, Clauder‐Münster S, Steinmetz LM, Buratowski S (2012) Set3 HDAC mediates effects of overlapping noncoding transcription on gene induction kinetics. Cell 150: 1158–1169 [DOI] [PMC free article] [PubMed] [Google Scholar]
- Kindgren P, Ard R, Ivanov M, Marquardt S (2018) Transcriptional read‐through of the long non‐coding RNA SVALKA governs plant cold acclimation. Nat Commun 9: 1–11 [DOI] [PMC free article] [PubMed] [Google Scholar]
- Koornneef M, Jorna ML, Brinkhorst‐van der Swan DLC, Karssen CM (1982) The isolation of abscisic acid (ABA) deficient mutants by selection of induced revertants in non‐germinating gibberellin sensitive lines of Arabidopsis thaliana (L.) heynh. Theor Appl Genet 61: 385–393 [DOI] [PubMed] [Google Scholar]
- Kowalczyk J, Palusinska M, Wroblewska‐Swiniarska A, Pietras Z, Szewc L, Dolata J, Jarmolowski A, Swiezewski S (2017) Alternative polyadenylation of the sense transcript controls antisense transcription of DELAY OF GERMINATION 1 in Arabidopsis . Mol Plant 10: 1349–1352 [DOI] [PubMed] [Google Scholar]
- Krzyszton M, Zakrzewska‐Placzek M, Kwasnik A, Dojer N, Karlowski W, Kufel J (2018) Defective XRN3‐mediated transcription termination in Arabidopsis affects the expression of protein‐coding genes. Plant J 93: 1017–1031 [DOI] [PubMed] [Google Scholar]
- Krzyszton M, Yatusevich R, Wrona M, Sacharowski SP, Adamska D, Swiezewski S (2022) Single seeds exhibit transcriptional heterogeneity during secondary dormancy induction. Plant Physiol 190: 211–225 [DOI] [PMC free article] [PubMed] [Google Scholar]
- Leymarie J, Robayo‐Romero ME, Gendreau E, Benech‐Arnold RL, Corbineau F (2008) Involvement of ABA in induction of secondary dormancy in barley (Hordeum vulgare L.) seeds. Plant Cell Physiol 49: 1830–1838 [DOI] [PubMed] [Google Scholar]
- Lloret‐Llinares M, Mapendano CK, Martlev LH, Lykke‐Andersen S, Jensen TH (2016) Relationships between PROMPT and gene expression. RNA Biol 13: 6–14 [DOI] [PMC free article] [PubMed] [Google Scholar]
- Luo Y, Hitz BC, Gabdank I, Hilton JA, Kagda MS, Lam B, Myers Z, Sud P, Jou J, Lin K et al (2020a) New developments on the encyclopedia of DNA elements (ENCODE) data portal. Nucleic Acids Res 48: D882–D889 [DOI] [PMC free article] [PubMed] [Google Scholar]
- Luo Y‐X, Hou X‐M, Zhang C‐J, Tan L‐M, Shao C‐R, Lin R‐N, Su Y‐N, Cai X‐W, Li L, Chen S et al (2020b) Gene Expression Omnibus GSE139460. (https://www.ncbi.nlm.nih.gov/geo/query/acc.cgi?acc=GSE139460). [DATASET]
- Manfre AJ, LaHatte GA, Climer CR, Marcotte WR (2009) Seed dehydration and the establishment of desiccation tolerance during seed maturation is altered in the Arabidopsis thaliana mutant atem6‐1. Plant Cell Physiol 50: 243–253 [DOI] [PubMed] [Google Scholar]
- Marquardt S, Petrillo E, Manavella PA (2022) Cotranscriptional RNA processing and modification in plants. Plant Cell koac309 10.1093/plcell/koac309 [DOI] [PMC free article] [PubMed] [Google Scholar]
- Martens JA, Laprade L, Winston F (2004) Intergenic transcription is required to repress the Saccharomyces cerevisiae SER3 gene. Nature 429: 571–574 [DOI] [PubMed] [Google Scholar]
- Martin M (2011) Cutadapt removes adapter sequences from high‐throughput sequencing reads. EMBnet J 17: 10 [Google Scholar]
- Mueller F, Senecal A, Tantale K, Marie‐Nelly H, Ly N, Collin O, Basyuk E, Bertrand E, Darzacq X, Zimmer C (2013) FISH‐quant: automatic counting of transcripts in 3D FISH images. Nat Methods 10: 277–278 [DOI] [PubMed] [Google Scholar]
- Naftelberg S, Schor IE, Ast G, Kornblihtt AR (2015) Regulation of alternative splicing through coupling with transcription and chromatin structure. Annu Rev Biochem 84: 165–198 [DOI] [PubMed] [Google Scholar]
- Nakabayashi K, Bartsch M, Xiang Y, Miatton E, Pellengahr S, Yano R, Seo M, Soppe WJJ (2012) The time required for dormancy release in Arabidopsis is determined by DELAY OF GERMINATION1 protein levels in freshly harvested seeds. Plant Cell 24: 2826–2838 [DOI] [PMC free article] [PubMed] [Google Scholar]
- Narsai R, Gouil Q, Secco D, Srivastava A, Karpievitch YV, Liew LC, Lister R, Lewsey MG, Whelan J (2017) Extensive transcriptomic and epigenomic remodelling occurs during Arabidopsis thaliana germination. Genome Biol 18: 1–18 [DOI] [PMC free article] [PubMed] [Google Scholar]
- Neugebauer KM (2002) On the importance of being co‐transcriptional. J Cell Sci 115: 3865–3871 [DOI] [PubMed] [Google Scholar]
- Nguyen T, Fischl H, Howe FS, Woloszczuk R, Barros AS, Xu Z, Brown D, Murray SC, Haenni S, Halstead JM et al (2014) Transcription mediated insulation and interference direct gene cluster expression switches. Elife 3: 1–21 [DOI] [PMC free article] [PubMed] [Google Scholar]
- Nielsen M, Ard R, Leng X, Ivanov M, Kindgren P, Pelechano V, Marquardt S (2019) Transcription‐driven chromatin repression of intragenic transcription start sites. PLoS Genet 15: e1007969 [DOI] [PMC free article] [PubMed] [Google Scholar]
- Nissani N, Ulitsky I (2022) Unique features of transcription termination and initiation at closely spaced tandem human genes. Mol Syst Biol 18: e10682 [DOI] [PMC free article] [PubMed] [Google Scholar]
- Oesterreich FC, Herzel L, Straube K, Hujer K, Howard J, Neugebauer KM (2016) Splicing of nascent RNA coincides with intron exit from RNA polymerase II. Cell 165: 372–381 [DOI] [PMC free article] [PubMed] [Google Scholar]
- Park HY, Seok HY, Park BK, Kim SH, Goh CH, Lee BHA, Lee CH, Moon YH (2008) Overexpression of Arabidopsis ZEP enhances tolerance to osmotic stress. Biochem Biophys Res Commun 375: 80–85 [DOI] [PubMed] [Google Scholar]
- Pelechano V, Wei W, Steinmetz LM (2013) Extensive transcriptional heterogeneity revealed by isoform profiling. Nature 497: 127–131 [DOI] [PMC free article] [PubMed] [Google Scholar]
- Piatek A, Ali Z, Baazim H, Li L, Abulfaraj A, Al‐Shareef S, Aouida M, Mahfouz MM (2015) RNA‐guided transcriptional regulation in planta via synthetic dCas9‐based transcription factors. Plant Biotechnol J 13: 578–589 [DOI] [PubMed] [Google Scholar]
- Prudêncio P, Rebelo K, Grosso AR, Martinho RG, Carmo‐Fonseca M (2020) Analysis of mammalian native elongating transcript sequencing (mNET‐seq) high‐throughput data. Methods 178: 89–95 [DOI] [PubMed] [Google Scholar]
- Qi LS, Larson MH, Gilbert LA, Doudna JA, Weissman JS, Arkin AP, Lim WA (2013) Repurposing CRISPR as an RNA‐guided platform for sequence‐specific control of gene expression. Cell 152: 1173–1183 [DOI] [PMC free article] [PubMed] [Google Scholar]
- Quesada V, García‐Martínez S, Piqueras P, Ponce MR, Micol JL (2002) Genetic architecture of NaCl tolerance in Arabidopsis . Plant Physiol 130: 951–963 [DOI] [PMC free article] [PubMed] [Google Scholar]
- Quinlan AR, Hall IM (2010) BEDTools: a flexible suite of utilities for comparing genomic features. Bioinformatics 26: 841–842 [DOI] [PMC free article] [PubMed] [Google Scholar]
- Raj A, Peskin CS, Tranchina D, Vargas DY, Tyagi S (2006) Stochastic mRNA synthesis in mammalian cells. PLoS Biol 4: e309 [DOI] [PMC free article] [PubMed] [Google Scholar]
- Raj A, van den Bogaard P, Rifkin SA, van Oudenaarden A, Tyagi S (2008) Imaging individual mRNA molecules using multiple singly labeled probes. Nat Methods 5: 877–879 [DOI] [PMC free article] [PubMed] [Google Scholar]
- Raudvere U, Kolberg L, Kuzmin I, Arak T, Adler P, Peterson H, Vilo J (2019) G:profiler: a web server for functional enrichment analysis and conversions of gene lists (2019 update). Nucleic Acids Res 47: W191–W198 [DOI] [PMC free article] [PubMed] [Google Scholar]
- Rosa S, Duncan S, Dean C (2016) Mutually exclusive sense–antisense transcription at FLC facilitates environmentally induced gene repression. Nat Commun 7: 1–7 [DOI] [PMC free article] [PubMed] [Google Scholar]
- Saldi T, Cortazar MA, Sheridan RM, Bentley DL (2016) Coupling of RNA polymerase II transcription elongation with pre‐mRNA splicing. J Mol Biol 428: 2623–2635 [DOI] [PMC free article] [PubMed] [Google Scholar]
- Salimullah M, Mizuho S, Plessy C, Carninci P (2011) NanoCAGE: a high‐resolution technique to discover and interrogate cells transcriptome. Cold Spring Harb Protoc 2011: pdb.prot5559 [DOI] [PMC free article] [PubMed] [Google Scholar]
- Schon MA, Kellner MJ, Plotnikova A, Hofmann F, Nodine MD (2018) NanoPARE: parallel analysis of RNA 5′ ends from low‐input RNA. Genome Res 28: 1919–1930 [DOI] [PMC free article] [PubMed] [Google Scholar]
- Shearwin KE, Callen BP, Egan JB (2005) Transcriptional interference – a crash course. Trends Genet 21: 339–345 [DOI] [PMC free article] [PubMed] [Google Scholar]
- Smith T, Heger A, Sudbery I (2017) UMI‐tools: modeling sequencing errors in unique molecular identifiers to improve quantification accuracy. Genome Res 27: 491–499 [DOI] [PMC free article] [PubMed] [Google Scholar]
- Sofroniew N, Lambert T, Evans K, Nunez‐Iglesias J, Bokota G, Winston P, Peña‐Castellanos G, Yamauchi K, Bussonnier M, Doncila Pop D et al (2022) Napari: a multi‐dimensional image viewer for python. Zenodo 10.5281/ZENODO.6598542 [DOI] [Google Scholar]
- Sun L, Song G, Guo W, Wang W, Zhao H, Gao T, Lv Q, Yang X, Xu F, Dong Y et al (2019) Dynamic changes in genome‐wide Histone3 Lysine27 Trimethylation and gene expression of soybean roots in response to salt stress. Front Plant Sci 10: 1031 [DOI] [PMC free article] [PubMed] [Google Scholar]
- Supek F, Bošnjak M, Škunca N, Šmuc T (2011) REVIGO summarizes and visualizes long lists of gene ontology terms. PLoS ONE 6: e21800 [DOI] [PMC free article] [PubMed] [Google Scholar]
- Suter DM, Molina N, Gatfield D, Schneider K, Schibler U, Naef F (2011) Mammalian genes are transcribed with widely different bursting kinetics. Science 332: 472–474 [DOI] [PubMed] [Google Scholar]
- Swiezewski S, Liu F, Magusin A, Dean C (2009) Cold‐induced silencing by long antisense transcripts of an Arabidopsis Polycomb target. Nature 462: 799–802 [DOI] [PubMed] [Google Scholar]
- Thieffry A, Vigh ML, Bornholdt J, Ivanov M, Brodersen P, Sandelin A (2020) Characterization of Arabidopsis thaliana promoter Bidirectionality and antisense RNAs by inactivation of nuclear RNA decay pathways. Plant Cell 32: 1845–1867 [DOI] [PMC free article] [PubMed] [Google Scholar]
- Ungar IA (1978) Halophyte seed germination. Bot Rev 44: 233–264 [Google Scholar]
- Vallejo AJ, Yanovsky MJ, Botto JF (2010) Germination variation in Arabidopsis thaliana accessions under moderate osmotic and salt stresses. Ann Bot 106: 833–842 [DOI] [PMC free article] [PubMed] [Google Scholar]
- van der Heijden T, van Vugt JJFA, Logie C, van Noort J (2012) Sequence‐based prediction of single nucleosome positioning and genome‐wide nucleosome occupancy. Proc Natl Acad Sci USA 109: E2514–E2522 [DOI] [PMC free article] [PubMed] [Google Scholar]
- Vilborg A, Steitz JA (2017) Readthrough transcription: how are DoGs made and what do they do? RNA Biol 14: 632–636 [DOI] [PMC free article] [PubMed] [Google Scholar]
- Vilborg A, Passarelli MC, Yario TA, Tycowski KT, Steitz JA (2015) Widespread inducible transcription downstream of human genes. Mol Cell 59: 449–461 [DOI] [PMC free article] [PubMed] [Google Scholar]
- Villa T, Porrua O, Villa CT, Porrua O (2022) Pervasive transcription: a controlled risk. FEBS J 10.1111/febs.16530 [DOI] [PubMed] [Google Scholar]
- Wang Y, Fang Z, Yang L, Chan Z (2021) Transcriptional variation analysis of Arabidopsis ecotypes in response to drought and salt stresses dissects commonly regulated networks. Physiol Plant 172: 77–90 [DOI] [PubMed] [Google Scholar]
- Waqas M, Korres NE, Khan MD, Nizami A‐S, Deeba F, Ali I, Hussain H (2019) Advances in the concept and methods of seed priming. In Priming and pretreatment of seeds and seedlings, Hasanuzzaman M, Fotopoulos V (eds), pp 11–41. Singapore: Springer; [Google Scholar]
- Warkocki Z, Krawczyk PS, Adamska D, Bijata K, Garcia‐Perez JL, Dziembowski A (2018) Uridylation by TUT4/7 restricts retrotransposition of human LINE‐1 s. Cell 174: 1537–1548 [DOI] [PMC free article] [PubMed] [Google Scholar]
- Williams EJB, Bowles DJ (2004) Coexpression of neighboring genes in the genome of Arabidopsis thaliana . Genome Res 14: 1060–1067 [DOI] [PMC free article] [PubMed] [Google Scholar]
- Xiang Y, Nakabayashi K, Ding J, He F, Bentsink L, Soppe WJJ (2014) REDUCED DORMANCY5 encodes a protein phosphatase 2C that is required for seed DORMANCY in Arabidopsis . Plant Cell 26: 4362–4375 [DOI] [PMC free article] [PubMed] [Google Scholar]
- Yu X, Martin PGP, Michaels SD (2019) BORDER proteins protect expression of neighboring genes by promoting 3′ pol II pausing in plants. Nat Commun 10: 1–15 [DOI] [PMC free article] [PubMed] [Google Scholar]
- Zenklusen D, Larson DR, Singer RH (2008) Single‐RNA counting reveals alternative modes of gene expression in yeast. Nat Struct Mol Biol 15: 1263–1271 [DOI] [PMC free article] [PubMed] [Google Scholar]
- Zhang HX, Blumwald E (2001) Transgenic salt‐tolerant tomato plants accumulate salt in foliage but not in fruit. Nat Biotechnol 19: 765–768 [DOI] [PubMed] [Google Scholar]
- Zhang HX, Hodson JN, Williams JP, Blumwald E (2001) Engineering salt‐tolerant Brassica plants: characterization of yield and seed oil quality in transgenic plants with increased vacuolar sodium accumulation. Proc Natl Acad Sci USA 98: 12832–12836 [DOI] [PMC free article] [PubMed] [Google Scholar]
- Zhao X, Li J, Lian B, Gu H, Li Y, Qi Y (2018) Global identification of Arabidopsis lncRNAs reveals the regulation of MAF4 by a natural antisense RNA. Nat Commun 9: 1–12 [DOI] [PMC free article] [PubMed] [Google Scholar]